NDAQ Breaks Out as Trend and Fundamentals AlignNDAQ is presenting a compelling bullish setup following a breakout within a well-established uptrend. The stock has maintained a strong bullish structure, characterized by consistent higher highs and higher lows, while trading above key moving averages. The orderly alignment of the EMAs further stre
Key facts today
Next report date
—
Report period
—
EPS estimate
—
Revenue estimate
—
3.12 USD
1.79 B USD
8.22 B USD
450.86 M
About Nasdaq, Inc.
Sector
Industry
CEO
Adena T. Friedman
Website
Headquarters
New York
Founded
1971
IPO date
Jul 8, 2002
Identifiers
3
ISIN US6311031081
Nasdaq, Inc. is a holding company, which engages in trading, clearing, exchange technology, regulatory, securities listing, information, and public and private company services. It operates through the following segments: Capital Access Platforms, Financial Technology, and Market Services. The Capital Access Platforms segment delivers liquidity, transparency, and integrity to the corporate issuer and investment community by empowering clients to effectively navigate the capital markets, achieve their sustainability goals, and drive governance excellence. The Financial Technology segment offers platforms that improve the liquidity, transparency, and integrity of the global economy by architecting and operating the markets. The Market Services segment includes equity derivative trading and clearing, cash equity trading, fixed income, currency, and commodities trading. The company was founded by Gordon S. Macklin in 1971 and is headquartered in New York, NY.
Related stocks

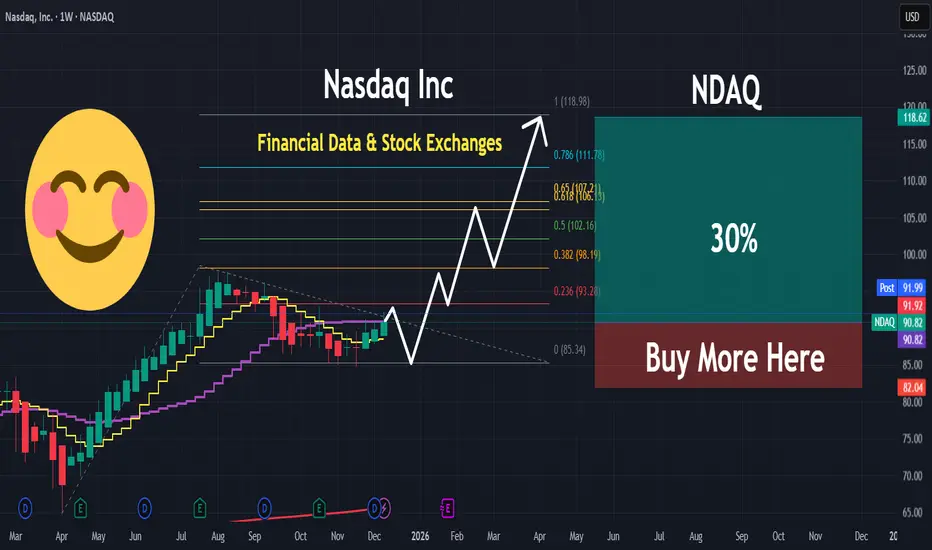
Price is moving inside a well-defined rising channel, confirmingPrice is moving inside a well-defined rising channel, confirming a strong long-term uptrend. The recent pullback held above key support, suggesting wave 4 is completed and wave 5 may be starting.
Entry
• Accumulation on pullbacks around 89–92
• Conservative entry on weekly confirmation above 98

NDAQ : Missed in Upside Rally, If decline we can plan buyUpside 135 Target.
Buy recommended ...
But Entry 76-66..
This is ideal for value of money.
Manage your Risk

NDAQ | Powerful Move Incoming | LONGNasdaq, Inc. is a holding company, which engages in trading, clearing, exchange technology, regulatory, securities listing, information, and public and private company services. It operates through the following segments: Capital Access Platforms, Financial Technology, and Market Services. The Capit
STOCKS Trading at 52 WEEK LOW - WatchlistHello Stonks Watchers 👀📈
Stocks that are hot on my watchlist right now for a possible buy , or a buy soon include:
1️⃣ Merck & Co. (MRK)
NYSE:MRK
Sector: Health Care
Last price: $81.51. 52-week low: $73.31.
% above 52-week low: 11.19%
Analysts are split: several bulls point to Keytruda
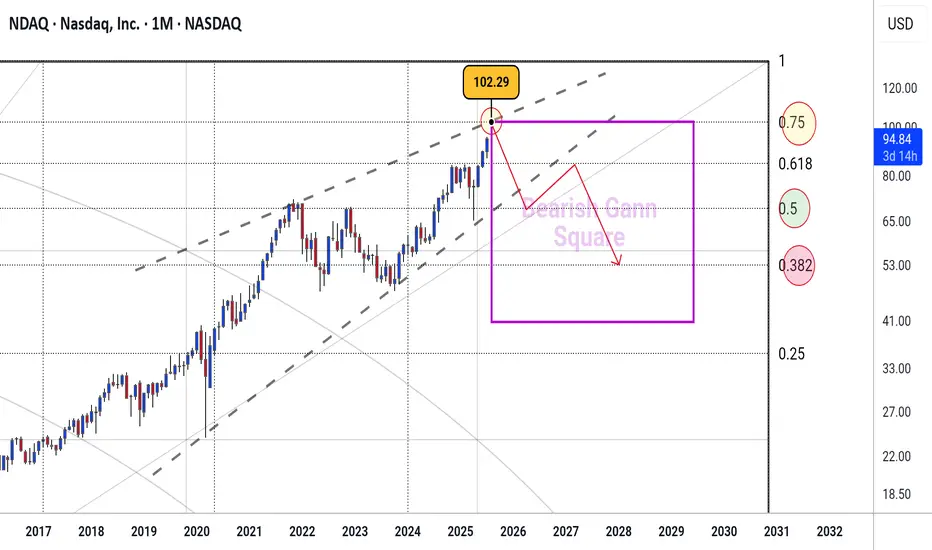
NDAQ #001 ( Say Goodbye to Nasdaq Market !!! ) Hello dear traders.
Good days.
First of all thanks for your comment and support.
------------ ---------------- --------------
Today I want to analysis Nasdaq Market which on monthly Gann Square which is grown up highly close to the 0.75 Monthly Gann Box price level .
I can see sharp rises to fil
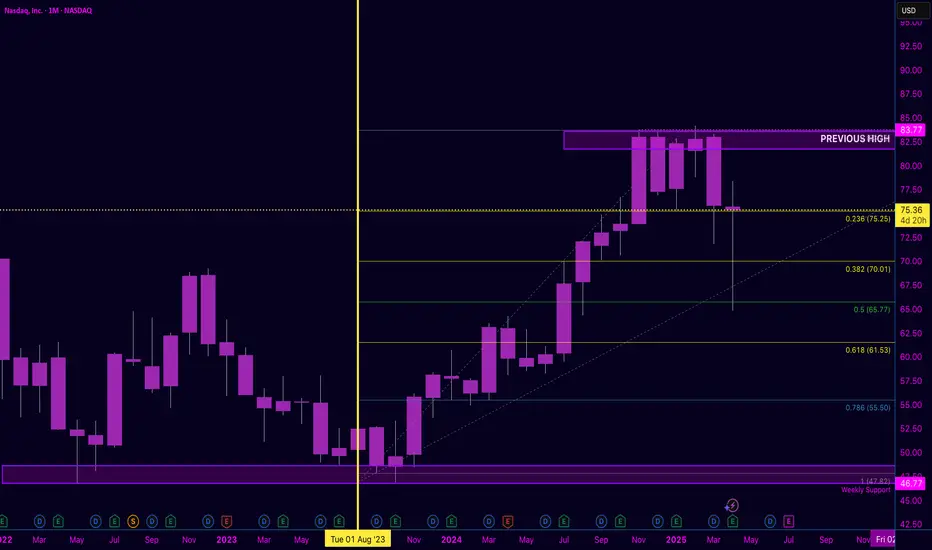
NASDAQ Monthly | Healthy Correction or Trend Shift?
Price has pulled back from the $83.77 previous high, now hovering right on the 0.236 Fib level at $75.25 — a critical area to watch.
🟣 Rejection at the top shows momentum cooling. 🟡 If support fails here, eyes shift to $70.01 (0.382) and possibly $65.77 (0.5) as next key levels.
This move may be

Nasdaq Ready to Fall==>-5%_-10%The Nasdaq Index started to rise with the help of the " Long Island " upward continuation pattern and made the New All-Time High(ATH) .
The Nasdaq Index is currently near the upper line of the Ascending Channel and has succeeded in breaking the Uptrend line .
Also, Regular Divergence (R

Nasdaq & RTX Charts Suggest Promising Growth AheadNASDAQ
After a powerful uptrend, the stock encountered a significant resistance around the 72 level and plummeted sharply thereafter.
Finding stability near the 47 level, the price surged within a Rising Wedge formation.
Typically, following the appearance of this pattern, a decline occurs pos

See all ideas
Summarizing what the indicators are suggesting.
Neutral
SellBuy
Strong sellStrong buy
Strong sellSellNeutralBuyStrong buy
Neutral
SellBuy
Strong sellStrong buy
Strong sellSellNeutralBuyStrong buy
Neutral
SellBuy
Strong sellStrong buy
Strong sellSellNeutralBuyStrong buy
An aggregate view of professional's ratings.
Neutral
SellBuy
Strong sellStrong buy
Strong sellSellNeutralBuyStrong buy
Neutral
SellBuy
Strong sellStrong buy
Strong sellSellNeutralBuyStrong buy
Neutral
SellBuy
Strong sellStrong buy
Strong sellSellNeutralBuyStrong buy
Displays a symbol's price movements over previous years to identify recurring trends.
NDAQ5607193
Nasdaq, Inc. 6.1% 28-JUN-2063Yield to maturity
5.87%
Maturity date
Jun 28, 2063
NDAQ5372971
Nasdaq, Inc. 3.95% 07-MAR-2052Yield to maturity
5.71%
Maturity date
Mar 7, 2052
NDAQ5607192
Nasdaq, Inc. 5.95% 15-AUG-2053Yield to maturity
5.69%
Maturity date
Aug 15, 2053
NDAQ4979763
Nasdaq, Inc. 3.25% 28-APR-2050Yield to maturity
5.62%
Maturity date
Apr 28, 2050
US63111XAE1
Nasdaq, Inc. 2.5% 21-DEC-2040Yield to maturity
5.42%
Maturity date
Dec 21, 2040
US63111XAJ0
Nasdaq, Inc. 5.55% 15-FEB-2034Yield to maturity
4.91%
Maturity date
Feb 15, 2034
US63111XAD3
Nasdaq, Inc. 1.65% 15-JAN-2031Yield to maturity
4.32%
Maturity date
Jan 15, 2031
US63111XAH4
Nasdaq, Inc. 5.35% 28-JUN-2028Yield to maturity
4.11%
Maturity date
Jun 28, 2028
US631103AG34
Nasdaq, Inc. 3.85% 30-JUN-2026Yield to maturity
3.91%
Maturity date
Jun 30, 2026
XS236990664
Nasdaq, Inc. 0.9% 30-JUL-2033Yield to maturity
3.47%
Maturity date
Jul 30, 2033
XS264367395
Nasdaq, Inc. 4.5% 15-FEB-2032Yield to maturity
3.37%
Maturity date
Feb 15, 2032
See all NDAQ bonds
Frequently Asked Questions
The current price of NDAQ is 87.71 USD — it has decreased by −0.08% in the past 24 hours. Watch Nasdaq, Inc. stock price performance more closely on the chart.
Depending on the exchange, the stock ticker may vary. For instance, on NASDAQ exchange Nasdaq, Inc. stocks are traded under the ticker NDAQ.
NDAQ stock has fallen by −1.47% compared to the previous week, the month change is a −0.45% fall, over the last year Nasdaq, Inc. has showed a 7.54% increase.
We've gathered analysts' opinions on Nasdaq, Inc. future price: according to them, NDAQ price has a max estimate of 128.00 USD and a min estimate of 101.00 USD. Watch NDAQ chart and read a more detailed Nasdaq, Inc. stock forecast: see what analysts think of Nasdaq, Inc. and suggest that you do with its stocks.
NDAQ reached its all-time high on Jan 16, 2026 with the price of 101.79 USD, and its all-time low was 1.72 USD and was reached on Apr 15, 2003. View more price dynamics on NDAQ chart.
See other stocks reaching their highest and lowest prices.
See other stocks reaching their highest and lowest prices.
NDAQ stock is 12.31% volatile and has beta coefficient of 0.78. Track Nasdaq, Inc. stock price on the chart and check out the list of the most volatile stocks — is Nasdaq, Inc. there?
Today Nasdaq, Inc. has the market capitalization of 55.28 B, it has increased by 0.04% over the last week.
Yes, you can track Nasdaq, Inc. financials in yearly and quarterly reports right on TradingView.
Nasdaq, Inc. is going to release the next earnings report on Apr 22, 2026. Keep track of upcoming events with our Earnings Calendar.
NDAQ earnings for the last quarter are 0.96 USD per share, whereas the estimation was 0.92 USD resulting in a 4.16% surprise. The estimated earnings for the next quarter are 0.92 USD per share. See more details about Nasdaq, Inc. earnings.
Nasdaq, Inc. revenue for the last quarter amounts to 1.39 B USD, despite the estimated figure of 1.37 B USD. In the next quarter, revenue is expected to reach 1.37 B USD.
NDAQ net income for the last quarter is 519.00 M USD, while the quarter before that showed 423.00 M USD of net income which accounts for 22.70% change. Track more Nasdaq, Inc. financial stats to get the full picture.
Yes, NDAQ dividends are paid quarterly. The last dividend per share was 0.27 USD. As of today, Dividend Yield (TTM)% is 1.08%. Tracking Nasdaq, Inc. dividends might help you take more informed decisions.
Nasdaq, Inc. dividend yield was 1.08% in 2025, and payout ratio reached 33.98%. The year before the numbers were 1.22% and 48.74% correspondingly. See high-dividend stocks and find more opportunities for your portfolio.
EBITDA measures a company's operating performance, its growth signifies an improvement in the efficiency of a company. Nasdaq, Inc. EBITDA is 3.07 B USD, and current EBITDA margin is 37.30%. See more stats in Nasdaq, Inc. financial statements.
Like other stocks, NDAQ shares are traded on stock exchanges, e.g. Nasdaq, Nyse, Euronext, and the easiest way to buy them is through an online stock broker. To do this, you need to open an account and follow a broker's procedures, then start trading. You can trade Nasdaq, Inc. stock right from TradingView charts — choose your broker and connect to your account.
Investing in stocks requires a comprehensive research: you should carefully study all the available data, e.g. company's financials, related news, and its technical analysis. So Nasdaq, Inc. technincal analysis shows the strong sell today, and its 1 week rating is sell. Since market conditions are prone to changes, it's worth looking a bit further into the future — according to the 1 month rating Nasdaq, Inc. stock shows the buy signal. See more of Nasdaq, Inc. technicals for a more comprehensive analysis.
If you're still not sure, try looking for inspiration in our curated watchlists.
If you're still not sure, try looking for inspiration in our curated watchlists.