Bitcoin - Last drop, then a huge pump! (watch this wedge)Bitcoin is currently trading at around 78,000 at the time of writing this article, and I expect the price to go down to 71k - 72k in the short term. Why? As we can see on the chart, there are many reasons why Bitcoin should go down. The first reason is that whales (banks, institutions) still didn't sweep liquidity below the April 2025 swing low. This is a huge point of interest because a lot of retail traders have their stop losses exactly below this swing low. The second reason is that the price should touch the falling wedge's downward-sloping trendline.
I think this is a pretty good opportunity to buy/long Bitcoin at these levels because also the RSI indicator is starting to be oversold. I think we should definitely see a temporary rise to 83k - 84k before eventually going lower. It depends on the falling wedge pattern - will bulls be strong enough to break out of this pattern? We will see, but right now, we want to buy this strong support of 72k!
This is my plan for the next weeks. Right now I expect a drop, but soon we should see a pretty strong rebound. If you watch my previous ideas and you are my follower, you probably know that Bitcoin will go down even lower this year, probably below 60k! So, I am not recommending buying any altcoins whatsoever. We may see some interesting gains in the short term, but in the mid-term altcoins are still bearish. A good opportunity to buy altcoins would be in October 2026, but we still need more data to confirm this bias.
Write a comment with your altcoin + hit the like button, and I will make an analysis for you in response. Trading is not hard if you have a good coach! I am very transparent with my trades. Thank you, and I wish you successful trades!
Community ideas

Gold 30-Min — Volume Buy & Sell Reversal Triggered⚡Base : Hanzo Trading Alpha Algorithm
The algorithm calculates volatility displacement vs liquidity recovery, identifying where probability meets imbalance.
It trades only where precision, volume, and manipulation intersect —only logic.
✈️ Technical Reasons
/ Direction — LONG / Reversal 4355 Area
☄️Bullish momentum confirmed through strong candle body.
☄️Structure shifted with higher-low near key demand base.
☄️Volume expanding confirms order-flow alignment upward.
☄️Buyers reclaimed imbalance with sustained clean break.
☄️Algorithm detects rising momentum under low liquidity.
✈️ Technical Reasons
/ Direction — SHORT / Reversal 4905 Area
☄️Bearish rejection confirmed through sharp candle body.
☄️Lower-high forming beneath resistance supply region.
☄️Volume decreasing confirms exhaustion in price rally.
☄️Sellers regained imbalance with heavy top rejection.
☄️Algorithm detects fading demand and shift to control.
⚙️ Hanzo Alpha Trading Protocol
The Alpha Candle defines the day’s real control zone — the first battle of momentum.
From this origin, the Volume Window reveals where the next precision strike begins.
⚙️ Hanzo Volume Window / Map
Window tracked from 10:30 — mapping true market behavior.
POC alignment exposes institutional bias and breakout potential zones.
⚙️ Hanzo Delta Window / Pulse
Delta window monitors real buying vs. selling power behind each move.
Tracks volume aggression to expose who controls the candle — buyers or sellers.
When Delta aligns with Volume Map, momentum becomes undeniable.

Gold Tests 4400 as Bullish Scenario EmergesGold Tests 4400 as Bullish Scenario Emerges
After taking into account all the confusion created by GOLD on our previous analysis, the chances are that gold may rise from the current zone.
Gold has already tested a very strong support zone dating back to mid-October 2025. It looks like the price has found support near the 4400 level.
The bulls have entered the trade, but it can be also only one big bull... the one who created the Friday sell-off.
If all goes well, there is a good chance that Gold will rise again from the 4400 level.
According to JP Morgan analysts, "J.P. Morgan expects gold prices to reach $6,300 per ounce by the end of 2026, as demand from central banks and investors continues.
This is a bit of a surprise because they also knew that the high should have been at 5600 two weeks ago and it happened at that price.
Let's see what happens this time.
Overall the Geopolitical tension is still high so this can contribute again on this new bullish movement.
It's very risky but gold may unfold as it is showing on the chart if the big sell-off already finished.
You may find more details in the chart.
Thank you and good luck! 🍀
❤️ If this analysis helps your trading day, please support it with a like or comment ❤️
Previous analysis:

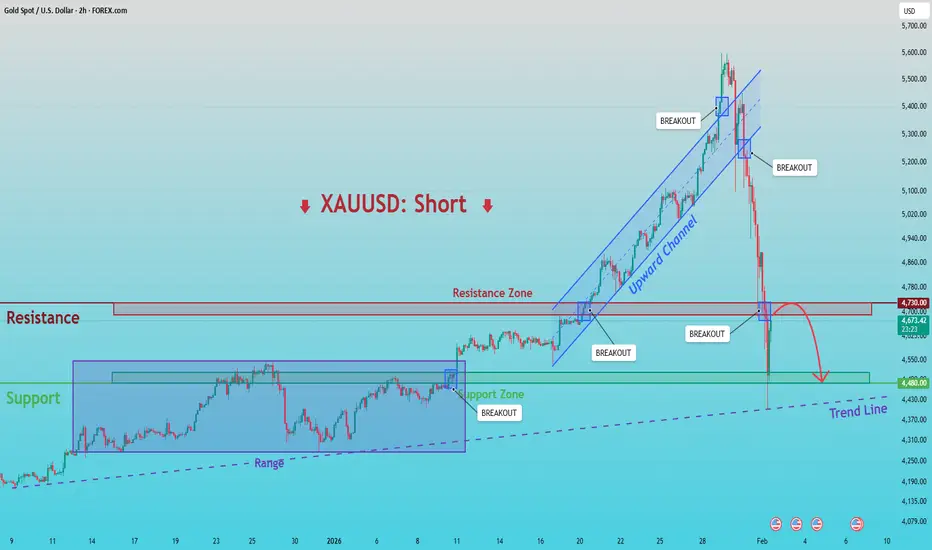
XAUUSD: Below 4,730 Resistance - Targeting 4,480 SupportHello everyone, here is my breakdown of the current XAUUSD setup.
Market Analysis
XAUUSD was previously trading within a clearly defined upward channel, where price respected both the rising support and resistance boundaries, forming a sequence of higher highs and higher lows. This structure confirmed strong bullish control and sustained trend continuation. During this phase, multiple bullish breakouts occurred, each followed by continuation, reinforcing buyer dominance. However, as price reached the upper boundary of the channel near the recent highs, bullish momentum started to fade. The market failed to maintain acceptance at elevated levels, and selling pressure increased sharply.
Currently, gold broke decisively below the lower boundary of the upward channel, marking a clear structural shift. This breakdown was accompanied by strong bearish candles, signaling aggressive seller participation. Price then dropped rapidly into the former Resistance Zone around 4,730, which has now been tested from above and below. The inability to reclaim and hold above this level suggests that previous support has flipped into resistance, reinforcing the bearish bias. Overall, the recent price action points to a trend transition from bullish continuation into a corrective-to-bearish phase.
My Scenario & Strategy
My primary scenario favors a short setup as long as XAUUSD remains below the 4,730 Resistance Zone and continues to show rejection from this area. The current rebound appears corrective in nature, rather than the start of a new bullish leg. As long as price fails to reclaim the broken channel and resistance, I expect selling pressure to resume. The next logical downside target lies near the 4,480 Support Zone, which aligns with previous demand and a rising higher-timeframe trend line, making it a natural area for price to react (TP1).
However, if gold manages to reclaim the 4,730 resistance with strong acceptance and closes back above it, this would weaken the bearish scenario and suggest a deeper recovery or potential range formation. For now, structure favors sellers, with rallies viewed as opportunities for continuation to the downside rather than trend reversal.
That’s the setup I’m tracking. Thank you for your attention, and always manage your risk.
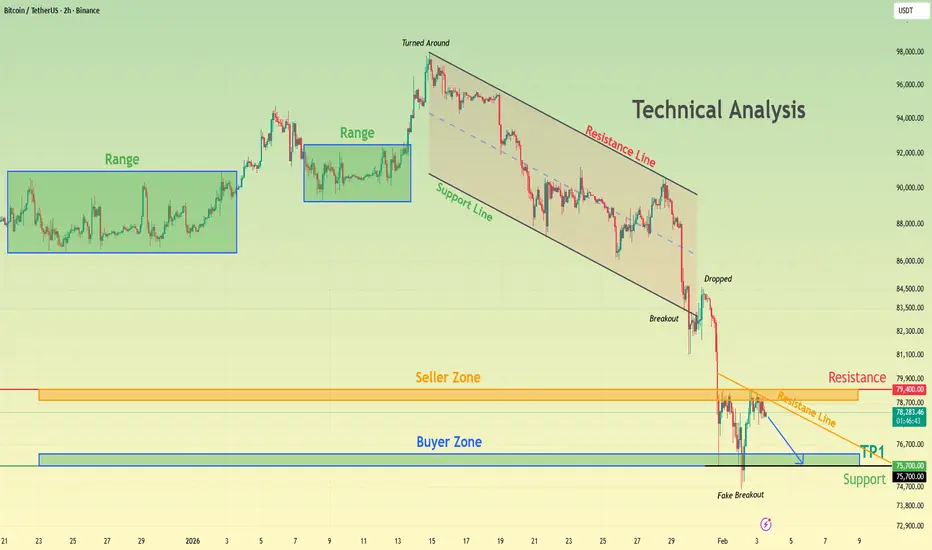
BTCUSDT Bearish Structure Holds - Short From ResistanceHello traders! Here’s my technical outlook on BTCUSDT (2H) based on the current chart structure. Bitcoin initially traded within a clearly defined range, where price moved sideways for an extended period, indicating market equilibrium and accumulation before the next directional move. This ranging phase eventually resolved to the upside, leading to a strong impulsive rally and a short-term bullish continuation. However, after reaching the local top, price turned around and transitioned into a well-structured descending channel, confirming a shift in short-term market control from buyers to sellers. Following the breakdown, Bitcoin dropped sharply into the Seller Zone, where price briefly reacted before continuing lower. The sell-off eventually extended into the major Buyer Zone around 75,700, which aligns with a key horizontal support area and prior demand. Price briefly pierced this level, forming a fake breakout, but quickly recovered back above support — a strong indication that sellers failed to gain acceptance below demand. Currently, BTC is stabilizing above the Buyer Zone and attempting a short-term recovery. This price behavior suggests a corrective rebound rather than a confirmed trend reversal at this stage. Structurally, as long as price holds above the Buyer Zone, a recovery move toward the 78,700–79,400 Resistance / Seller Zone (TP1) remains possible. This area also aligns with a descending resistance line, making it a key level to watch for potential rejection. Rejection from the Resistance / Seller Zone favors continuation to the downside. A move back toward the 75,700 support is the first target, followed by potential extension toward lower demand levels if selling pressure accelerates. Acceptance below the Buyer Zone would confirm bearish continuation and open the door for deeper downside. The bearish scenario remains valid as long as price stays below resistance and fails to reclaim the broken structure. Only a strong breakout and acceptance above the Seller Zone would invalidate the short setup. Until then, BTC remains in a corrective bounce within a broader bearish structure. Please share this idea with your friends and click Boost 🚀
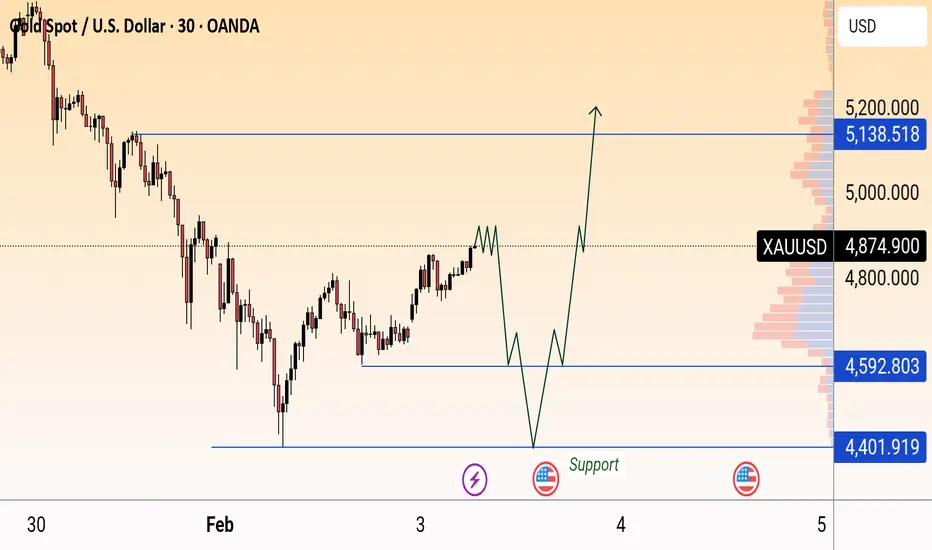
GoldGold is currently consolidating after a strong bullish move. Price is holding above the key support zone around 4,590–4,600, indicating buyers are still active. The structure suggests a possible pullback into support, followed by a bullish continuation.
If price respects the support area, we may see a strong push toward the 4,880–5,140 resistance zone. A clean break and hold above current highs will confirm further upside momentum. However, a breakdown below support could open the door for a deeper retracement toward 4,400.
Bias: Bullish above support
Key Support: 4,590 – 4,400
Key Resistance/Target: 4,880 → 5,140
XAUUSDHello Traders! 👋
What are your thoughts on GOLD?
Gold printed a new all-time high before facing a sharp bearish rejection from the highlighted resistance zone. Following this strong sell-off, price dropped aggressively toward the 4400 support area, where buyers stepped in and prevented further downside.
After reacting positively to this key support, Gold rebounded and is now trading around the 4900 level. Based on the current price structure and Fibonacci retracement levels, we expect this recovery to extend toward the upper resistance zone near the 0.618 Fibonacci level.
However, this resistance area is considered a high-probability rejection zone, and from there, a bearish reaction could occur, potentially pushing price back toward the trendline support and lower Fibonacci targets.
Don’t forget to like and share your thoughts in the comments! ❤️

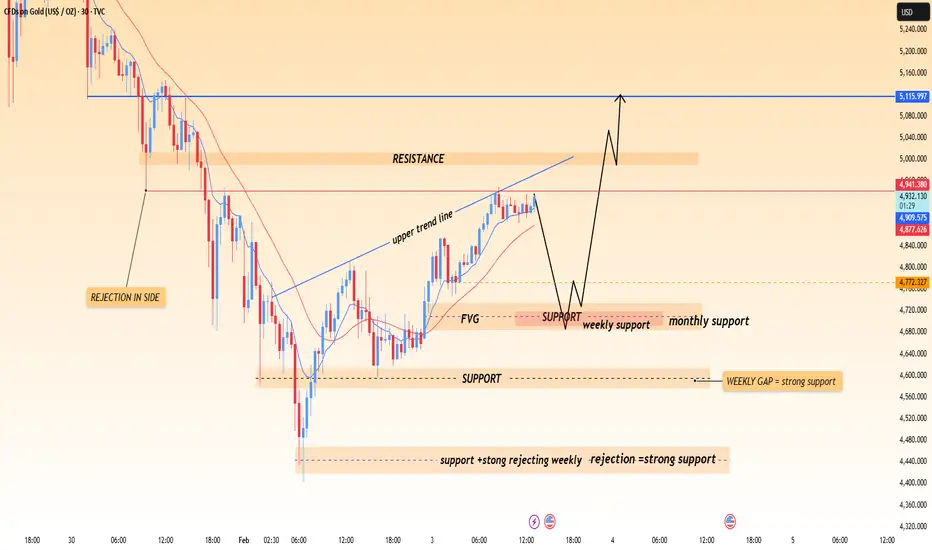
XAUUSD – Support Hold & Trendline Breakout SetupGold is forming a bullish corrective structure after a strong rejection from weekly & monthly support, with price holding above the FVG and demand zone. As long as support remains intact, a break above the upper trendline and resistance can open the path toward the next upside target, while failure to hold support may lead to another retest of the demand area.
Bias stays bullish above support, confirmation required on clean resistance breakout with candle close.
Bitcoin Holds Heavy Support — Bullish Flag Signals Next ImpulseAs I expected in my previous idea , Bitcoin( BINANCE:BTCUSDT ) reached its targets and rose as anticipated.
Currently, Bitcoin is moving within the heavy support zone($78,260-$70,080).
From a classical technical analysis standpoint, on the 15-minute timeframe, Bitcoin seems to be forming a bullish flag pattern, which is a good sign for continued short-term upside.
From an Elliott Wave perspective, it appears Bitcoin is completing a Double Three Correction(WXY) on the 15-minute timeframe. We should expect the start of a 5-wave impulsive move next.
I expect Bitcoin to continue upward in the next few hours, at least toward the Cumulative Short Liquidation Leverage($80,100-$79,450) and possibly fill parts of the upper CME Gap($84,560-$79,660).
What’s your view on Bitcoin’s direction, at least for the next couple of days? I’d love to hear your thoughts!
First Target: Cumulative Short Liquidation Leverage($80,100-$79,450)
Second Target: $80,971
Stop Loss(SL): $76,281
Points may shift as the market evolves
Cumulative Short Liquidation Leverage: $86,170-$84,760
Cumulative Long Liquidation Leverage: $77,460-$76,600
Cumulative Long Liquidation Leverage: $75,000-$74,000
💡 Please respect each other's opinions and express agreement or disagreement politely.
📌Bitcoin Analysis (BTCUSDT), 15-minute time frame.
🛑 Always set a Stop Loss(SL) for every position you open.
✅ This is just my idea; I’d love to see your thoughts too!
🔥 If you find it helpful, please BOOST this post and share it with your friends.

Hellena | GOLD (4H): LONG to 4800 area.Colleagues, the situation with gold is very complicated. The latest strong and deep correction suggests that these movements are movements in higher-order waves, which should have formed later.
But we have what we have, and I believe that wave “III” of the highest order is complete, which explains such a deep correction in wave “IV.”
However, this marking does not contradict my desire to look for long positions. I think it is worth continuing to watch the upward movement, but it is not worth making long-term plans and working with immediate goals.
I believe that the price will recover to at least the 4800 area, as this is a fairly important round level.
In other words, I expect the start of movement in wave “5” of the highest order.
Manage your capital correctly and competently! Only enter trades based on reliable patterns!

EURUSD Bulls Take Control - 1.1940 as Next TestHello traders! Here’s my technical outlook on EURUSD (3H) based on the current chart structure. EURUSD previously traded within a well-defined ascending channel, where price consistently respected both the rising support line and the channel resistance, confirming steady bullish control and healthy trend conditions. During this phase, the market printed higher highs and higher lows, showing strong buyer dominance. However, after reaching the upper boundary of the channel, bullish momentum began to weaken, and price transitioned into a corrective phase. This correction unfolded gradually, signaling profit-taking rather than an immediate trend reversal. Following the pullback, EURUSD formed a rising triangle structure supported by a clear ascending support line. Price then broke impulsively to the upside, signaling a structural shift and renewed buying interest. This breakout pushed price above the Buyer Zone around 1.1860, confirming acceptance above previous resistance turned support. The bullish impulse extended into the Seller / Resistance Zone near 1.1940, where price is currently reacting. At this level, sellers have started to show interest again, and price is consolidating below the resistance, indicating hesitation and potential short-term exhaustion after the strong rally. Structurally, the Buyer Zone around 1.1840–1.1860 now acts as a key support area. As long as price holds above this zone and respects the rising triangle support line, the broader bullish structure remains intact. A sustained hold above support favors a continuation move toward the 1.1940 Resistance Level, which stands as the primary upside target (TP1). This level also represents a critical decision zone where either continuation or rejection is likely to occur. My scenario: holding above the Buyer Zone keeps the bullish continuation scenario valid, with a potential retest of the 1.1940 Resistance Level. A clean breakout and acceptance above this resistance would open the door for further upside expansion. However, a strong rejection from resistance followed by a breakdown below the Buyer Zone would invalidate the bullish bias and signal a deeper corrective move. For now, EURUSD is trading at a key structural area, with buyers attempting to defend support and push price higher. Please share this idea with your friends and click Boost 🚀

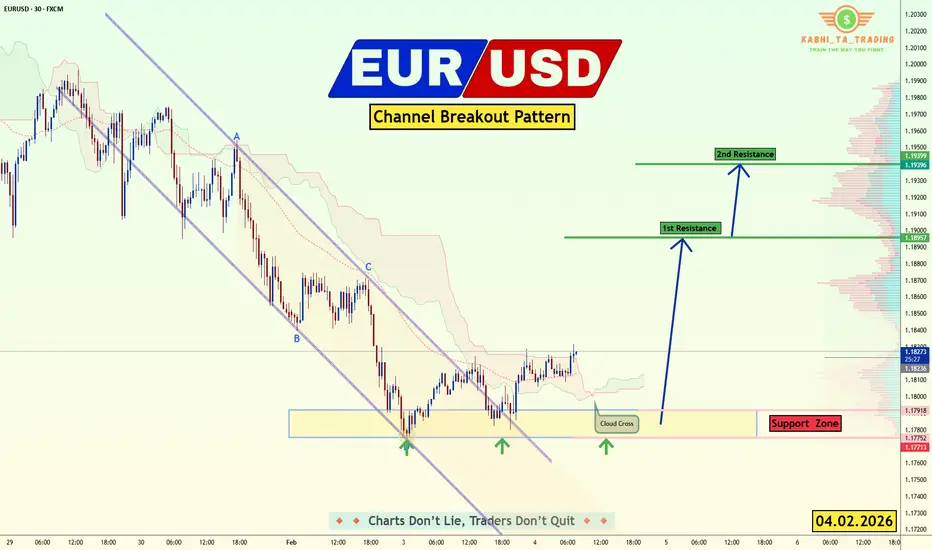
EUR/USD - Upside Expansion Next? (04.02.2026)📝 Description🔍 Setup FX:EURUSD
EUR/USD has been trading inside a descending channel and recently showed signs of structure shift after breaking and retesting the channel boundary.
Price reacted multiple times from the demand/support zone, forming higher lows.
Ichimoku shows a cloud cross and improving momentum, hinting at potential upside continuation.
This suggests sellers are weakening while buyers gradually gain control.
📍 Support & Resistance
🟥 Support Zone: 1.1790 – 1.1770
🟩 1st Resistance: 1.1895
🟩 2nd Resistance: 1.1940
⚠️ Disclaimer
This idea is for educational purposes only.
Forex trading involves risk. Always manage your risk and follow your own plan.
💬 Support the Idea 👍 Like if you see bullish continuation
💬 🔁 Share with fellow EUR/USD traders
#EURUSD #Forex #PriceAction #ChannelBreakout #BullishSetup #TradingView #SupportResistance #IntradayTrading #Kabhi_TATrading
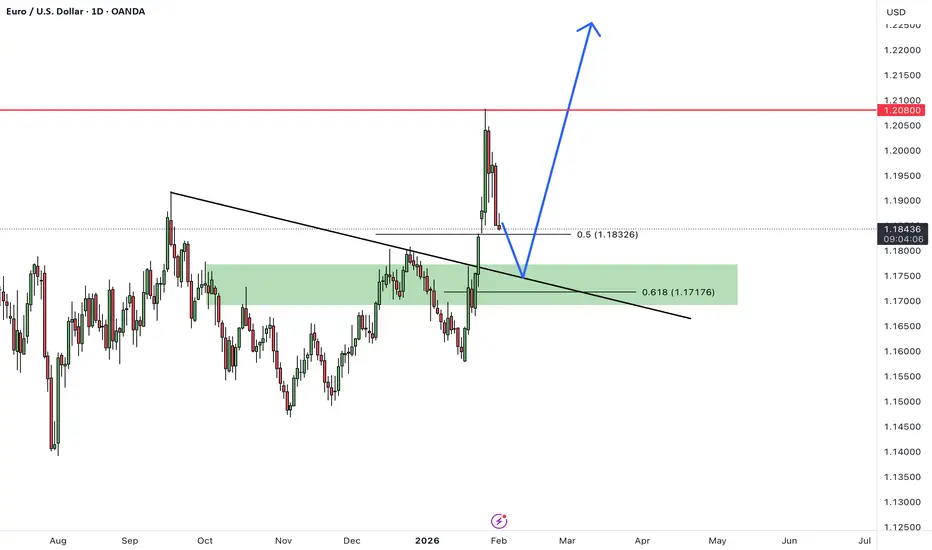
EURUSDHello Traders! 👋
What are your thoughts on EURUSD?
EUR/USD successfully broke above the key resistance zone and the descending trendline, extending its bullish move toward the 1.1200 area. From this level, the pair entered a corrective phase.
This pullback is considered a healthy correction and a pullback to the previously broken resistance, which now acts as support. As long as price holds above this zone, we expect buyers to step back in and push the pair toward higher levels.
Overall outlook remains bullish, and the current correction could offer a favorable opportunity for trend continuation.
Don’t forget to like and share your thoughts in the comments! ❤️
Lingrid | GOLD Correction Ends - Bullish Move Ahead ?OANDA:XAUUSD reacted aggressively from the resistance zone near the recent peak, but the sell-off appears corrective rather than trend-breaking. Price swept liquidity below the rising structure, tagged the higher-timeframe support zone, and quickly rebounded — a sequence that often signals exhaustion on the downside. Importantly, the broader ascending trendline remains intact, keeping the higher-low framework alive.
If price continues to stabilize above the 4,800 support area, upside pressure could rebuild toward the 5,200 level, where previous balance and unfilled liquidity sit. The sharp drop may have served as a reset, allowing momentum to reload rather than reverse.
➡️ Primary scenario: hold above 4,790 → recovery toward 5,200
⚠️ Risk scenario: sustained acceptance below 4,720 could open the door for a deeper structural pullback
If this idea resonates with you or you have your own opinion, traders, hit the comments. I’m excited to read your thoughts!

The "US Bitcoin Reserve" is a Lie. (A Macro Deep Dive)While Retail is chasing headlines about a "Strategic Bitcoin Reserve," Smart Money is aggressively de-risking. Why? Because the "News" is a linguistic misunderstanding, and the "Macro" just turned violently bearish.
If you are buying this dip because you think the US Government is about to print trillions to buy Bitcoin, you are walking into a trap. Today, we are going to deconstruct the three pillars of this bearish thesis: The "Project Vault" Deception, The Kevin Warsh Pivot, and the Technical Reality of DXY and ETHUSD .
__________________________________________________________________________________
1. The "Project Vault" Deception (Fact Check) 🕵️♂️
The entire bullish narrative right now hangs on the rumor that the administration's "$12 Billion Project Vault" is a secret plan to accumulate Bitcoin.
This is false.
I dug into the executive details. "Project Vault" is indeed a strategic reserve, but not for Crypto. It is a stockpile for Critical Minerals ,specifically Gallium, Cobalt, and Lithium—to secure the US defense supply chain against China.
• Retail hears: "Vault" = Cold Storage for BTC.
• Reality: "Vault" = Warehouses for EV Batteries and Fighter Jet components.
• The Takeaway: The market is pricing in a massive liquidity injection for Crypto that simply does not exist. When this realization hits the masses, the repricing will be severe.
__________________________________________________________________________________
2. The Macro Villain: Kevin Warsh 🦅
While everyone watches the "Reserve" headlines, they are ignoring the single most important variable: The Federal Reserve.
The new nominee for Fed Chair, Kevin Warsh , is the ultimate Hawk.
• History: He resigned from the Fed in 2011 specifically because he opposed Quantitative Easing (QE).
• Philosophy: He believes in a "Smaller Fed," "Positive Real Rates," and a "Strong Dollar."
• The Impact: Warsh is the anti-thesis to the "Money Printer Go Brrr" narrative. His nomination is a signal that the era of easy liquidity is ending. This is a Liquidity Withdrawal Event , and risk assets like BTCUSD are the first to suffer.
__________________________________________________________________________________
3. The Technical Truth: DXY & ETH 📉
The charts are confirming the Macro view perfectly. The "Smart Money" is already positioning for a liquidity crunch.
A) The DXY (US Dollar Index) Squeeze
The Dollar is waking up.
• Price Action: DXY is compressing tight at 26.9950 , sitting exactly at the confluence of the EMA50 and EMA200 . This is a massive decision point.
• Momentum: Stochastic is overbought (95.3), BUT ADX is at 52.2 . This tells us the trend strength is real.
• The Trigger: A 4H close above 27.09 (Upper Bollinger Band) triggers a breakout. If the Dollar flies, Crypto dies. It’s that simple.
B) Ethereum (The Canary in the Coal Mine)
If the "US Reserve" story were real, insiders would be front-running it on ETHUSD . Instead, ETH is lifeless.
• Structure: We have confirmed a CHoCH Bearish . Price is trading below every major Moving Average (20, 50, 200).
• The Trap: RSI is oversold (25.1), but ADX is 53.0 . Do not mistake "Oversold" for "Reversal." High ADX + Low RSI = A strong, relentless downtrend.
• Volume: We are trading at 39% below average volume . There is ZERO institutional support at these levels. The "Smart Money" has left the building.
__________________________________________________________________________________
4. The Operational Risk (The "John Lick" Scandal) 🚨
Finally, for those who believe the US Government is competent enough to manage a trillion-dollar Bitcoin reserve, look at the news from last week. A government contractor’s son was caught draining US-seized wallets on Telegram to flex wealth.
The Reality: The US Government cannot even secure the Bitcoin it already has. The idea that they are about to execute a sophisticated sovereign accumulation strategy is a fantasy.
__________________________________________________________________________________
🎯 The Verdict & Strategy
The "Strategic Reserve" narrative marked the top. The "Kevin Warsh" reality will drive the trend.
• The Trade: I am fading this narrative entirely.
• Invalidation: A DXY breakdown below 26.41 or an ETH reclaim of 3,403 (Bearish Order Block).
• Target: As long as DXY holds above the EMA200, I am targeting a flush on BTCUSD to 70k and ETH to 2,224 .
Do not trade the Headlines. Trade the Liquidity.
Do you trust the "US Reserve" hype?
A) Yes, HODL for nation-state adoption 🇺🇸
B) No, the chart is broken 📉
Vote A or B below! 👇

GOLD Price Update – Clean & Clear ExplanationGold is showing early signs of recovery after a strong bearish move, but the price is still trading below a major descending trendline, which remains a key resistance.
The broader structure is still bearish, as price continues to respect the downward sloping trendline from previous highs. However, recent price action shows higher lows, suggesting short-term bullish momentum is building.
A clean breakout and close above the descending trendline could trigger a strong upside move toward 5,050 / 5,200 Rejection from the trendline may lead to a pullback toward 4,845 and possibly 4,730 Gold is at a critical breakout zone. Momentum is improving, but confirmation is needed. Traders should watch for price reaction at the trendline before committing to direction.
“If you come across this post, please like, comment, and share. Thanks!”

GOLD - Correction from 4945 before continuing growthFX:XAUUSD continues to recover, but at the same time faces strong interim resistance at 4945. What to expect next?
Gold is recovering after a sharp correction, taking advantage of the weakening dollar amid the US government shutdown: The delay in important data (employment report) is creating uncertainty about Fed policy, putting pressure on the dollar. However, de-escalation with Iran and the deal with India have improved sentiment but limited demand for gold as a safe haven.
The recovery looks like a technical correction on temporary dollar weakness rather than a trend reversal. Further dynamics depend on the development of the shutdown situation and the tone of the Fed.
Technically, gold may form a pullback before rising, or close within the range of 4950-4750 to accumulate potential before further movement.
Resistance levels: 4884, 4944, 5100
Support levels: 4812, 4755, 4696
The first test of resistance at 4944 ended in a false breakout. During the European session, the market may enter a correction phase and test the zone of interest (ascending support line) at 4812-4755 before continuing to rise. The local bullish trend and the relatively weak dollar may support gold's growth.
Best regards, R. Linda!

Gold Price Analysis – Key Resistance, Support Levels, and PotentThis chart provides an in-depth analysis of gold prices, highlighting critical resistance and support zones. The Sell Zone at 5,438.172 represents a key resistance level where price may face rejection, offering a potential sell opportunity if the level holds. The Support Zone at 4,933.394 is expected to hold or bounce, while Major Support at 4,773.917 is a critical level for potential reversal. Key Support Level at 4,614.223 offers a strong buying opportunity if price holds. The Final Target is set at 4,504.227 if the support fails, with Bottom Support at 4,463.452 marking a potential significant reversal point

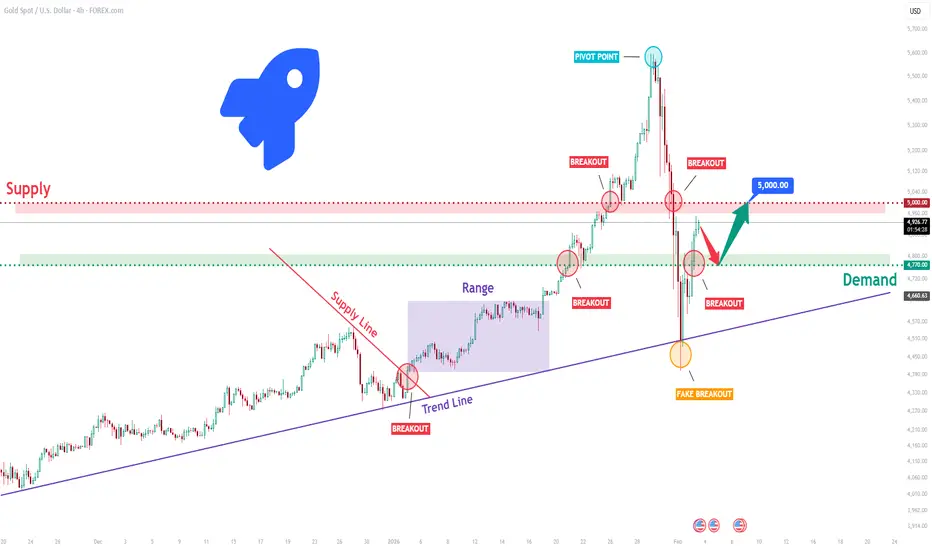
XAUUSD Long: After Fake Breakdown - $5,000 Back in SightHello traders! Here’s a clear technical breakdown of XAUUSD (4H) based on the current chart structure. Gold has been trading within a well-defined bullish environment for an extended period, supported by a rising trend line that guided price action higher. During this phase, price consistently printed higher highs and higher lows, confirming strong buyer control. After breaking above a descending supply line, XAUUSD entered a consolidation phase, forming a clear range before eventually expanding to the upside. This expansion resulted in multiple bullish breakouts, culminating in a strong impulsive rally toward the 5,000 psychological level, where price reached a major pivot point and bullish momentum began to exhaust.
Currently, XAUUSD is consolidating above the Demand Zone around 4,770, indicating stabilization after the sharp correction. This area aligns with previous breakout structure and acts as a critical decision zone. As long as price holds above this demand, the broader bullish structure remains valid despite the recent volatility. The current rebound appears corrective, suggesting the market may be building strength for the next directional move rather than entering a sustained bearish trend.
My primary scenario favors a bullish continuation as long as XAUUSD remains above the 4,770 Demand Zone and continues to show acceptance above the reclaimed structure. A successful hold in this area could allow price to gradually rotate higher, targeting a retest of the 5,000 Supply Zone as the next upside objective. This level remains a major barrier, and a clean breakout with strong acceptance above 5,000 would open the door for further bullish expansion. Alternatively, a decisive breakdown and acceptance below the 4,770 Demand Zone would invalidate the bullish continuation scenario and signal a deeper corrective move toward the rising higher-timeframe trend line. For now, structure slightly favors buyers, with the demand zone acting as the key battlefield. Manage your risk!
DAX Weekly CLS Range Model 1 - TP GAPHi friends, new weekly range created. As always we are looking for the manipulation in to the key level around the range. Don't forget confirmation switch from manipulation phase to the distribution phase to make the setup valid. Stay patient and enter only after change in order flow. If price reaches 50% of the range take partial.
👊 Trade Visual I promised myself I’d become the person I once needed the most as a beginner. Below are links to a powerful lessons I shared on Tradingview. Hope it can help you avoid years of trial and error I went thru.
📊 Sharpen your trading Strategy
⚙️ 100% Mechanical System - Complete Strategy
🔁 Daily Bias – Continuation
🔄 Daily Bias – Reversal
🧱 Key Level – Order Block
📉 How to Buy Lows and Sell Highs
🎯 Dealing Range – Enter on pullbacks
💧 Liquidity – Basics to understand
🕒 Timeframe Alignments
🚫 Market Narratives – Avoid traps
🐢 Turtle Soup Master – High reward method
🧘 How to stop overcomplicating trading
🕰️ Day Trading Cheat Code – Sessions
🇬🇧 London Session Trading
🔍 SMT Divergence – Secret Smart Money signal
📐 Standard Deviations – Predict future targets
🎣 Stop Hunt Trading
💧 Liquidity Sweep Mastery
🔪 Asia Session Setups
📀 Gold Strategy
🧠 Level Up & Mindset
🛕 Monk Mode – Transition from 9–5 to full-time trading
⚠️ Trading Enemies – Habits that destroy success
🔄 Trader’s Routine – Build discipline daily
💪 Get Funded - $20 000 Monthly Plan
🧪 Winning Trading Plan
⭕ Backtesting vs Reality
🛡️ Risk Management
🏦 Risk Management for Prop Trading
📏 Risk in % or Fixed Position Size
🔐 Risk Per Trade – Keep consistency
🧪 Risk Reward vs Win Ratio
💎 Catch High Risk Reward Setups
☯️ Smart Money - Who control Markets
Adapt useful, Reject useless and add what is specifically yours.
David Perk

Gold Breaks Its Trend – Sellers Take ControlAfter a sharp rally to record highs, XAUUSD has officially entered a structural weakening phase , no longer just a normal corrective pullback. Pressure from a stronger USD, expectations that the Fed will maintain a hawkish stance, and aggressive profit-taking in the derivatives marke t have all combined to drain gold of its short-term bullish momentum.
On the chart, the downtrend is becoming increasingly clear . Price has been rejected repeatedly at higher resistance zones, forming a sequence of lower highs, while the descending trendline continues to act as a key ceiling. The fact that price is trading below the Ichimoku cloud signals that sellers are firmly in control of the short- to medium-term trend.
The current rebound toward 4,850 is purely technical in nature. If price fails to break above this area and gets rejected again, selling pressure is likely to resume . In that case, the 4,350 zone becomes the next logical target, where the market may pause and react.
Overall, both the news backdrop and price structure are aligned to the downside . In this environment, the more appropriate strategy is to prioritize trend-following trades, patiently waiting for pullbacks to look for sell opportunities, rather than trying to catch a falling knife while sellers remain dominant.

Gold H1: Distribution Phase After Break of StructureThis is a 1-hour (H1) XAUUSD (Gold vs USD) chart showing a clear market structure shift from accumulation to distribution, then into a strong bearish trend.
Key phases visible:
Range / Accumulation (Left side)
Price moves sideways inside a marked range, indicating consolidation and liquidity building.
Break of Structure (BoS)
Price breaks above the range high, signaling bullish intent and triggering a markup phase.
Trend Exhaustion & Reversal
After the strong bullish impulse, price forms a top and begins respecting a descending channel, showing a transition into bearish control.
Bearish Impulse (Markdown Phase)
Strong, consecutive bearish candles push price lower, confirming trend continuation to the downside.
Pullback into Rejection Zone
Price retraces into a marked supply / rejection zone (aligned with Ichimoku cloud resistance), suggesting institutional selling pressure.
Target Projection
A downside target is marked near prior lows / demand zone, implying a continuation short setup after rejection.

February Alts Market RequestFebruary Altcoin Analysis Request – Limited Slots ⚠️
February will be treated with a potential bear market mindset. Expect selective, risk-aware analysis only, focused on structure, downside protection, and realistic scenarios, not hype.
🔹 Only 20 altcoins will be analyzed for February
🔹 First come, first served, once slots are filled, requests close
🔹 Priority will be given to clean structure and liquidity relevance
🔹 This is analysis only, not financial advice
If you have an altcoin request, drop the ticker below.
Once 20 valid requests are received, no further submissions will be accepted.
Discipline matters most in bear conditions. Choose wisely.
