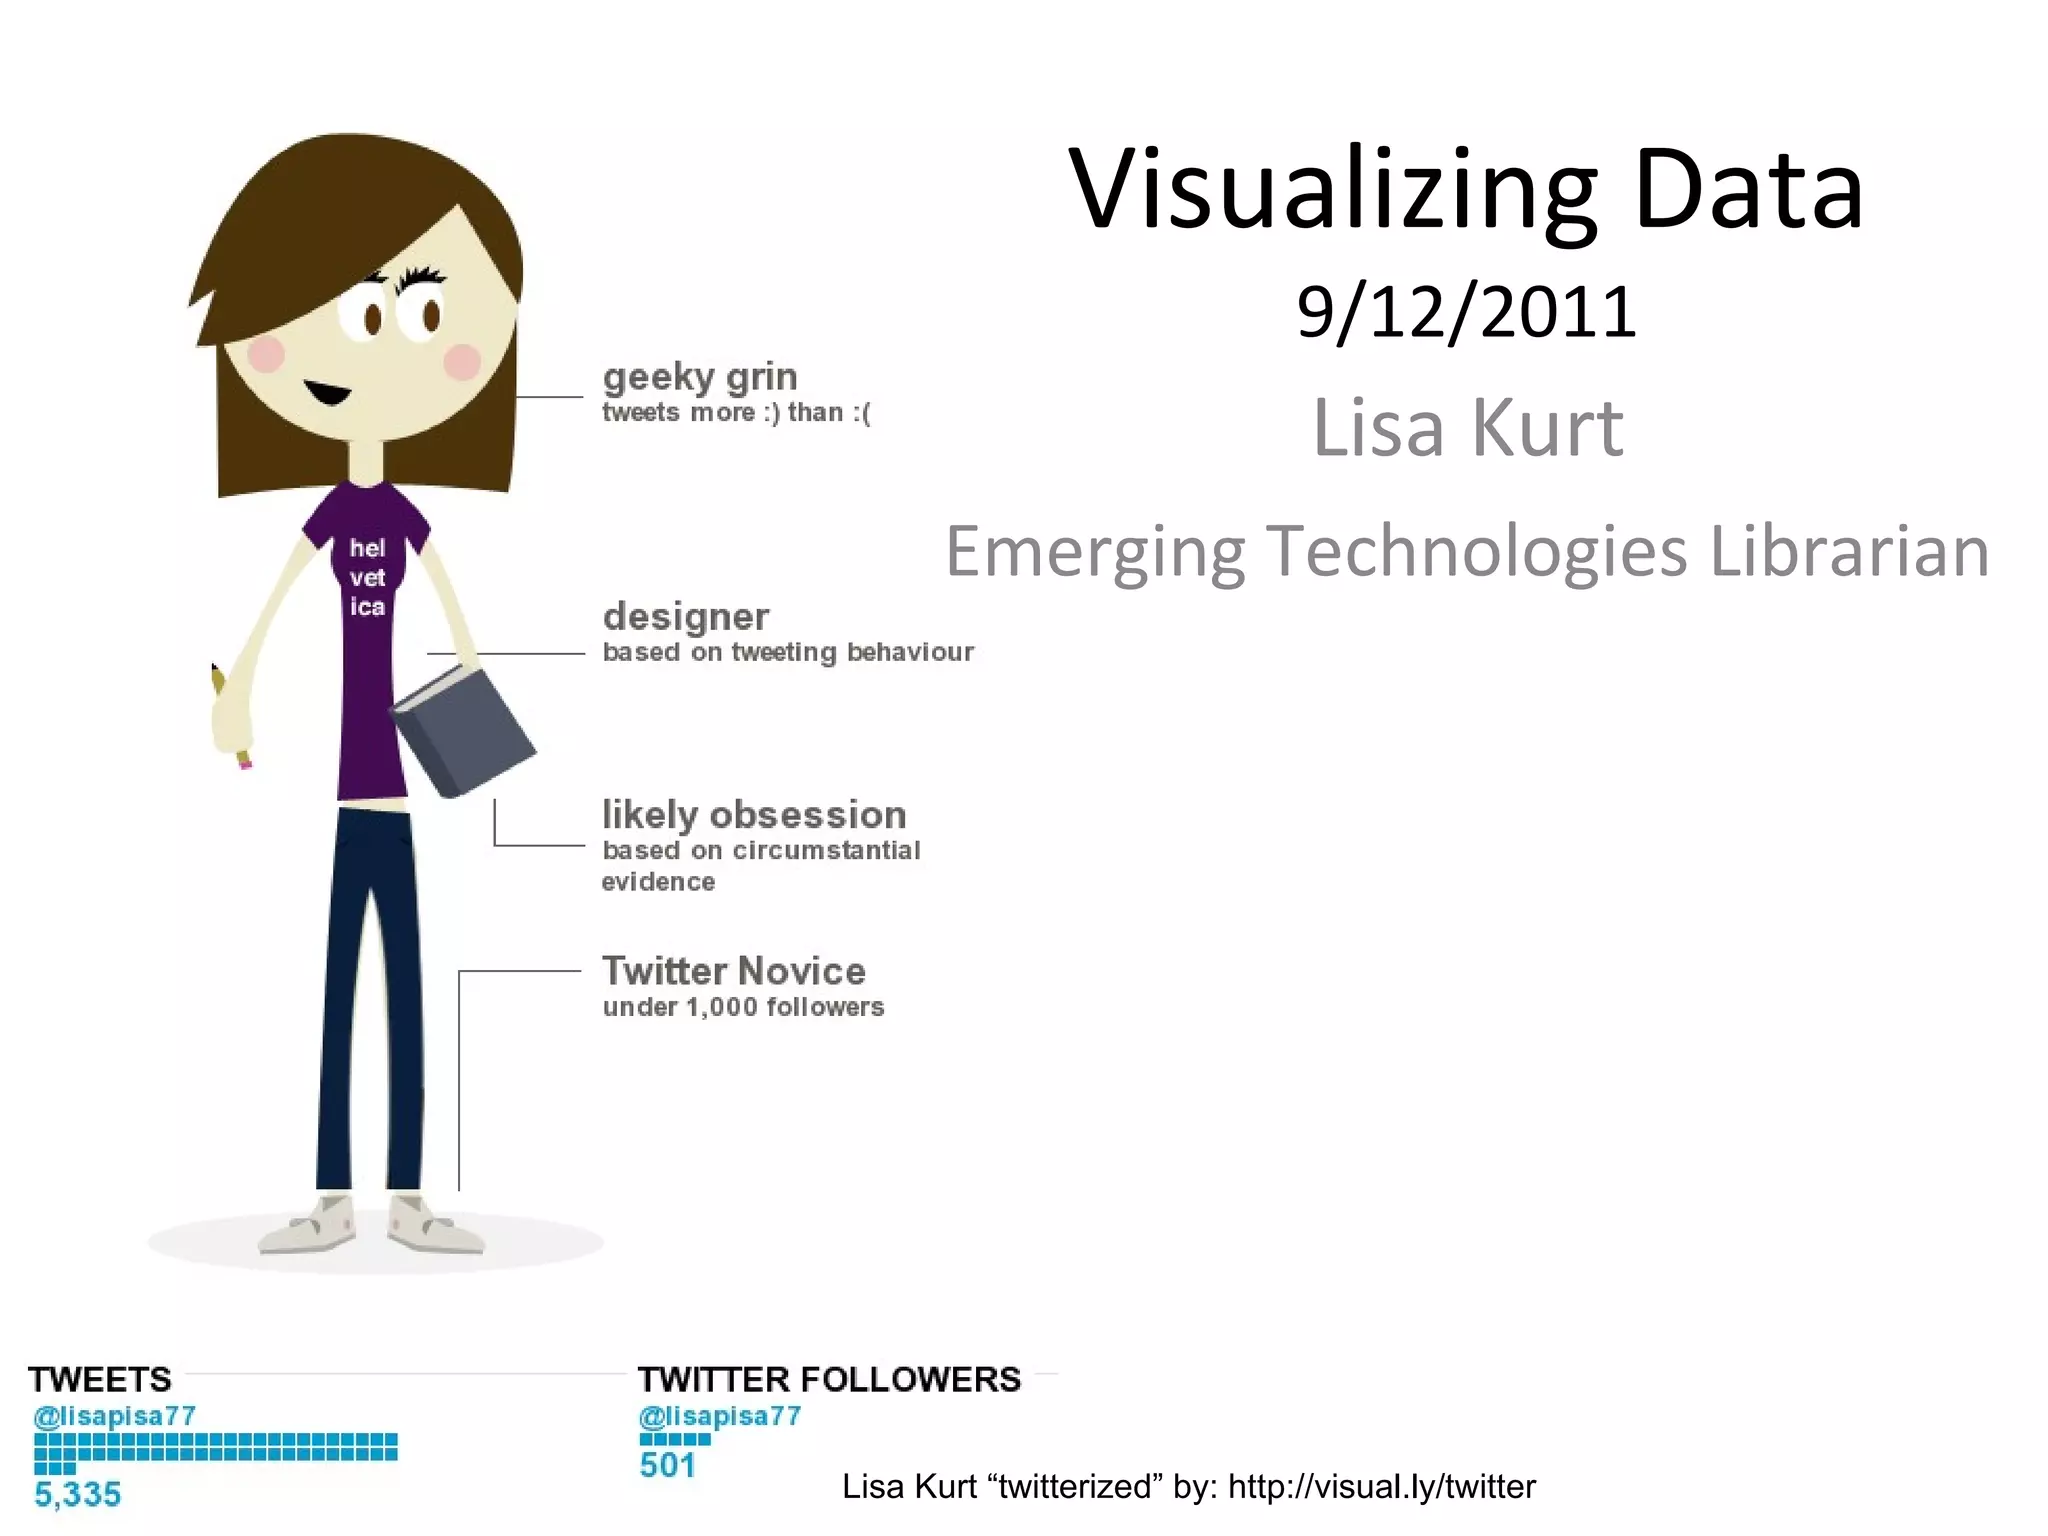
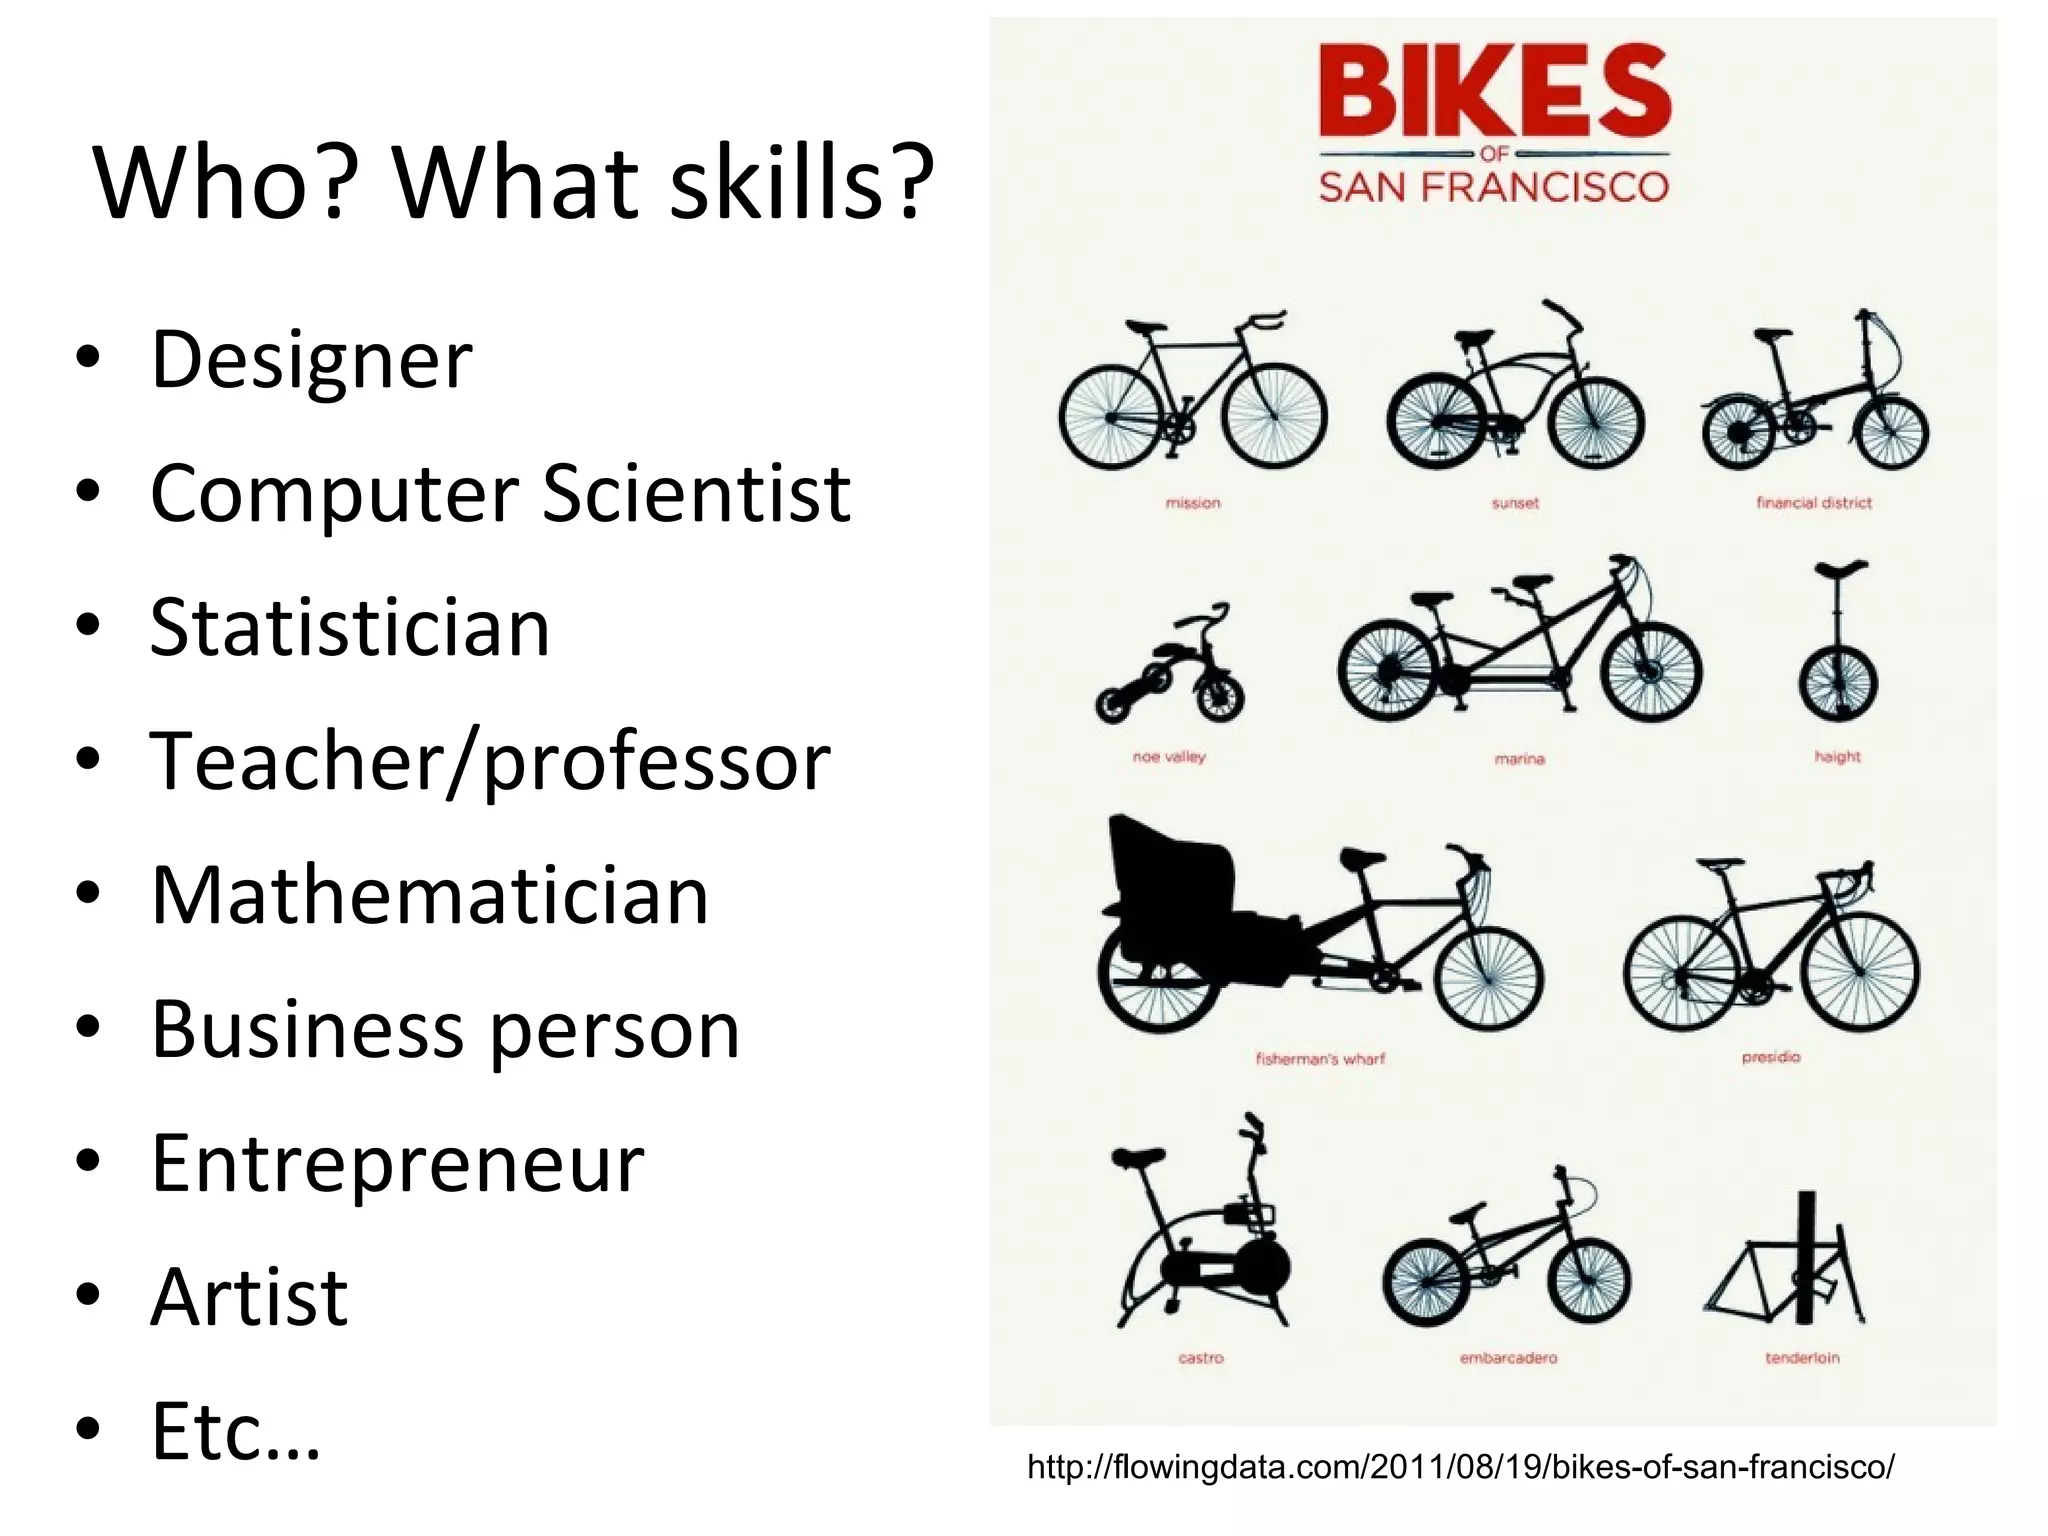
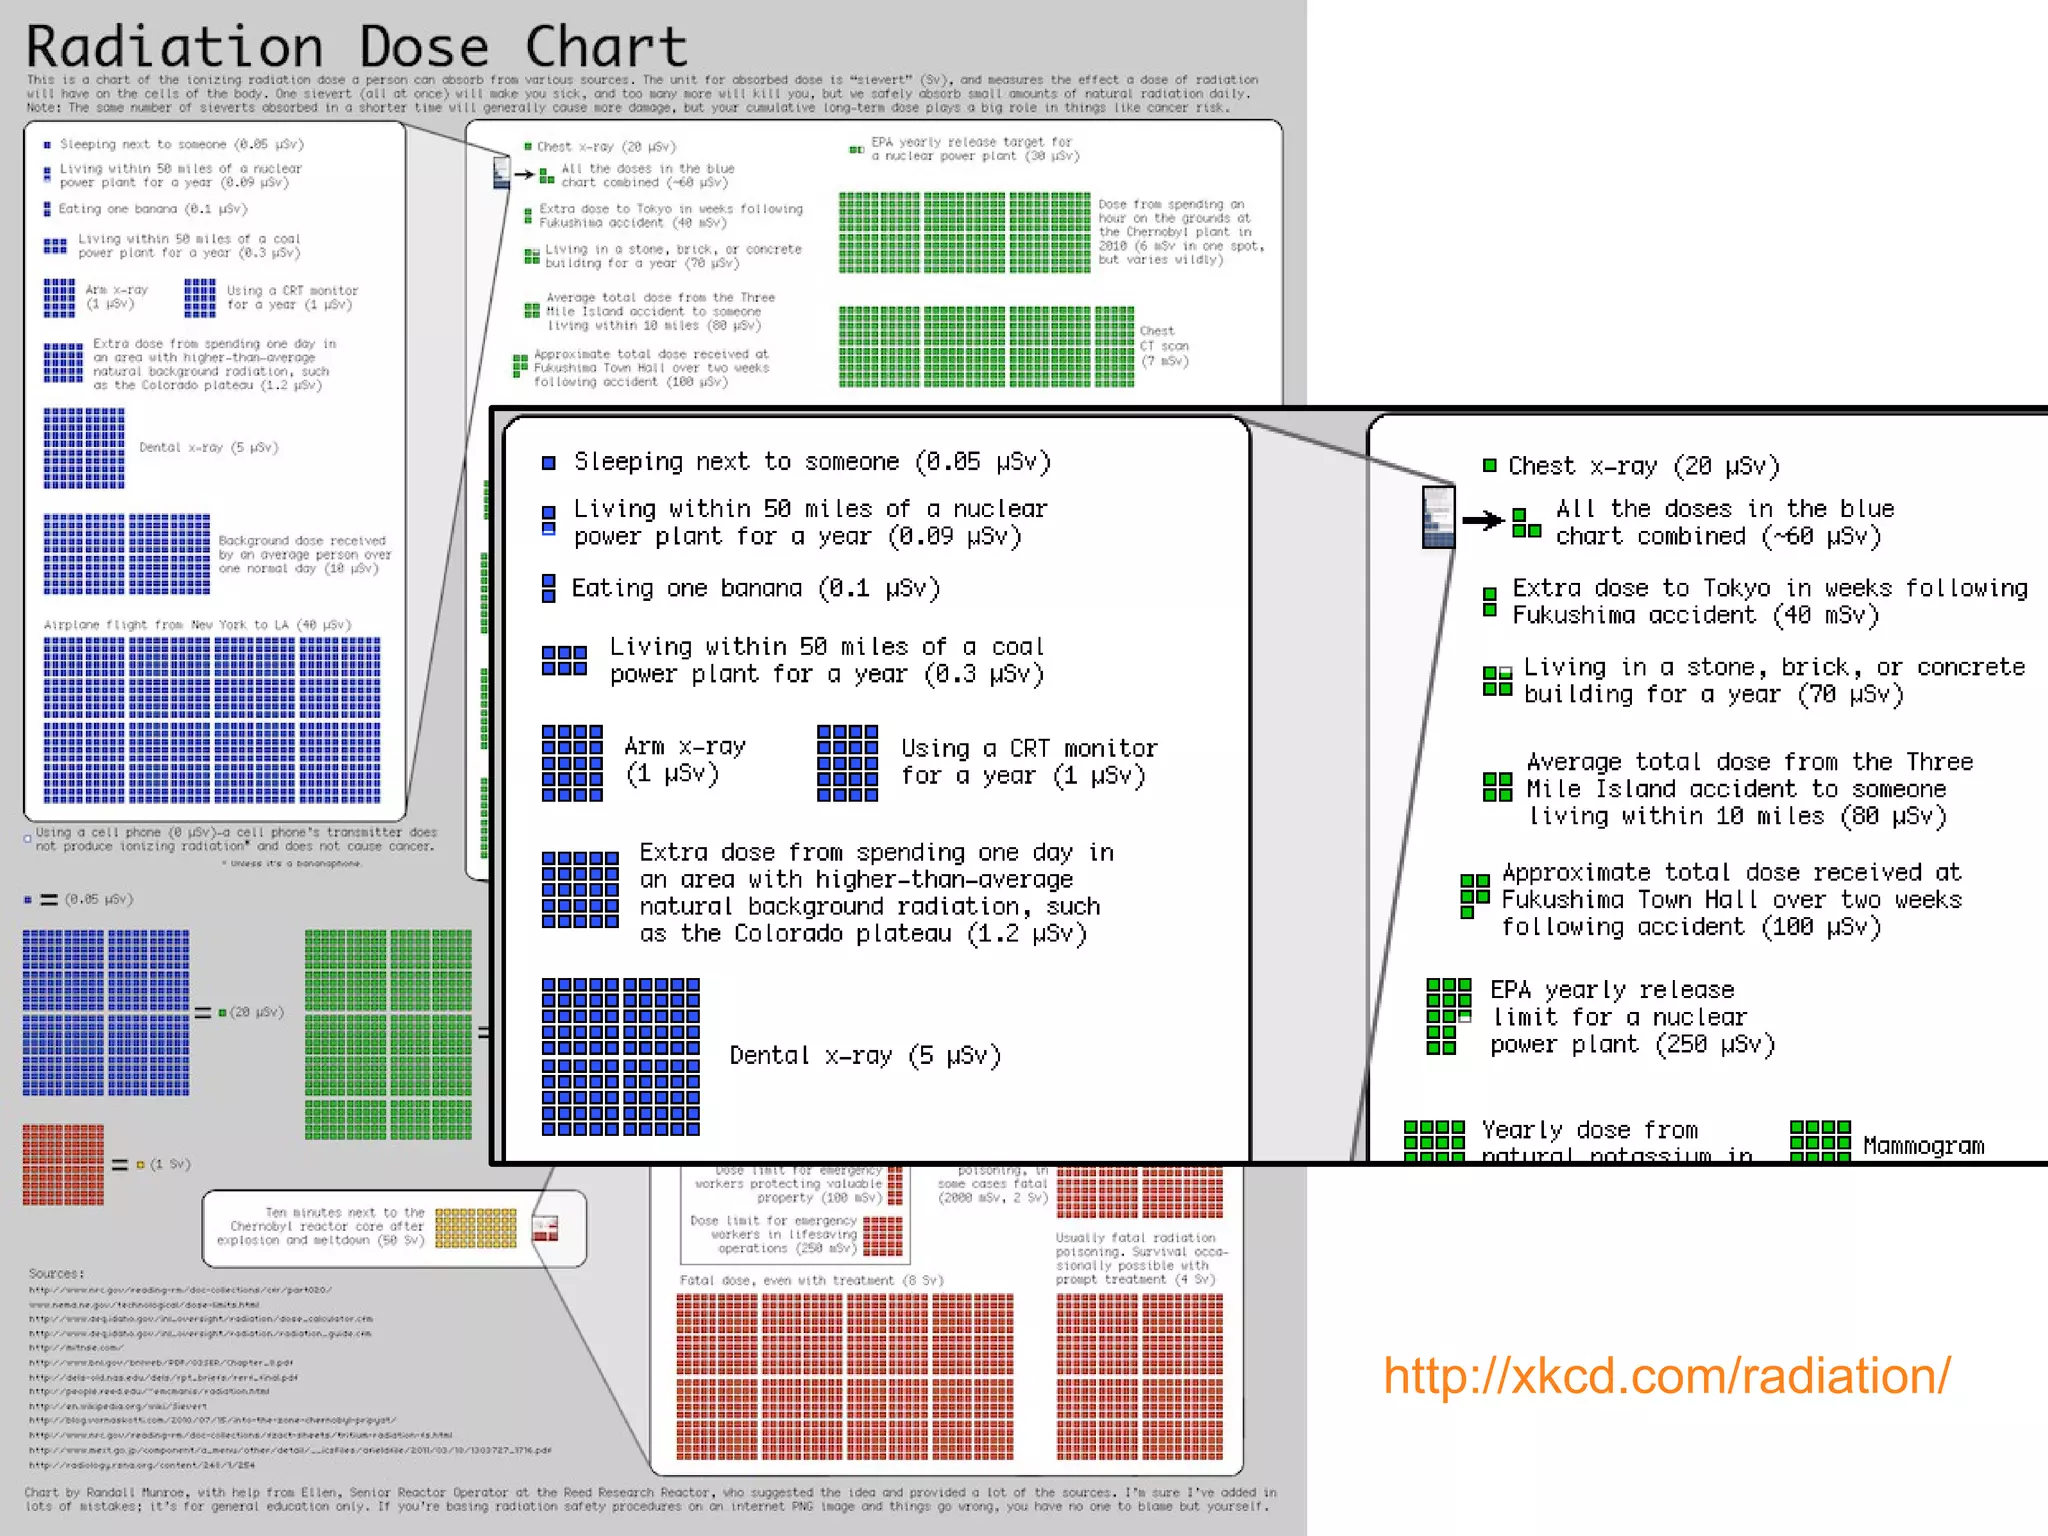
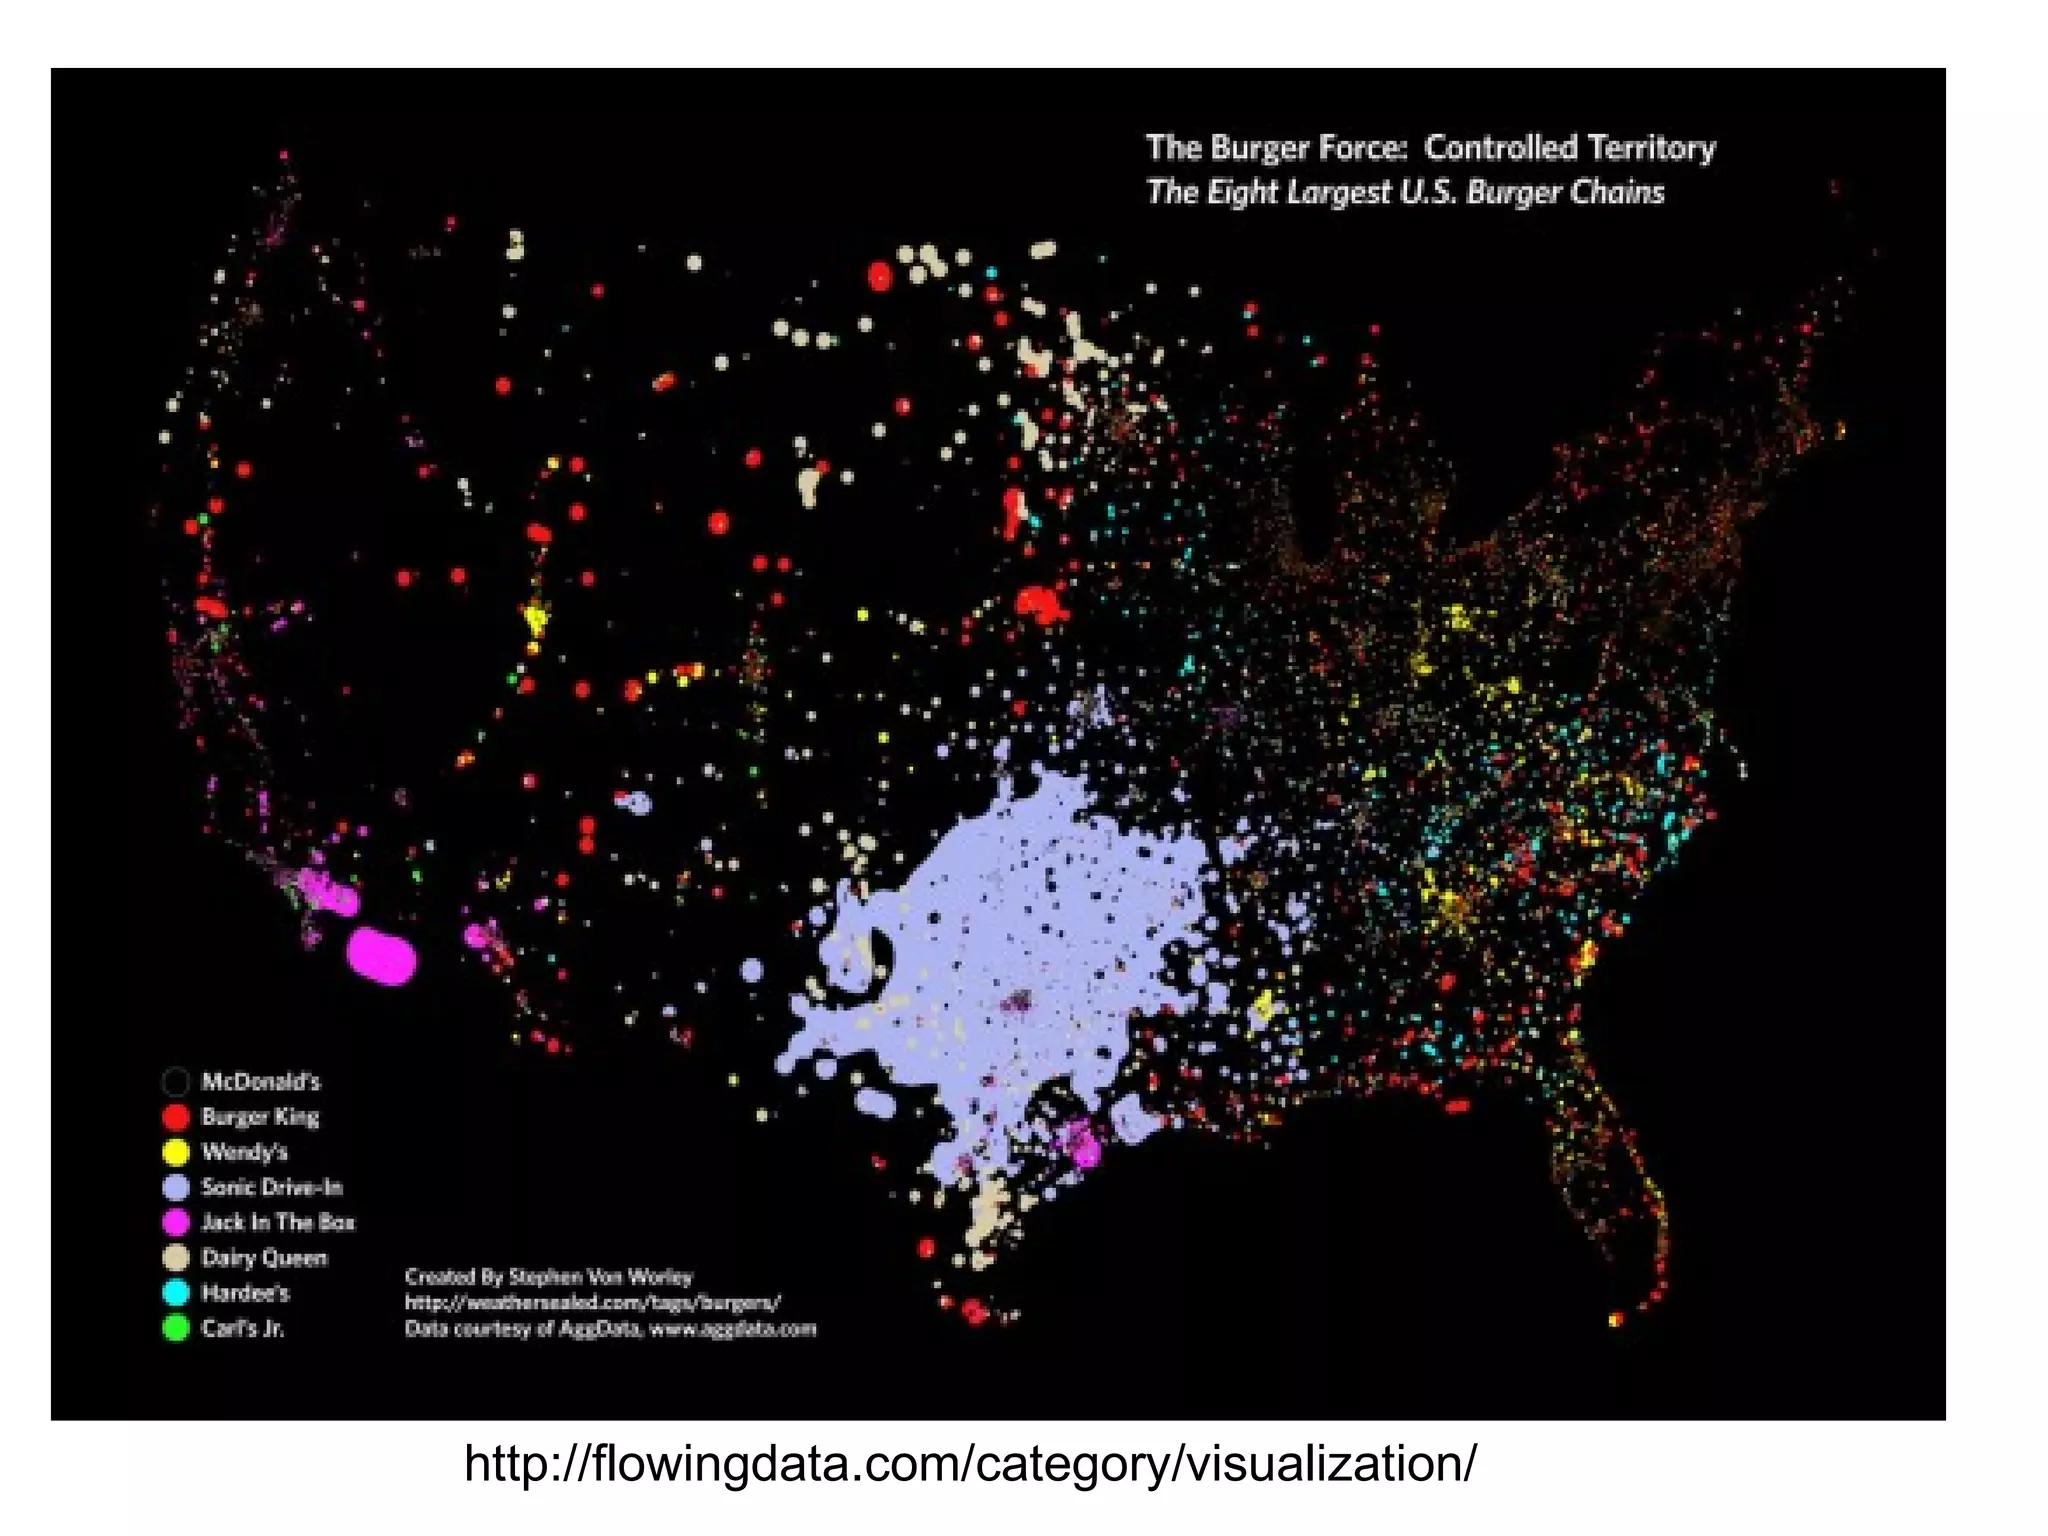
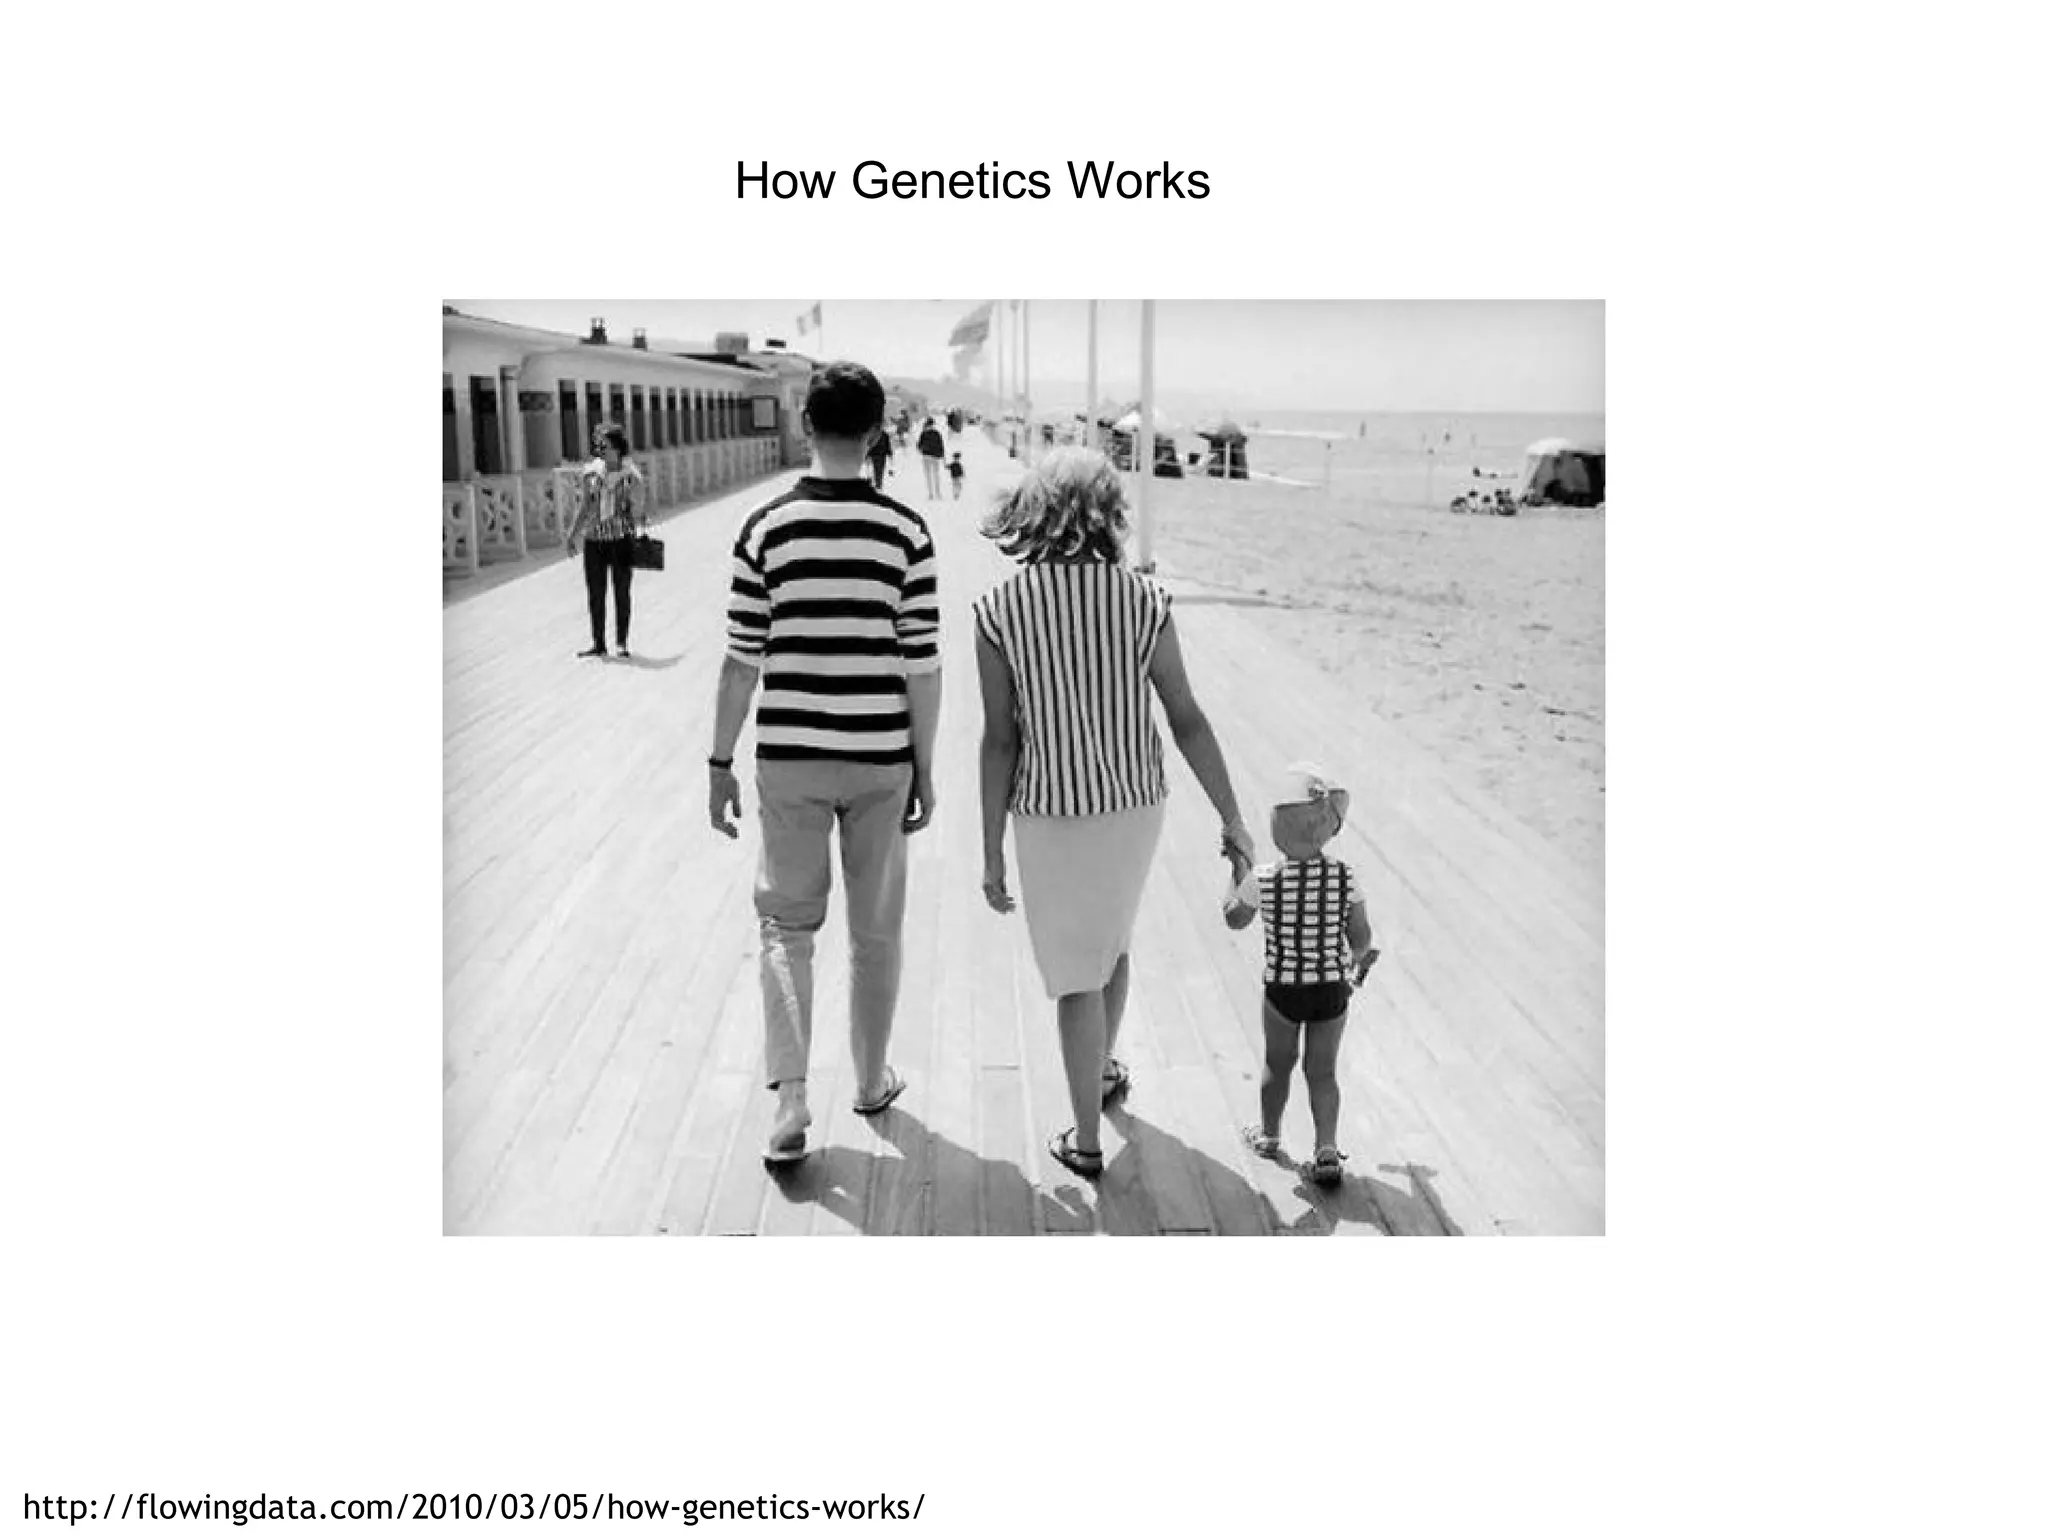
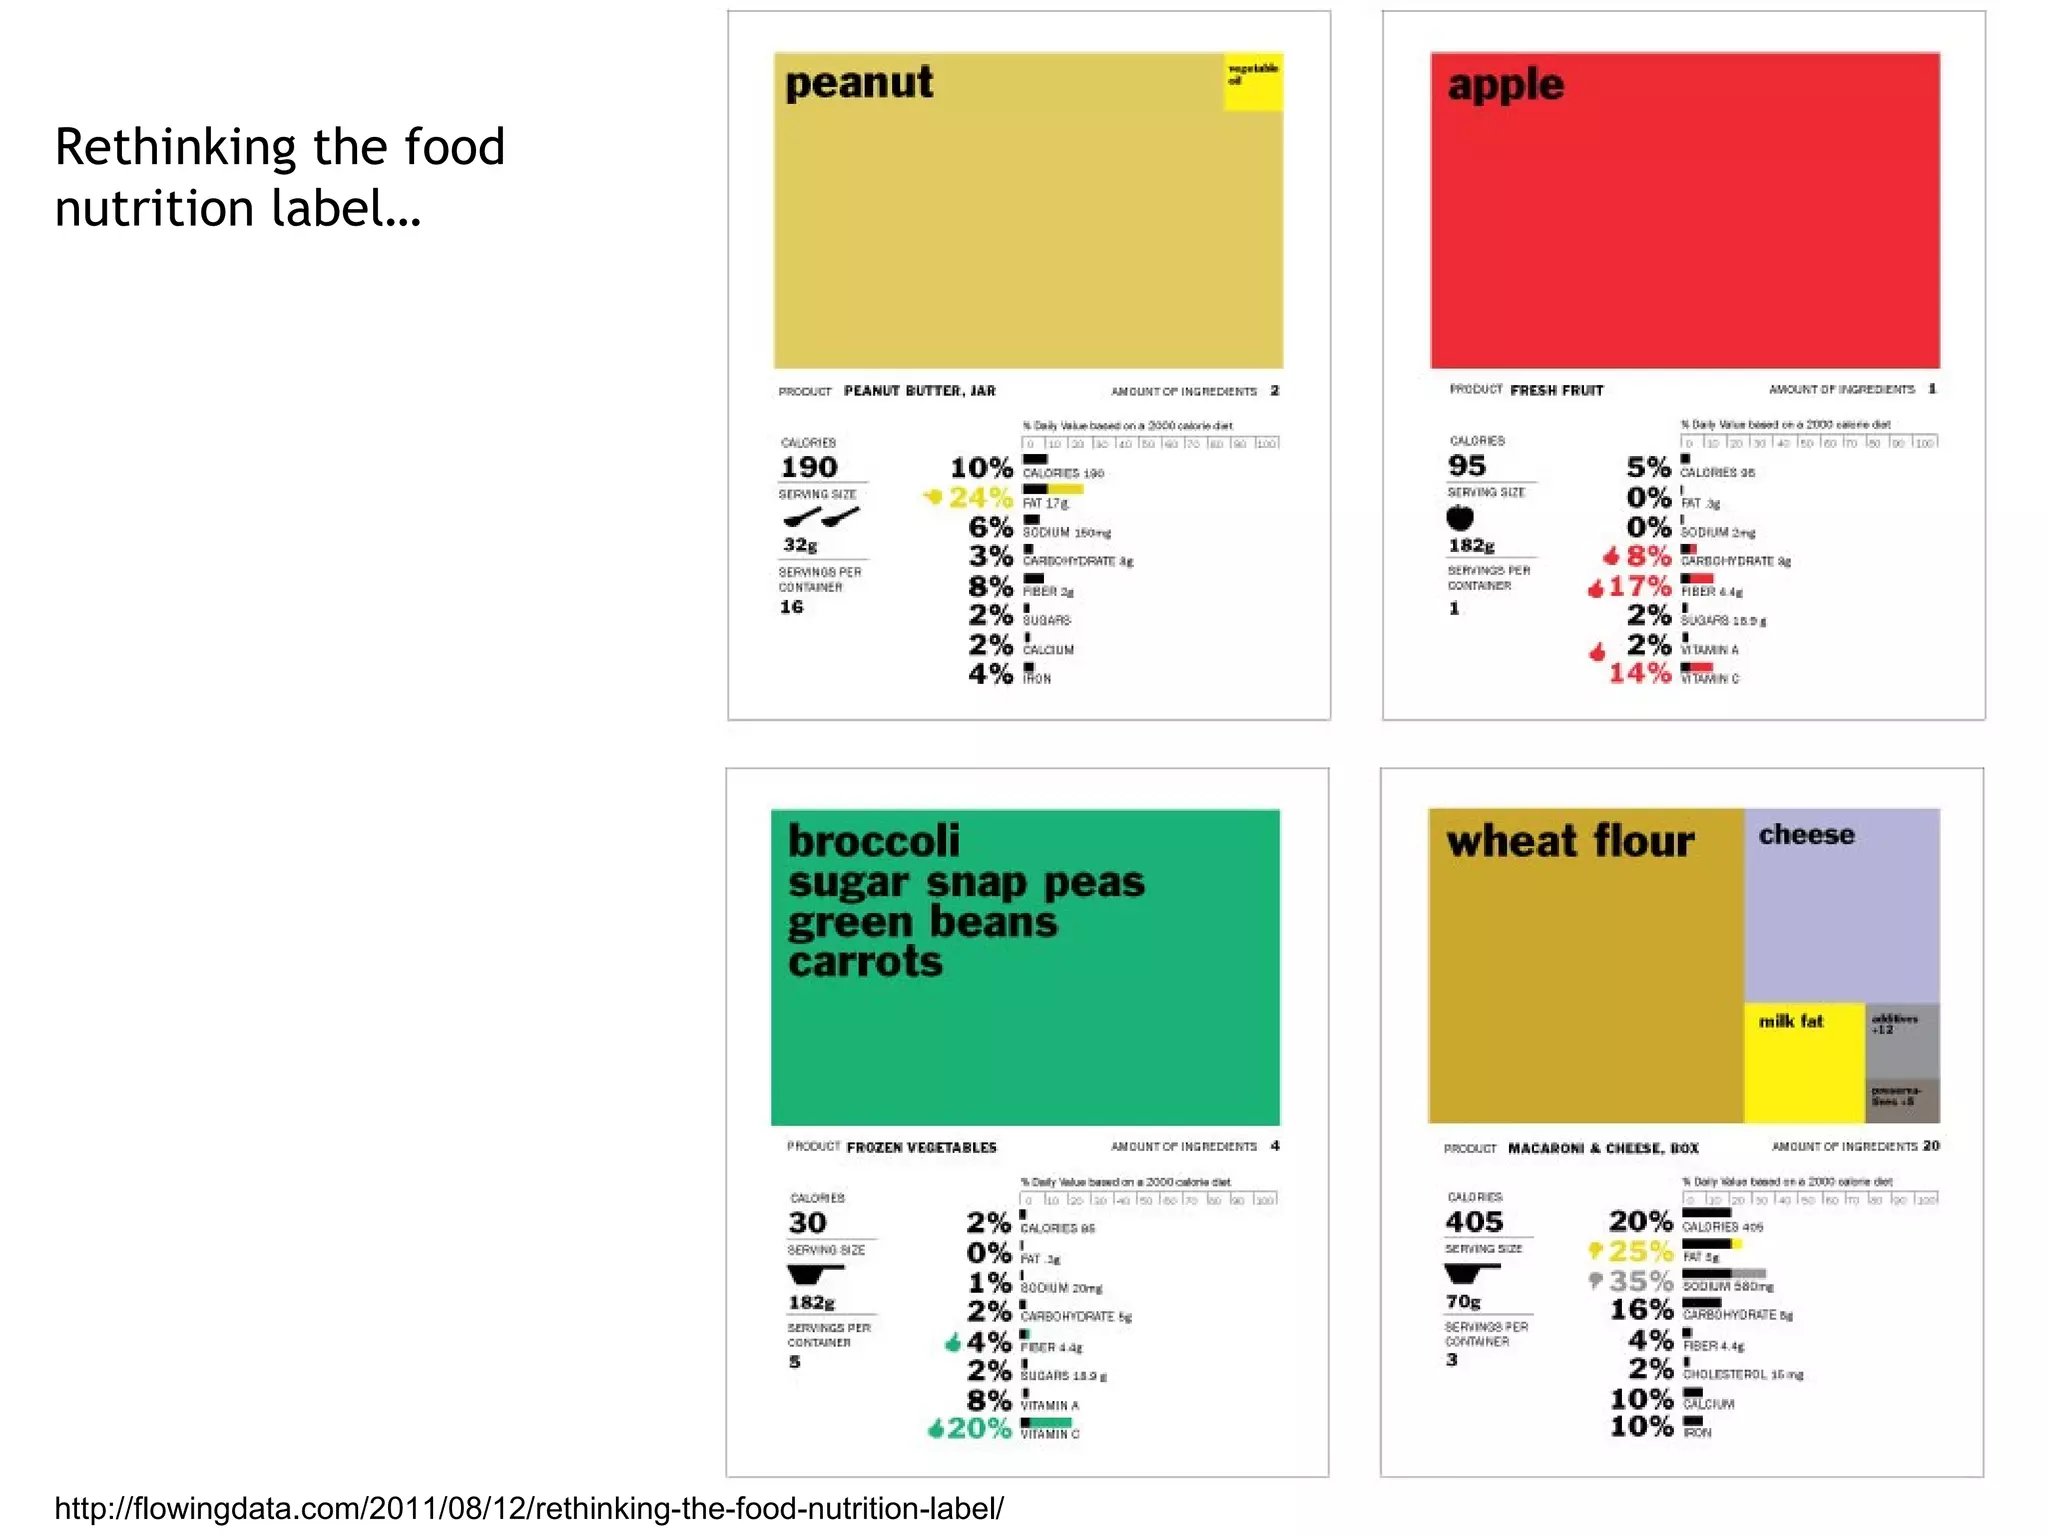
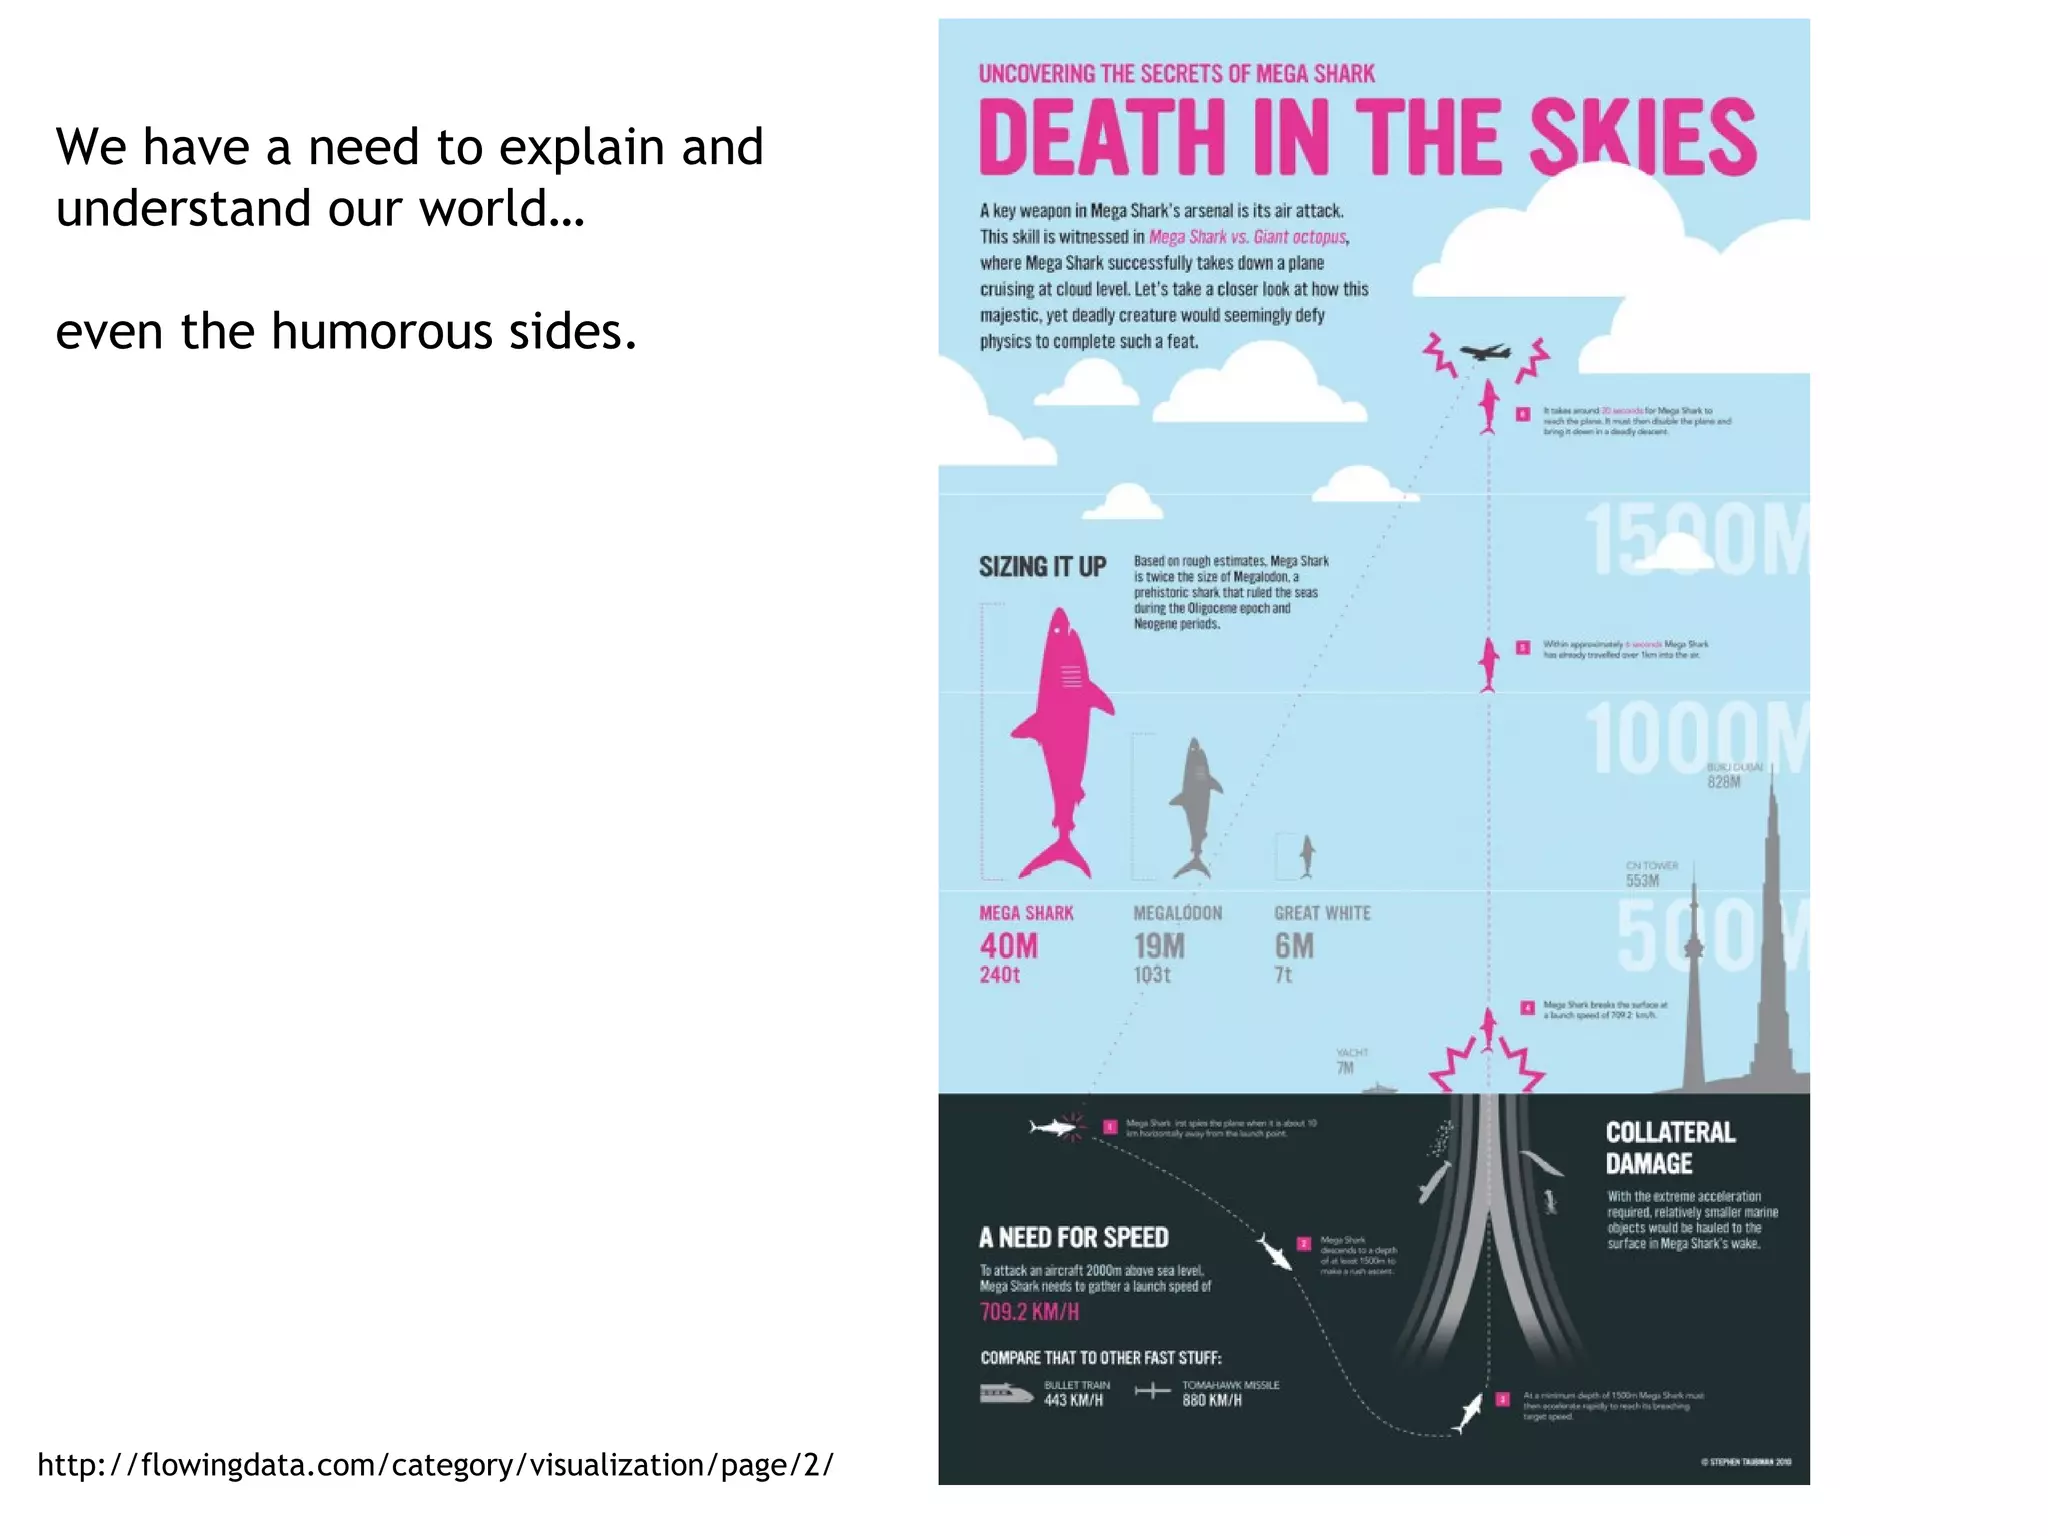
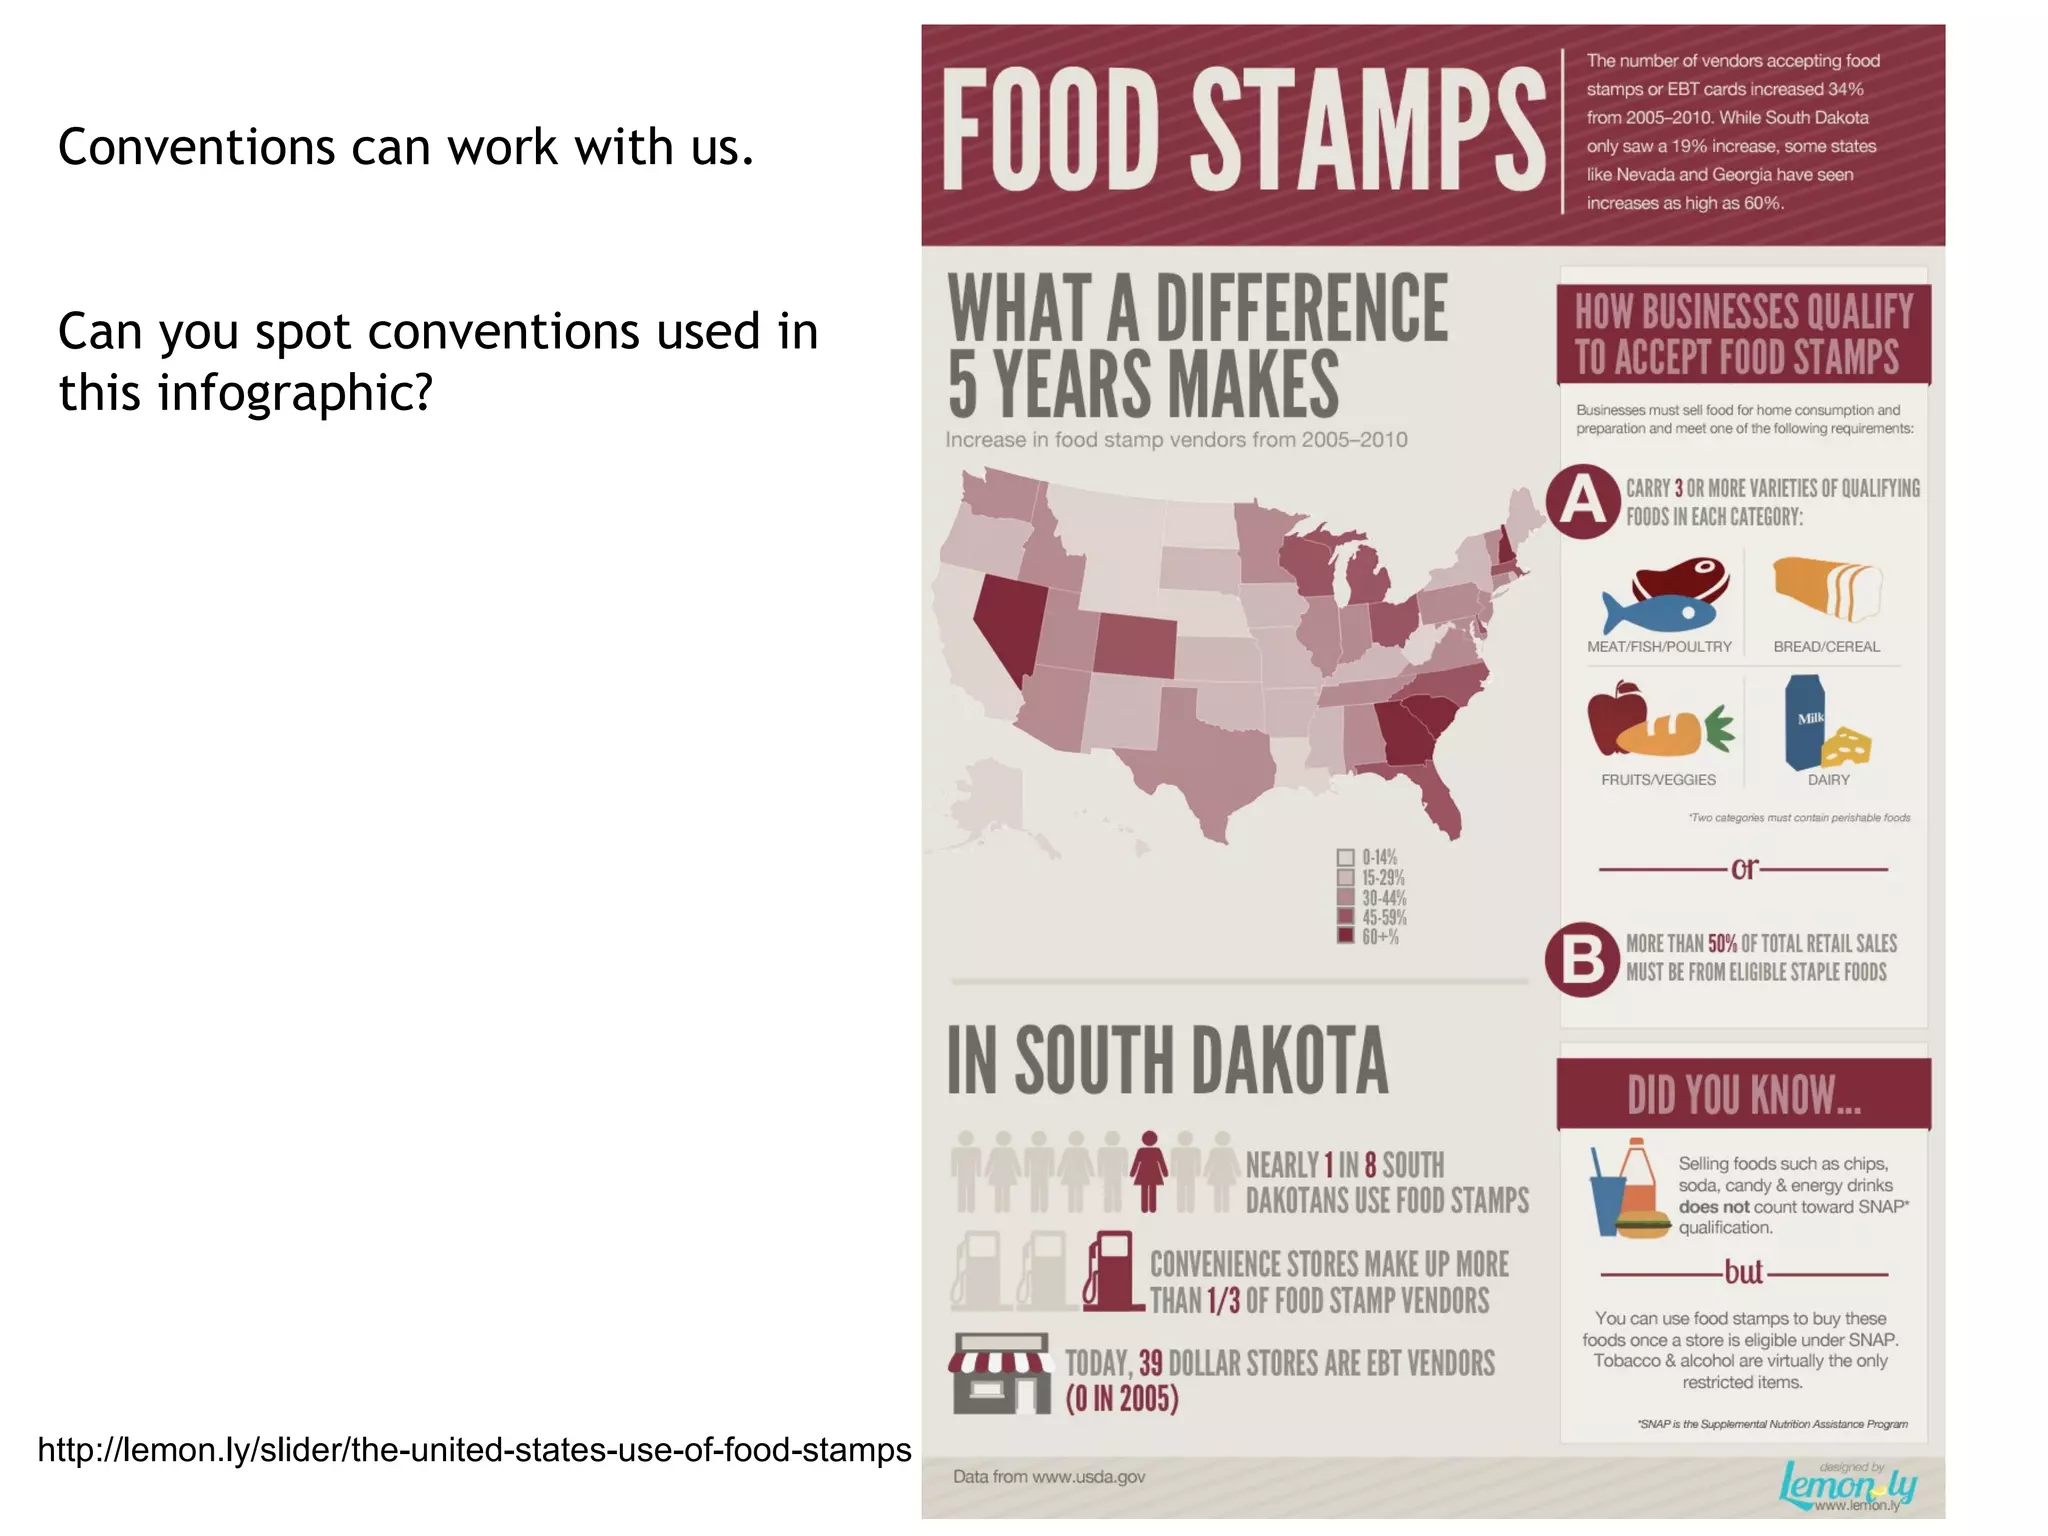
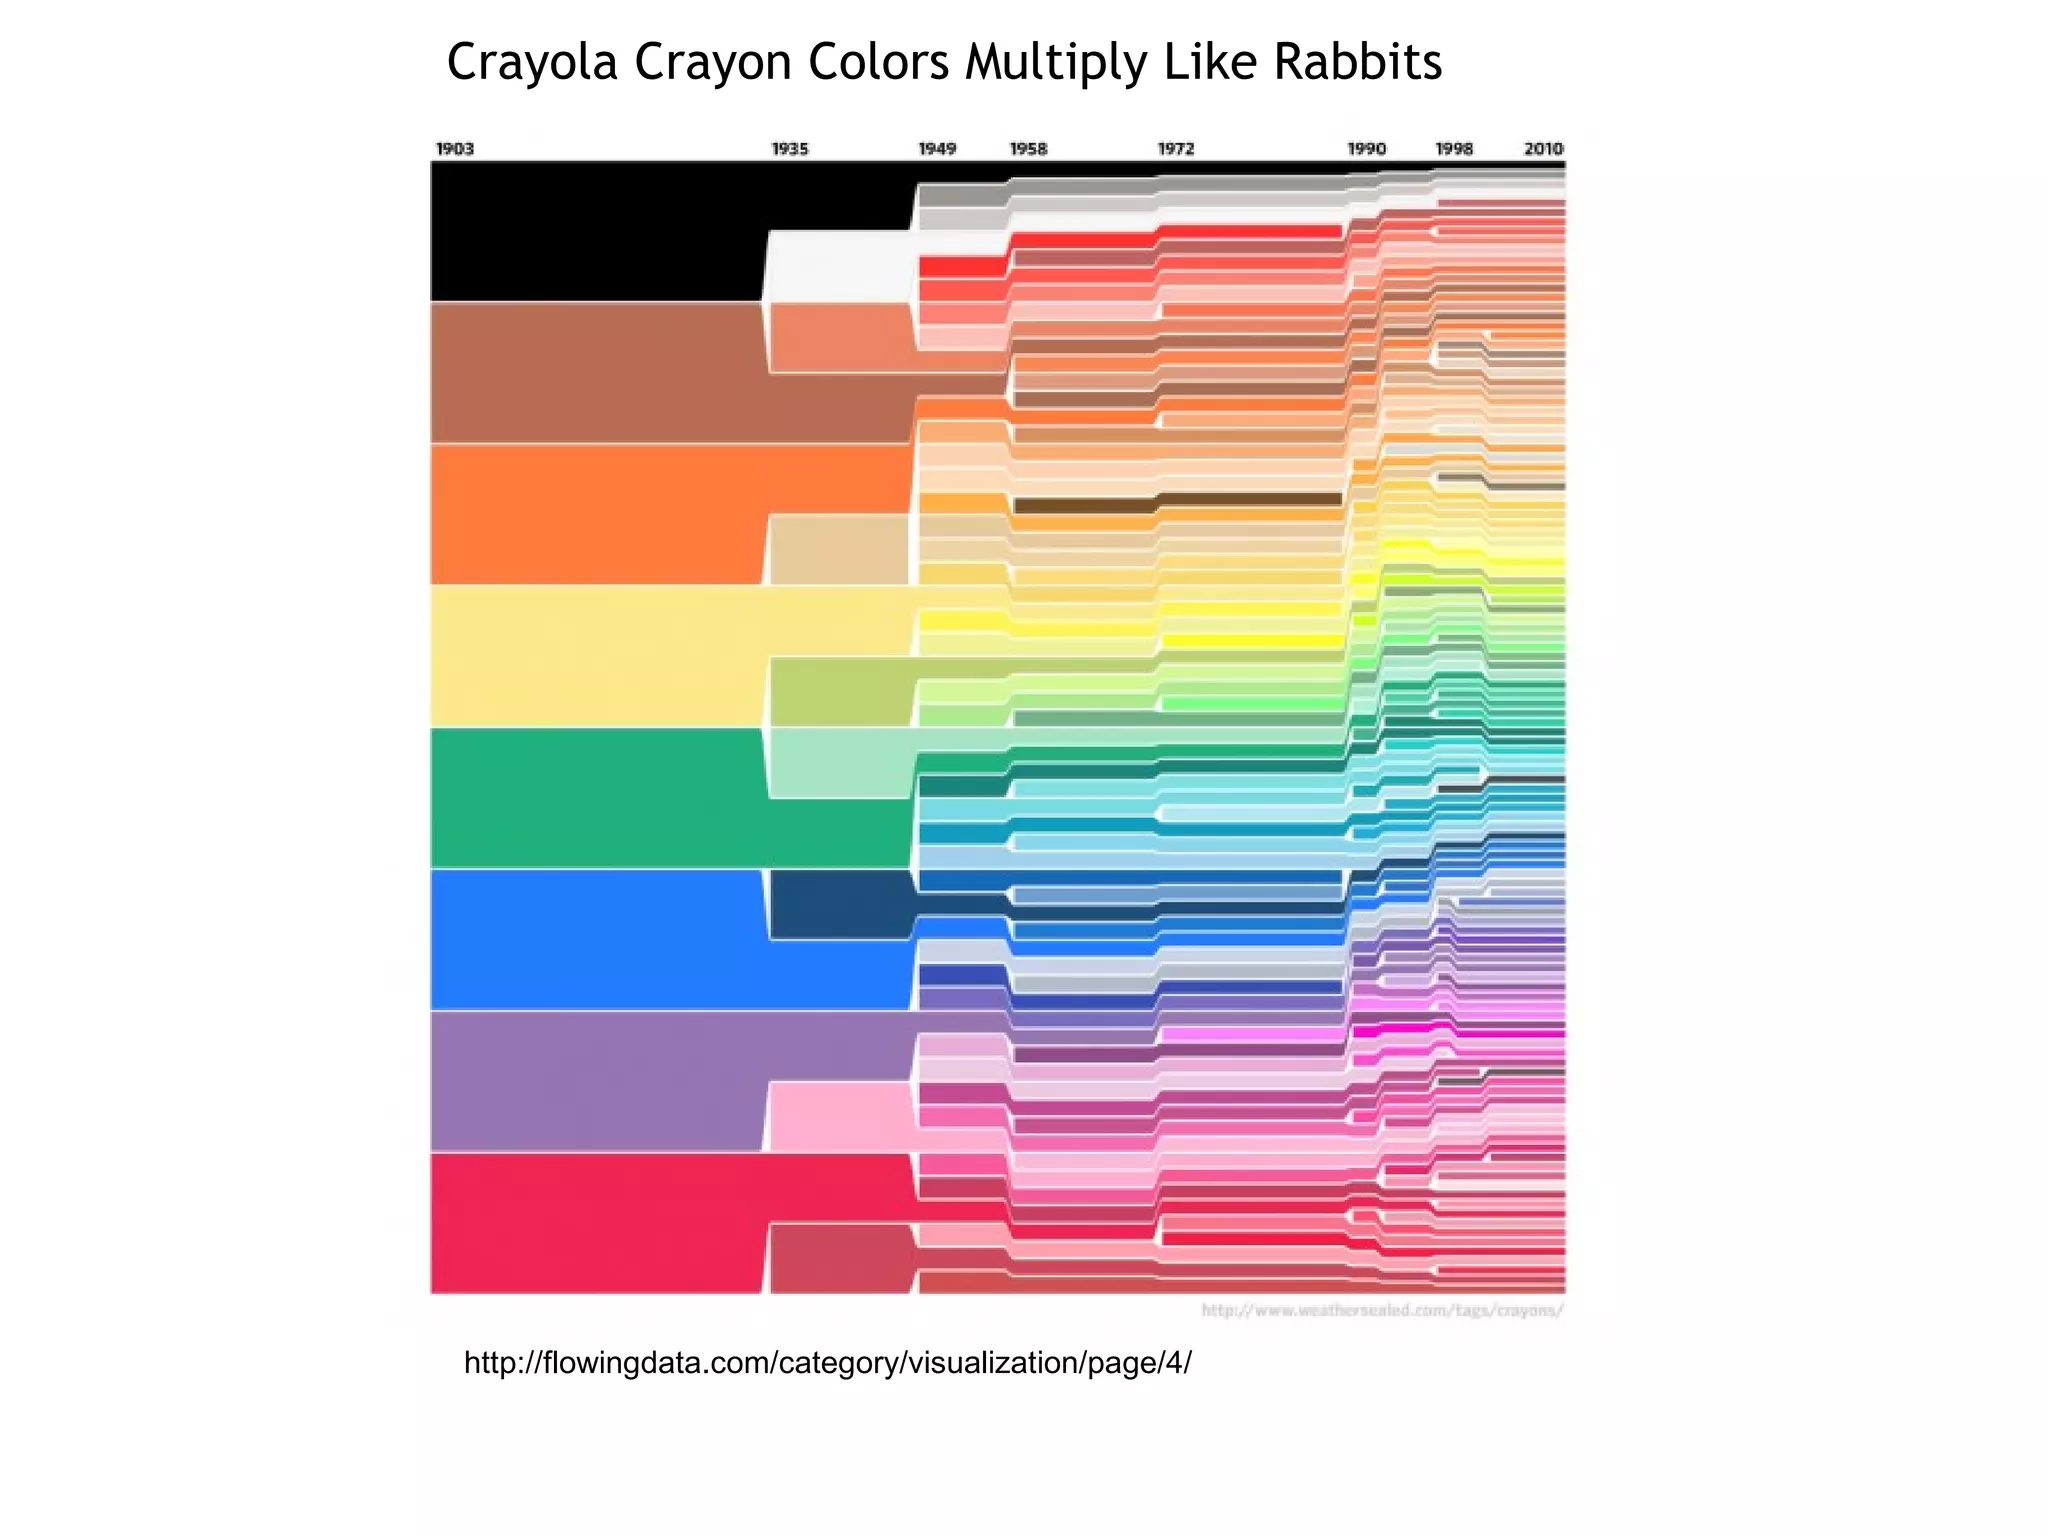
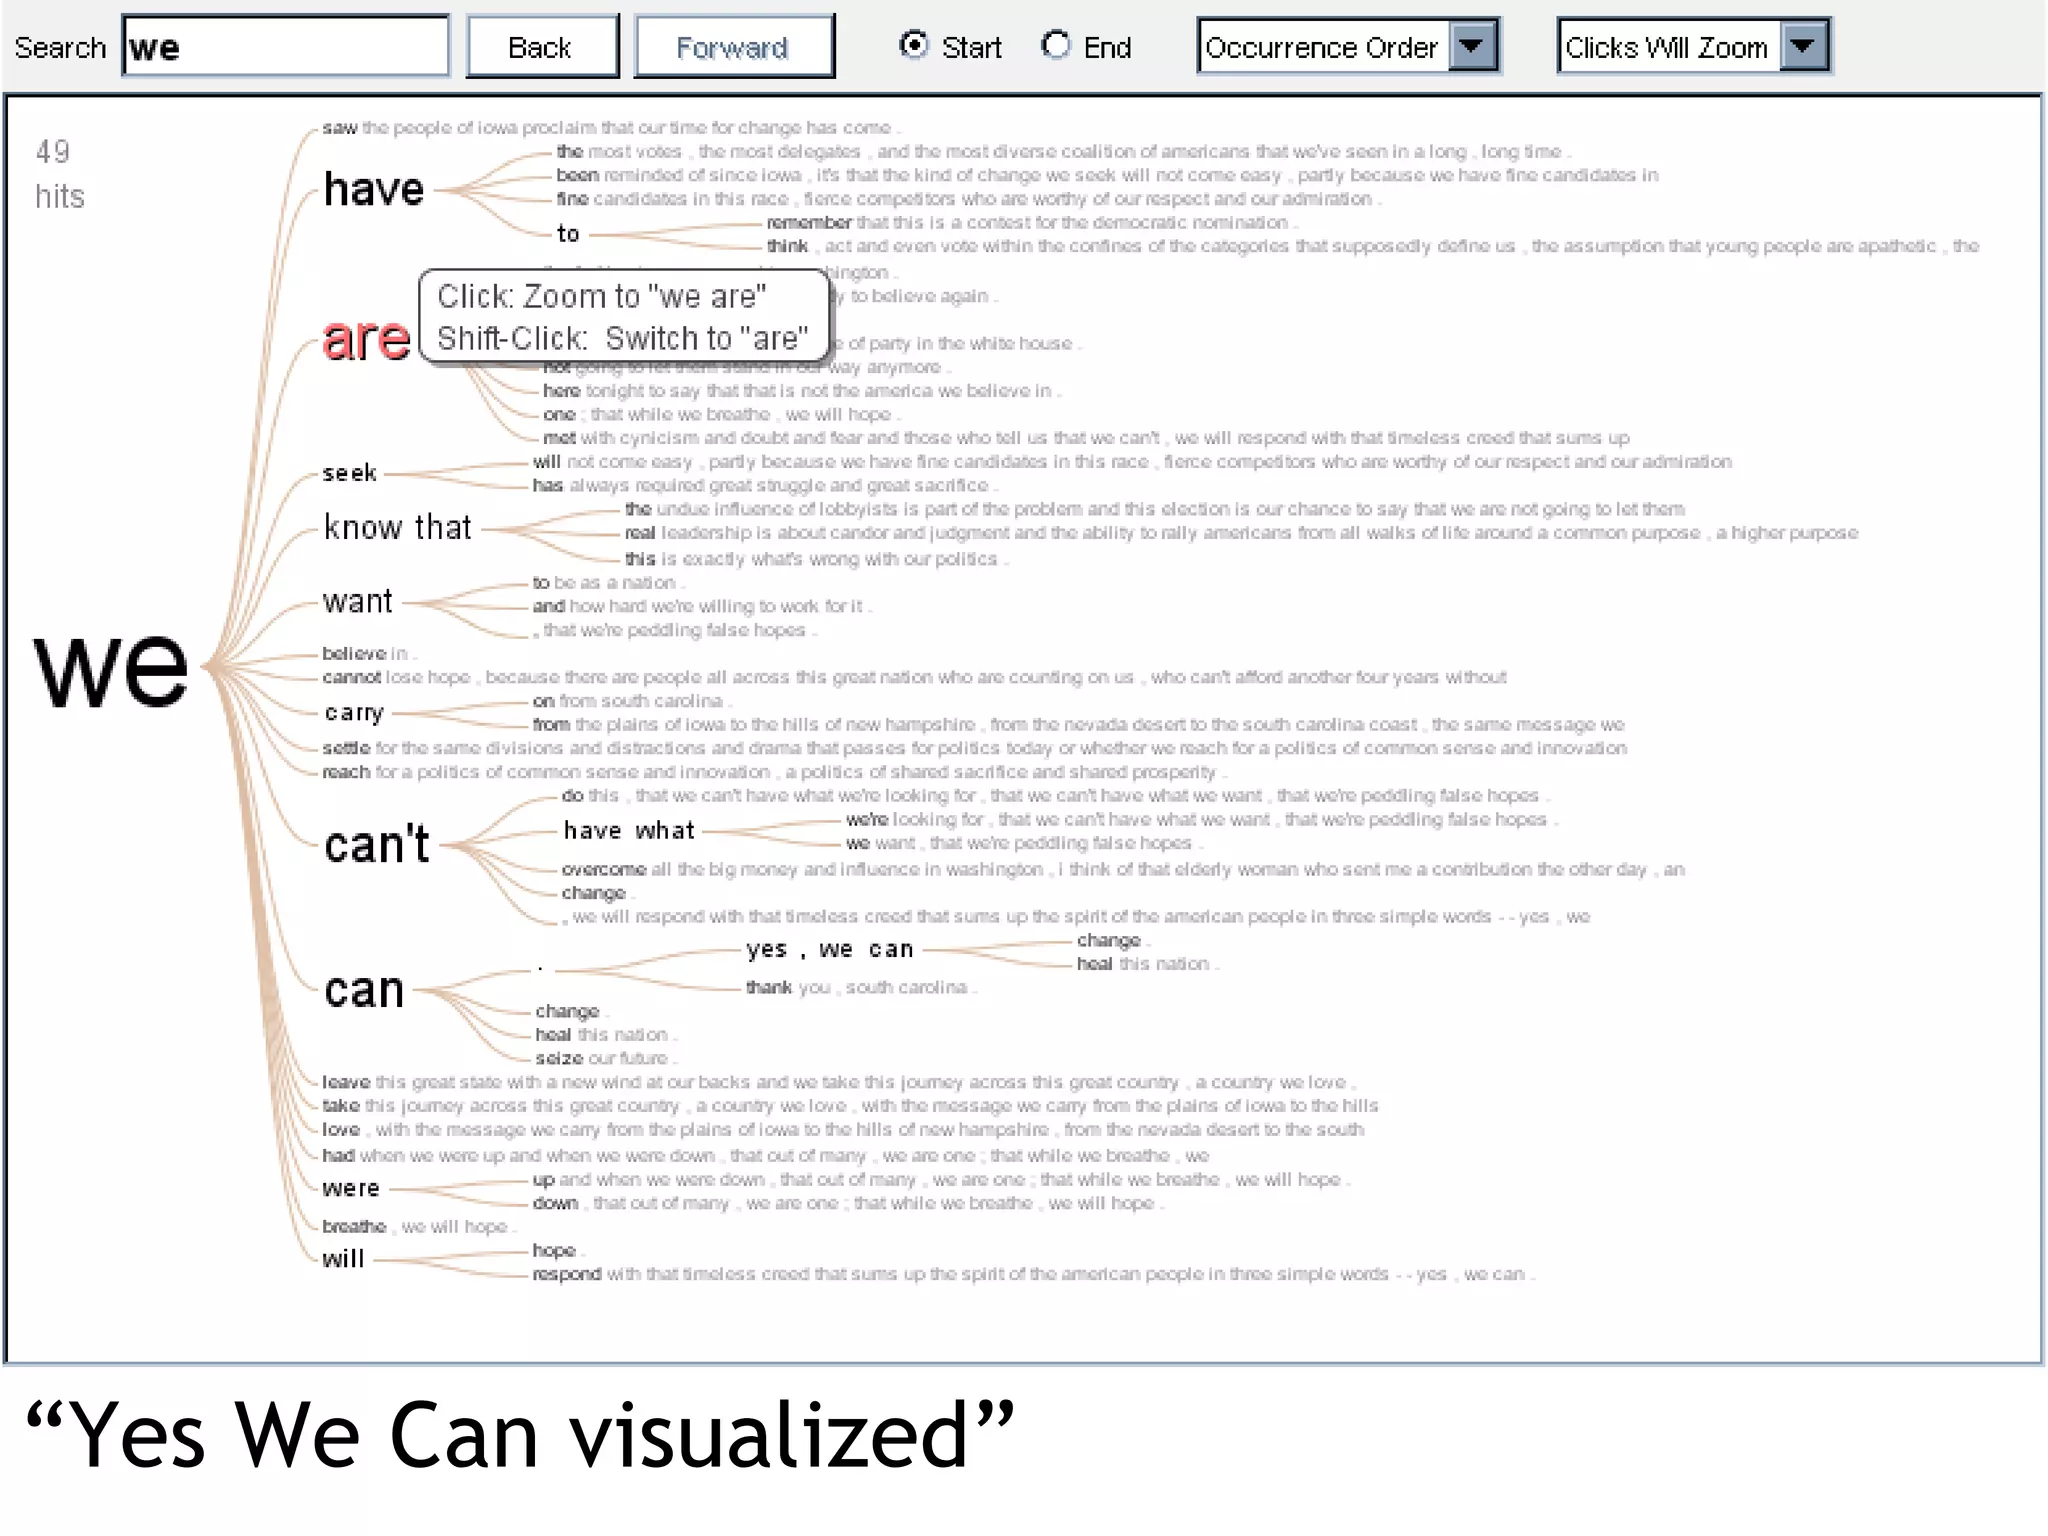
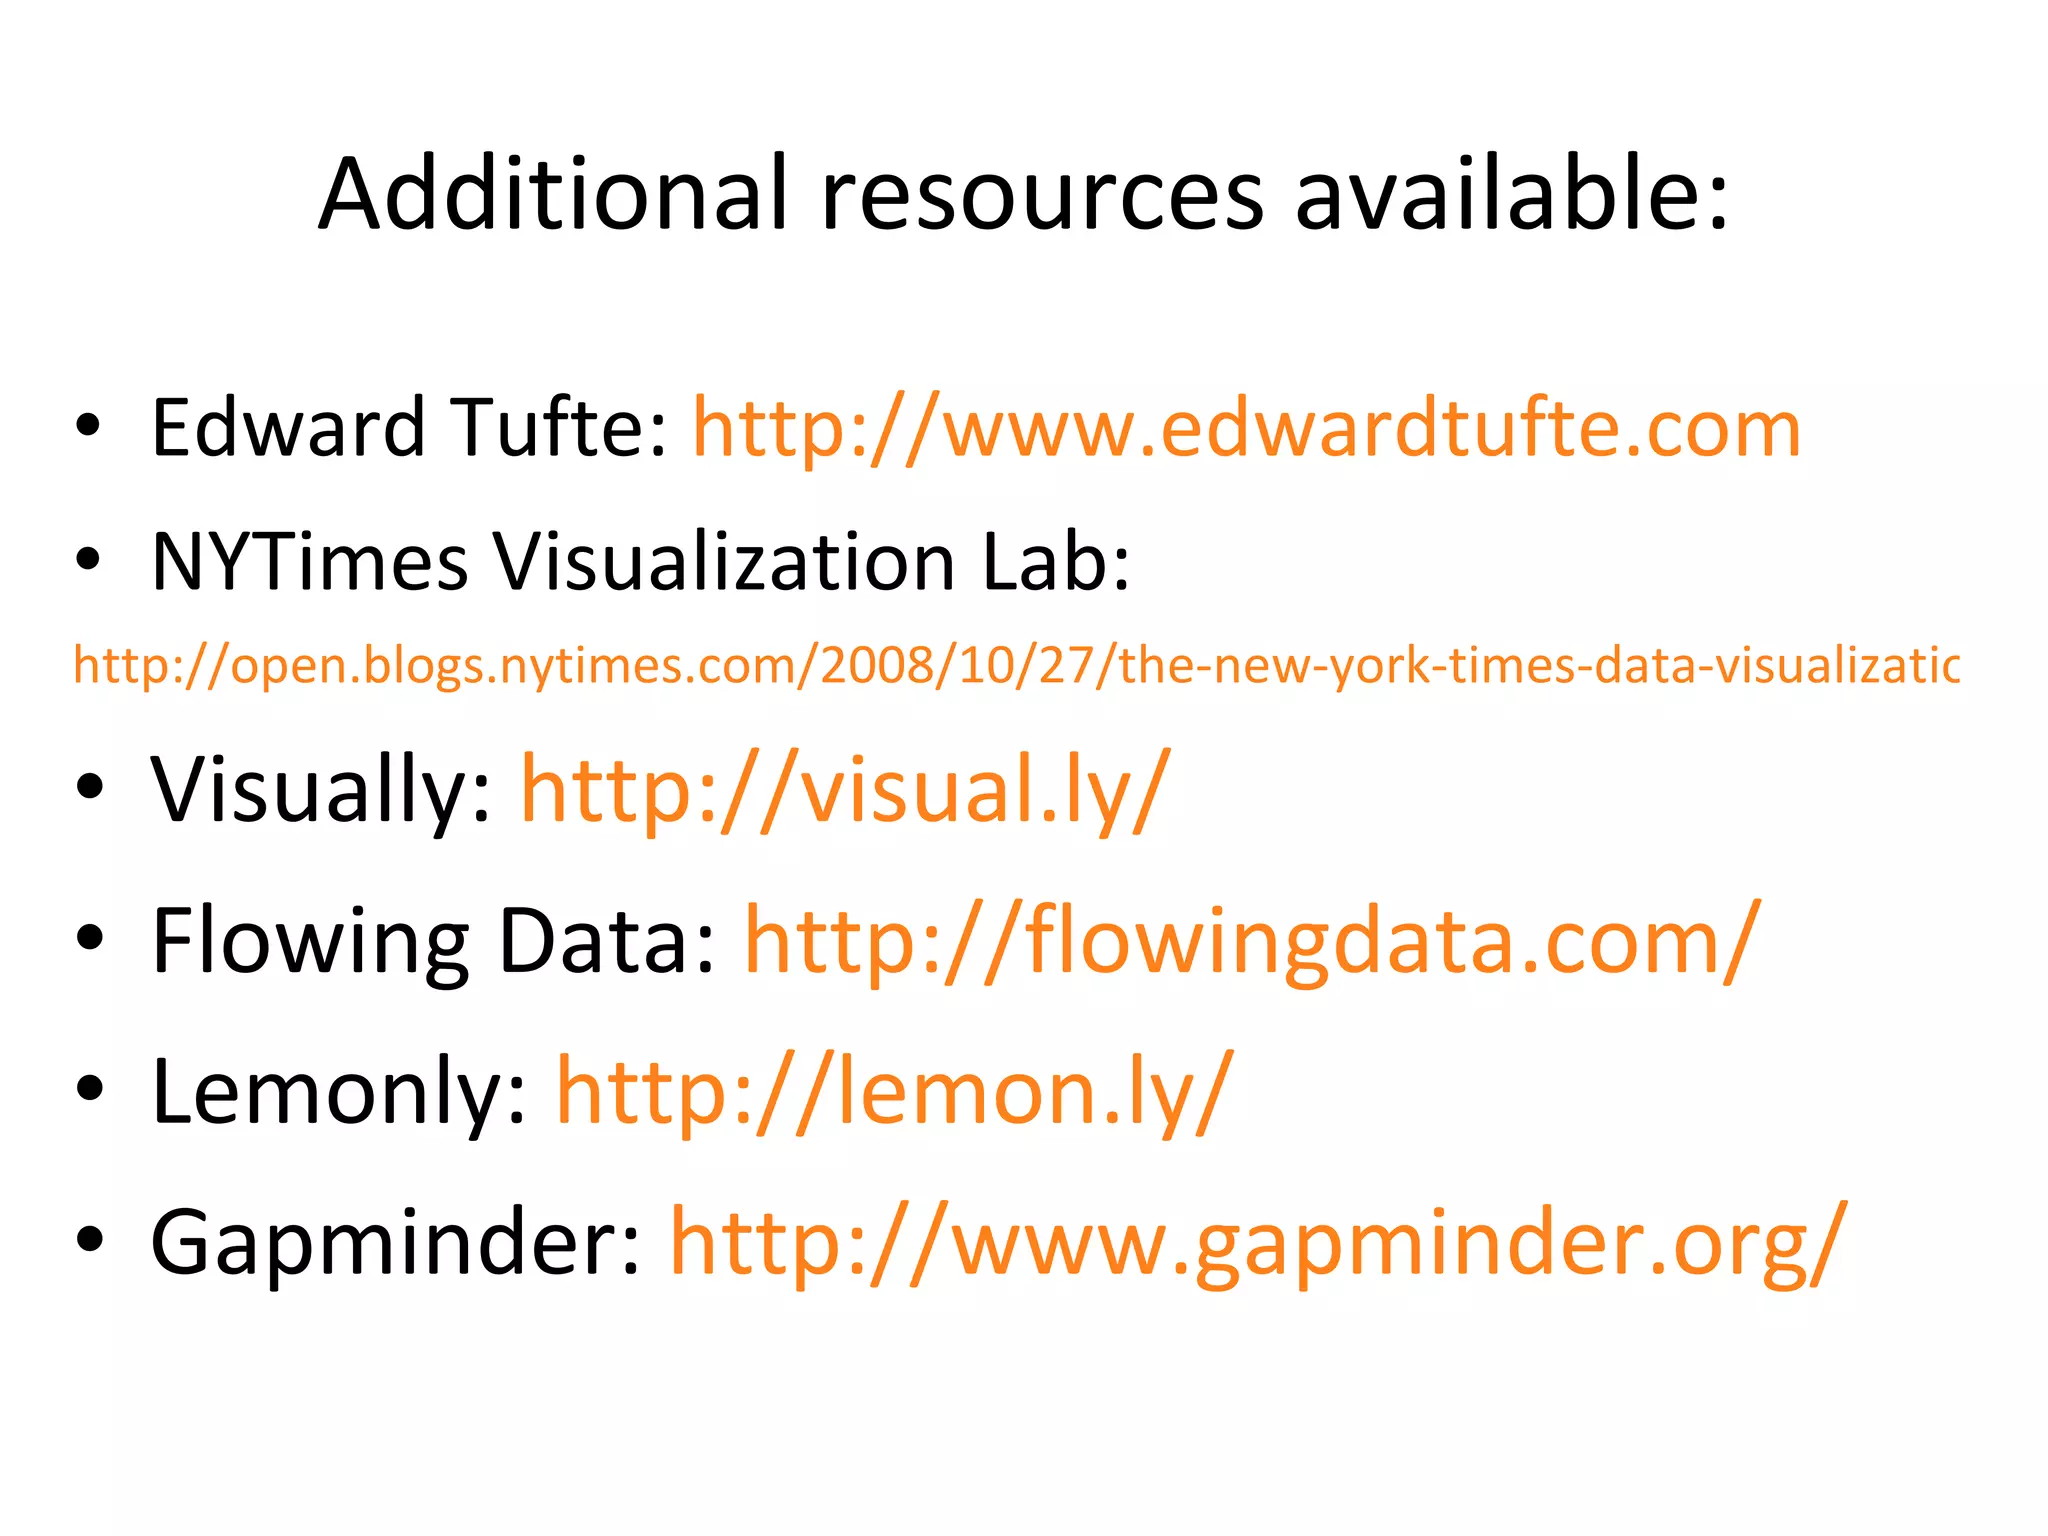
Visualizing Data 9/12/2011 Lisa Kurt Emerging Technologies Librarian Lisa Kurt “twitterized” by: http://visual.ly/twitter
Who? What skills? Designer Computer Scientist Statistician Teacher/professor Mathematician Business person Entrepreneur Artist Etc… http://flowingdata.com/2011/08/19/bikes-of-san-francisco/
Let’ s look at some fun information! Web of Science vs. Google Scholar Web of Science Google Scholar 07/2008 604 643 08/2008 580 604 09/2008 1083 1109 10/2008 1302 1241 11/2008 638 1297 12/2008 677 886
Let’ s make it cooler
More cooler
Not awesome enough yet
Does it get better than this?
Wow.


“ There is no such thing as information overload, only bad design” -Edward Tufte
Composition Alignment Repetition Contrast Color Typography Image choice basic design elements
3 words on chart junk… Don’t do this.
Remember that food pyramid thing? then now
Hrishi Mittal Rafal Dittwald Original graph: http://flowingdata.com/2010/02/25/challenge-make-this-graph-easier-to-read/ Brendan
http://www.japanquakemap.com/
http://xkcd.com/radiation/
Save pens. Use Garamond font
http://flowingdata.com/category/visualization/
How Genetics Works http://flowingdata.com/2010/03/05/how-genetics-works/
Rethinking the food nutrition label… http://flowingdata.com/2011/08/12/rethinking-the-food-nutrition-label/
http://flowingdata.com/category/visualization/page/2/ We have a need to explain and understand our world… even the humorous sides.
Conventions can work with us. Can you spot conventions used in this infographic? http://lemon.ly/slider/the-united-states-use-of-food-stamps
Crayola Crayon Colors Multiply Like Rabbits http://flowingdata.com/category/visualization/page/4/
Great Breakdown on Tools and Techniques: http:// www.visualisingdata.com/index.php/resources /
Not everything that looks hard, is as hard as it looks.
Many Eyes http:// manyeyes.alphaworks.ibm.com
“ Yes We Can visualized”
 
Google Visualization API http://code.google.com/apis/visualization /
Want to be like Hans Rosling?!? http://www.youtube.com/watch?v=hVimVzgtD6w  
http://code.google.com/apis/chart/interactive/docs/gallery/motionchart.html   Now you can!
Graphviz http://graphviz.org /
Finite State Machine
Unix versions
The code!
Flash/ActionScript http://actionscript.org /
BabyName Wizard http://www.babynamewizard.com/voyager #
 
EigenFactor http:// www.eigenfactor.org
 
Hmm… neat but that looks a little too fancy for me… Not everything that looks hard, is as hard as it looks!
Processing http:// processing.org   
Webpage Graph http://www.aharef.info/static/htmlgraph/?url=http:// google.com     
 
Deprocess http://benfry.com/deprocess/   
 
Imagination and drawing Your brain + pencil 
I am Beck Tench. http://becktench.com/
http://becktench.com/
This is indexed http://thisisindexed.com/
 
Retrieved from  Beautiful Visualization: Looking at Data Through the Eyes of Experts
http://xkcd.com/688/
Edward Tufte:  http://www.edwardtufte.com   NYTimes Visualization Lab:  http://open.blogs.nytimes.com/2008/10/27/the-new-york-times-data-visualization-lab/ Visually:  http://visual.ly/ Flowing Data:  http://flowingdata.com/ Lemonly:  http://lemon.ly/ Gapminder:  http://www.gapminder.org/ Additional resources available:
Your turn! Design a single infographic that demonstrates information/data gathered from the candy.  Sketch on paper or online. Or both! Consider the color, composition, contrast, typography, alignment, and repetition when designing your visualization.  Work with a partner- no more than 3 in a group.  Presentation and discussion.

Visualizing data fall2011