This document provides an overview of Matplotlib, a Python data visualization library. It discusses Matplotlib's pyplot and OO APIs, how to install Matplotlib, create basic plots using functions like plot(), and customize plots using markers and line styles. It also covers displaying plots, the Matplotlib user interface, Matplotlib's relationships with NumPy and Pandas, and examples of different types of graphs and charts like line plots that can be created with Matplotlib.


![Matplotlib Line Plot
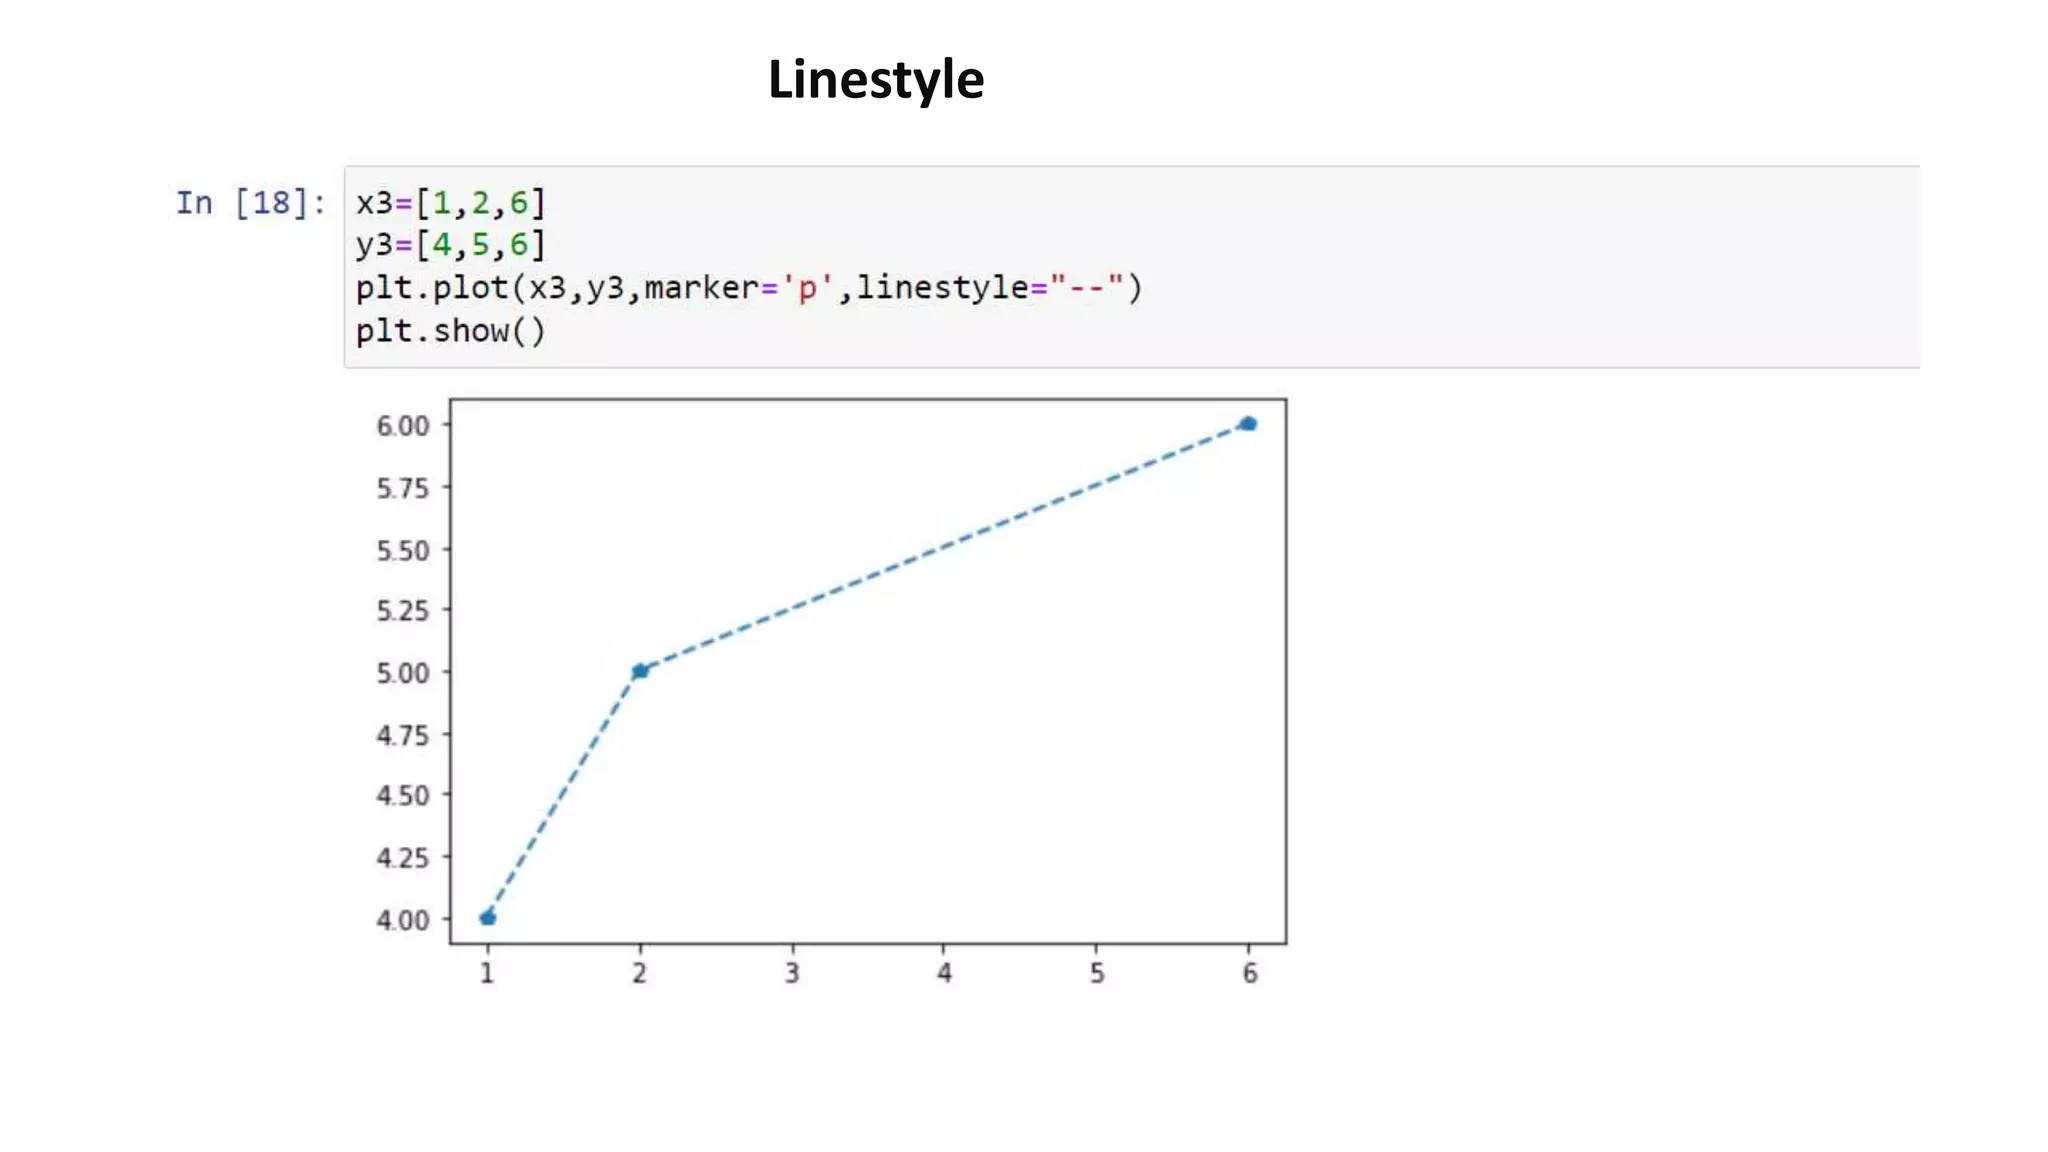
In this example, pyplot is imported as plt, and then used to plot three numbers in a straight line:
import matplotlib.pyplot as plt
# Plot some numbers:
plt.plot([1, 2, 3])
plt.title(”Line Plot”)
# Display the plot:
plt.show()
Figure. Line plot generated by Matplotlib:](https://image.slidesharecdn.com/visualizationandmatplotlibusingpython-230418052428-b7e21a1f/75/Visualization-and-Matplotlib-using-Python-pptx-19-2048.jpg)