This document provides an overview of system dynamics and systems thinking. It defines key terms like systems, static vs dynamic systems, feedback loops, stocks and flows. Systems thinking focuses on how parts of a system interrelate and how systems work over time. System dynamics uses feedback loops and stocks/flows to model how complex systems change over time. It involves conceptualizing the system, formulating stock/flow diagrams, testing the model, and implementing it to test policies. Causal loop diagrams and stock/flow diagrams are introduced as tools to understand system structure and behavior.

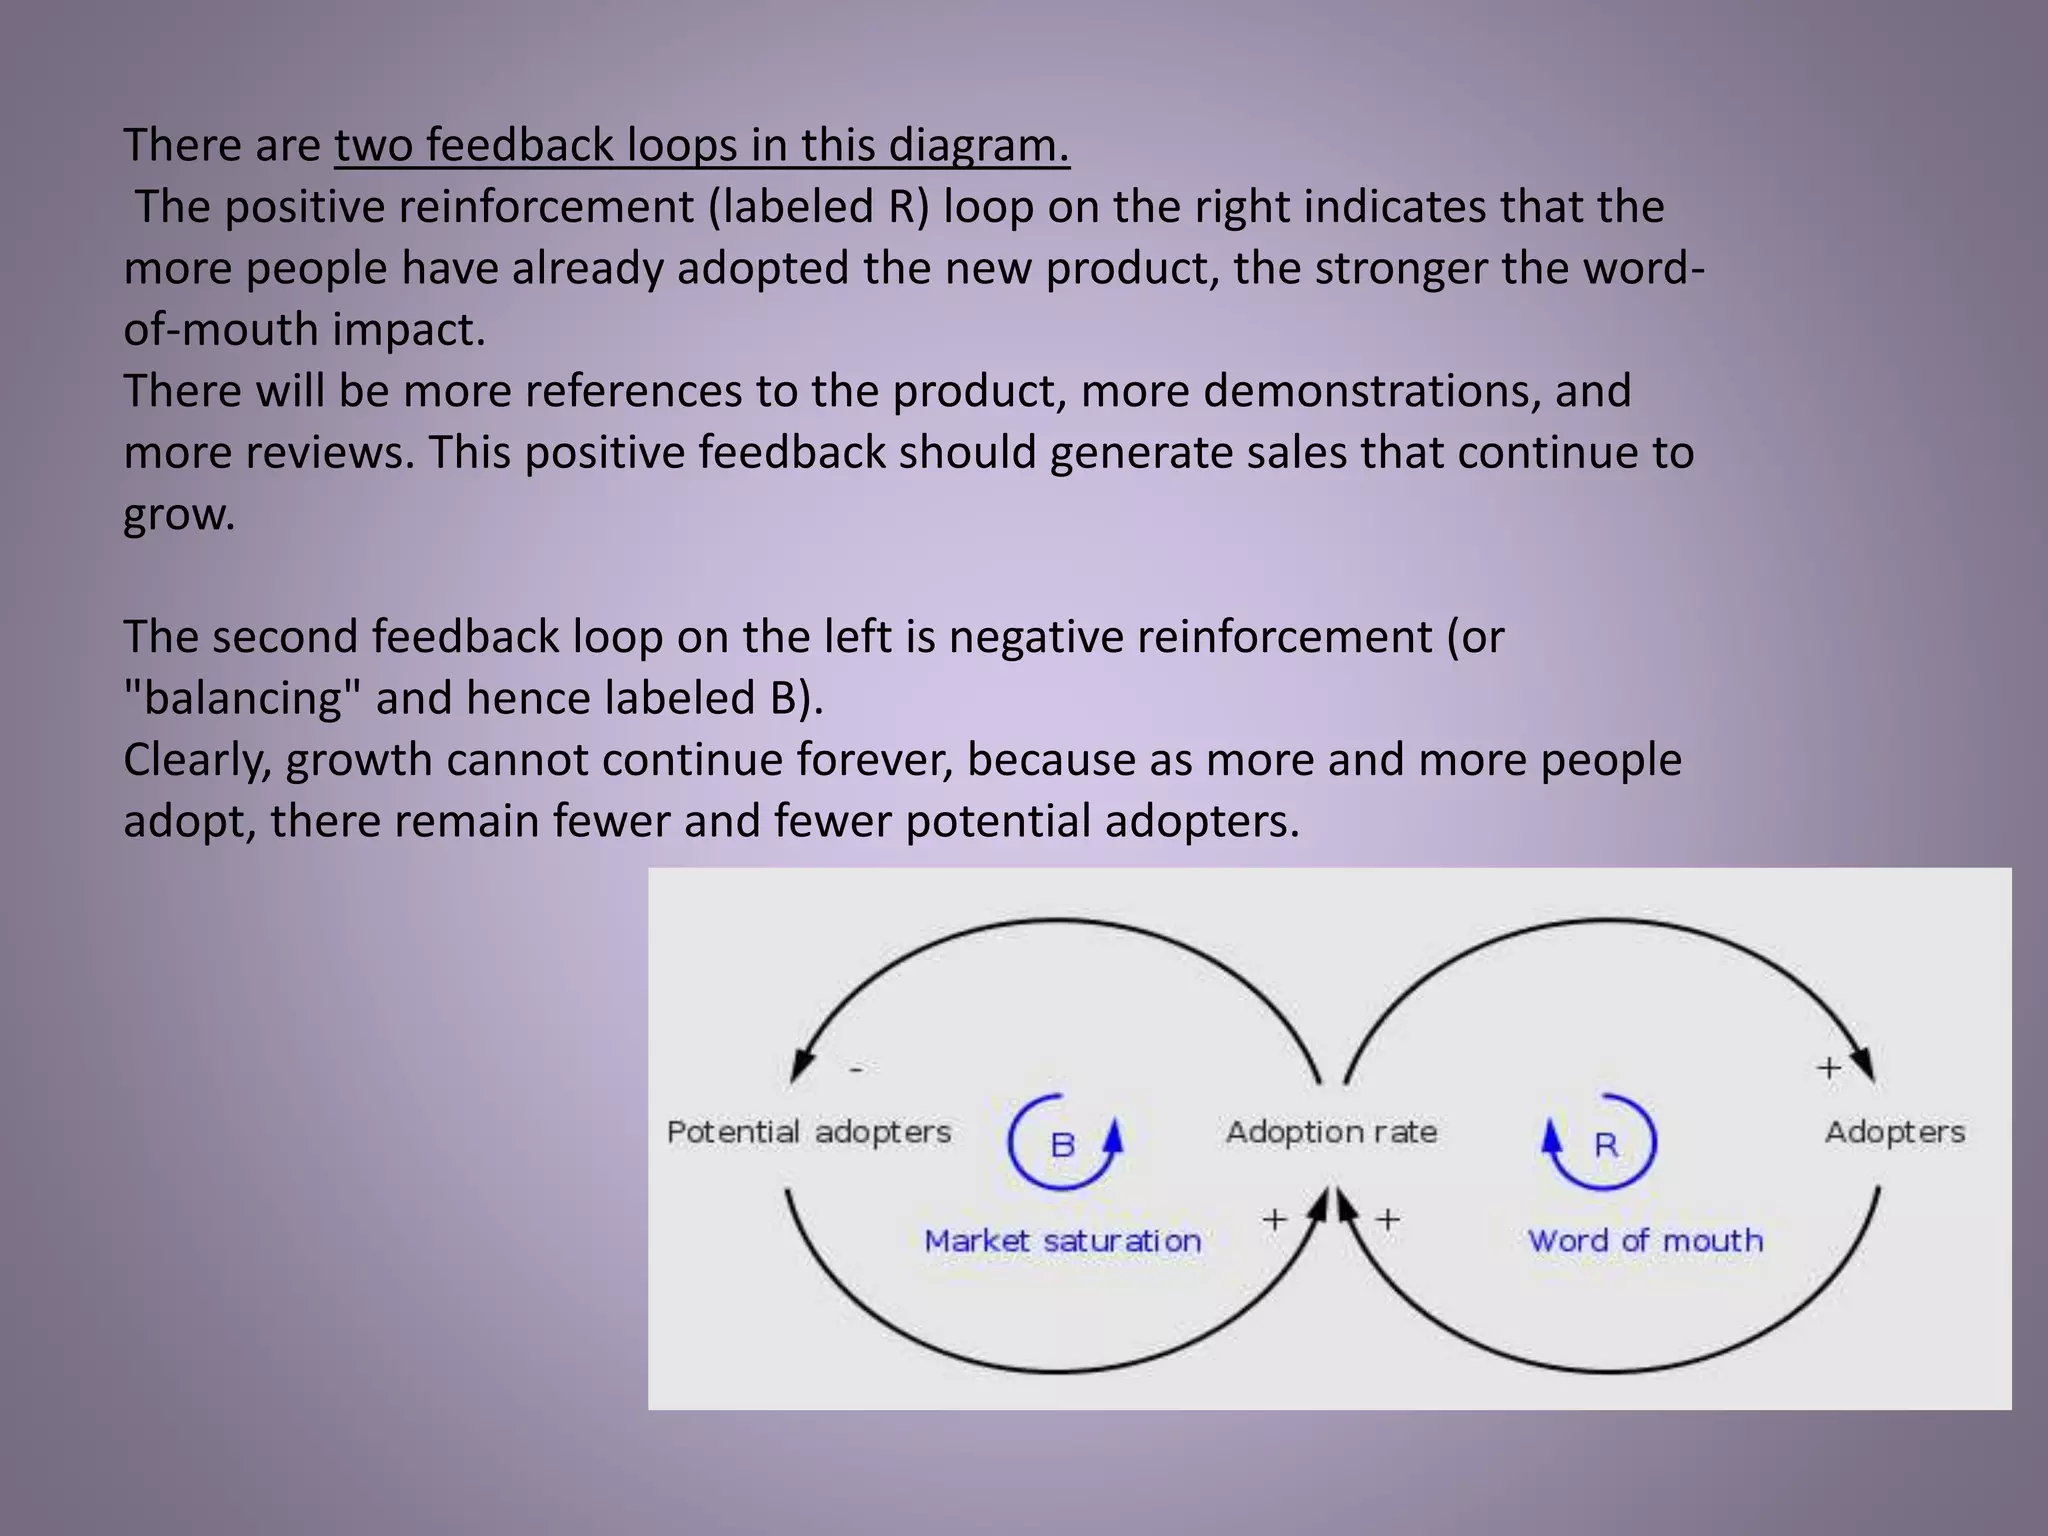
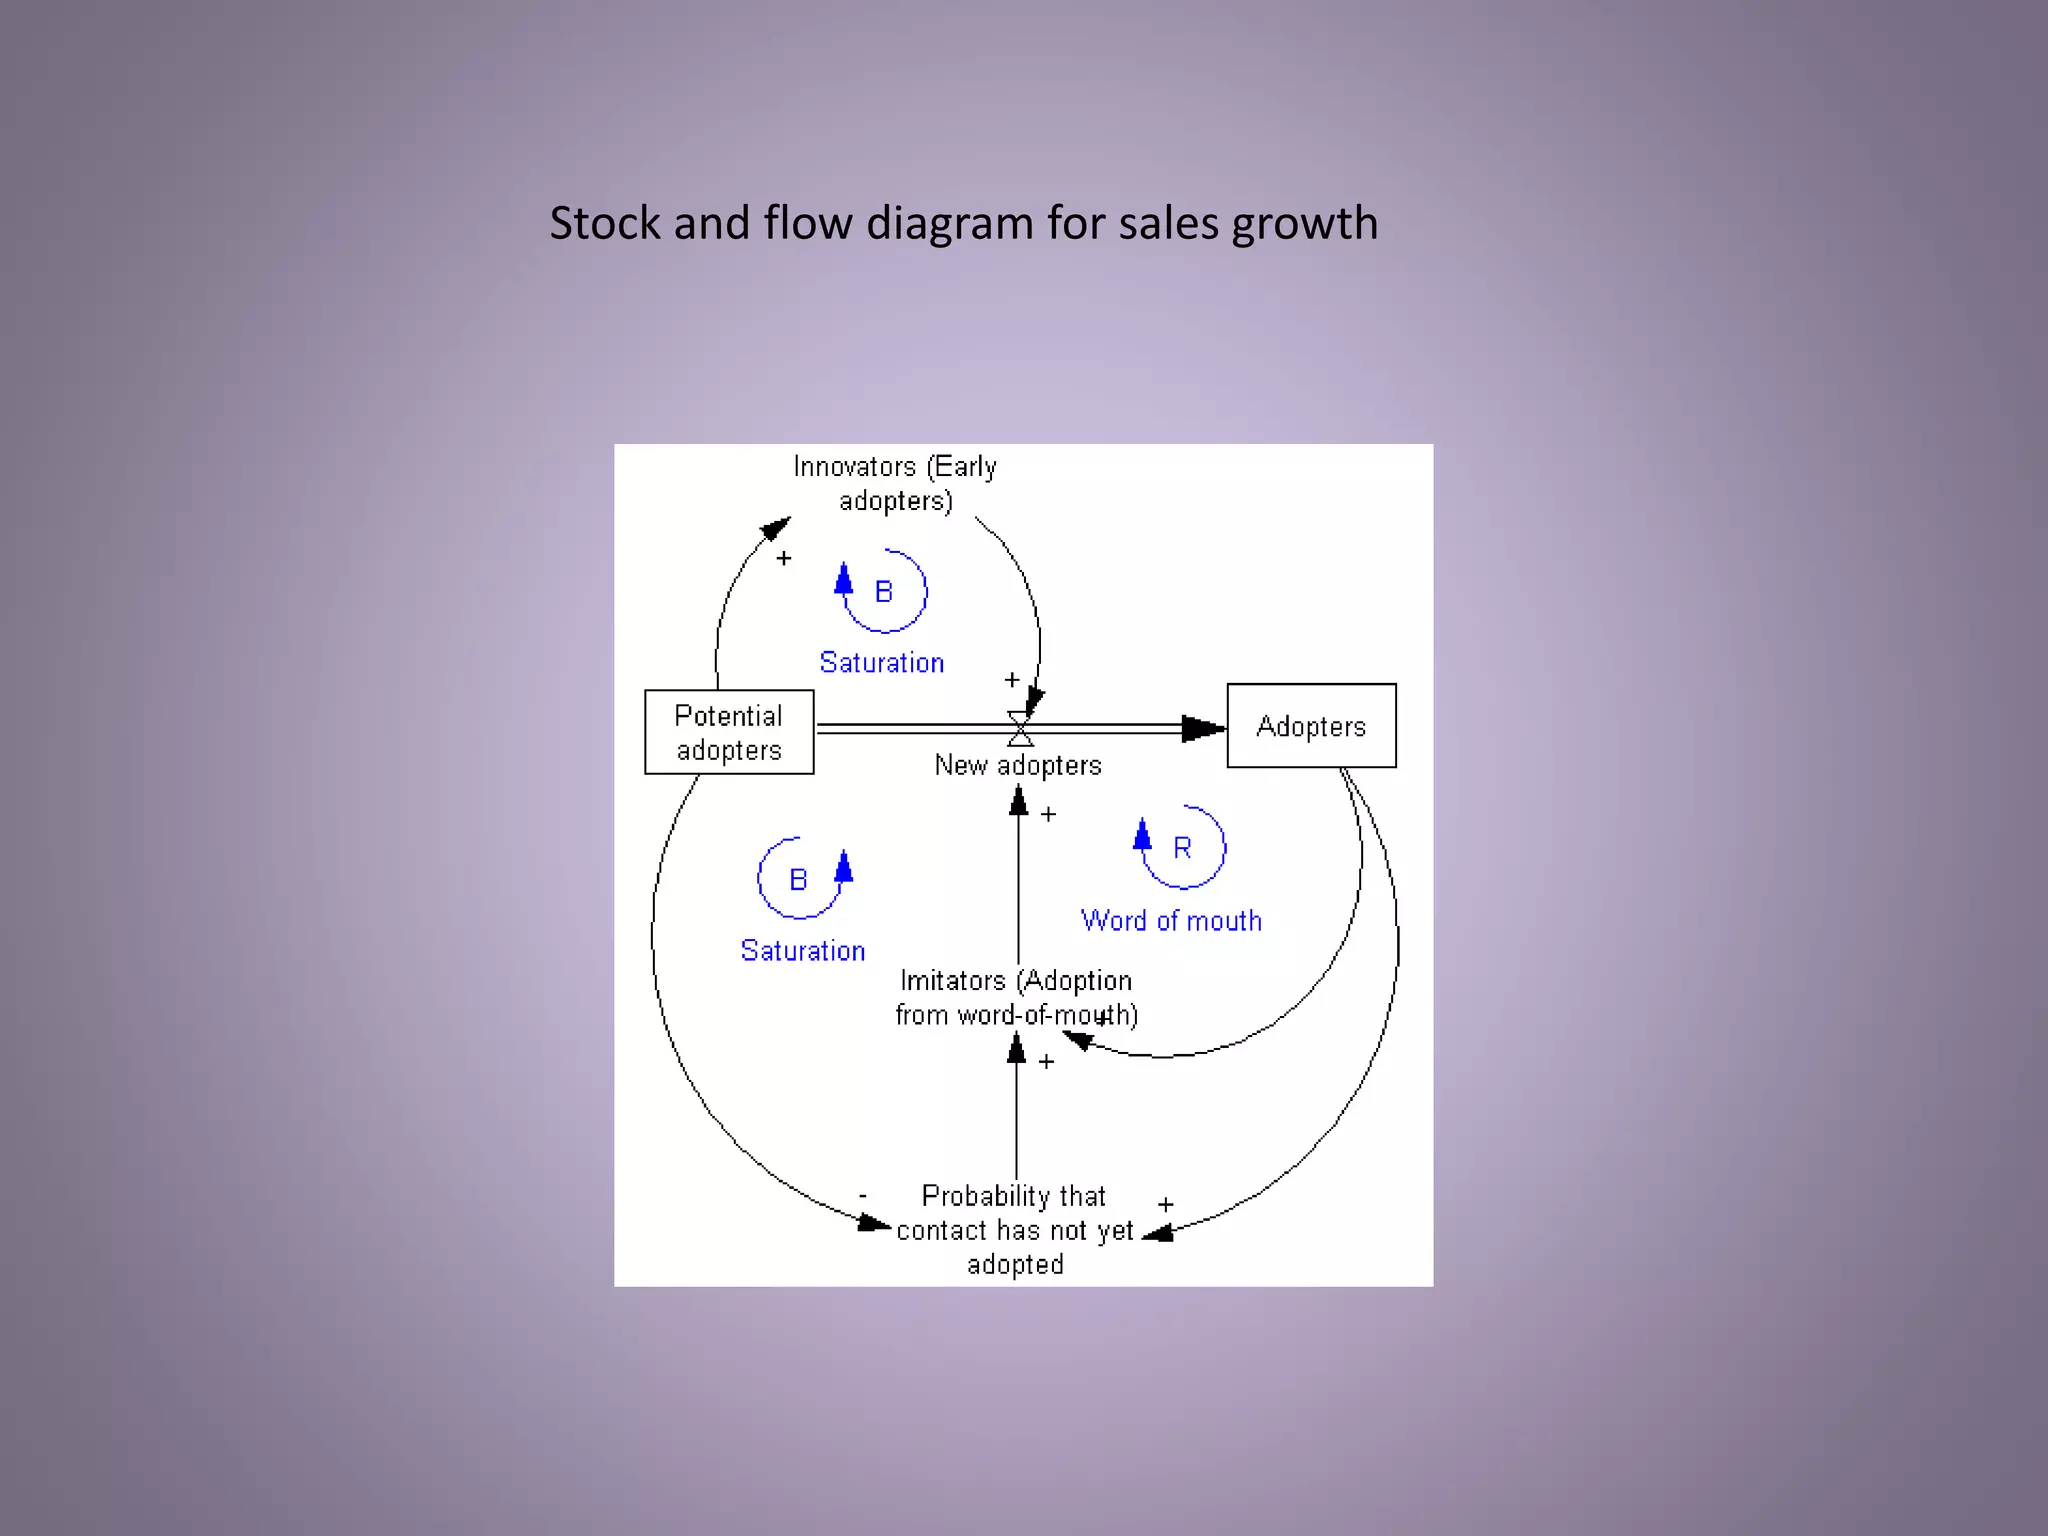
![• Combination of positive and negative loop
[e.g. sales growth]](https://image.slidesharecdn.com/unit4-systemdynamics-210428175303/75/Unit4-systemdynamics-21-2048.jpg)


![environmental modelling_lecture_khwopa [Autosaved].pptx](https://cdn.slidesharecdn.com/ss_thumbnails/environmentalmodellinglecturekhwopaautosaved-250518082519-8c595a41-thumbnail.jpg?width=640&height=640&fit=bounds)