Download as PDF, PPTX


![Representing Graphs
Adjacency Matrix
[[0, 0, 1, 1, 0, 0, 0, 0, 0, 0],
[0, 0, 0, 0, 0, 0, 1, 0, 0, 0],
[1, 0, 0, 1, 1, 0, 0, 0, 0, 1],
[1, 0, 1, 0, 0, 0, 1, 1, 1, 0],
[0, 0, 1, 0, 0, 0, 0, 0, 0, 0],
[0, 0, 0, 0, 0, 0, 0, 0, 0, 0],
[0, 1, 0, 1, 0, 0, 0, 0, 1, 0],
[0, 0, 0, 1, 0, 0, 0, 0, 0, 0],
[0, 0, 0, 1, 0, 0, 1, 0, 0, 1],
[0, 0, 1, 0, 0, 0, 0, 0, 1, 0]]](https://image.slidesharecdn.com/socialnetworkanalysiswithpython-141121195454-conversion-gate02/75/Graph-Analyses-with-Python-and-NetworkX-9-2048.jpg)
![Undirected graphs have symmetric adjacency matrices.
Representing Graphs
Adjacency Matrix
[[0, 0, 1, 1, 0, 0, 0, 0, 0, 0],
[0, 0, 0, 0, 0, 0, 1, 0, 0, 0],
[1, 0, 0, 1, 1, 0, 0, 0, 0, 1],
[1, 0, 1, 0, 0, 0, 1, 1, 1, 0],
[0, 0, 1, 0, 0, 0, 0, 0, 0, 0],
[0, 0, 0, 0, 0, 0, 0, 0, 0, 0],
[0, 1, 0, 1, 0, 0, 0, 0, 1, 0],
[0, 0, 0, 1, 0, 0, 0, 0, 0, 0],
[0, 0, 0, 1, 0, 0, 1, 0, 0, 1],
[0, 0, 1, 0, 0, 0, 0, 0, 1, 0]]](https://image.slidesharecdn.com/socialnetworkanalysiswithpython-141121195454-conversion-gate02/75/Graph-Analyses-with-Python-and-NetworkX-10-2048.jpg)


![Iterative PageRank in Python
def pageRank(G, s = .85, maxerr = .001):
n = G.shape[0]
# transform G into markov matrix M
M = csc_matrix(G,dtype=np.float)
rsums = np.array(M.sum(1))[:,0]
ri, ci = M.nonzero()
M.data /= rsums[ri]
sink = rsums==0 # bool array of sink states
# Compute pagerank r until we converge
ro, r = np.zeros(n), np.ones(n)
while np.sum(np.abs(r-ro)) > maxerr:
ro = r.copy()
for i in xrange(0,n):
Ii = np.array(M[:,i].todense())[:,0] # inlinks of state i
Si = sink / float(n) # account for sink states
Ti = np.ones(n) / float(n) # account for teleportation
r[i] = ro.dot( Ii*s + Si*s + Ti*(1-s) )
return r/sum(r) # return normalized pagerank](https://image.slidesharecdn.com/socialnetworkanalysiswithpython-141121195454-conversion-gate02/75/Graph-Analyses-with-Python-and-NetworkX-38-2048.jpg)
![Graph-Based PageRank in Gremlin
pagerank = [:].withDefault{0}
size = uris.size();
uris.each{
count = it.outE.count();
if(count == 0 || rand.nextDouble() > 0.85) {
rank = pagerank[it]
uris.each {
pagerank[it] = pagerank[it] / uris.size()
}
}
rank = pagerank[it] / it.outE.count();
it.out.each{
pagerank[it] = pagerank[it] + rank;
}
}](https://image.slidesharecdn.com/socialnetworkanalysiswithpython-141121195454-conversion-gate02/75/Graph-Analyses-with-Python-and-NetworkX-39-2048.jpg)
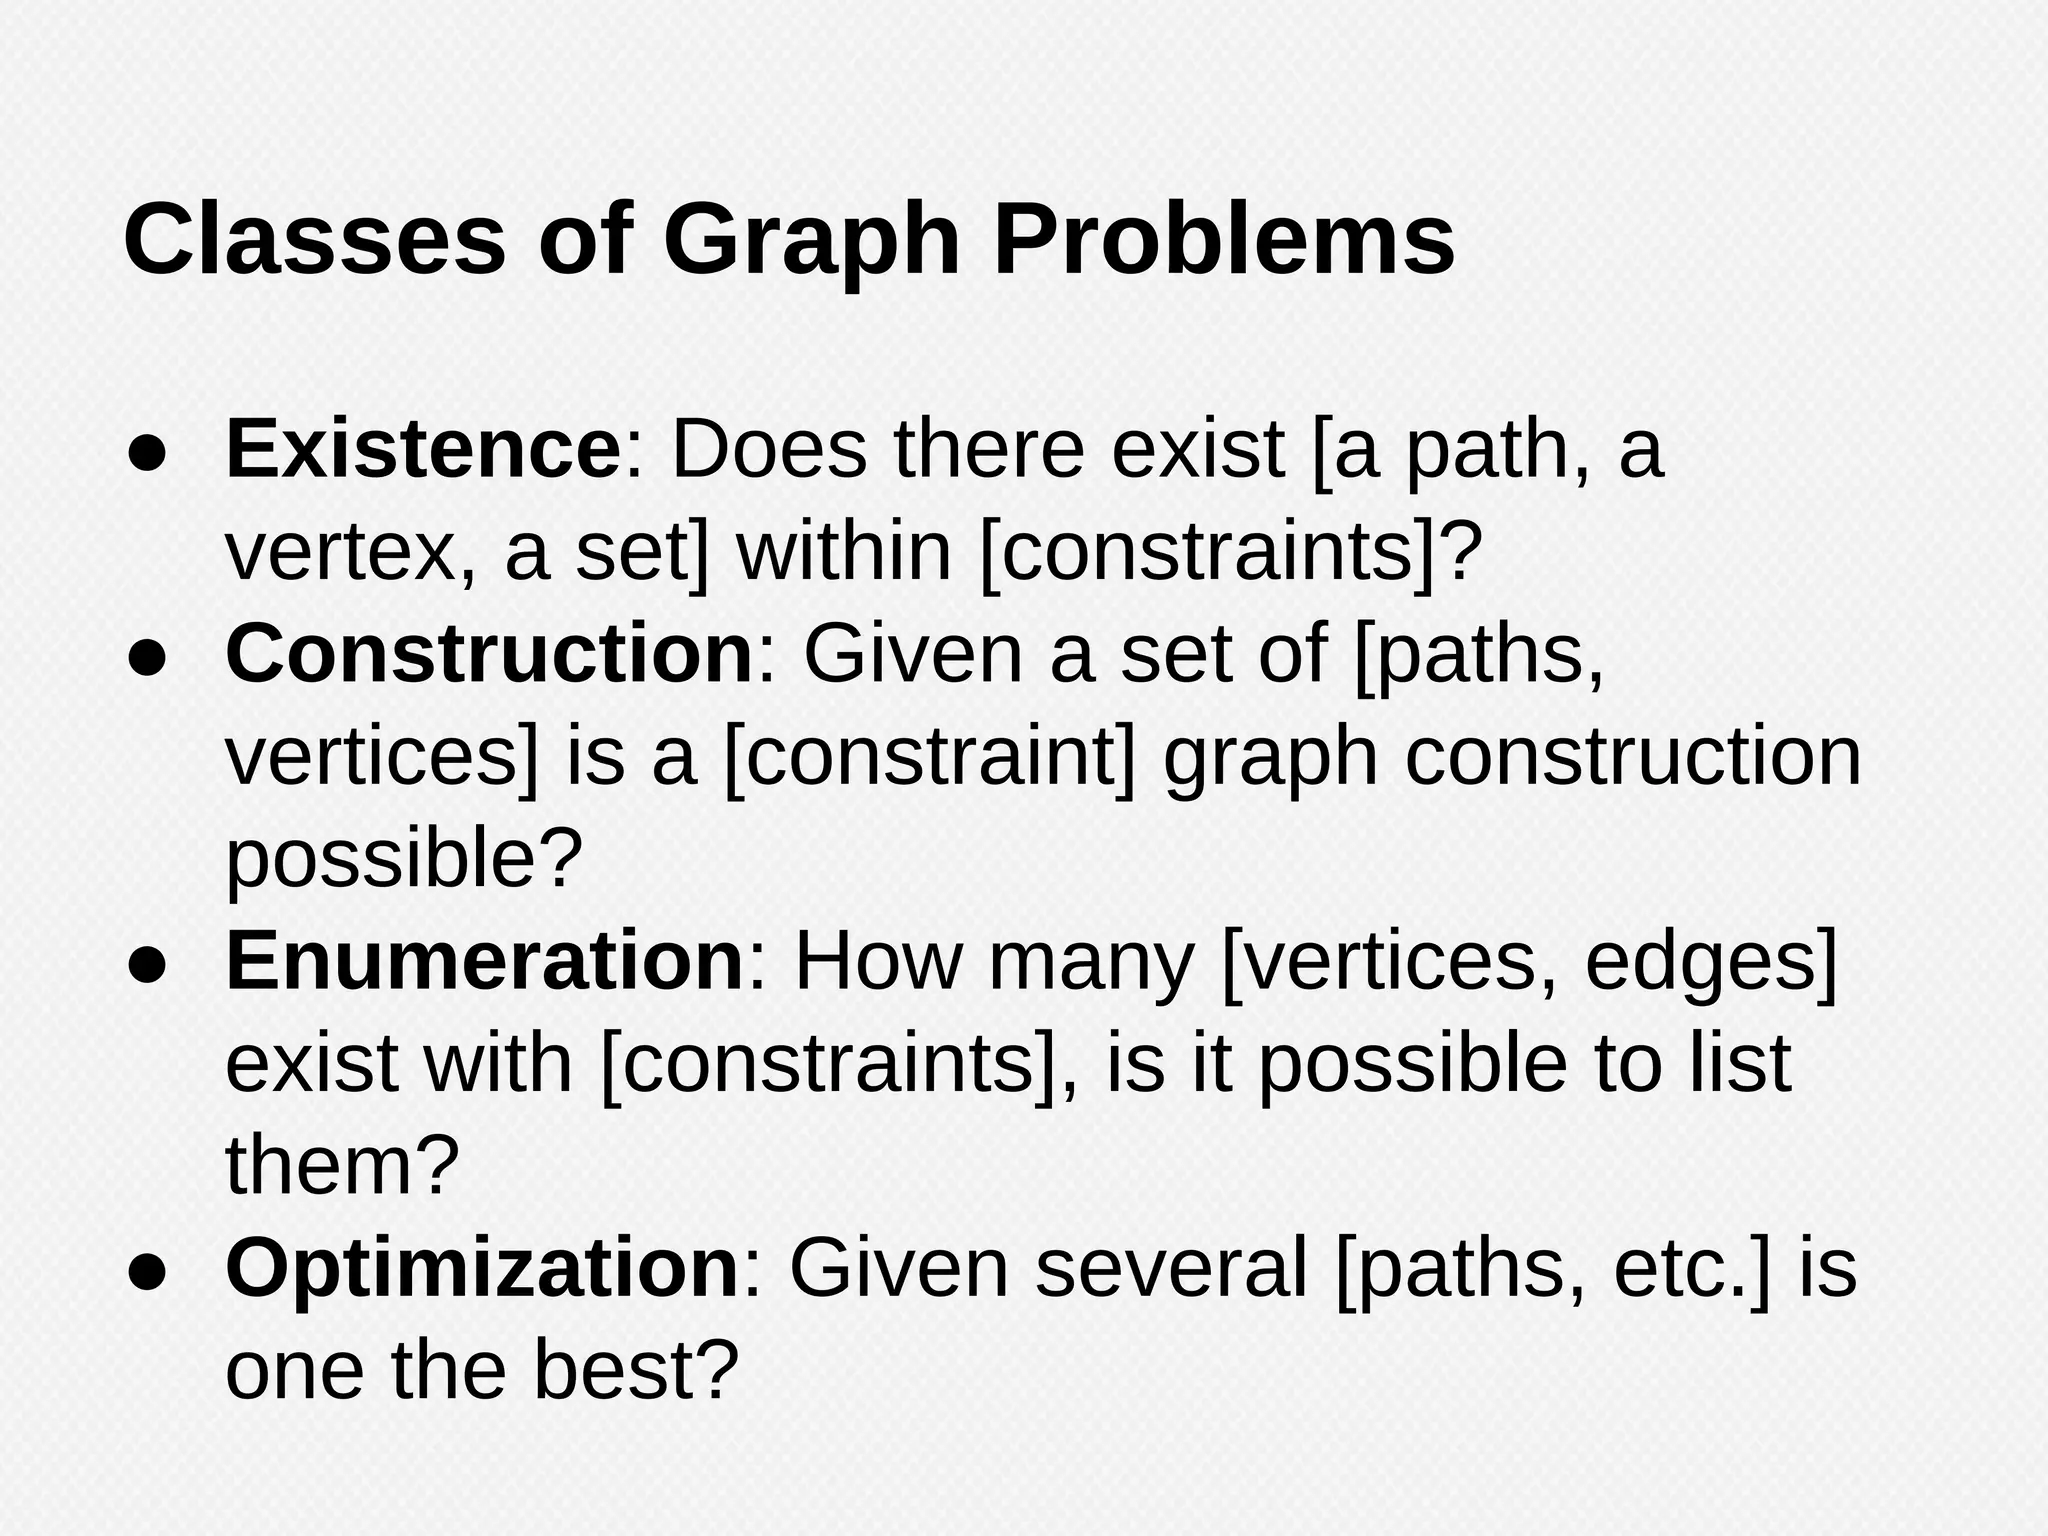
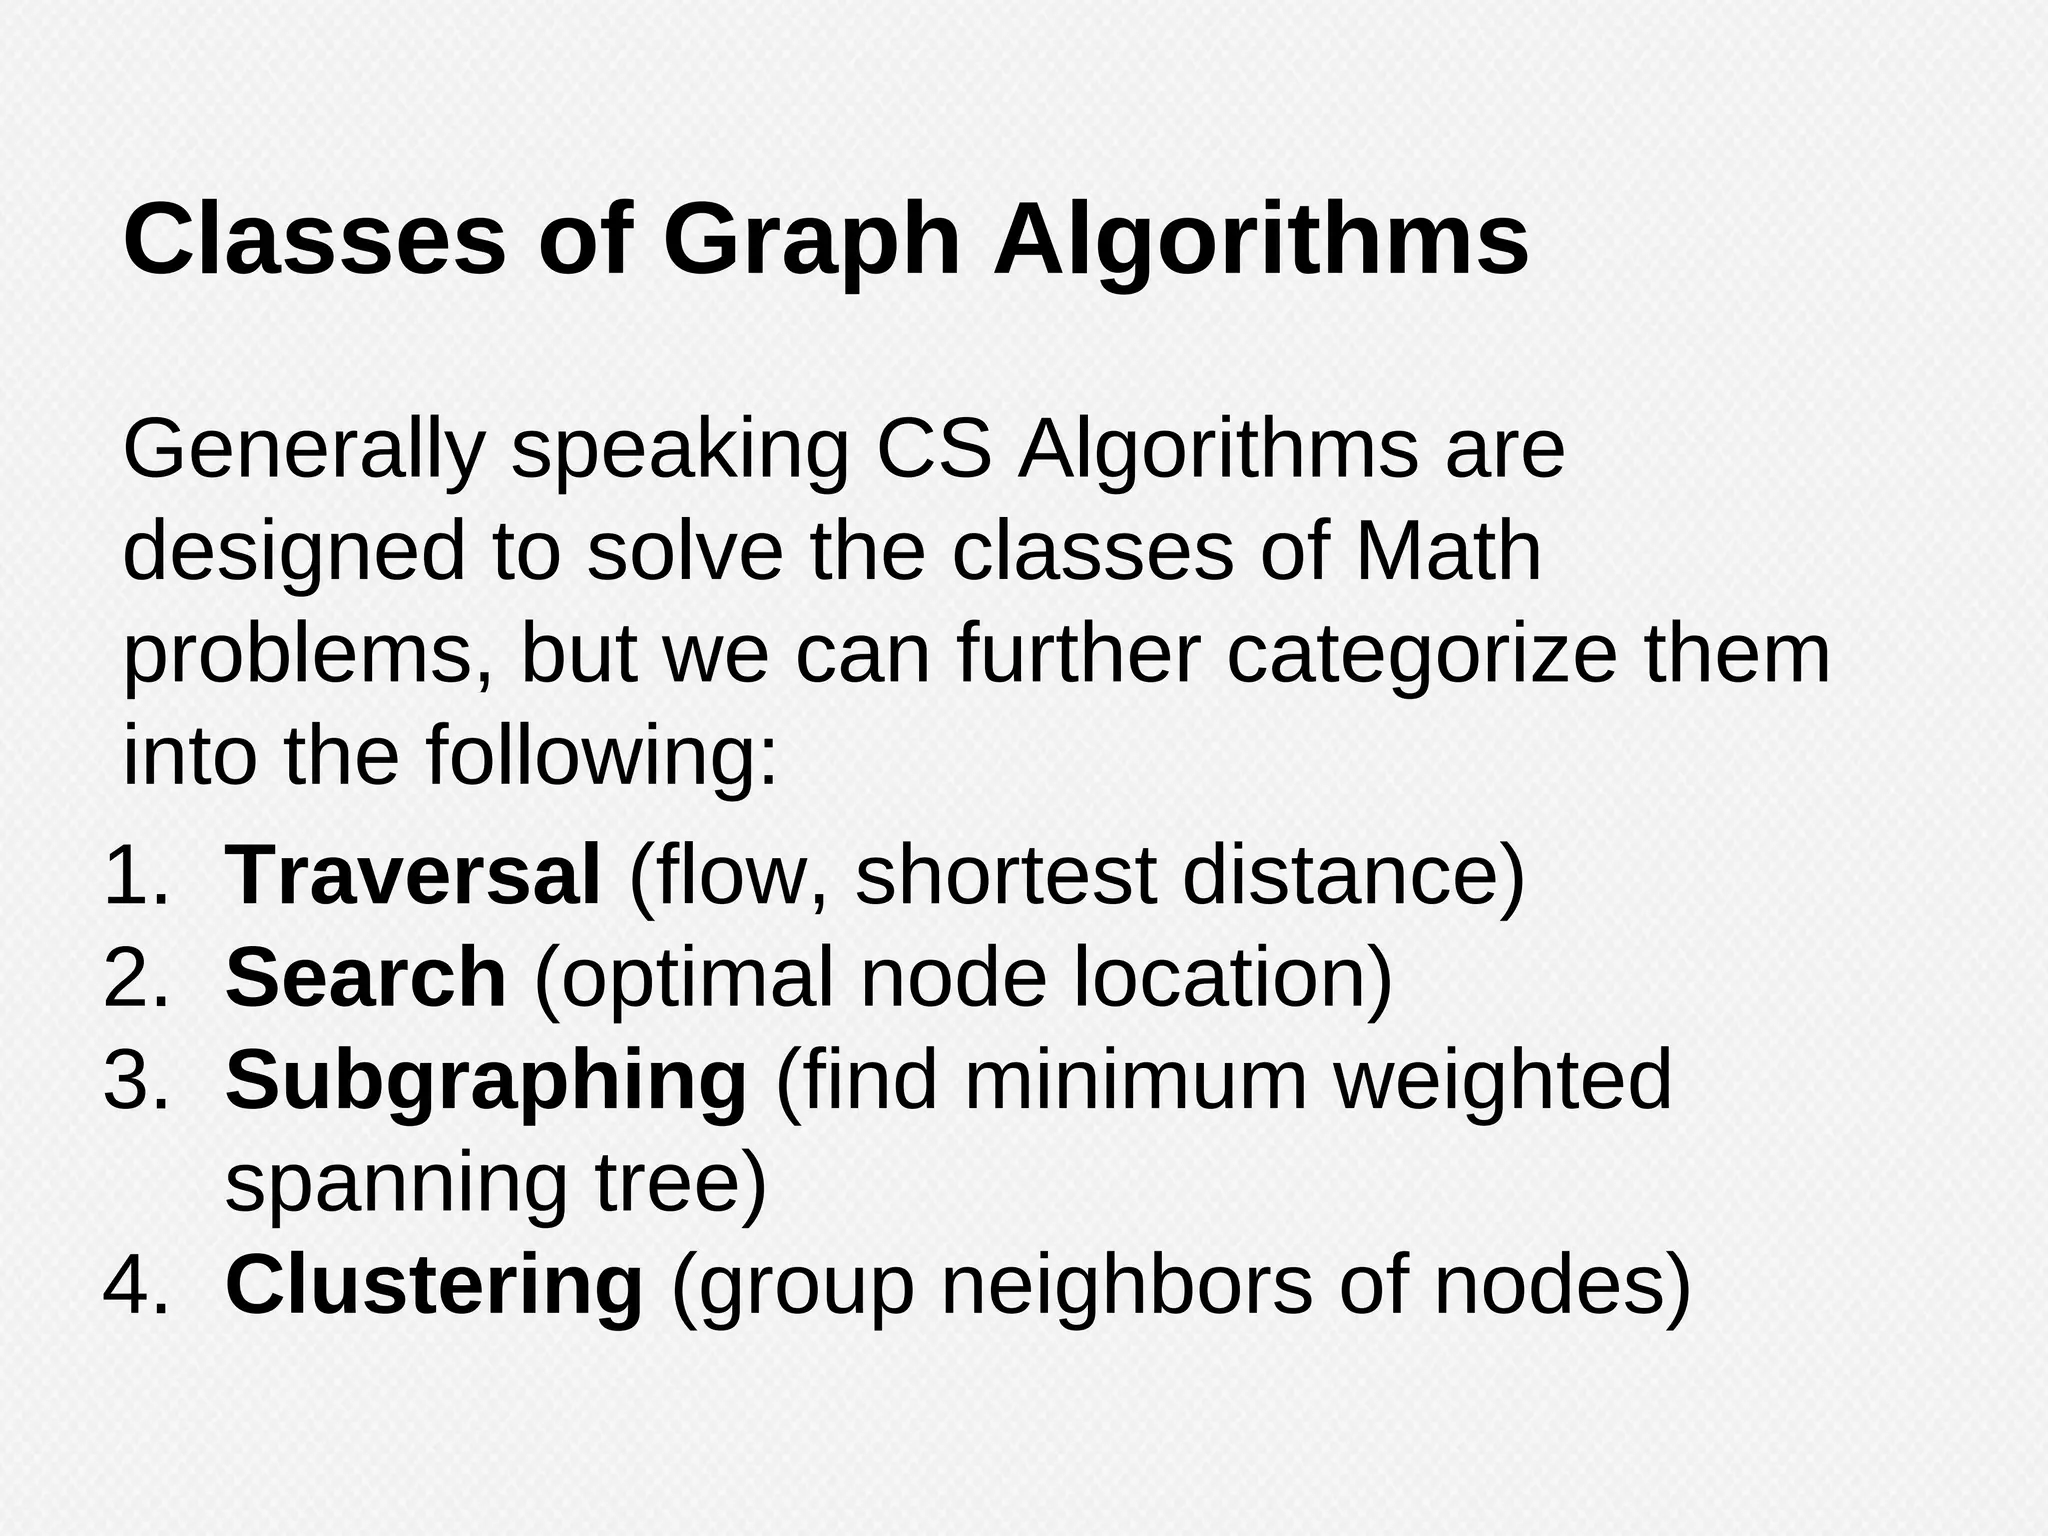
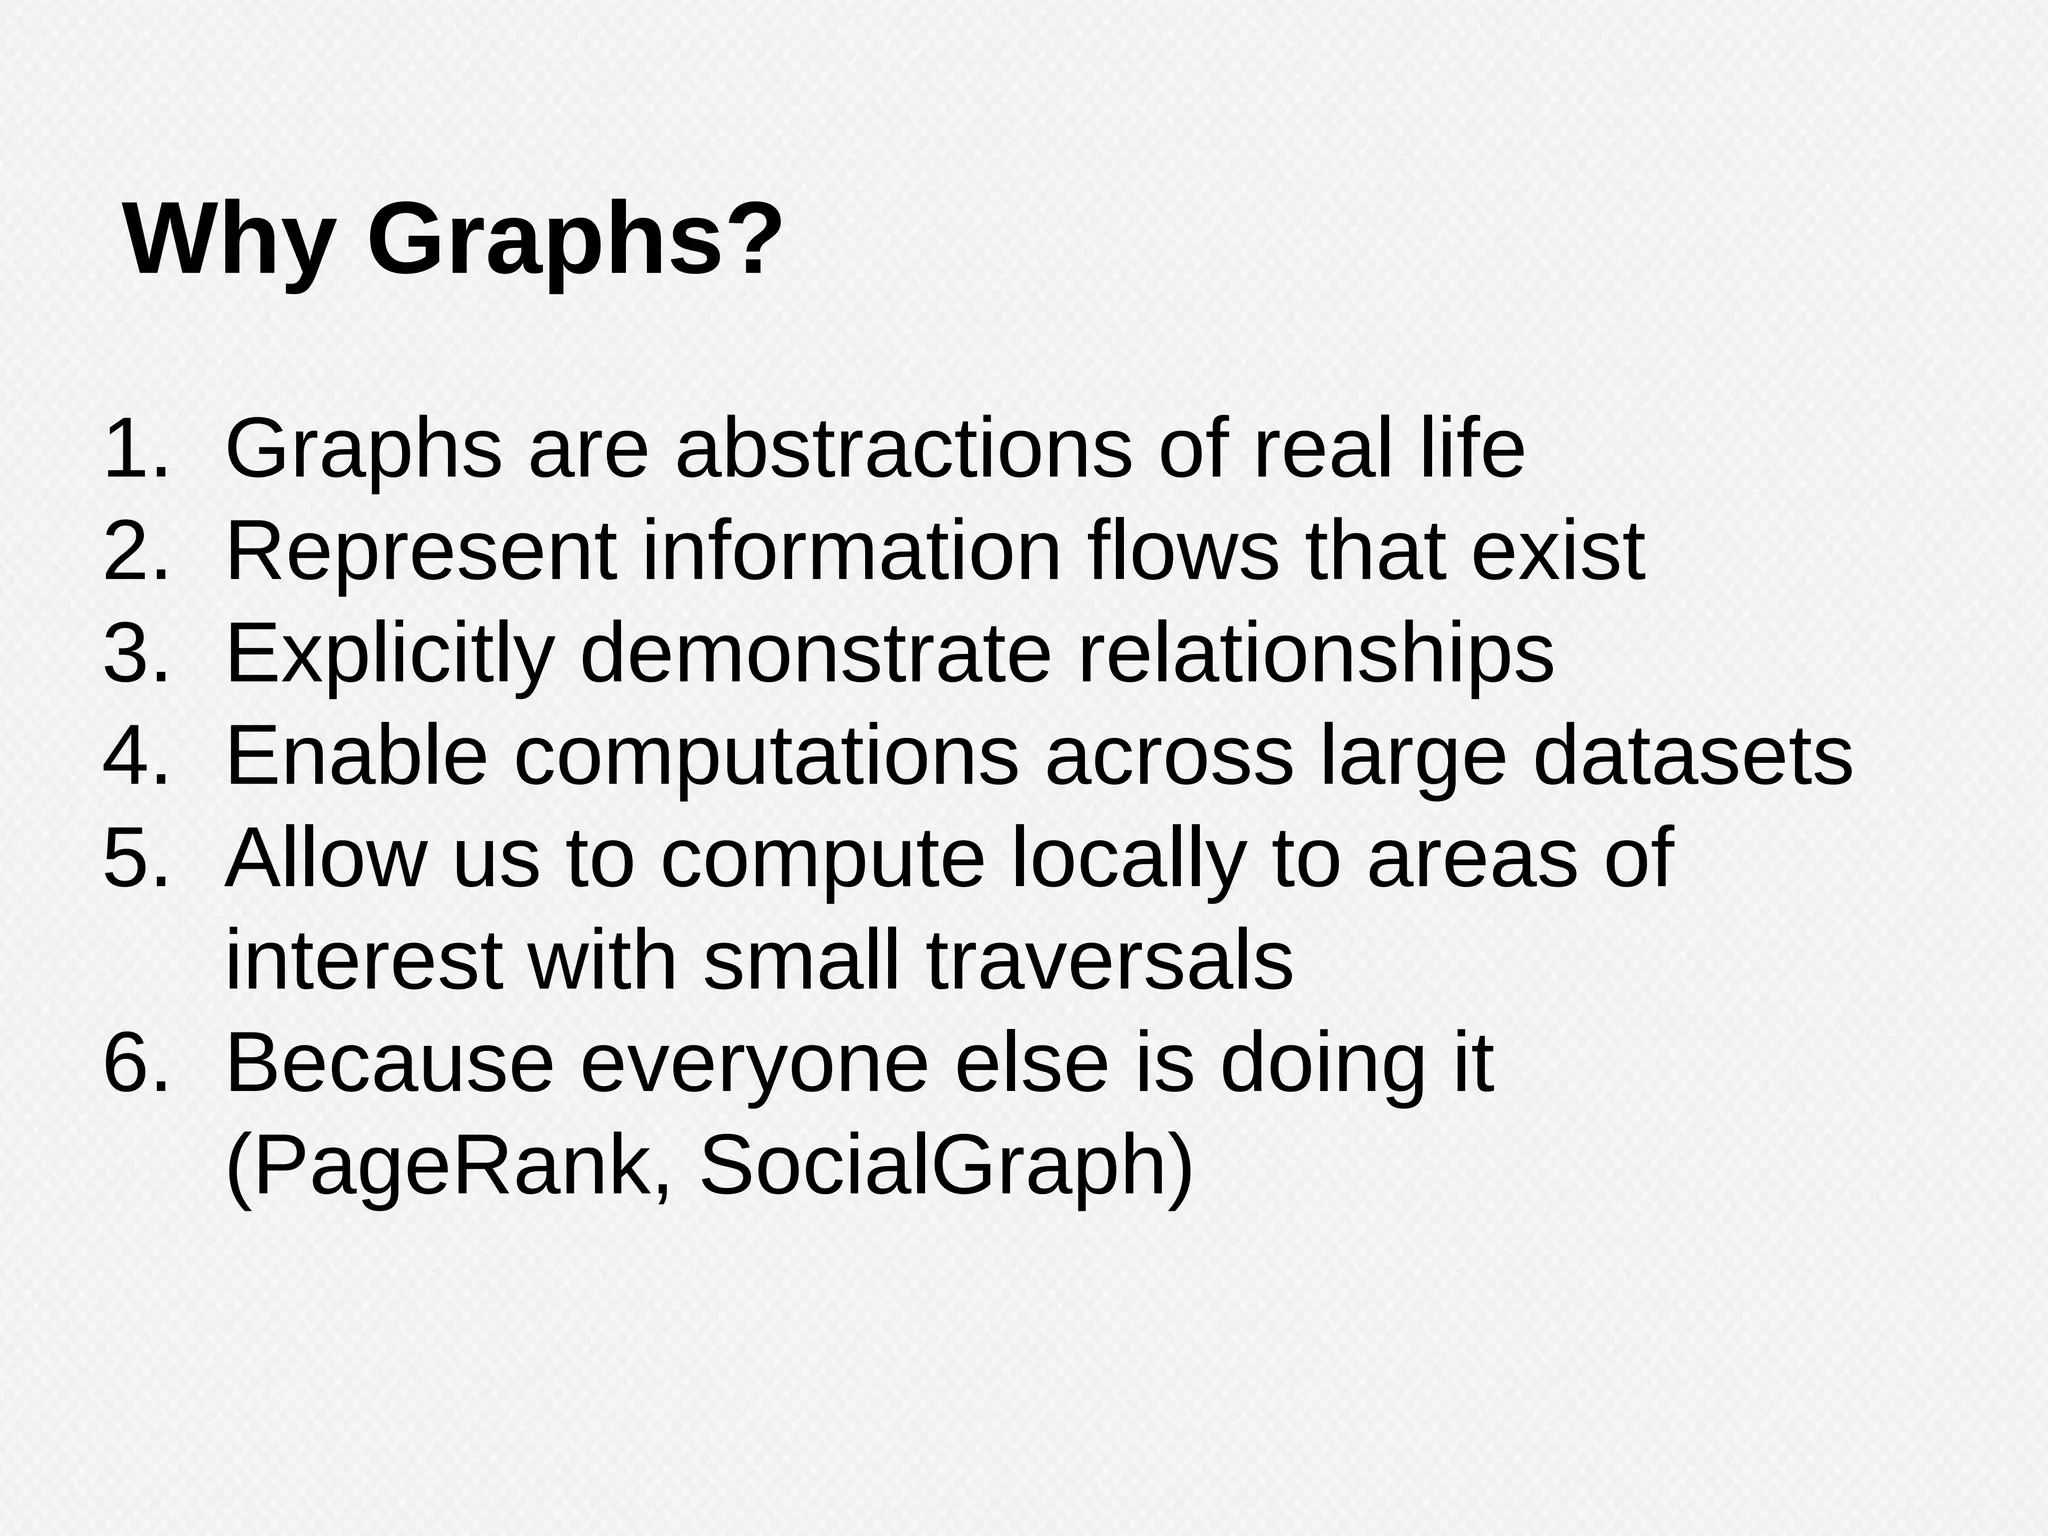
![● Existence: Does there exist [a path, a
vertex, a set] within [constraints]?
● Construction: Given a set of [paths,
vertices] is a [constraint] graph construction
possible?
● Enumeration: How many [vertices, edges]
exist with [constraints], is it possible to list
them?
● Optimization: Given several [paths, etc.] is
one the best?
Classes of Graph Analyses](https://image.slidesharecdn.com/socialnetworkanalysiswithpython-141121195454-conversion-gate02/75/Graph-Analyses-with-Python-and-NetworkX-41-2048.jpg)


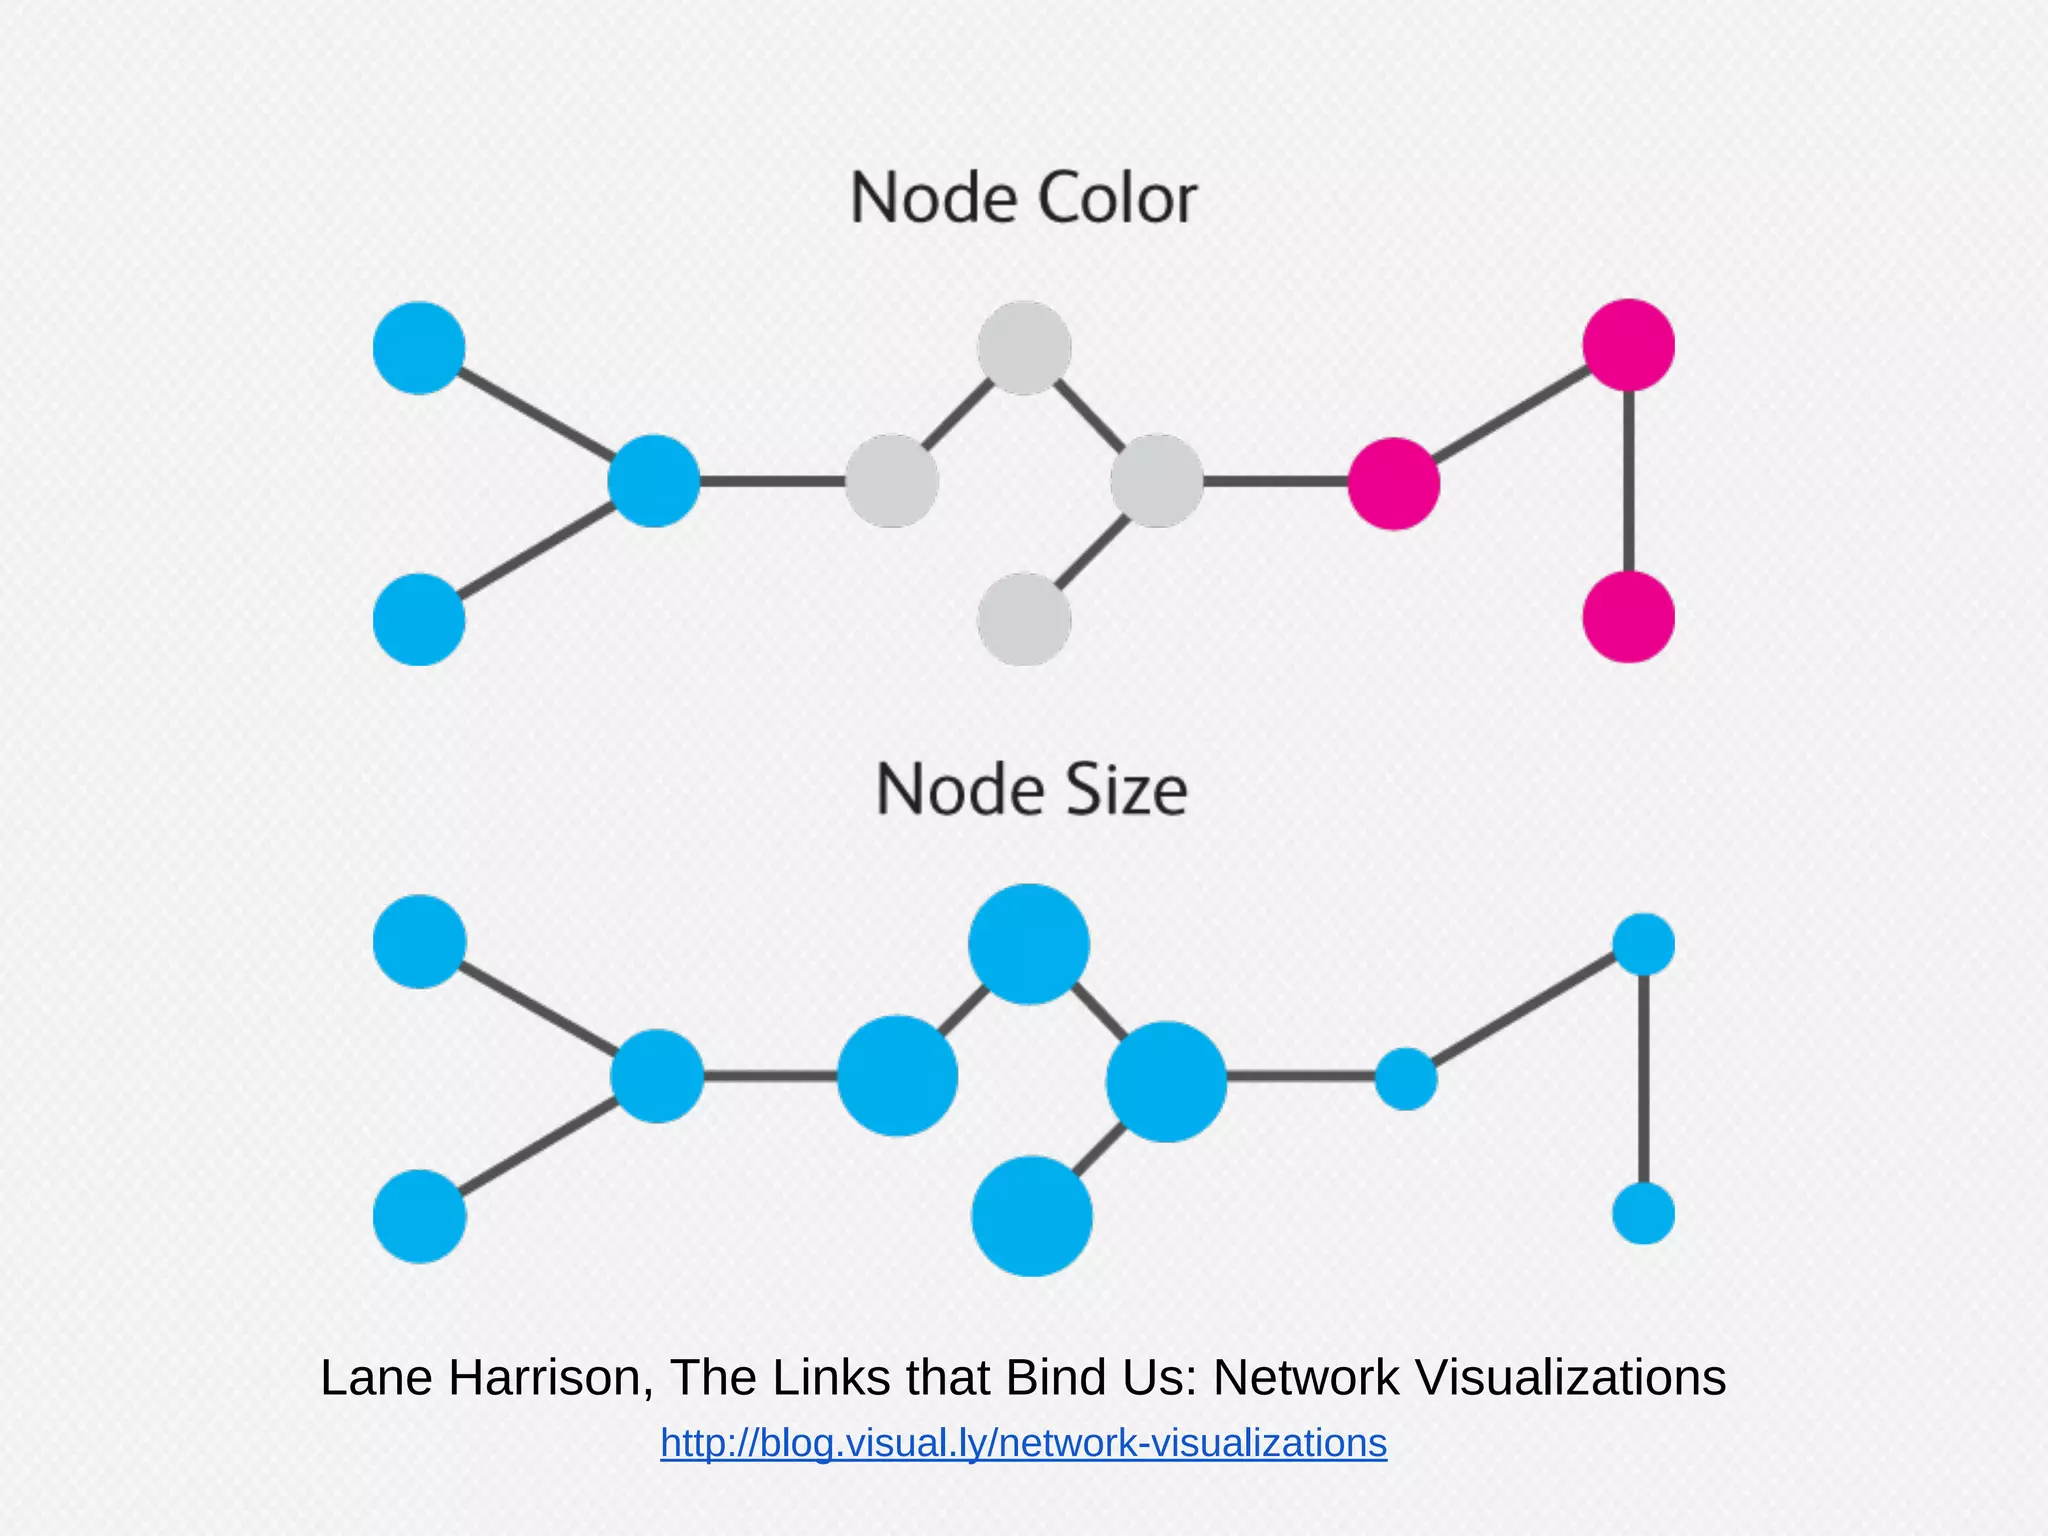
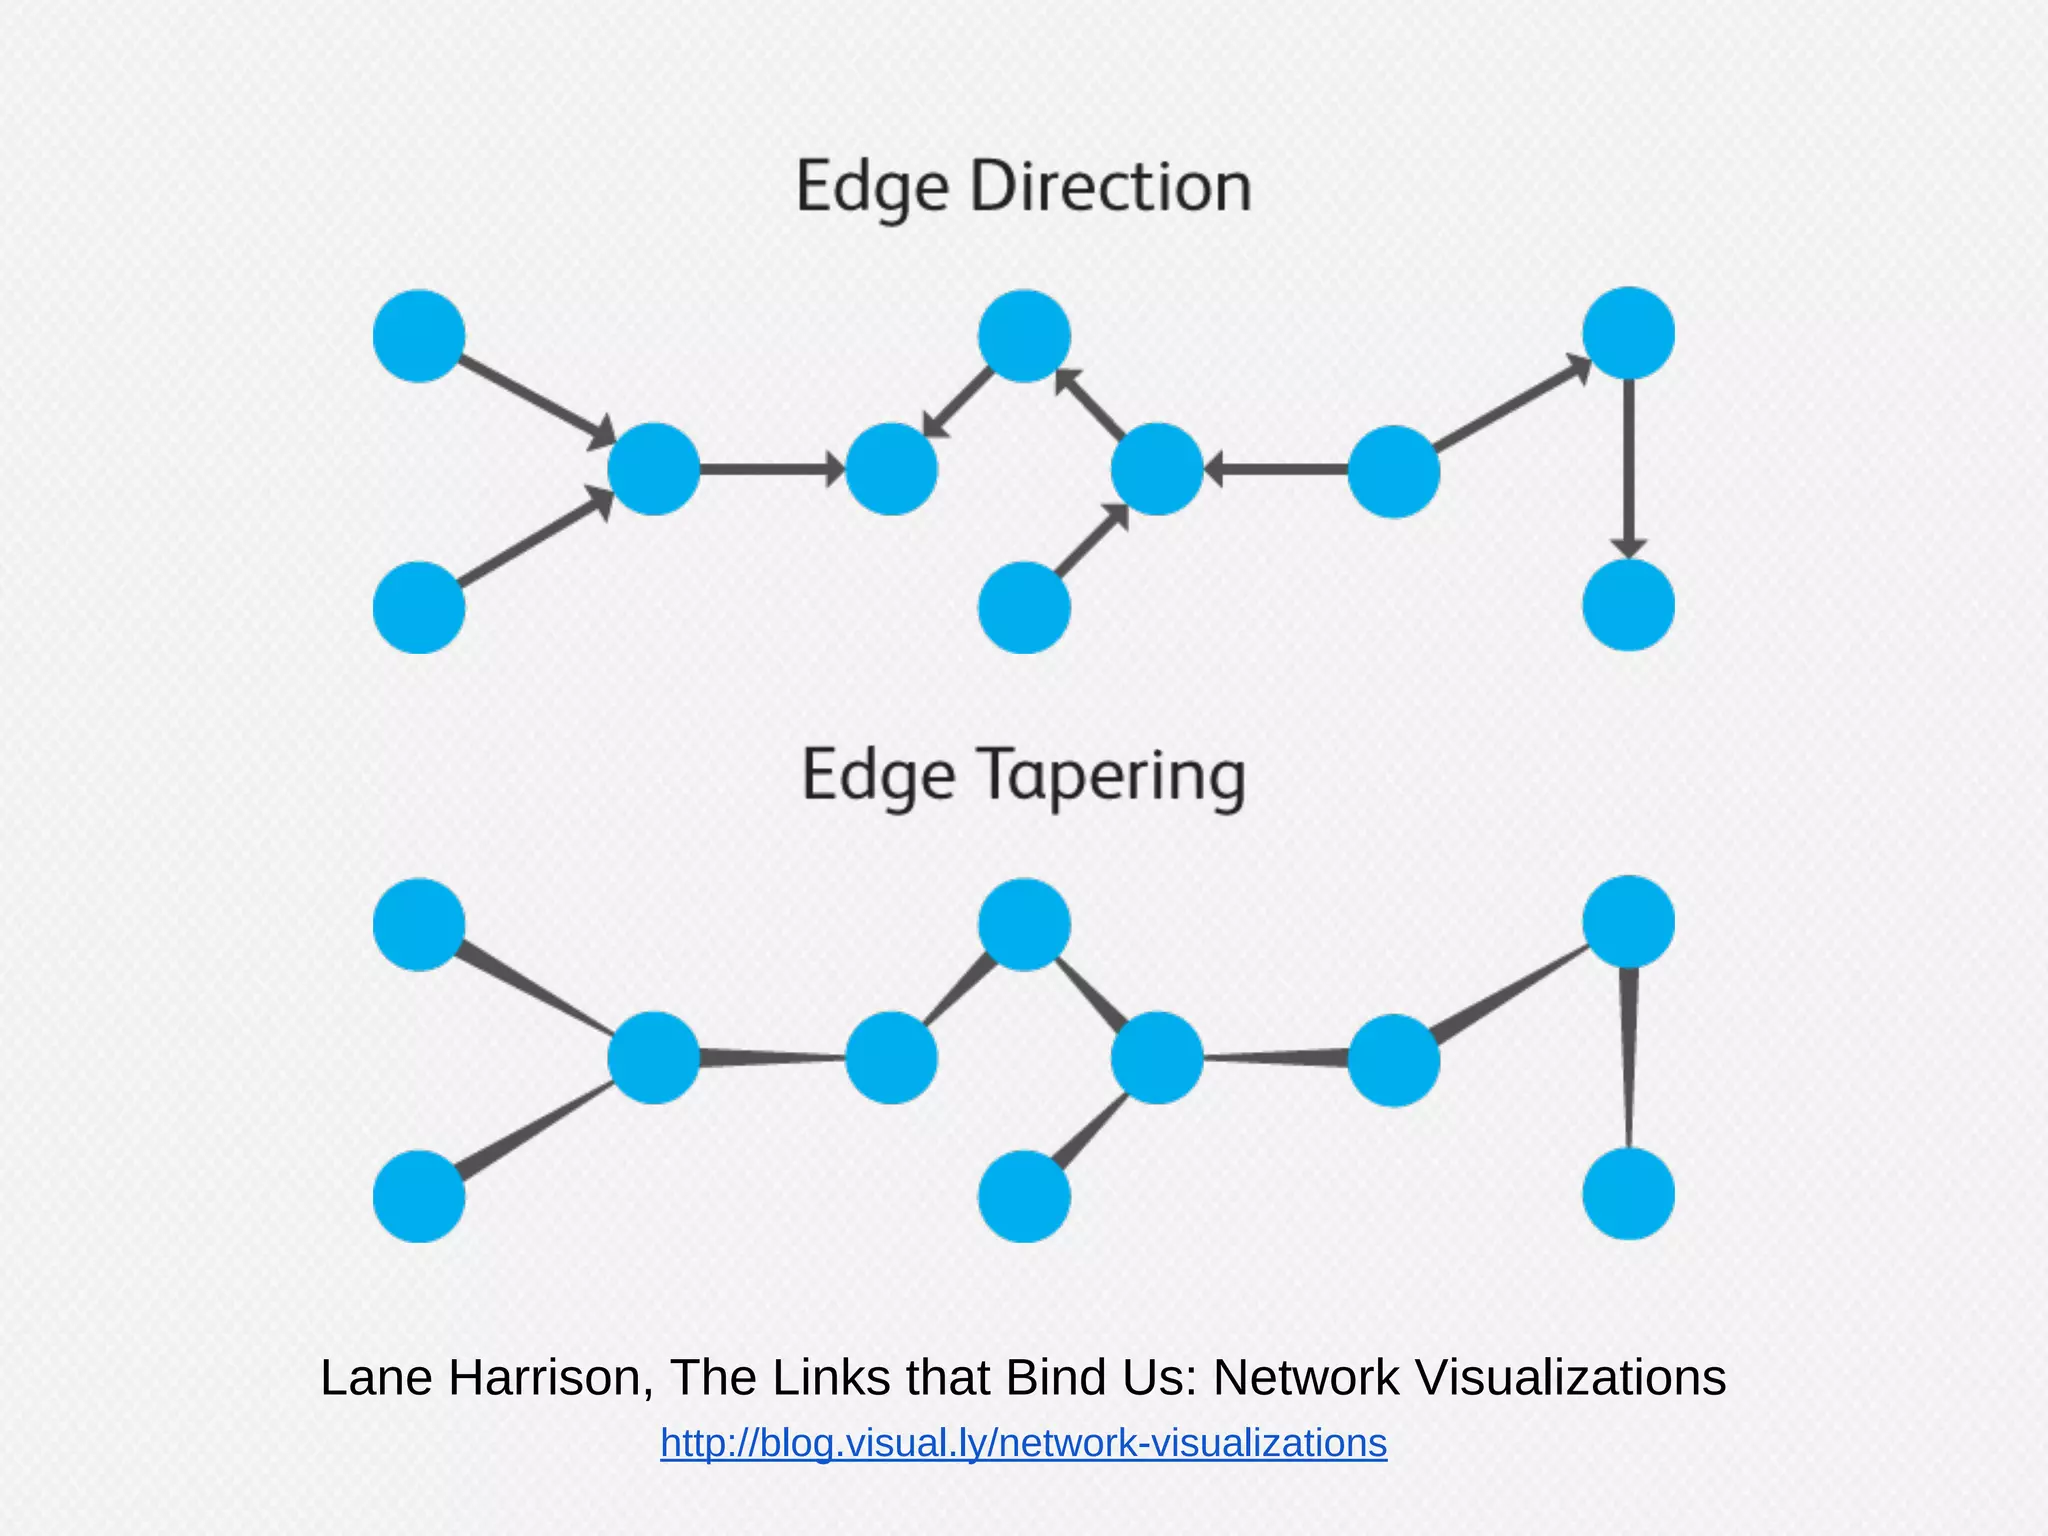

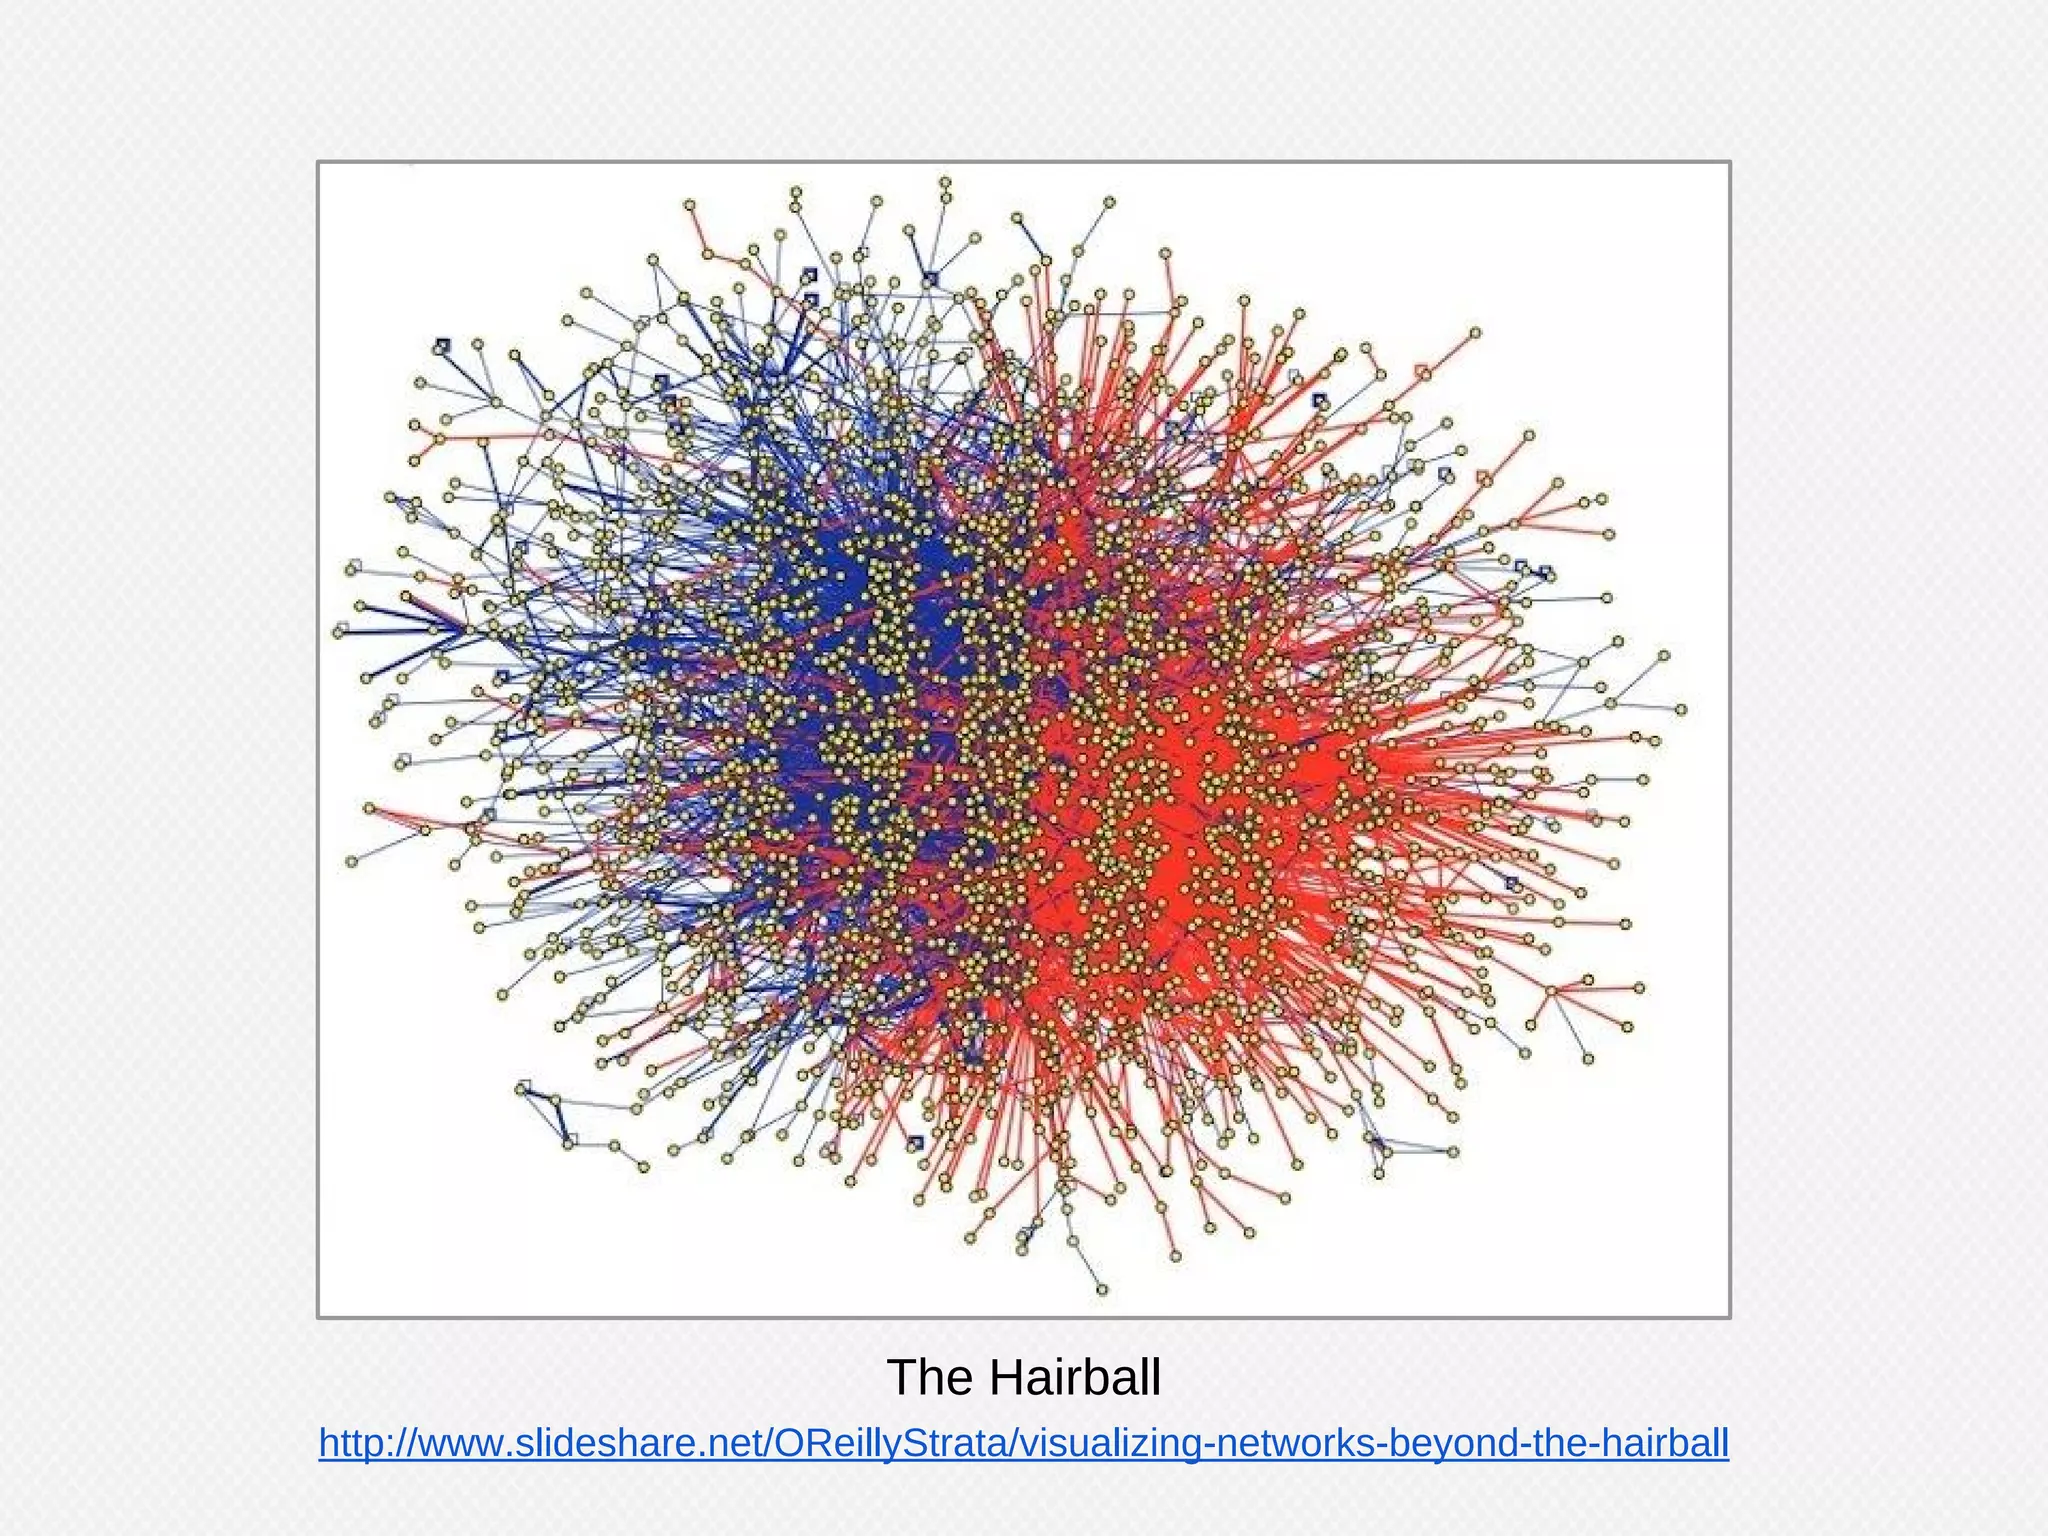

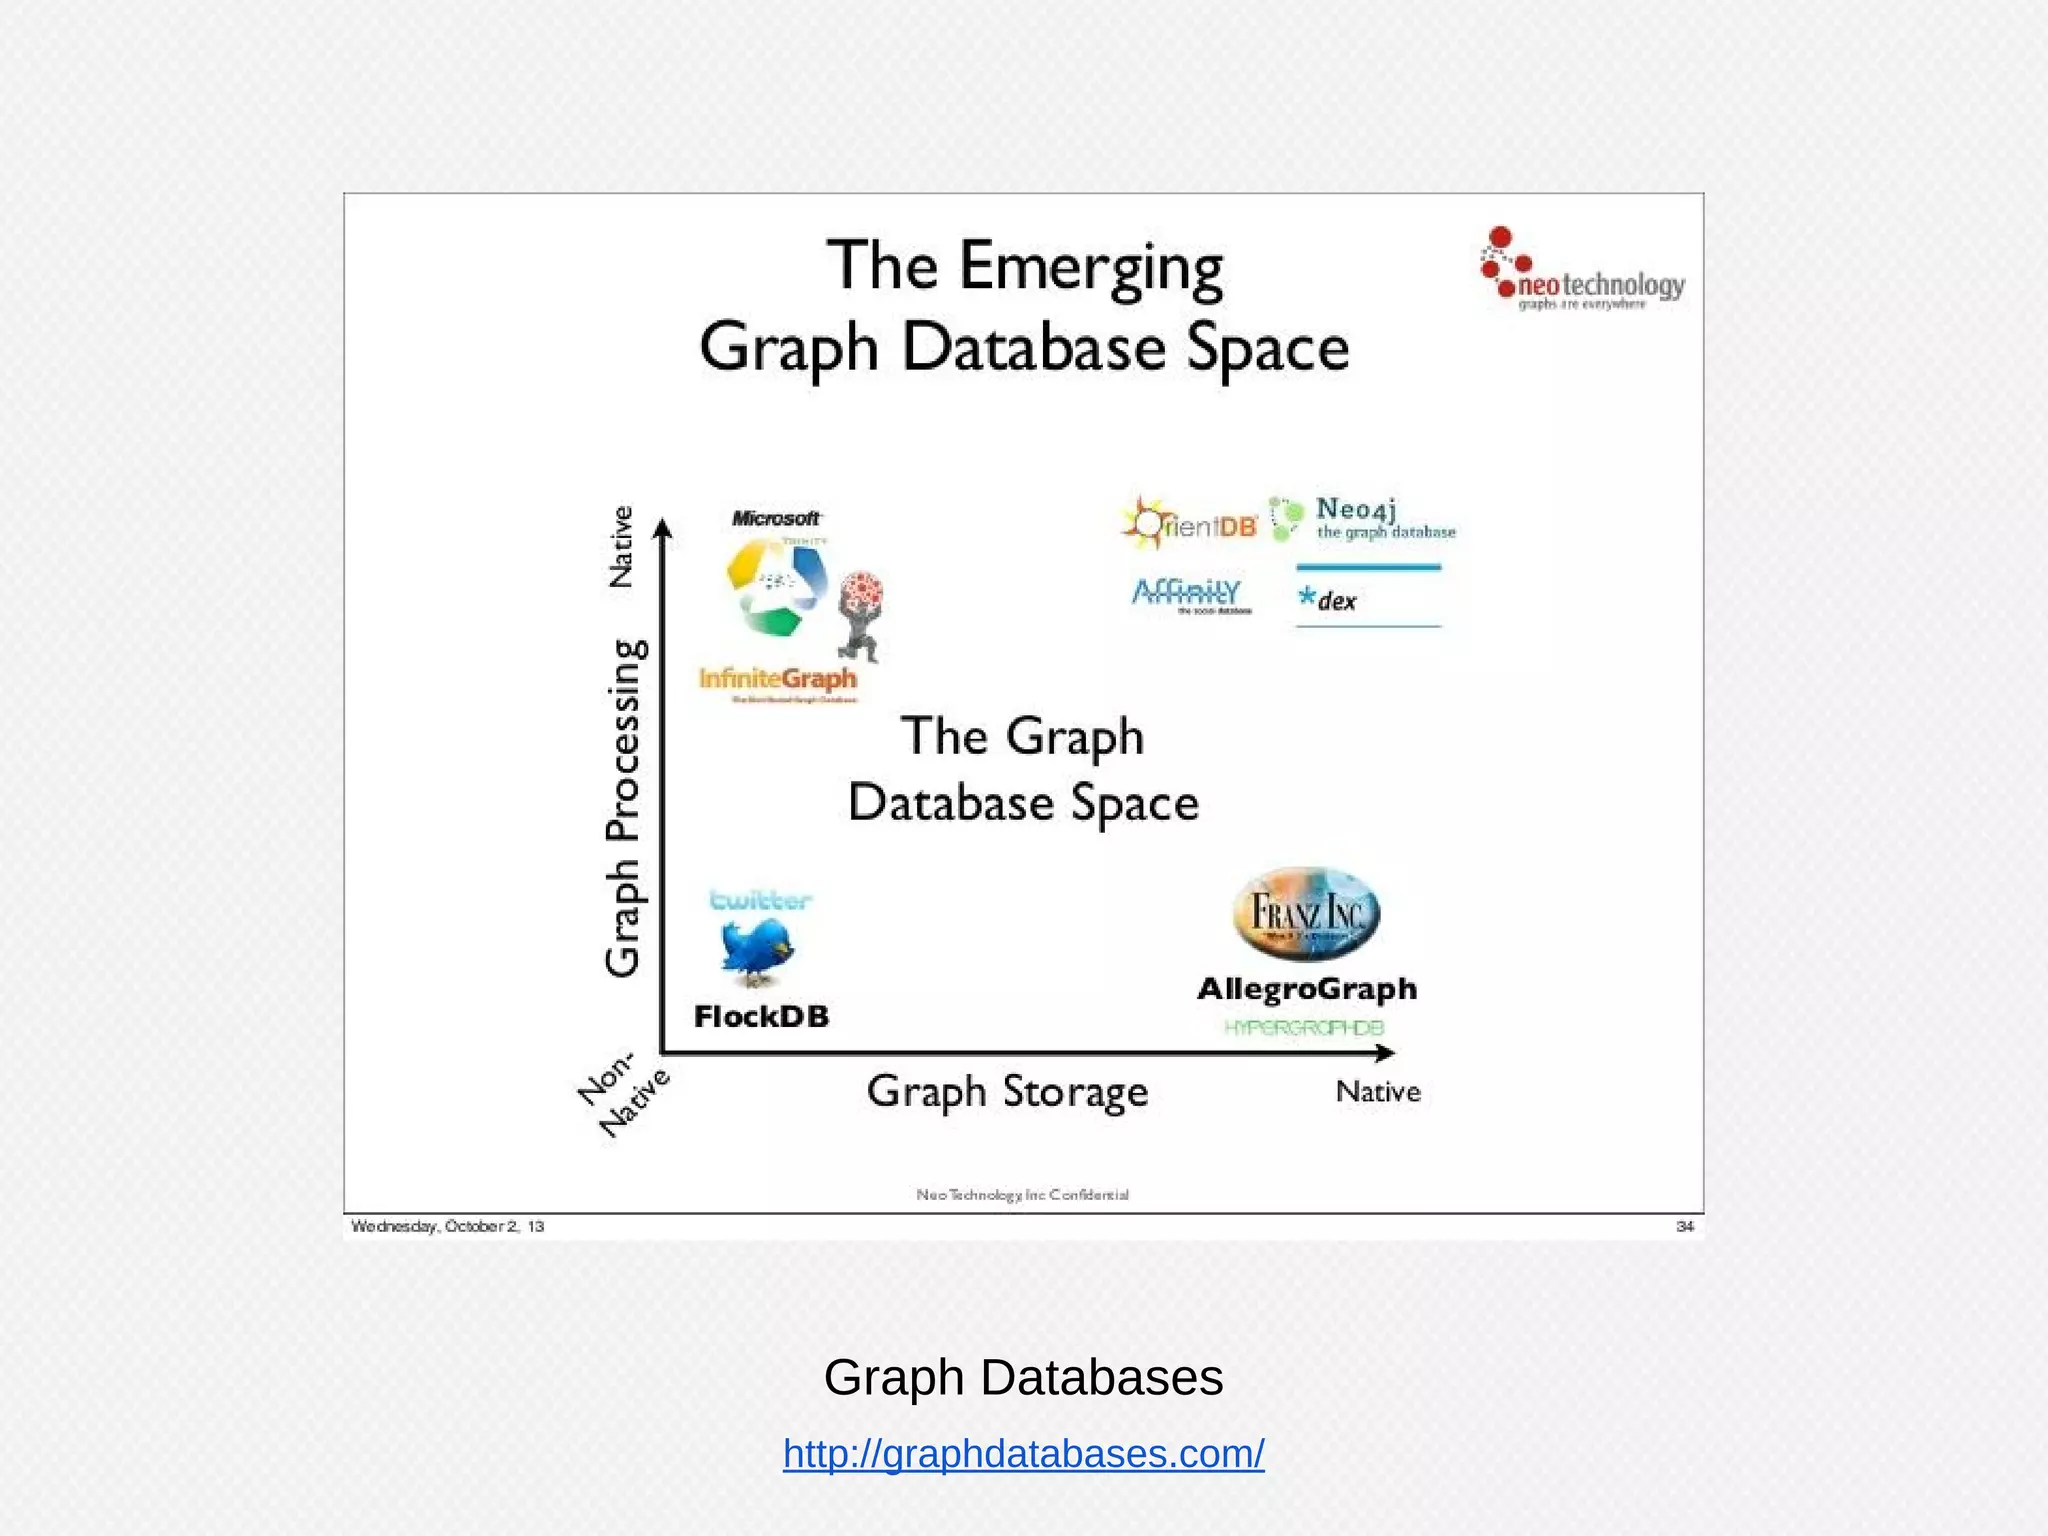


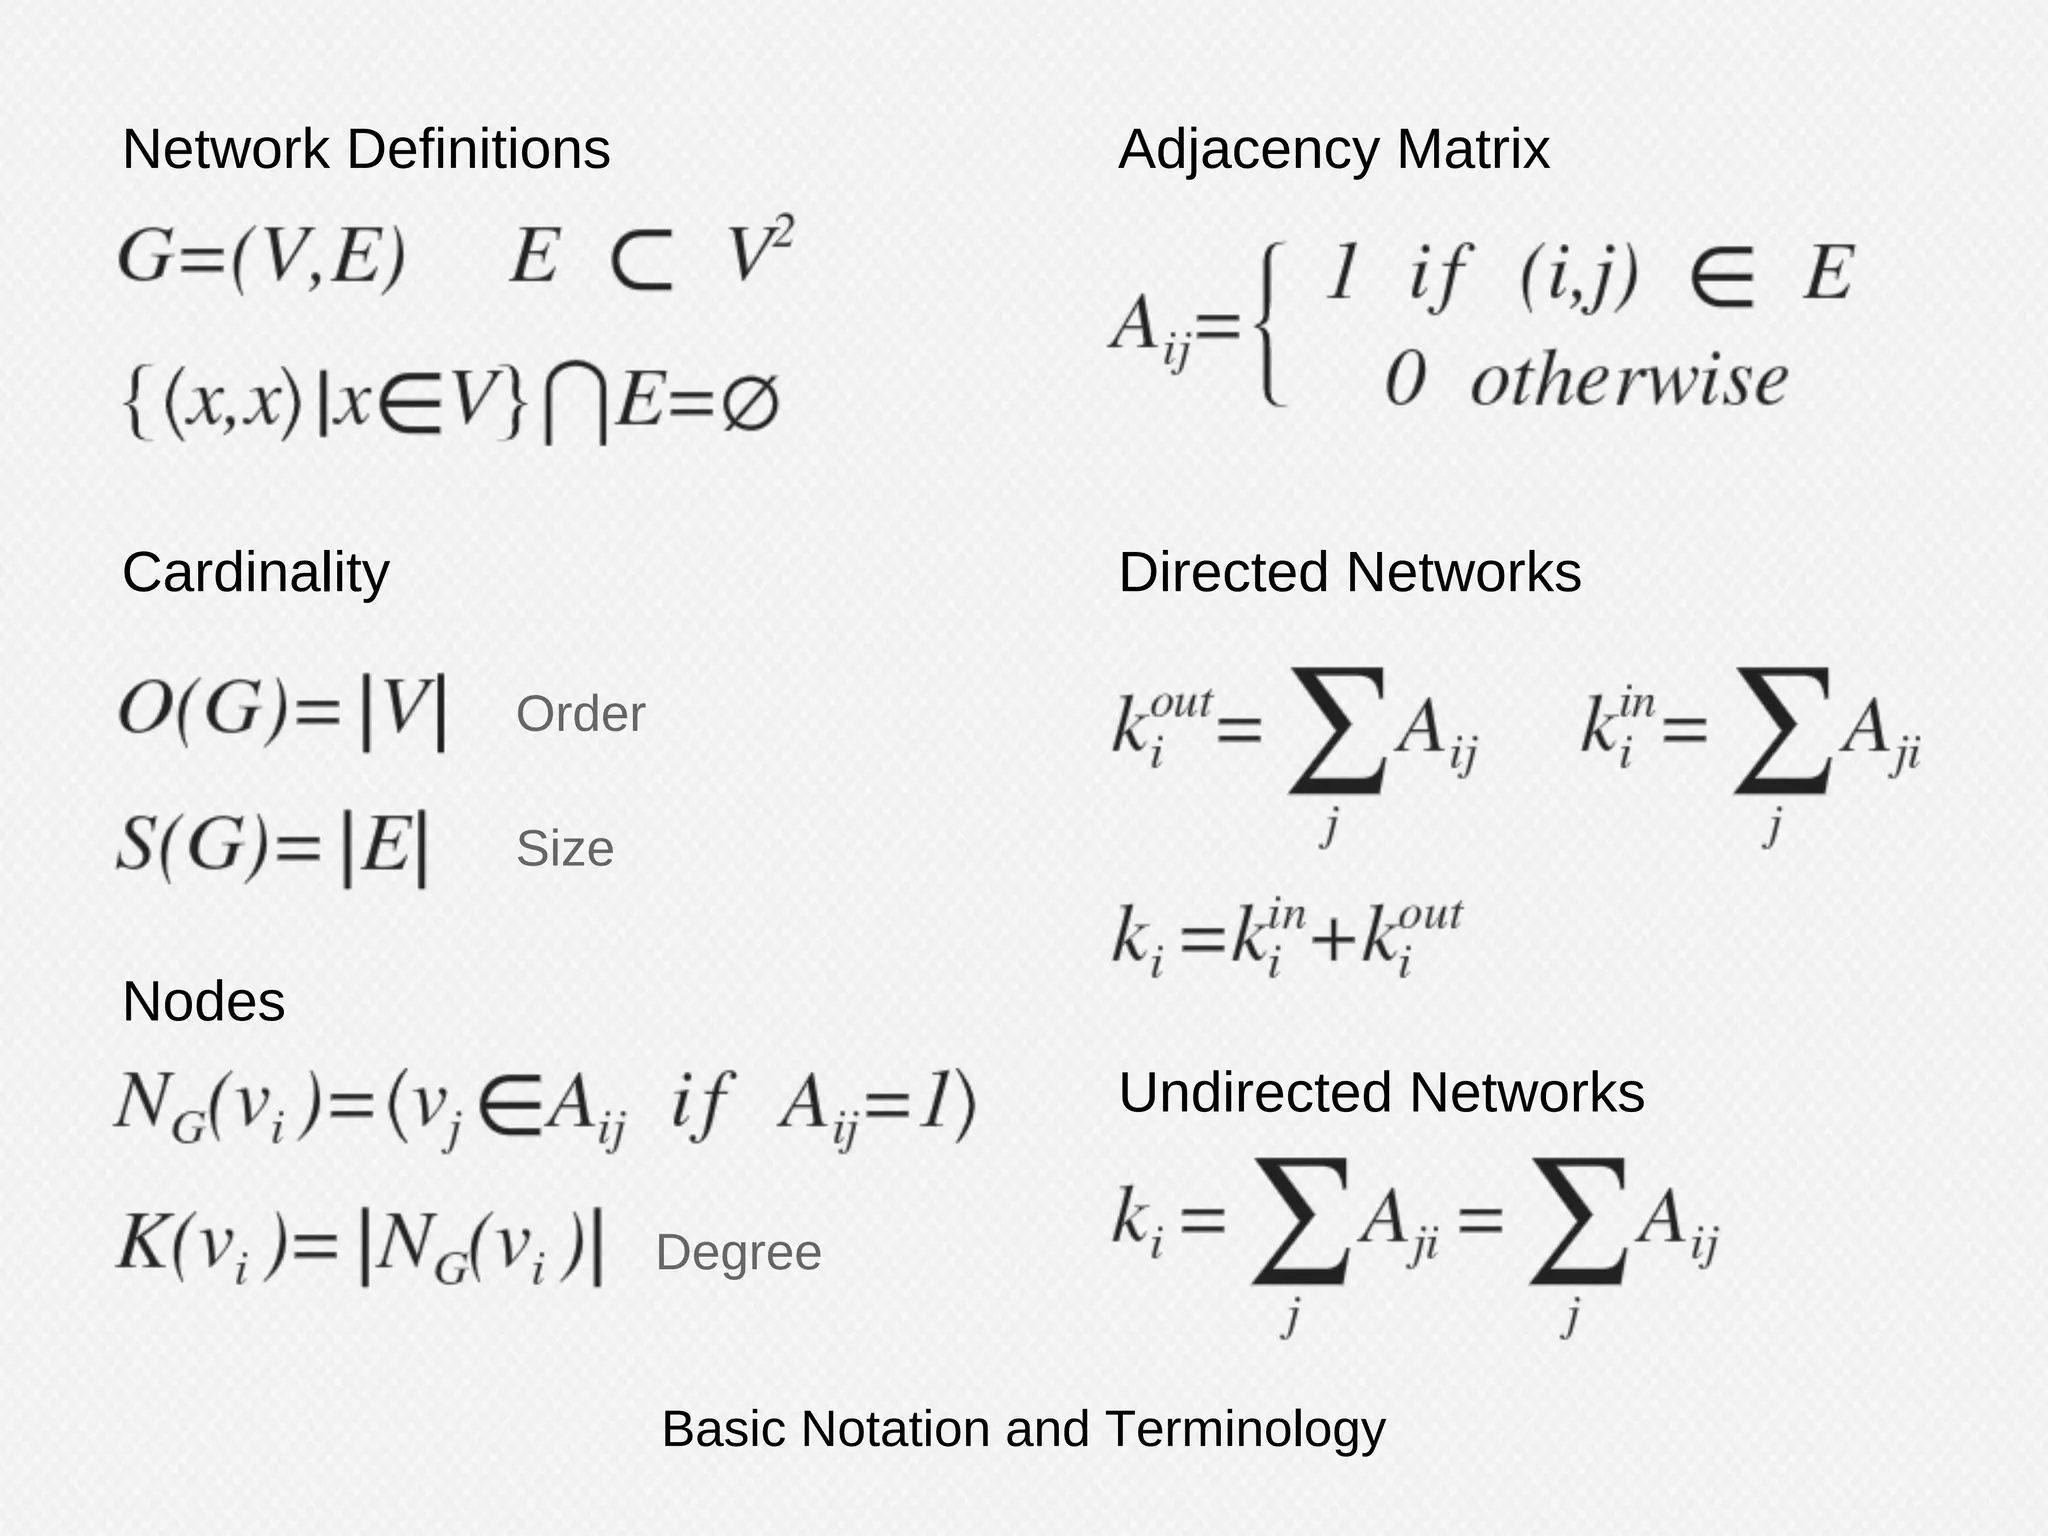
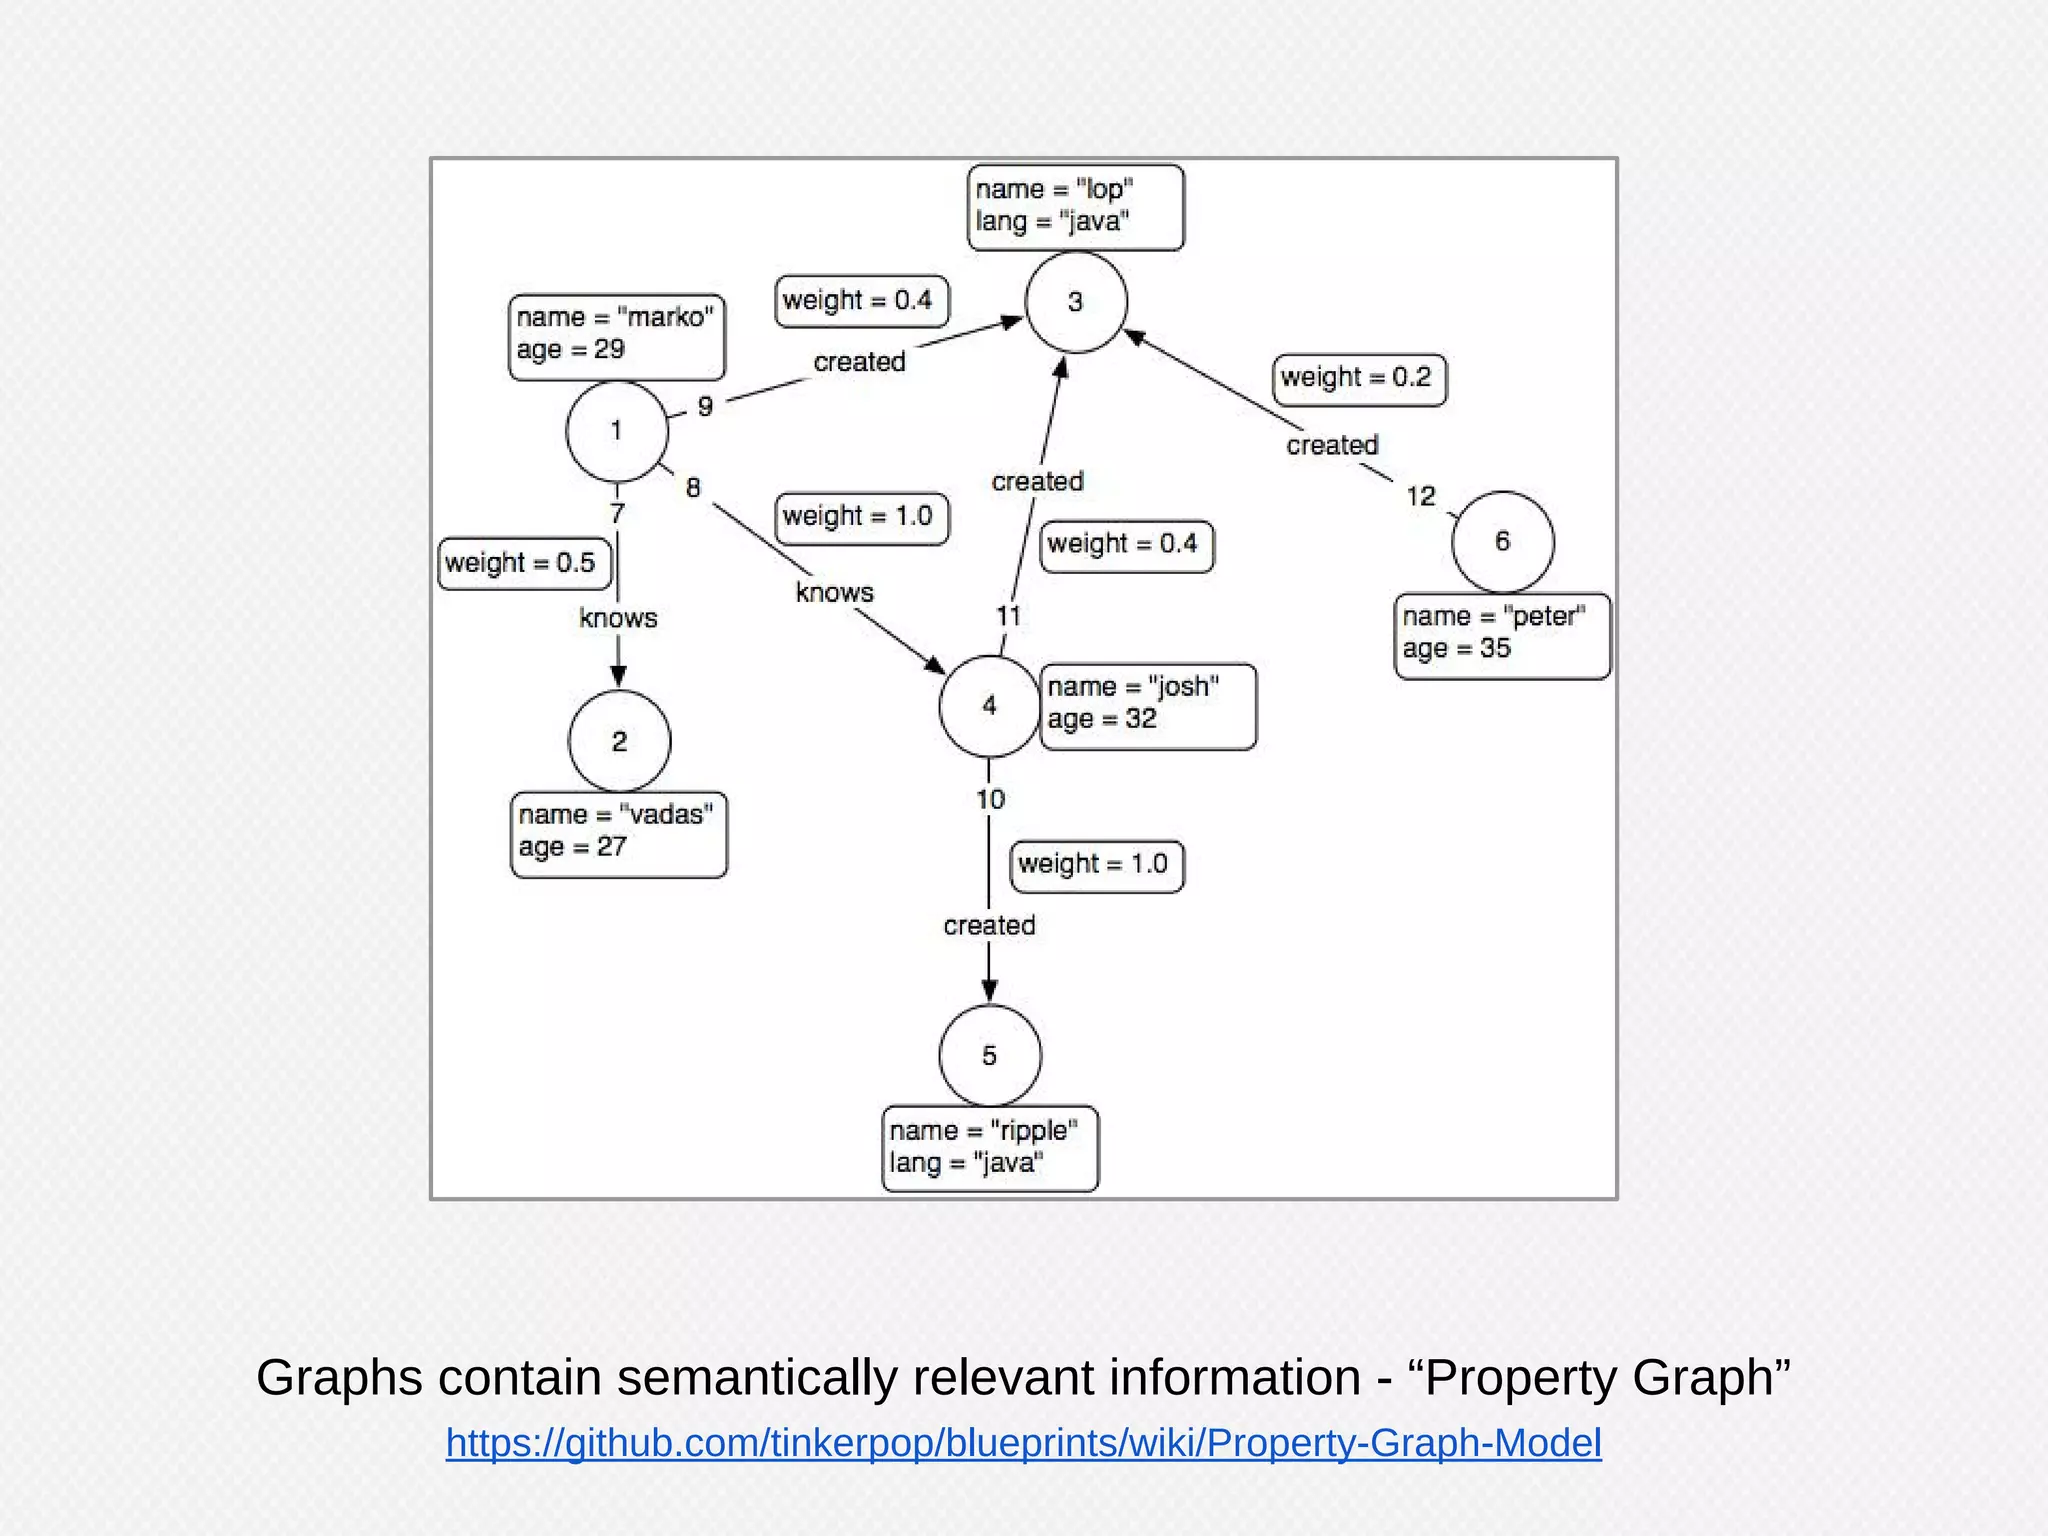
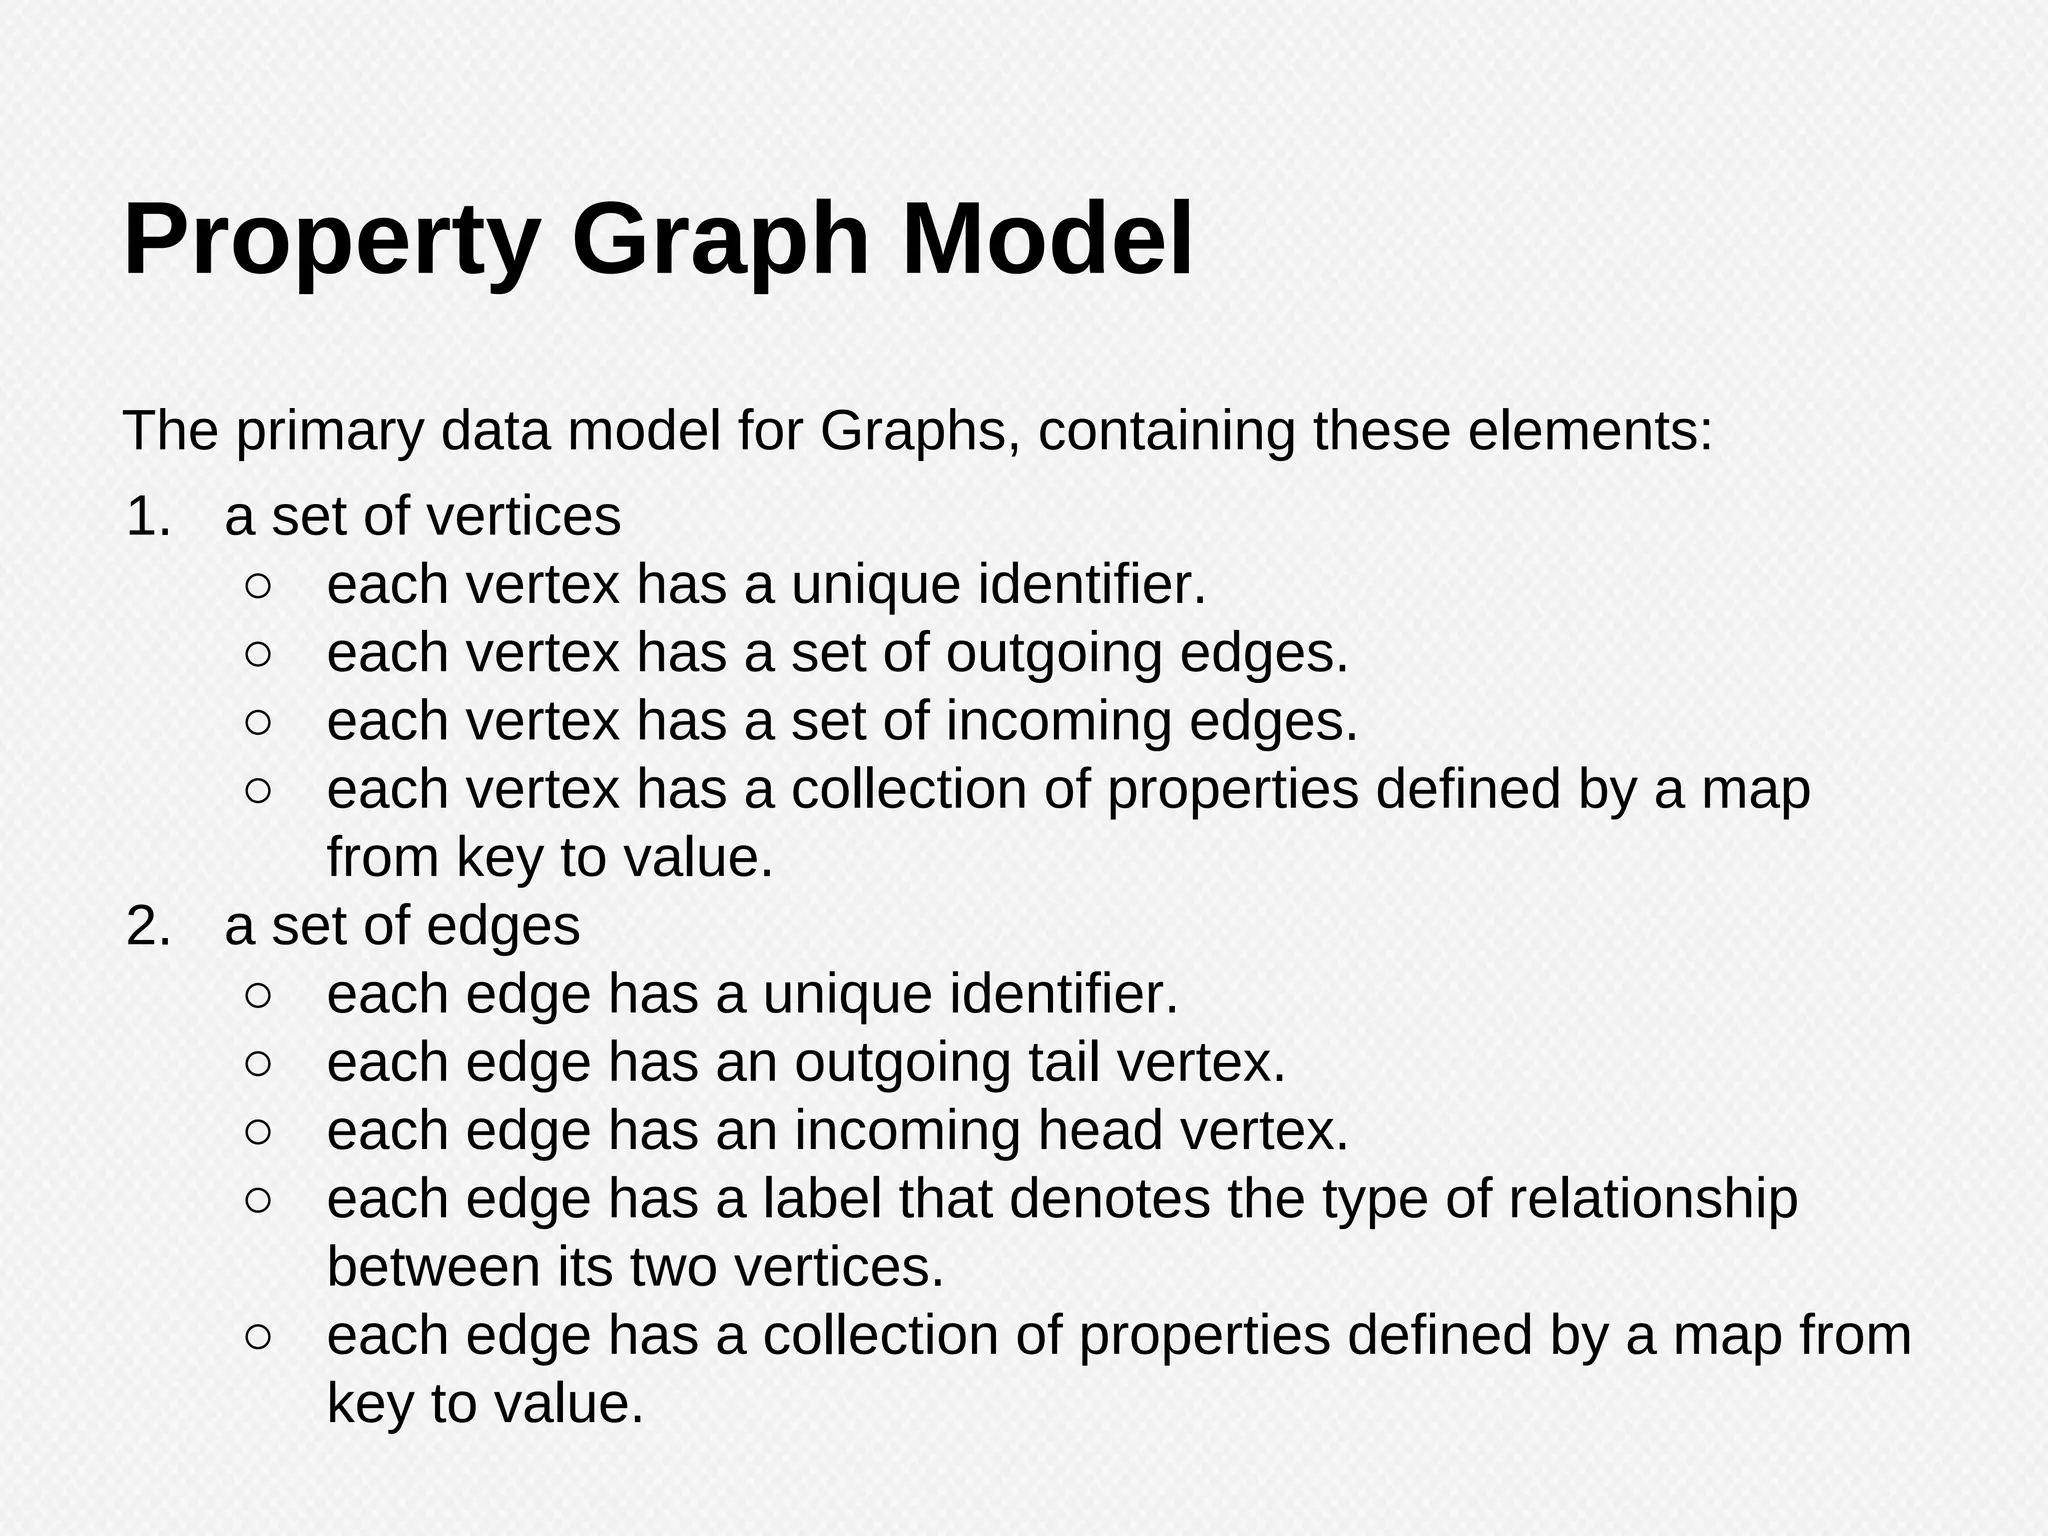
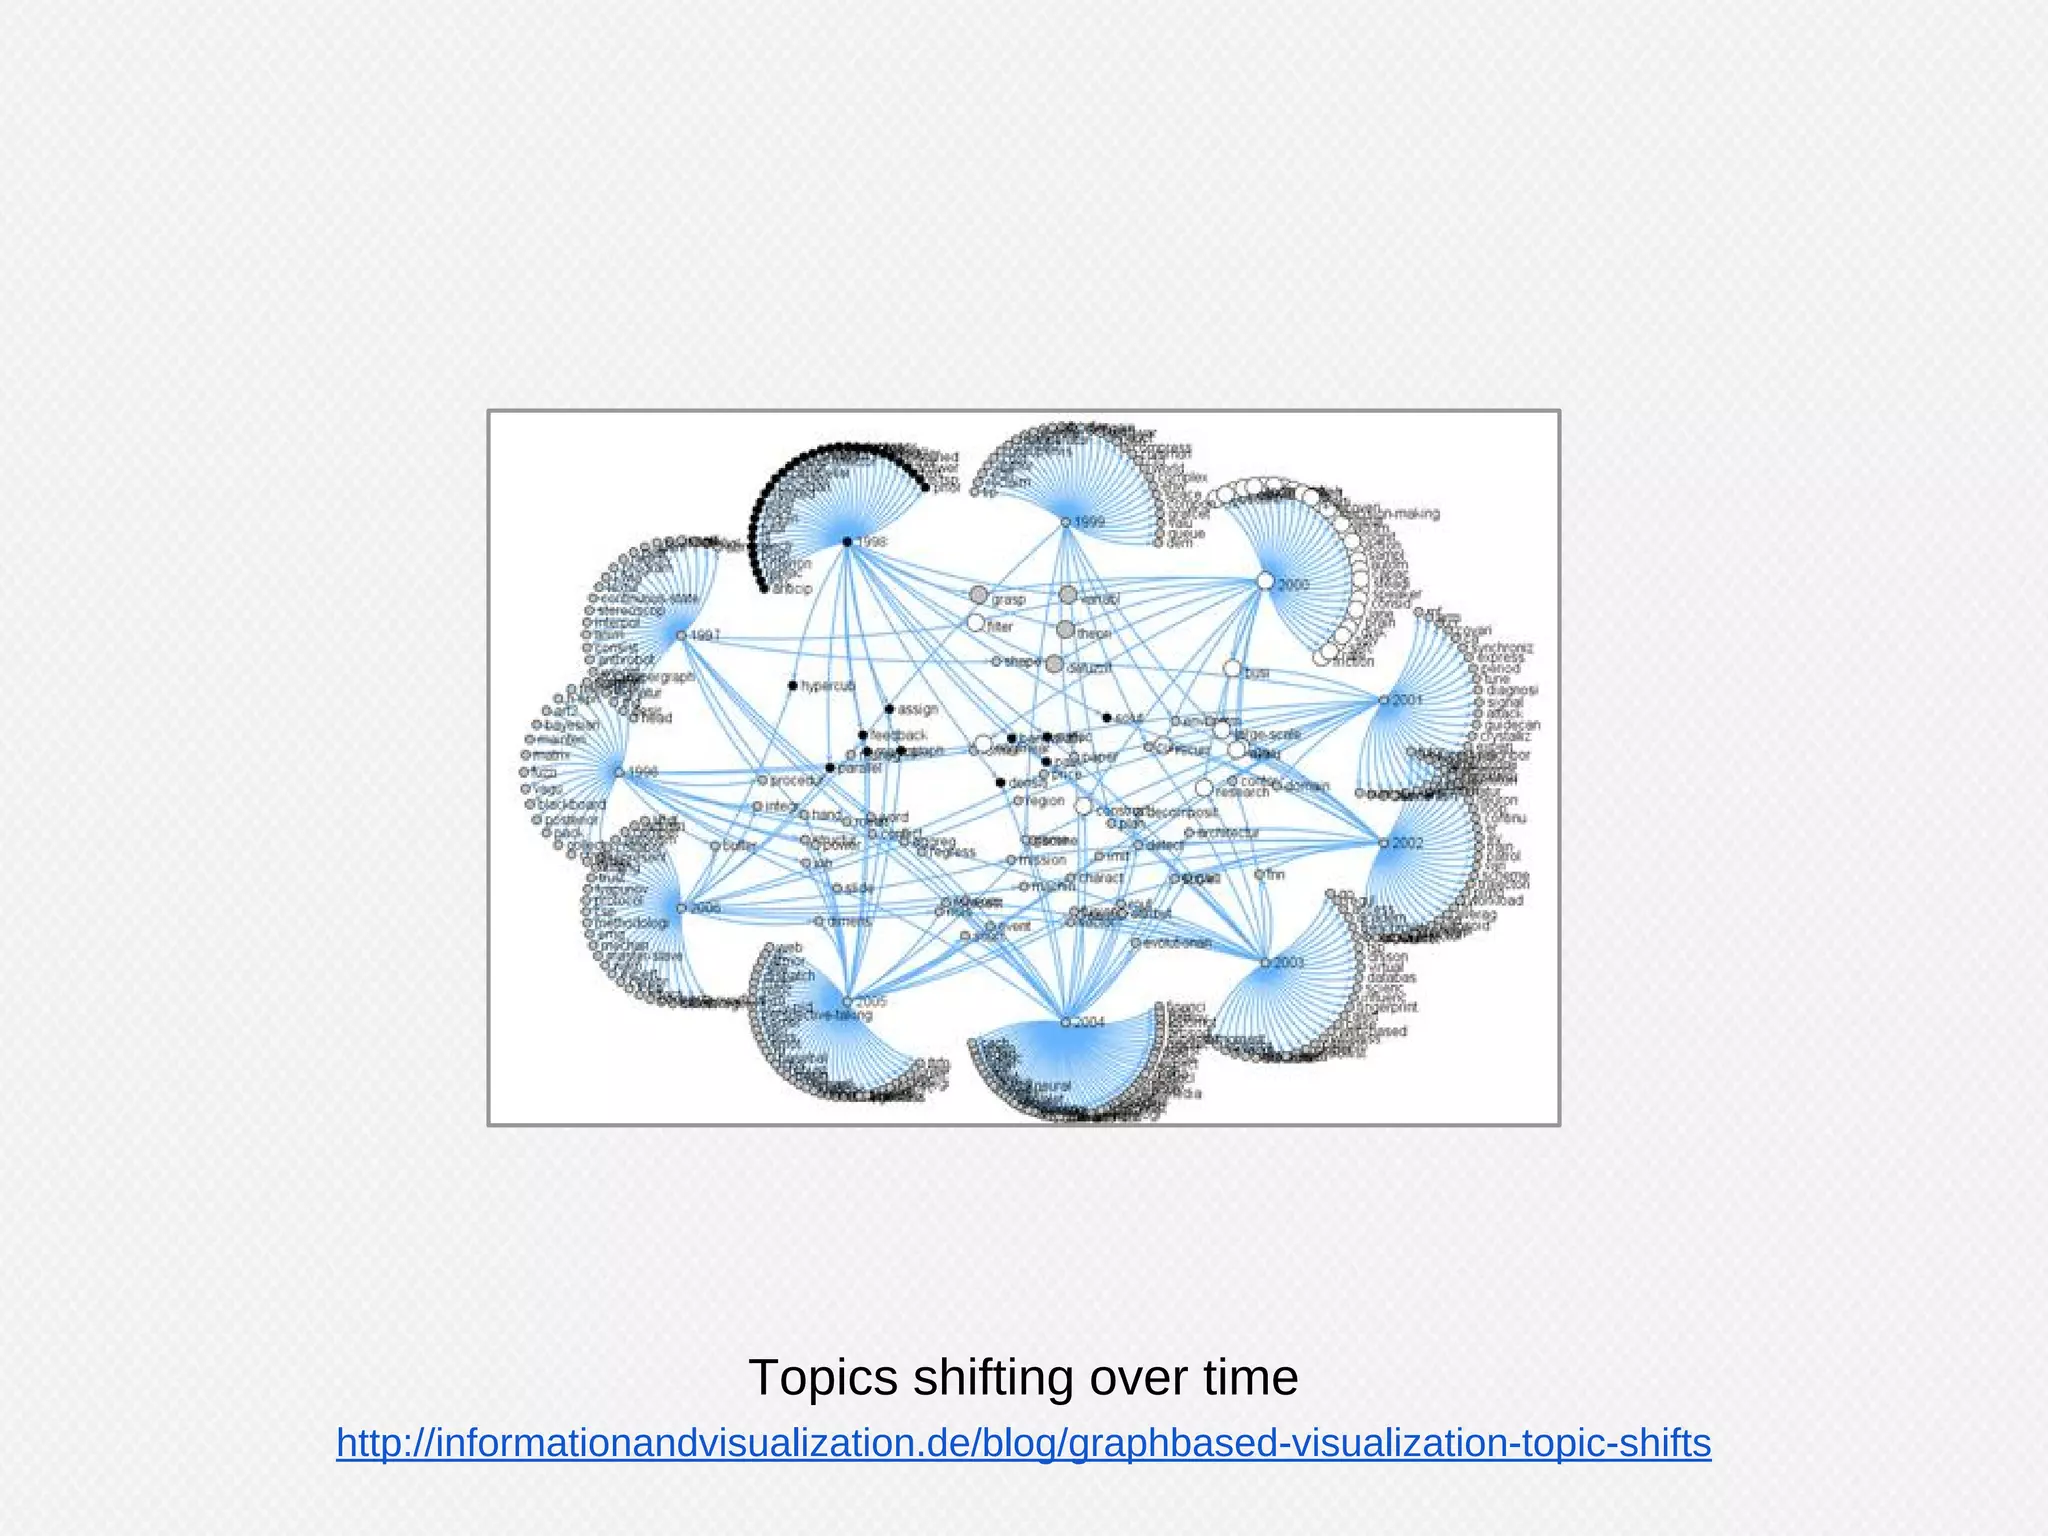
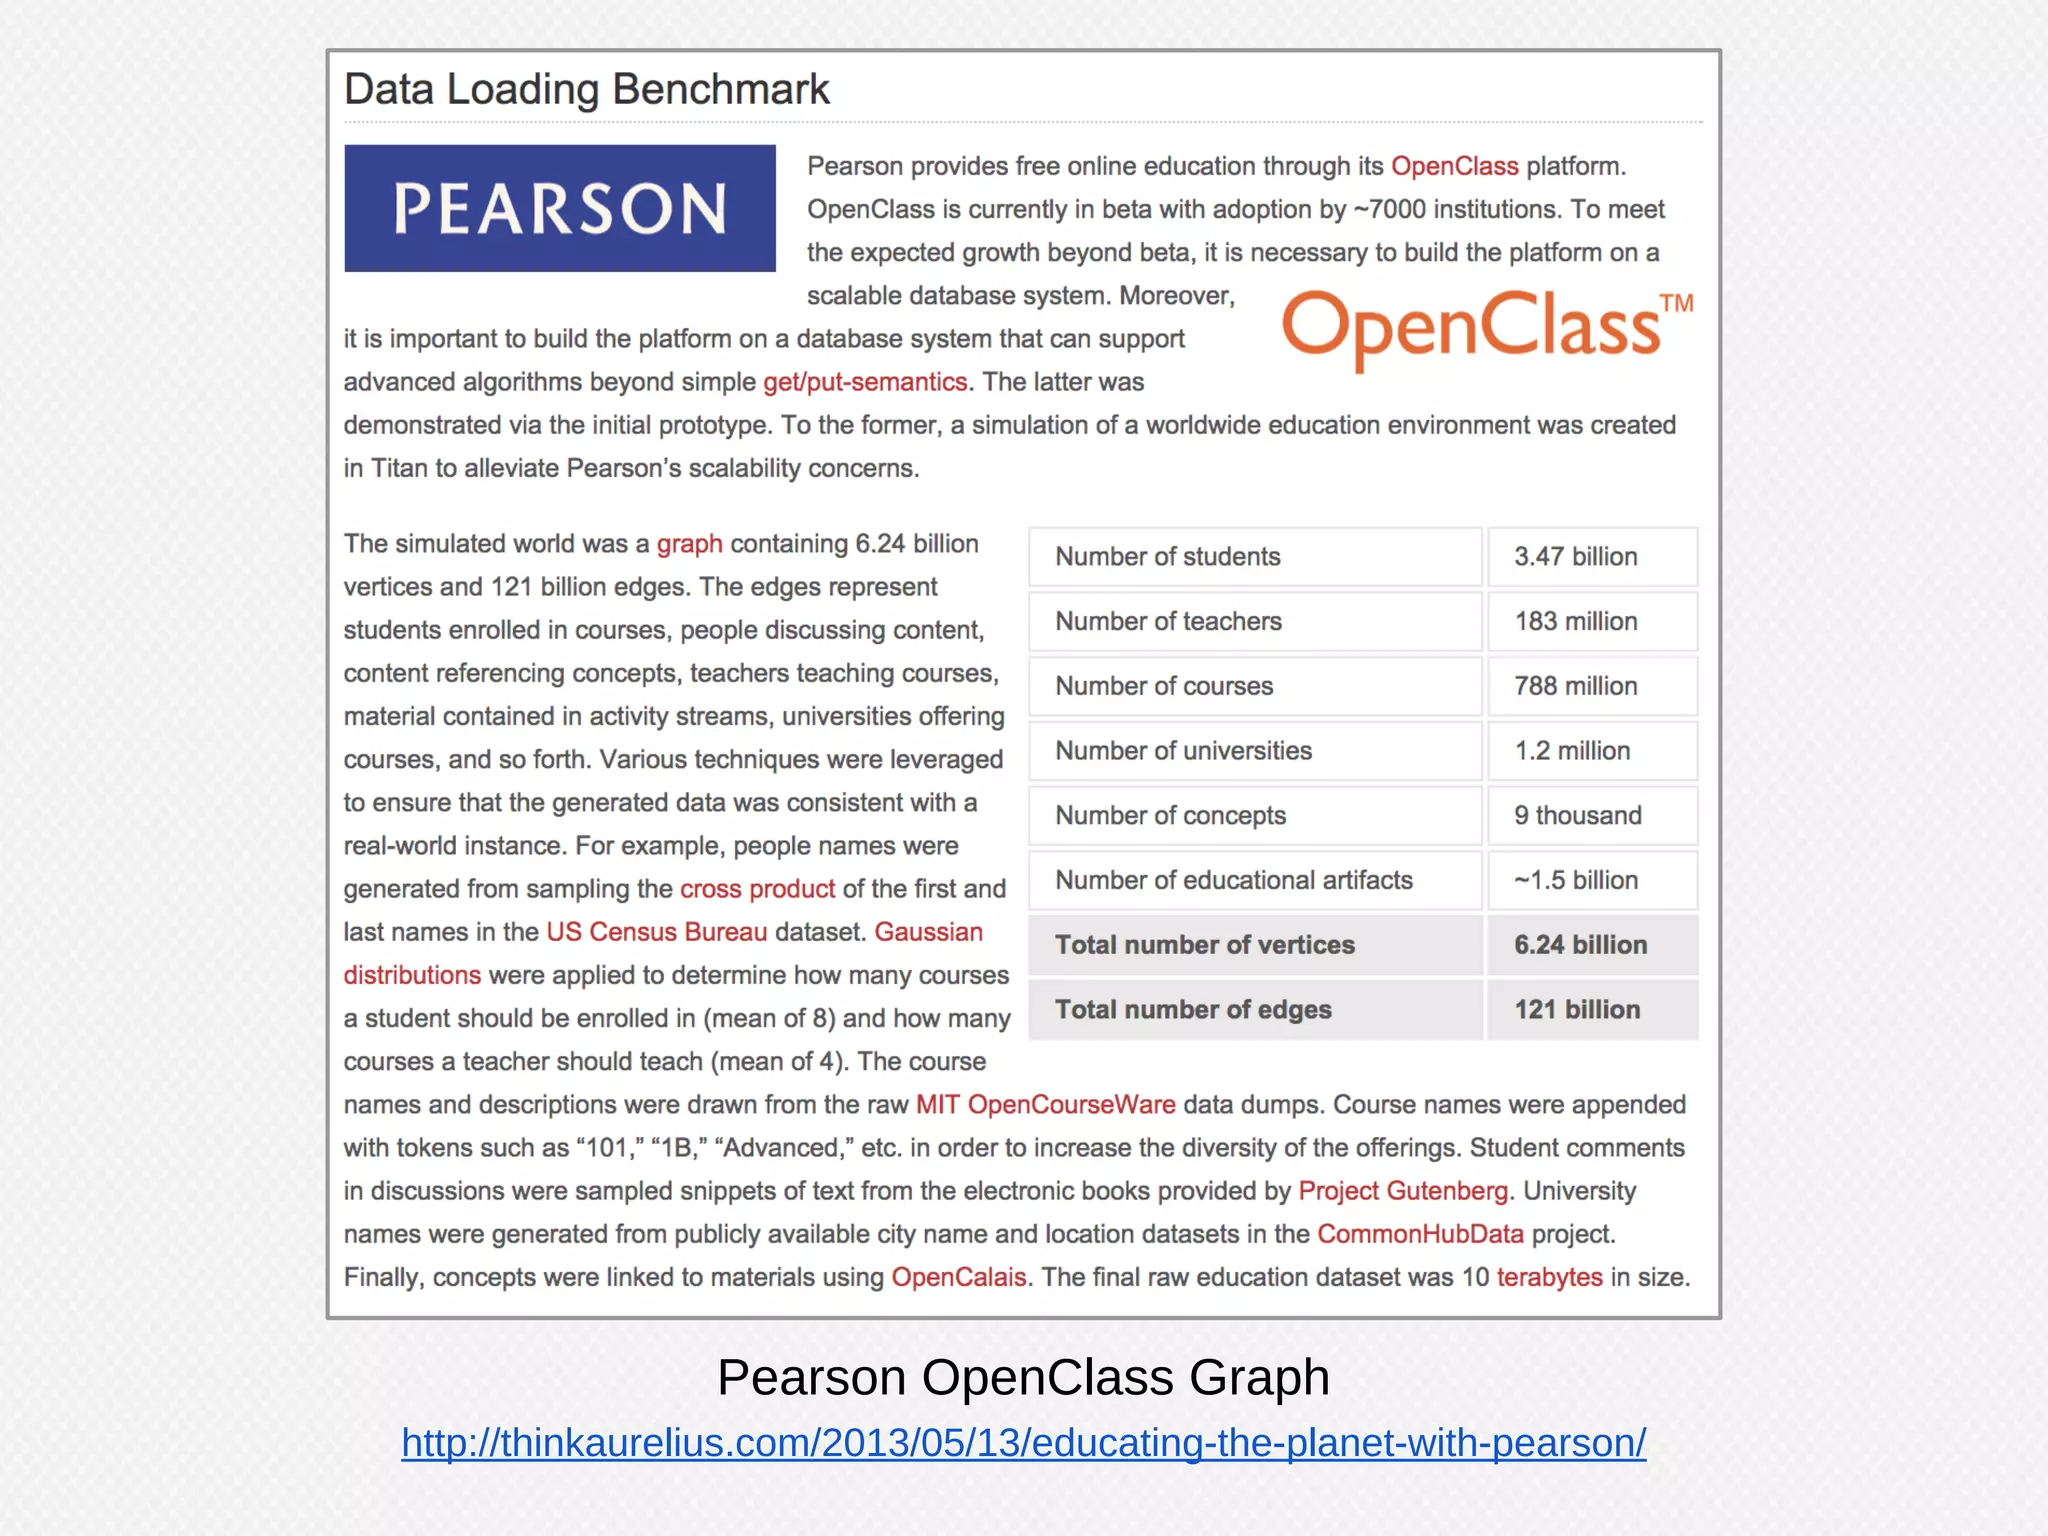
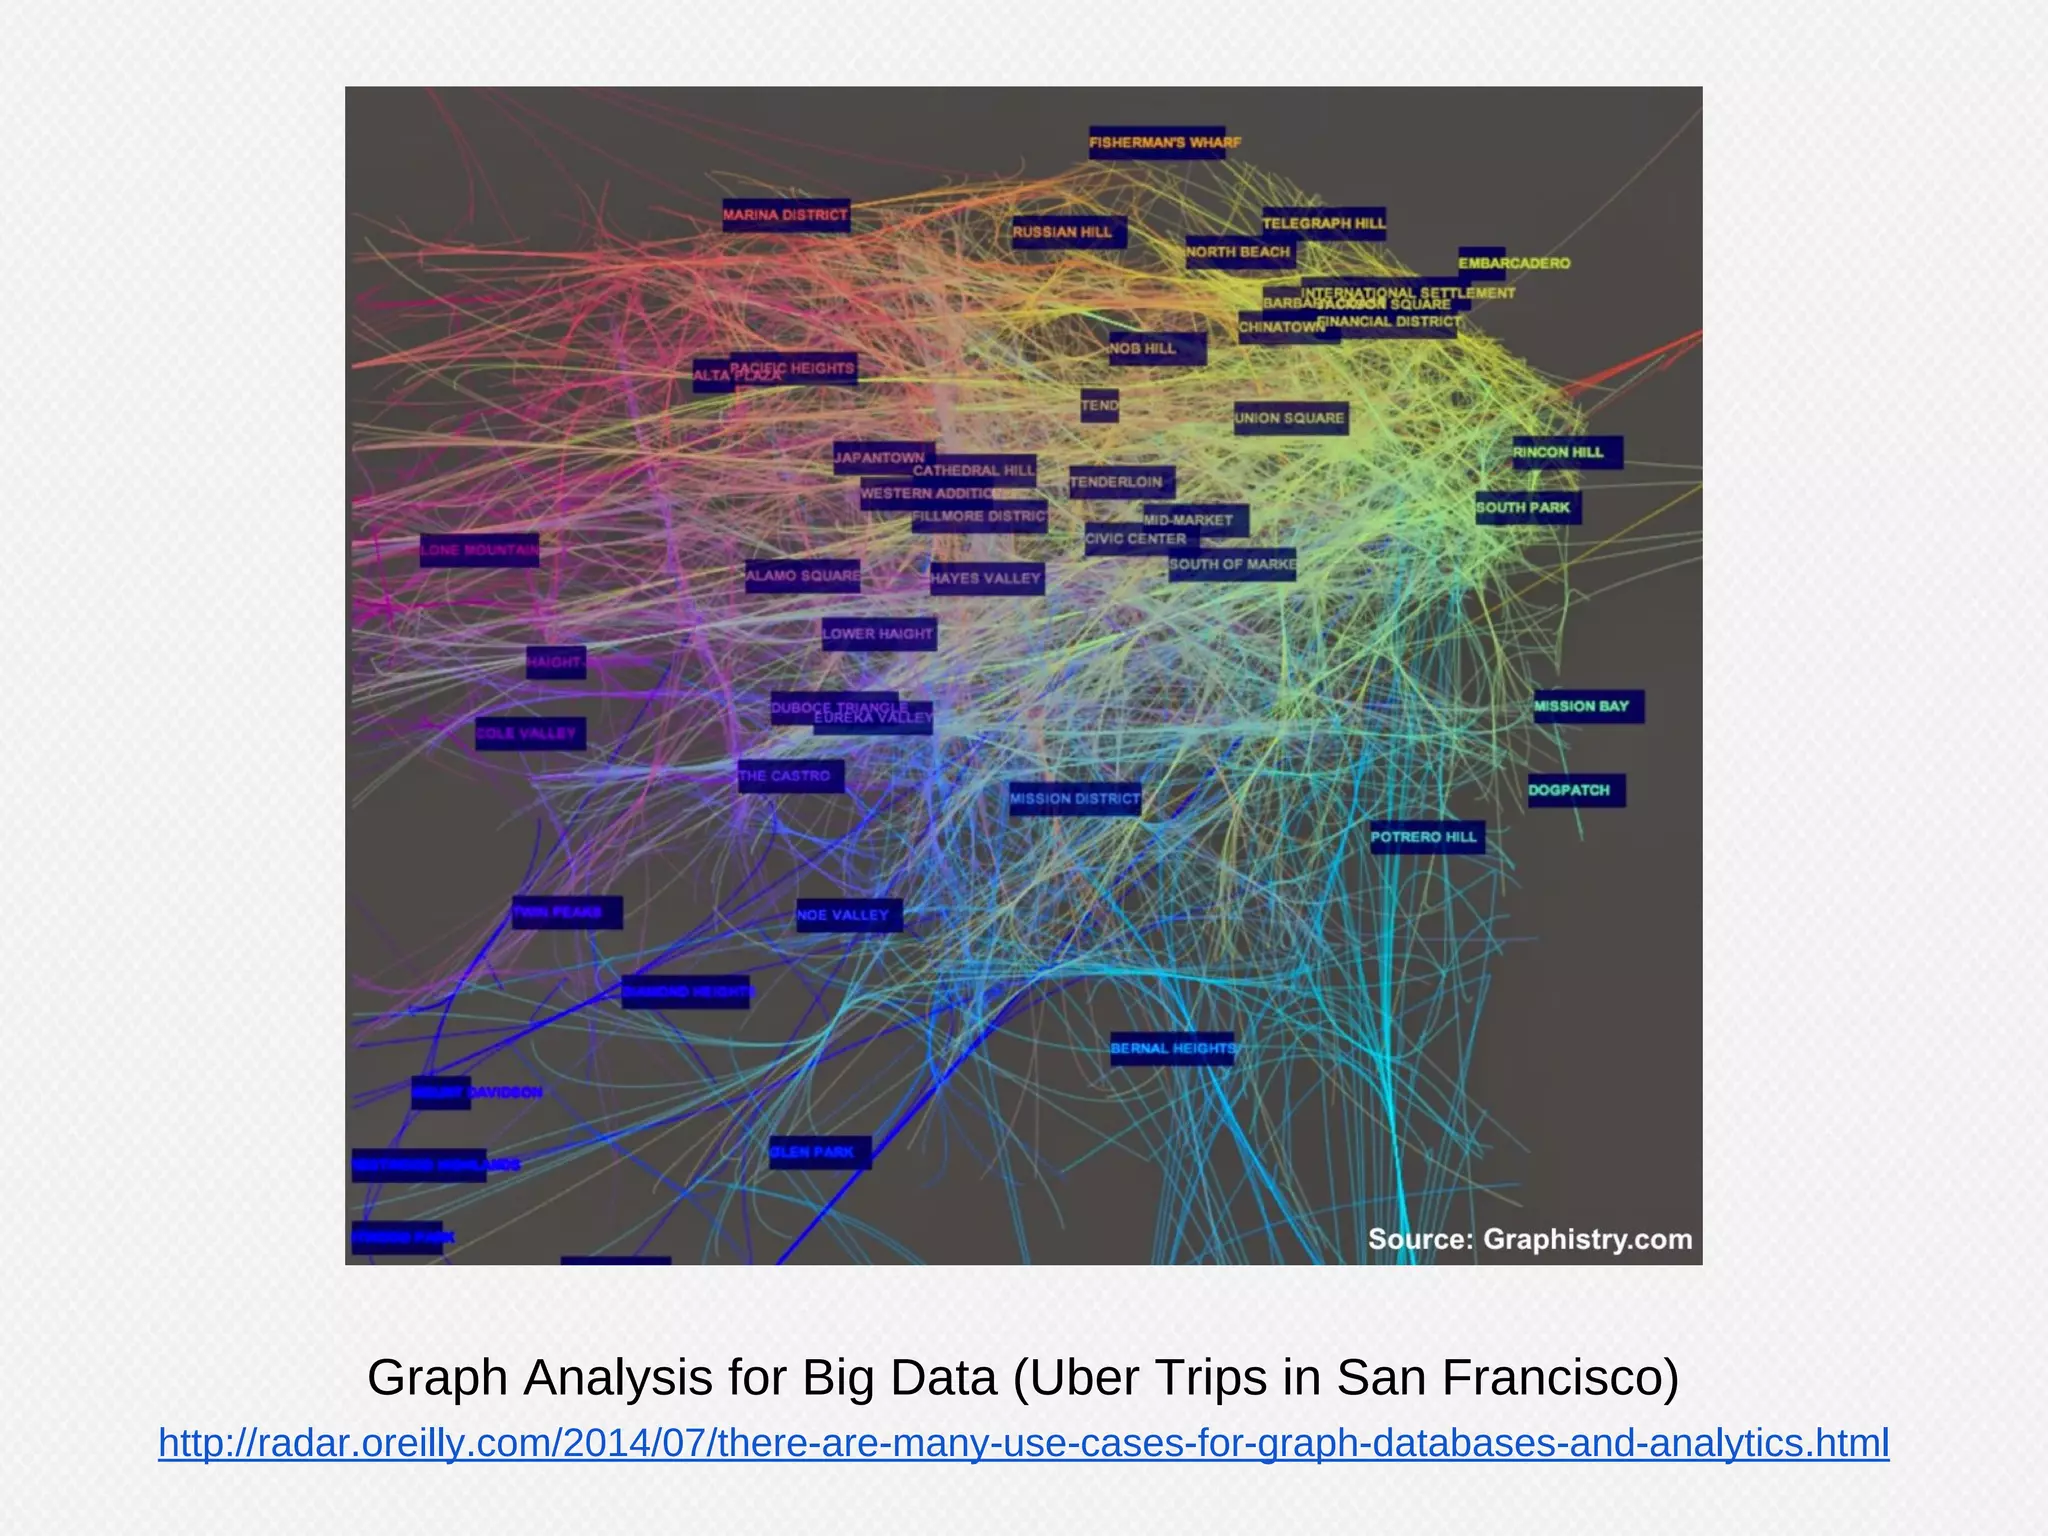
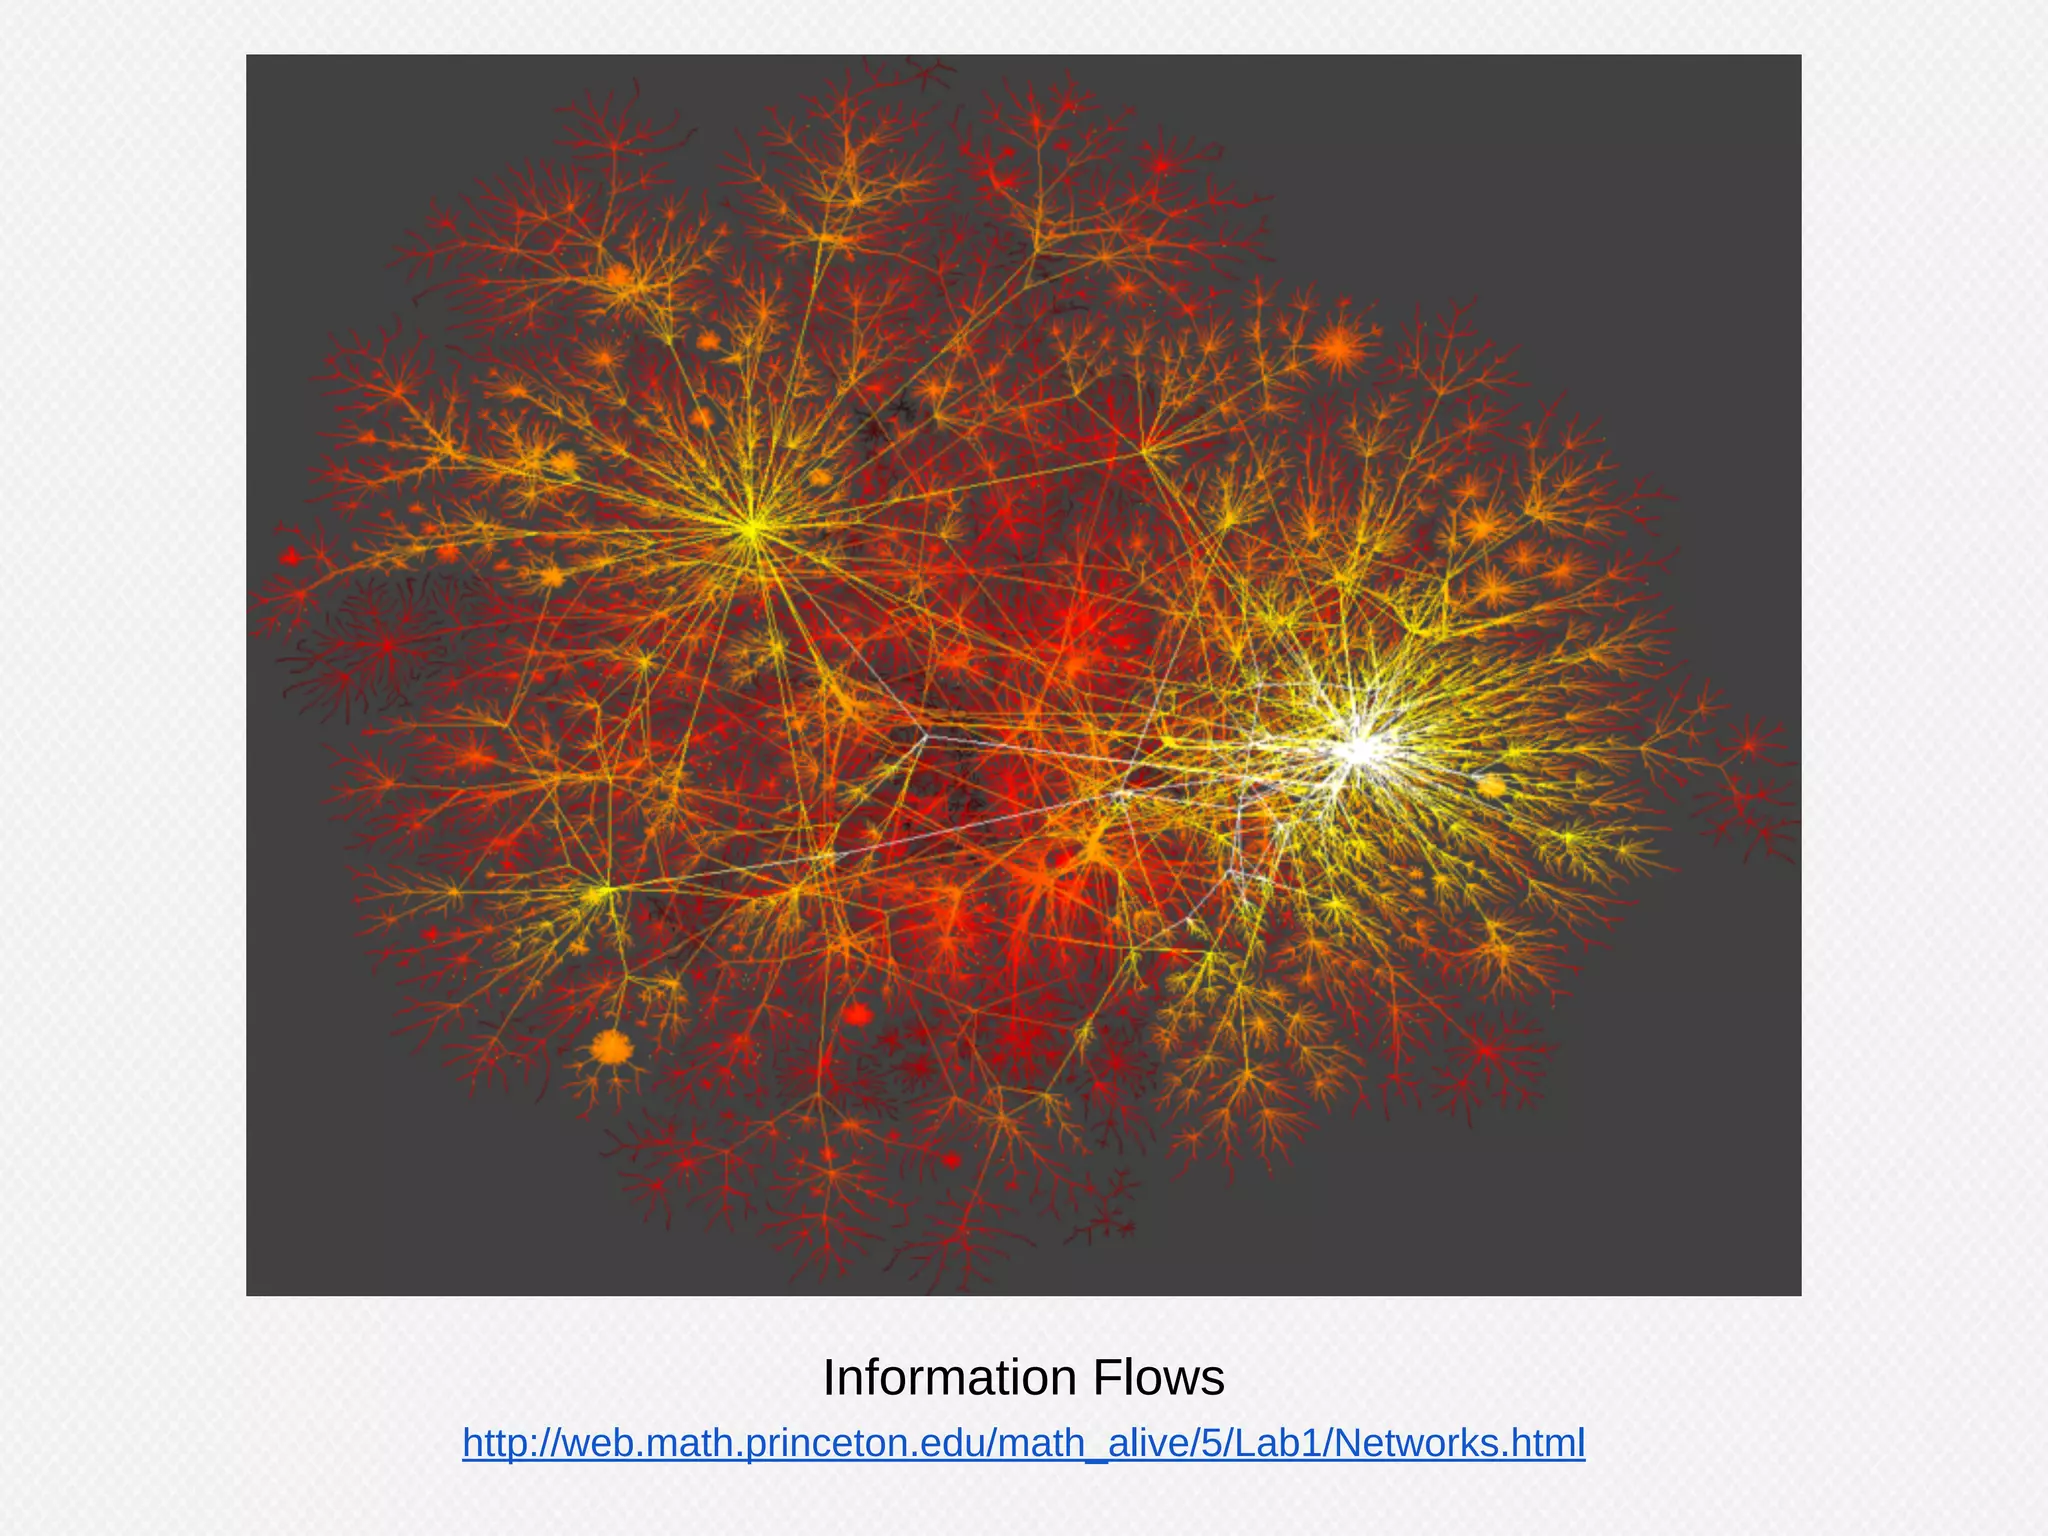
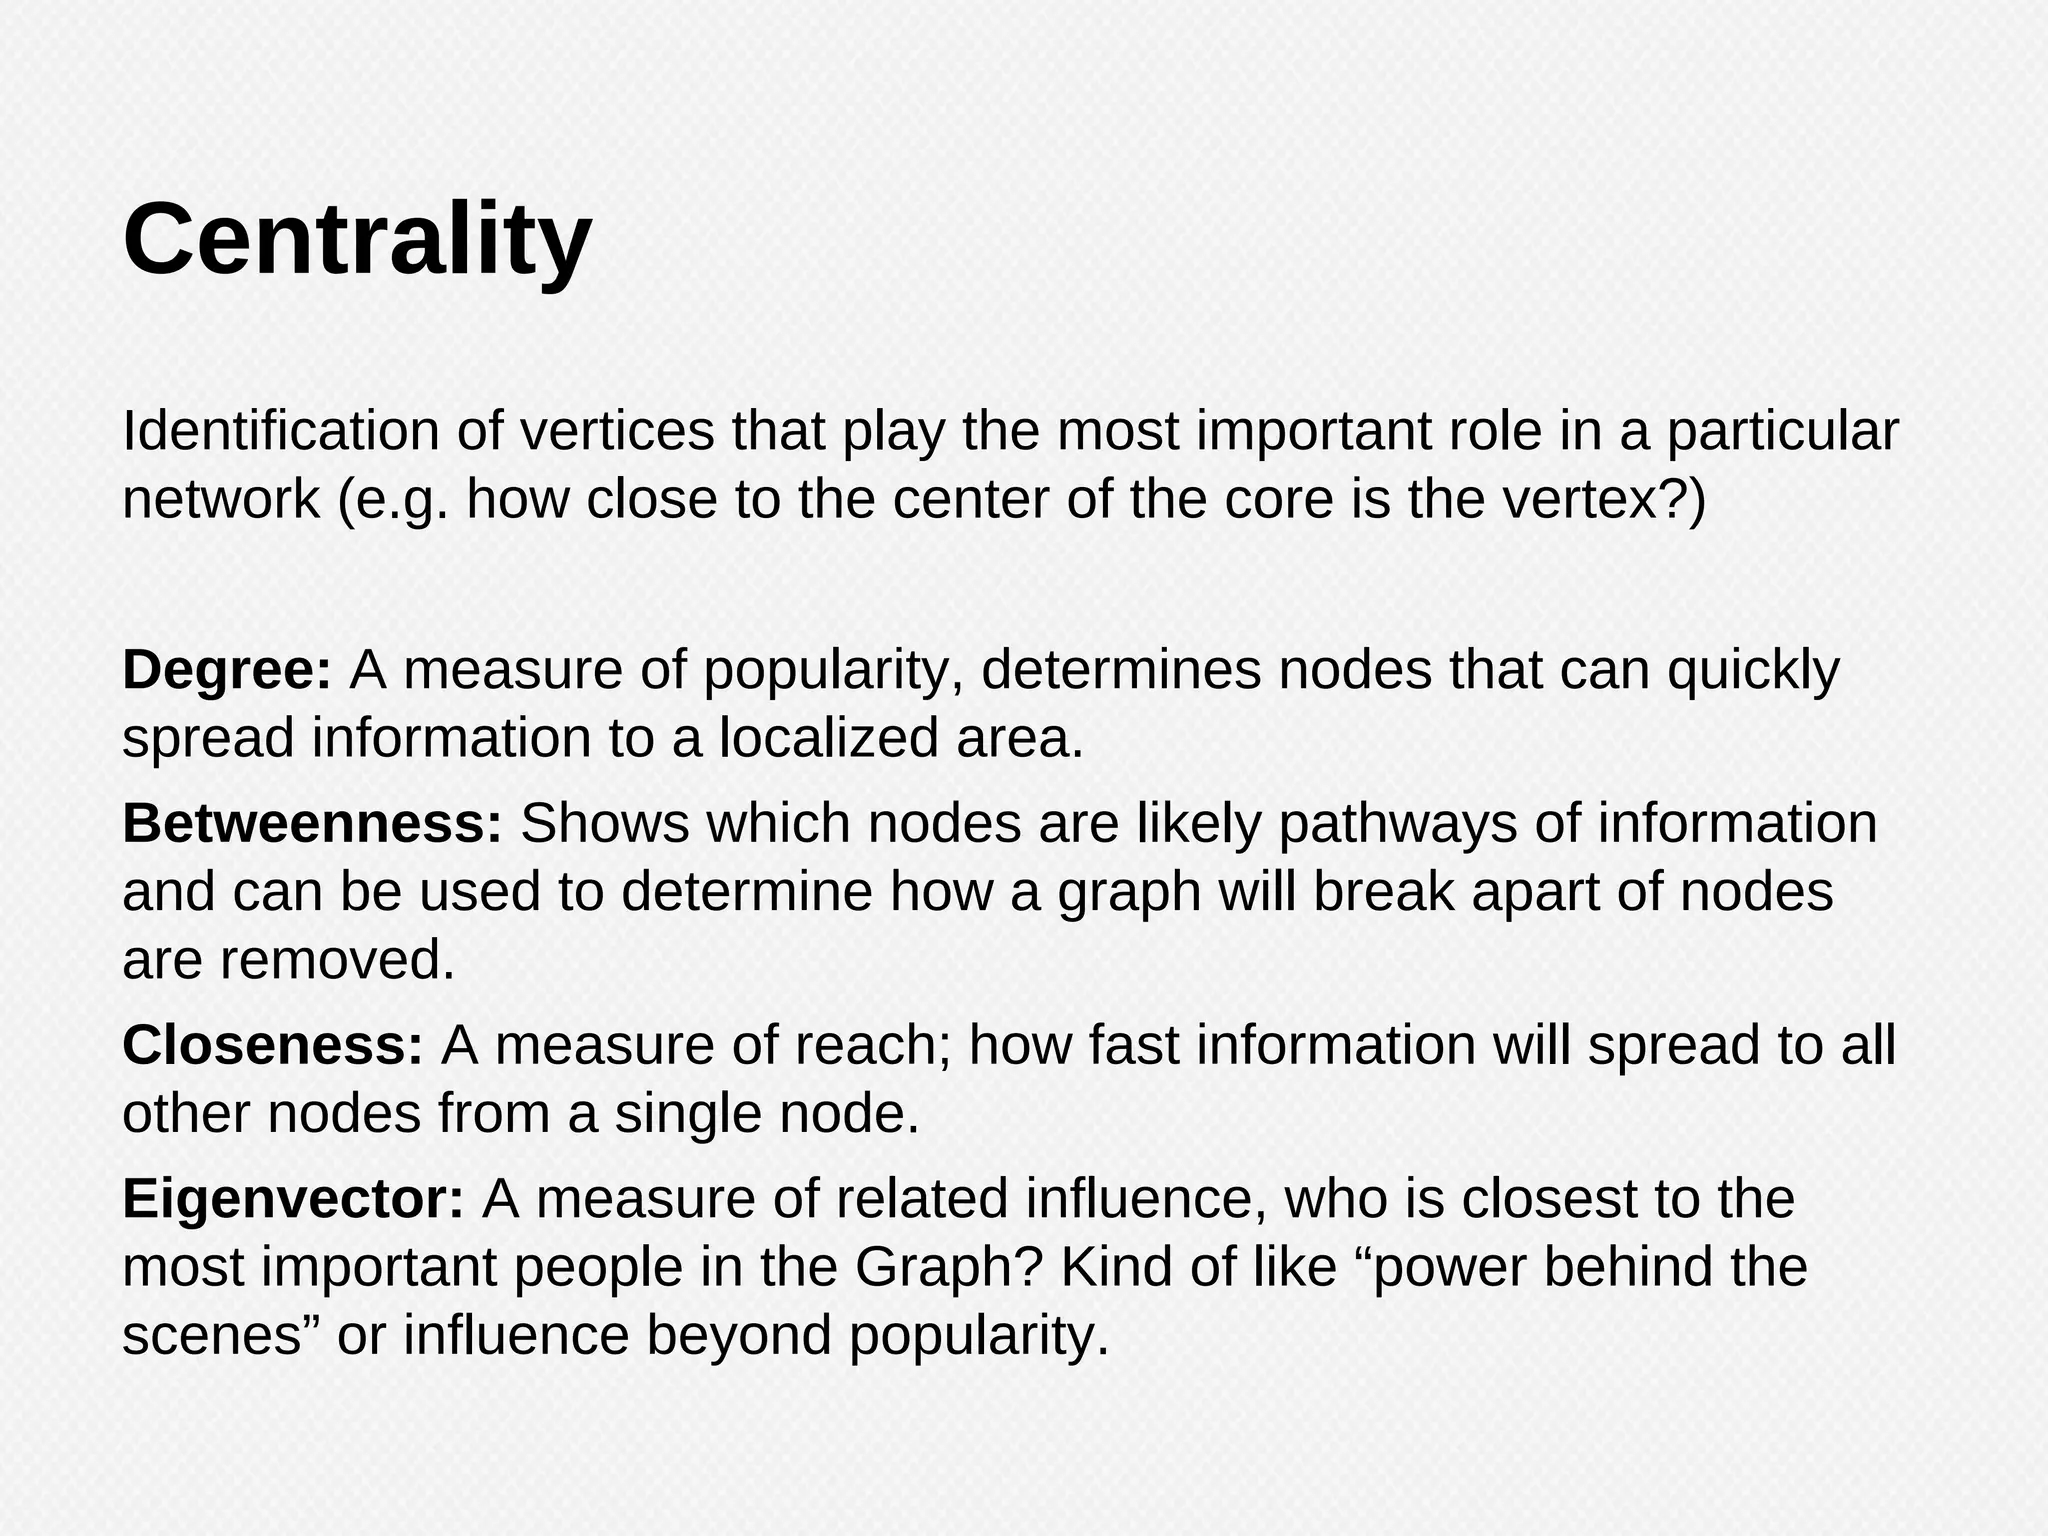
The document provides an overview of graph theory and its applications, including the history, definitions, properties, and algorithms for analyzing graphs. It discusses the significance of graphs in representing real-life relationships and data flows, along with machine learning techniques that leverage graph structures. Additionally, it covers various graph visualization methods and the importance of centrality measures in understanding social networks and information dissemination.