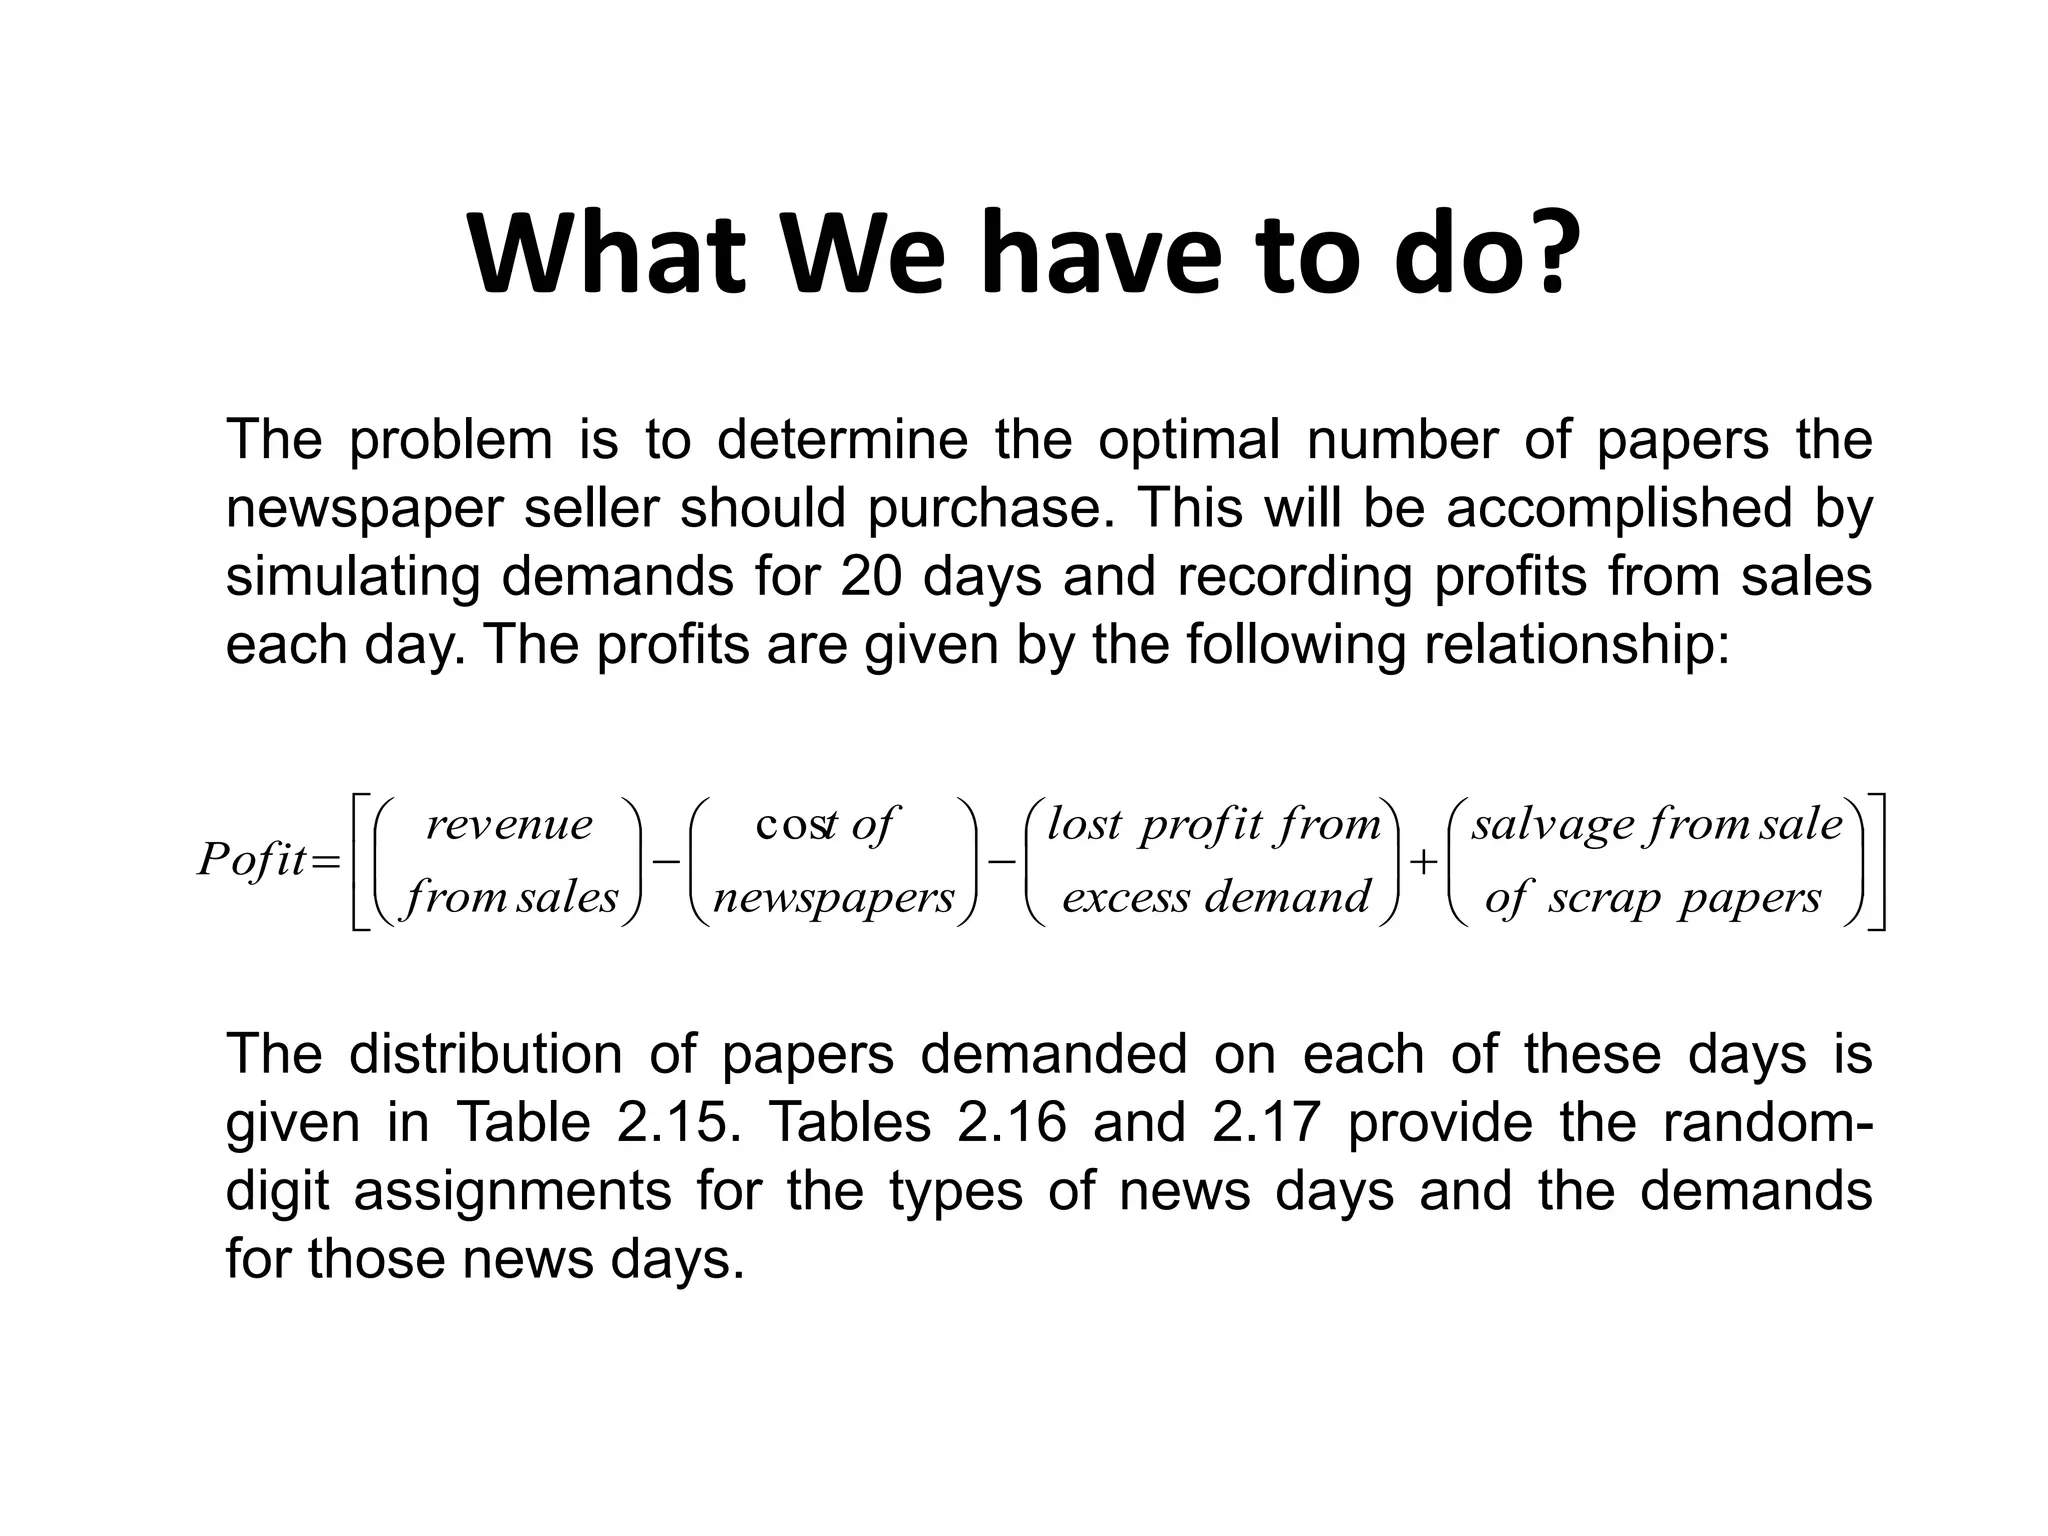
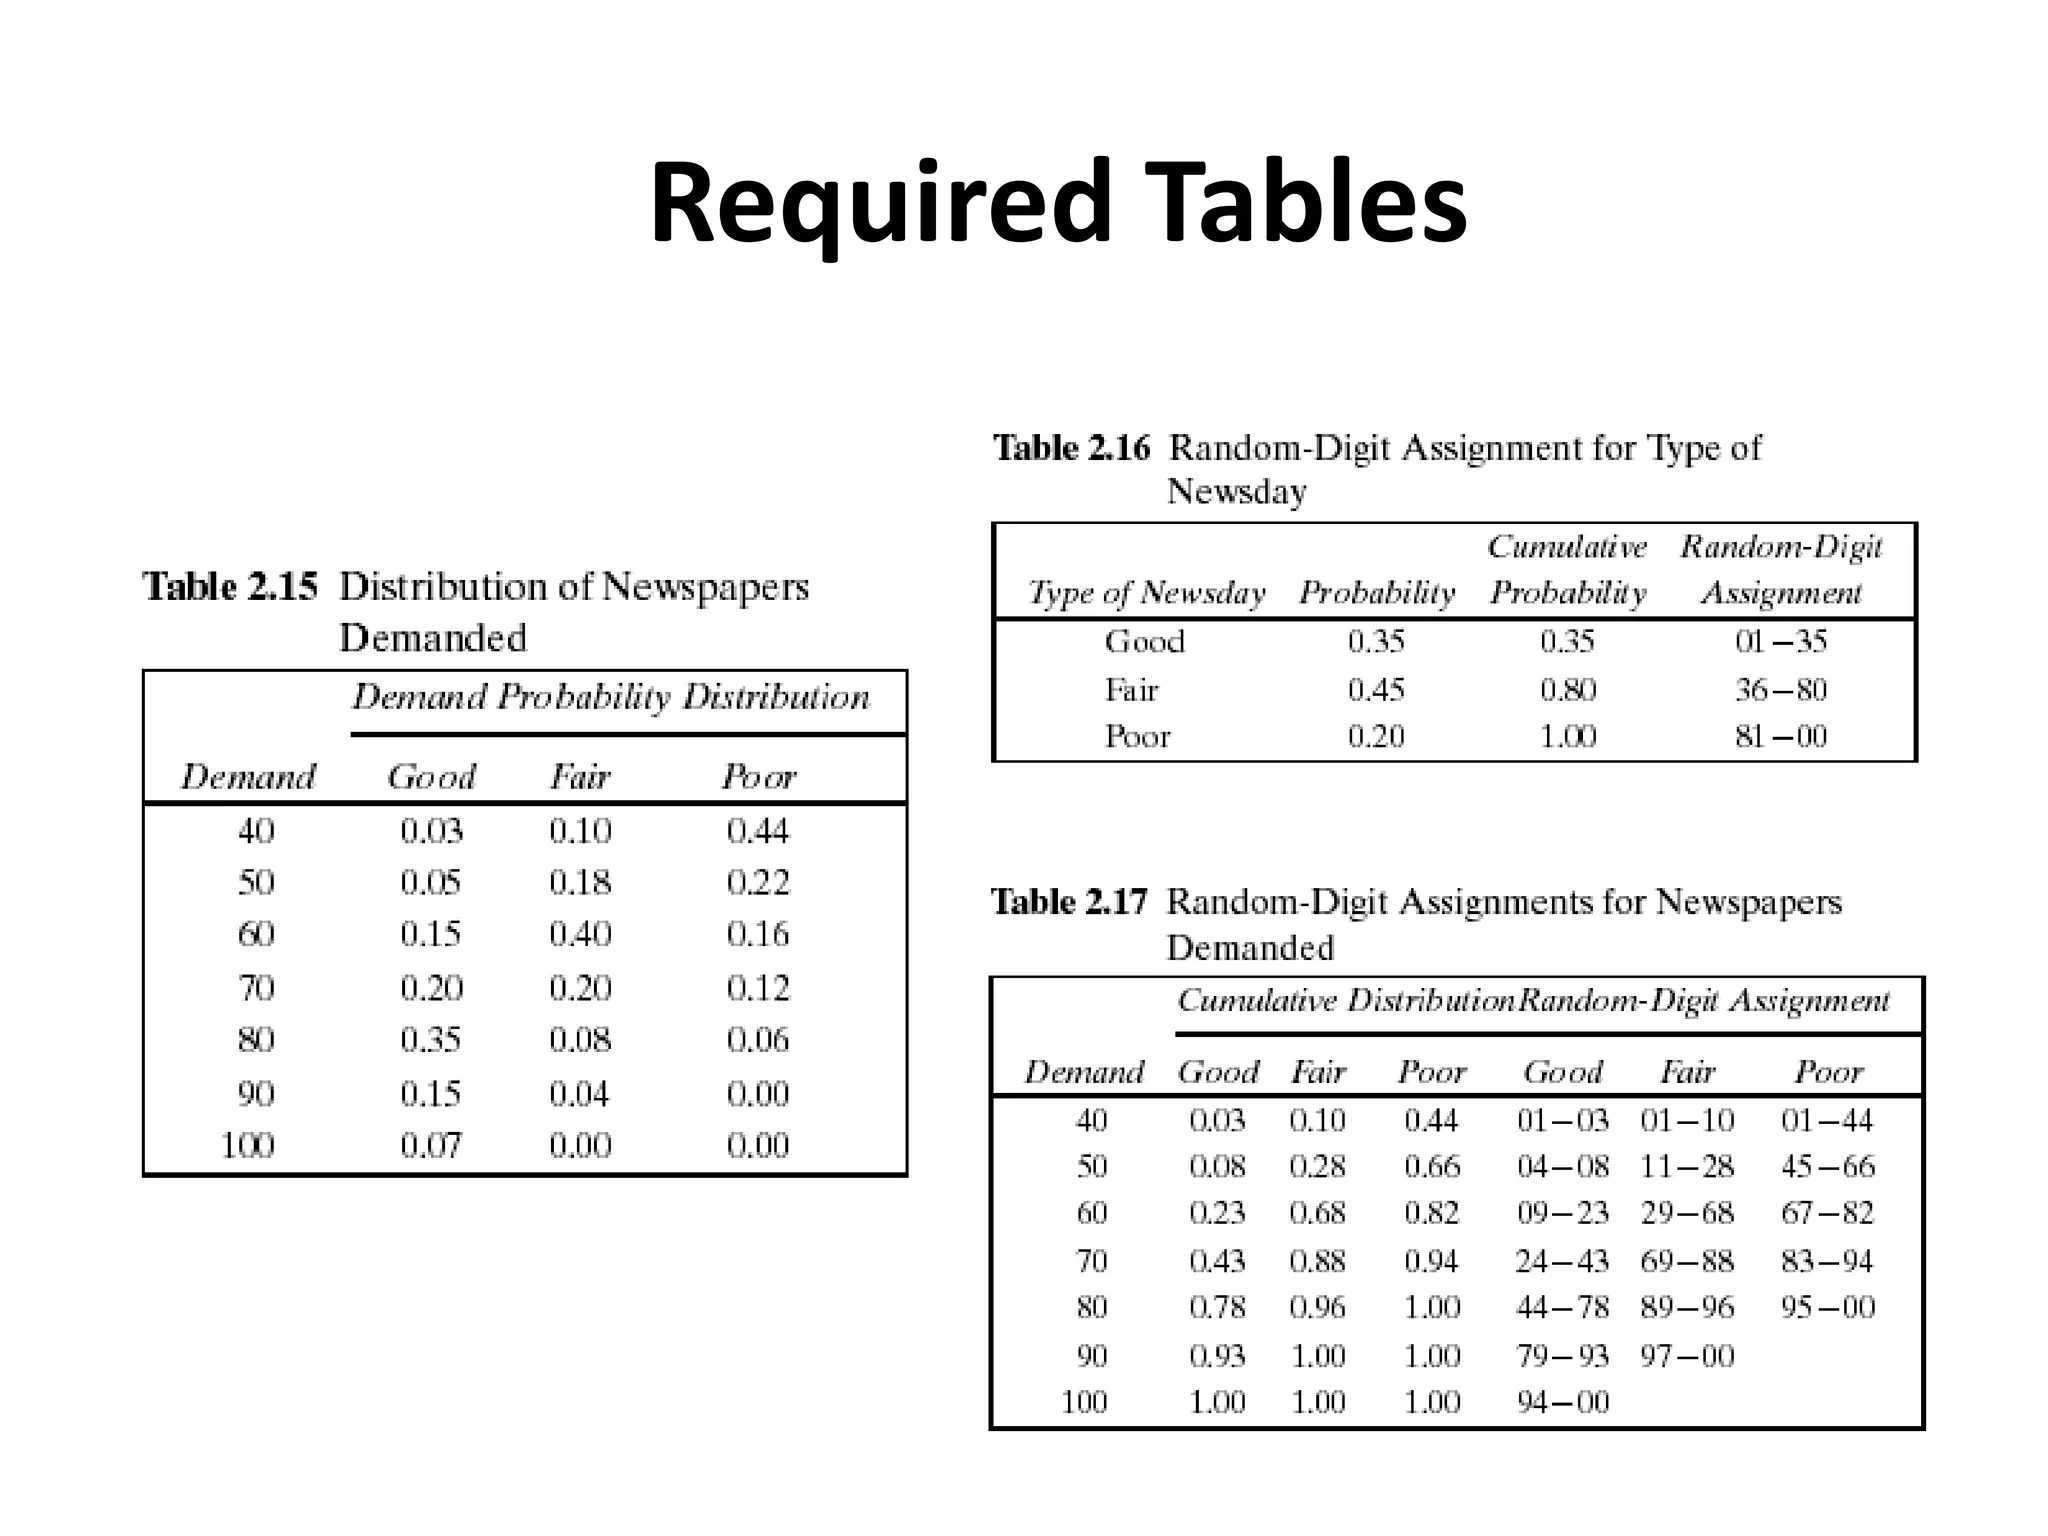
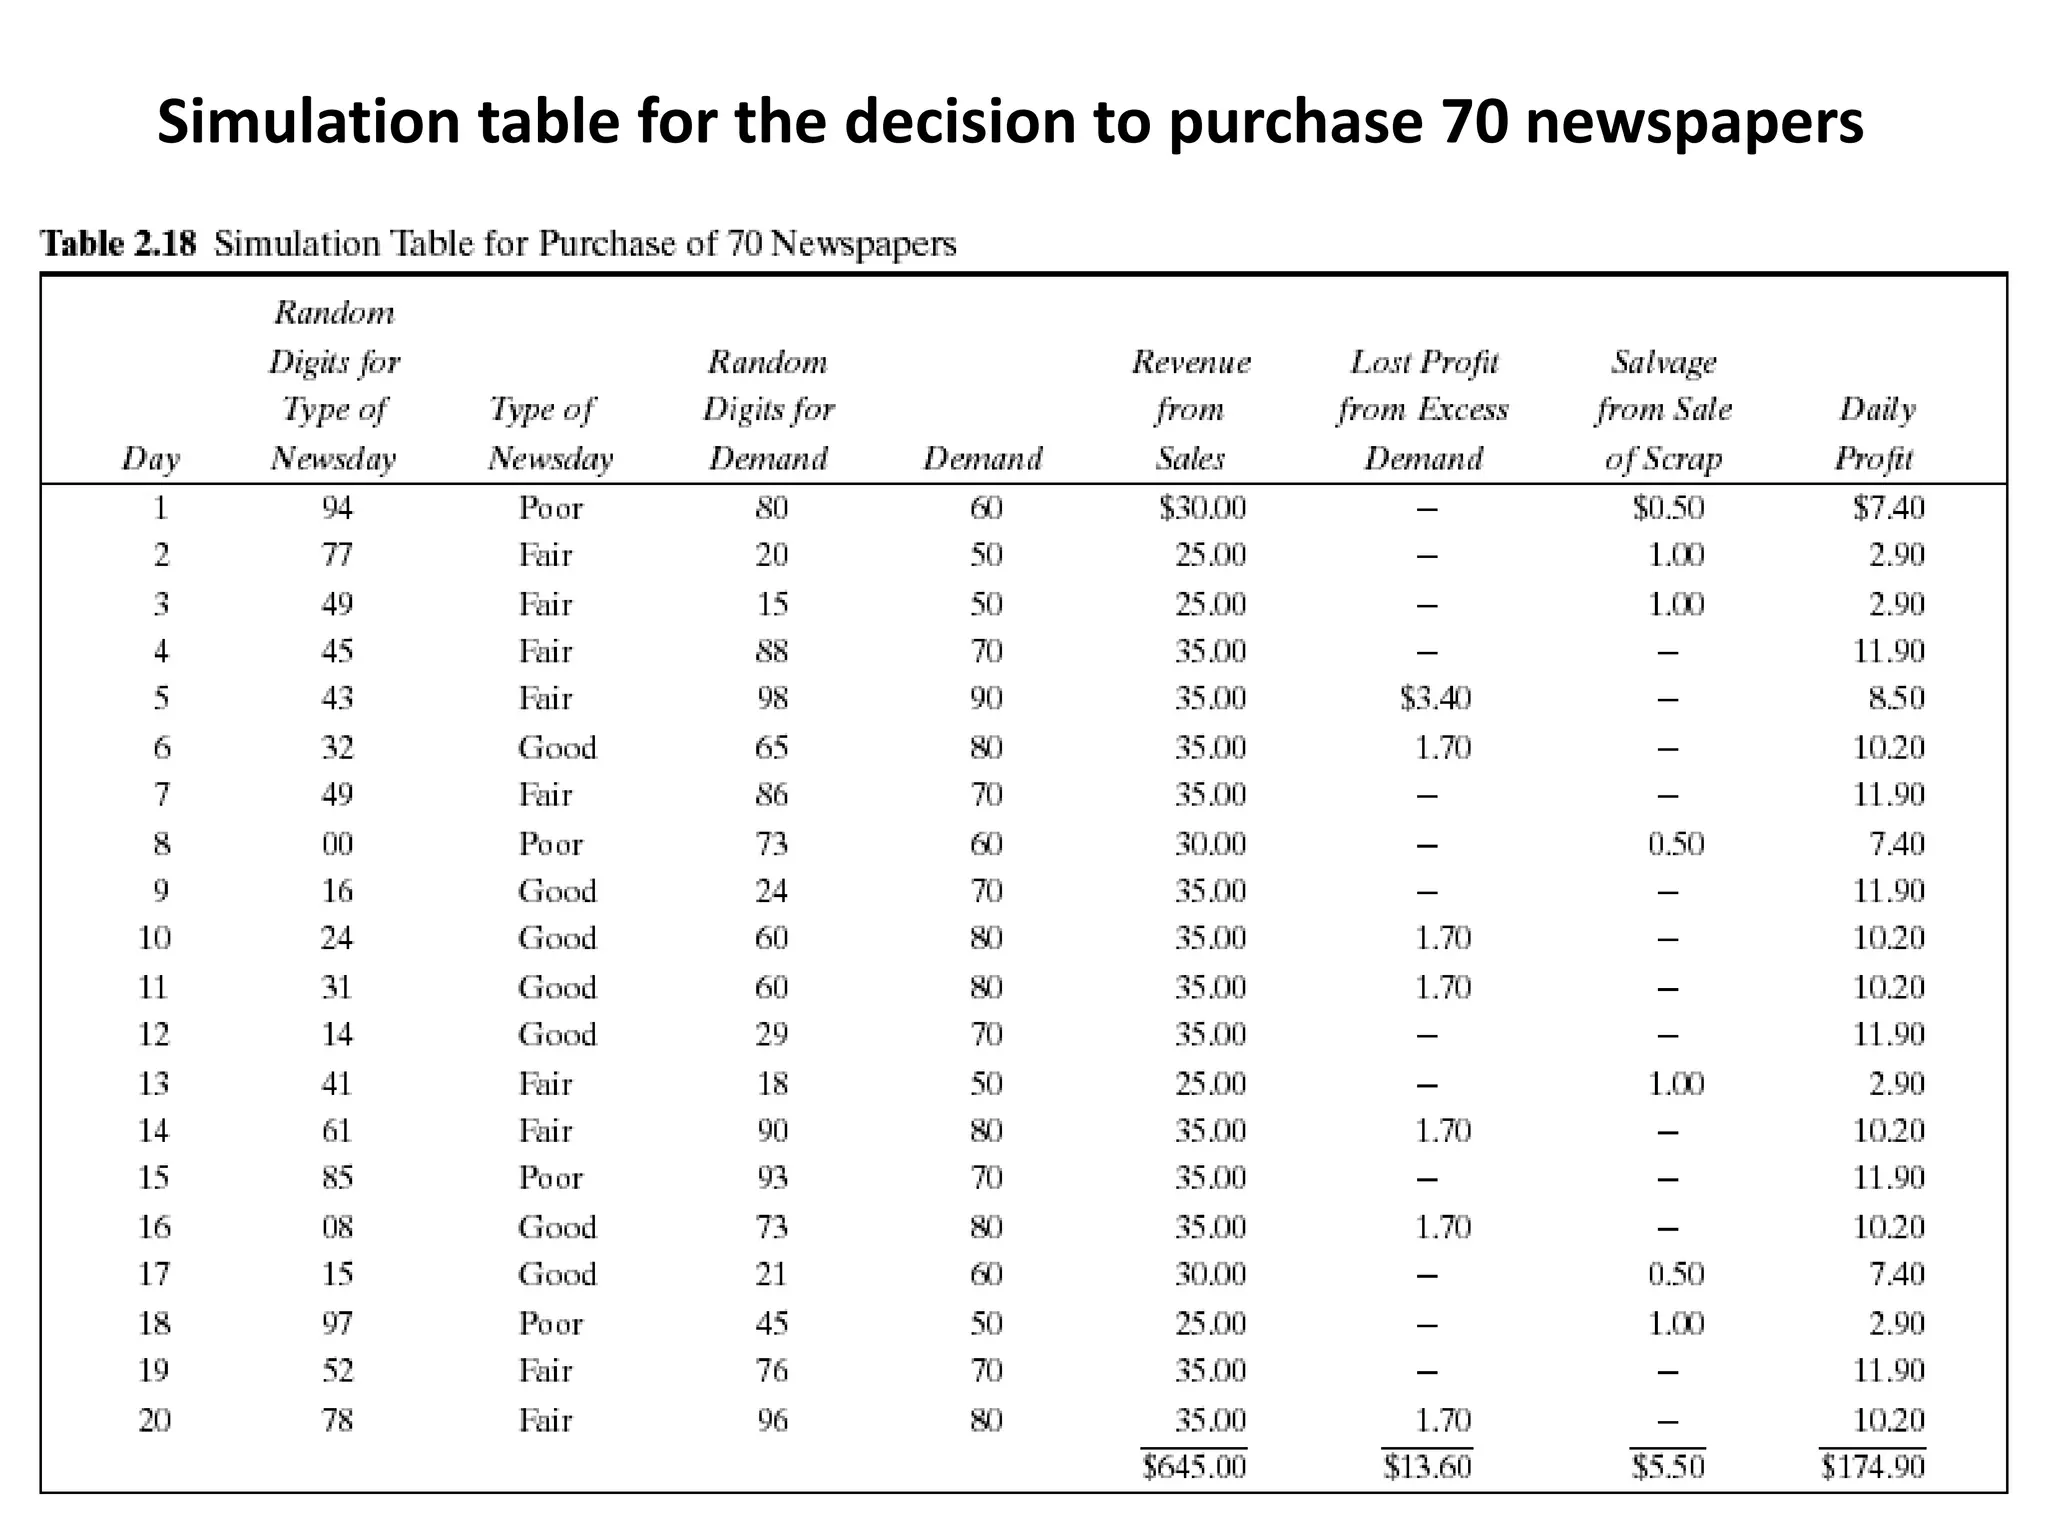
Simulation of Queuing System
Prepared By
Maruf Abdullah
Table of Content
Topic Page
Simulation of Inventory Systems 03
Example 04
What We have to do? 05
Required Tables 06
Solution of the Example 07
Simulation table for the decision to purchase 70
newspapers
08
Simulation of Inventory Systems
This inventory system has a
periodic review of length N, at
which time the inventory level is
checked.
An order is made to bring the
inventory up to the level M.
In this inventory system the lead
time (i.e., the length of time
between the placement and
receipt of an order) is zero.
Demand is shown as being
uniform over the time period.
Example
A classical inventory problem concerns the purchase and
sale of newspapers. The paper seller buys the papers for
33 cents each and sells them for 50 cents each. (The lost
profit from excess demand is 17 cents for each paper
demanded that could not be provided.) Newspapers not
sold at the end of the day are sold as scrap for 5 cents
each. (the salvage value of scrap papers). Newspapers can
be purchased in bundles of 10. Thus, the paper seller can
buy 50, 60, and so on. There are three types of news days,
“good,” “fair,” and “poor,” with probabilities of 0.35, 0.45,
and 0.20, respectively.
What We have to do?
The problem is to determine the optimal number of papers the
newspaper seller should purchase. This will be accomplished by
simulating demands for 20 days and recording profits from sales
each day. The profits are given by the following relationship:
The distribution of papers demanded on each of these days is
given in Table 2.15. Tables 2.16 and 2.17 provide the random-
digit assignments for the types of news days and the demands
for those news days.































papersscrapof
salefromsalvage
demandexcess
fromprofitlost
newspapers
oft
salesfrom
revenue
Pofit
cos
Required Tables
Solution of the Example
The profit for the first day is determined as follows:
Profit = $30.00 - $23.10 - 0 + $.50 = $7.40
On day 1 the demand is for 60 newspapers. The revenue
from the sale of 60 newspapers is $30.00.
Ten newspapers are left over at the end of the day.
The salvage value at 5 cents each is 50 cents.
The profit for the 20-day period is the sum of the daily profits, $174.90. It
can also be computed from the totals for the 20 days of the simulation as
follows:
Total profit = $645.00 - $462.00 - $13.60 + $5.50 = $174.90
The policy (number of newspapers purchased) is changed to other
values and the simulation repeated until the best value is found.
Simulation table for the decision to purchase 70 newspapers
 Thanks a lot 

Simulation Queuing System Example | Simulation & Modeling

  • 1.
    Simulation of QueuingSystem Prepared By Maruf Abdullah
  • 2.
    Table of Content TopicPage Simulation of Inventory Systems 03 Example 04 What We have to do? 05 Required Tables 06 Solution of the Example 07 Simulation table for the decision to purchase 70 newspapers 08
  • 3.
    Simulation of InventorySystems This inventory system has a periodic review of length N, at which time the inventory level is checked. An order is made to bring the inventory up to the level M. In this inventory system the lead time (i.e., the length of time between the placement and receipt of an order) is zero. Demand is shown as being uniform over the time period.
  • 4.
    Example A classical inventoryproblem concerns the purchase and sale of newspapers. The paper seller buys the papers for 33 cents each and sells them for 50 cents each. (The lost profit from excess demand is 17 cents for each paper demanded that could not be provided.) Newspapers not sold at the end of the day are sold as scrap for 5 cents each. (the salvage value of scrap papers). Newspapers can be purchased in bundles of 10. Thus, the paper seller can buy 50, 60, and so on. There are three types of news days, “good,” “fair,” and “poor,” with probabilities of 0.35, 0.45, and 0.20, respectively.
  • 5.
    What We haveto do? The problem is to determine the optimal number of papers the newspaper seller should purchase. This will be accomplished by simulating demands for 20 days and recording profits from sales each day. The profits are given by the following relationship: The distribution of papers demanded on each of these days is given in Table 2.15. Tables 2.16 and 2.17 provide the random- digit assignments for the types of news days and the demands for those news days.                                papersscrapof salefromsalvage demandexcess fromprofitlost newspapers oft salesfrom revenue Pofit cos
  • 6.
  • 7.
    Solution of theExample The profit for the first day is determined as follows: Profit = $30.00 - $23.10 - 0 + $.50 = $7.40 On day 1 the demand is for 60 newspapers. The revenue from the sale of 60 newspapers is $30.00. Ten newspapers are left over at the end of the day. The salvage value at 5 cents each is 50 cents. The profit for the 20-day period is the sum of the daily profits, $174.90. It can also be computed from the totals for the 20 days of the simulation as follows: Total profit = $645.00 - $462.00 - $13.60 + $5.50 = $174.90 The policy (number of newspapers purchased) is changed to other values and the simulation repeated until the best value is found.
  • 8.
    Simulation table forthe decision to purchase 70 newspapers
  • 9.
     Thanks alot 