Download as PDF, PPTX


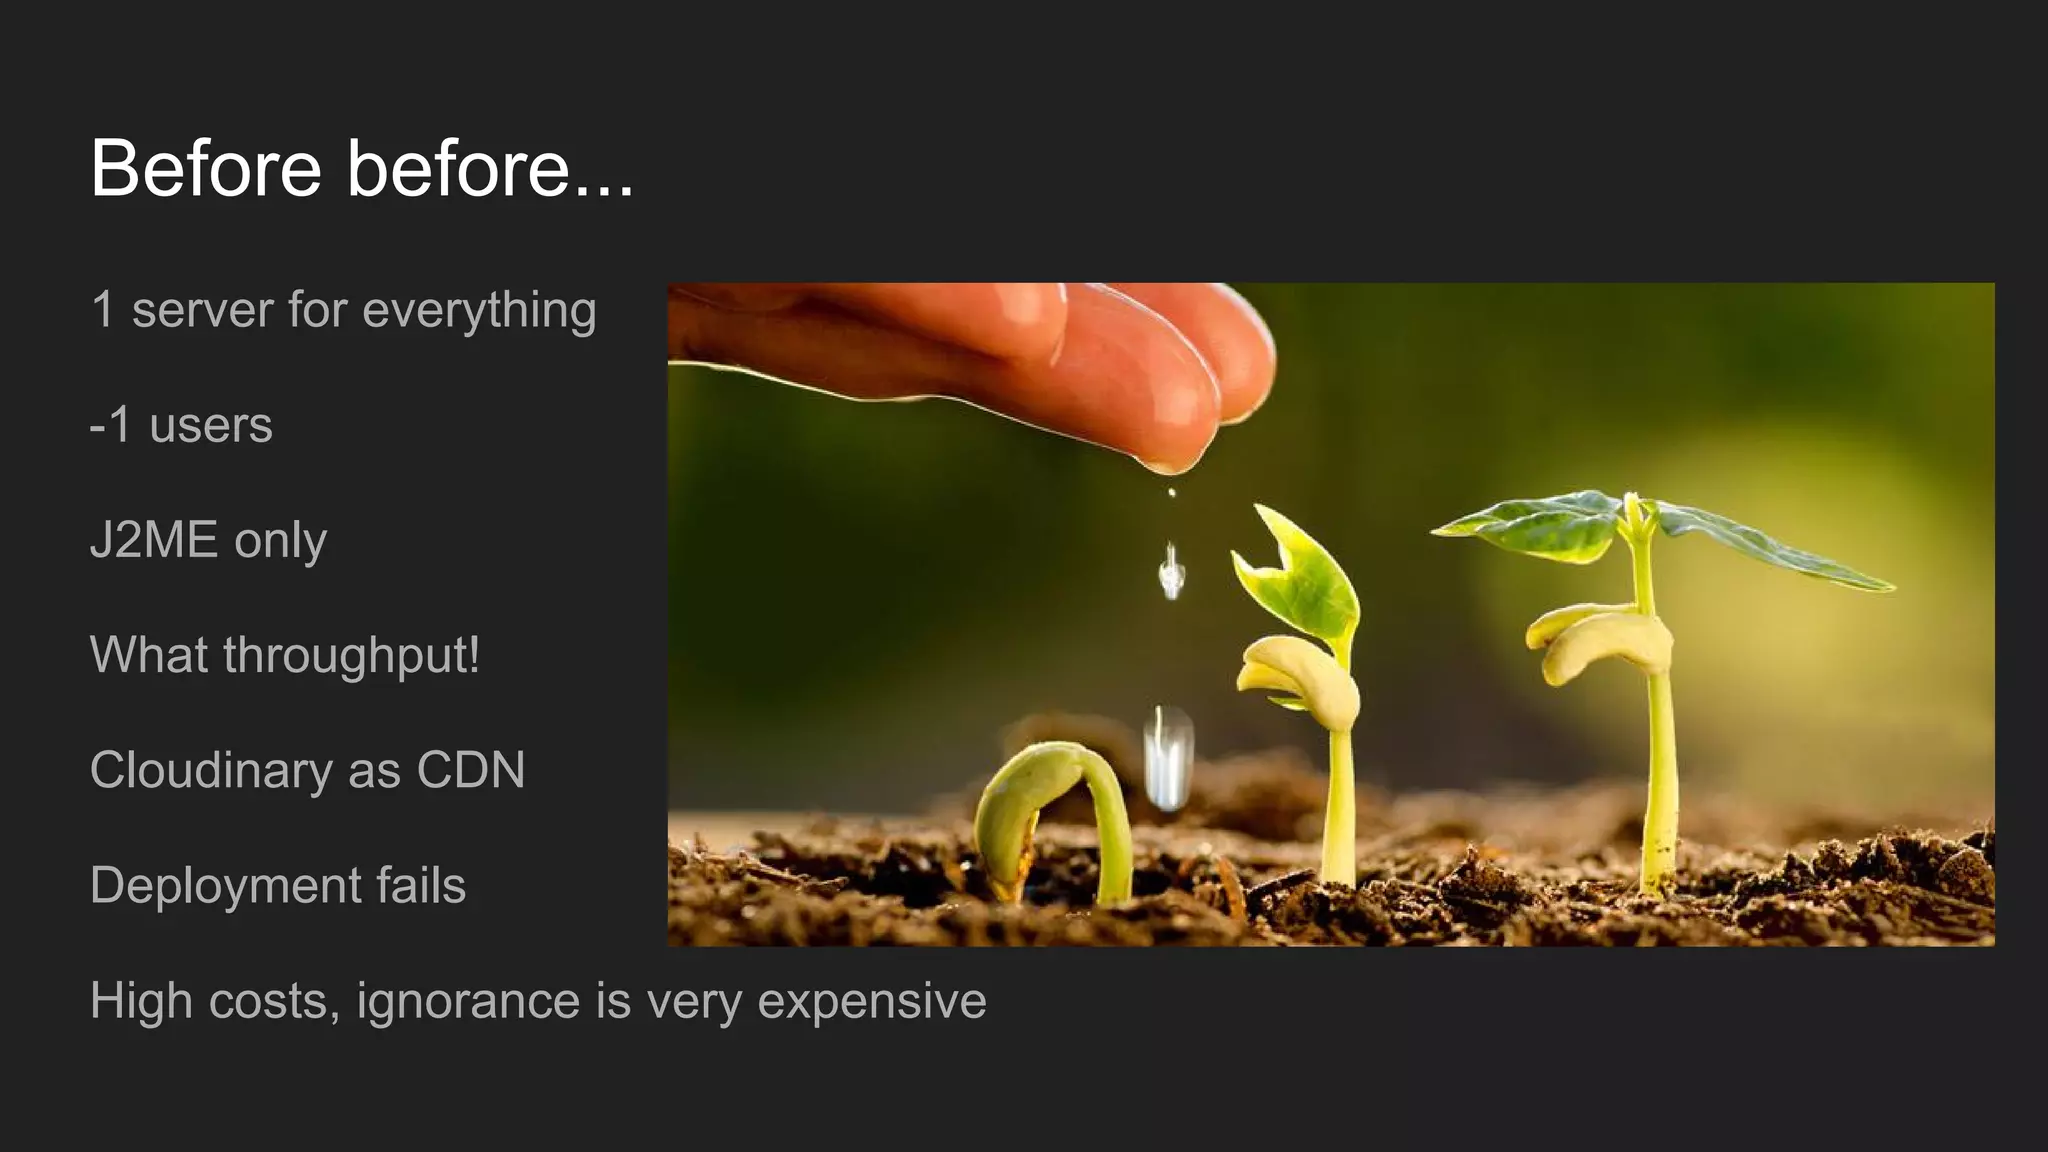

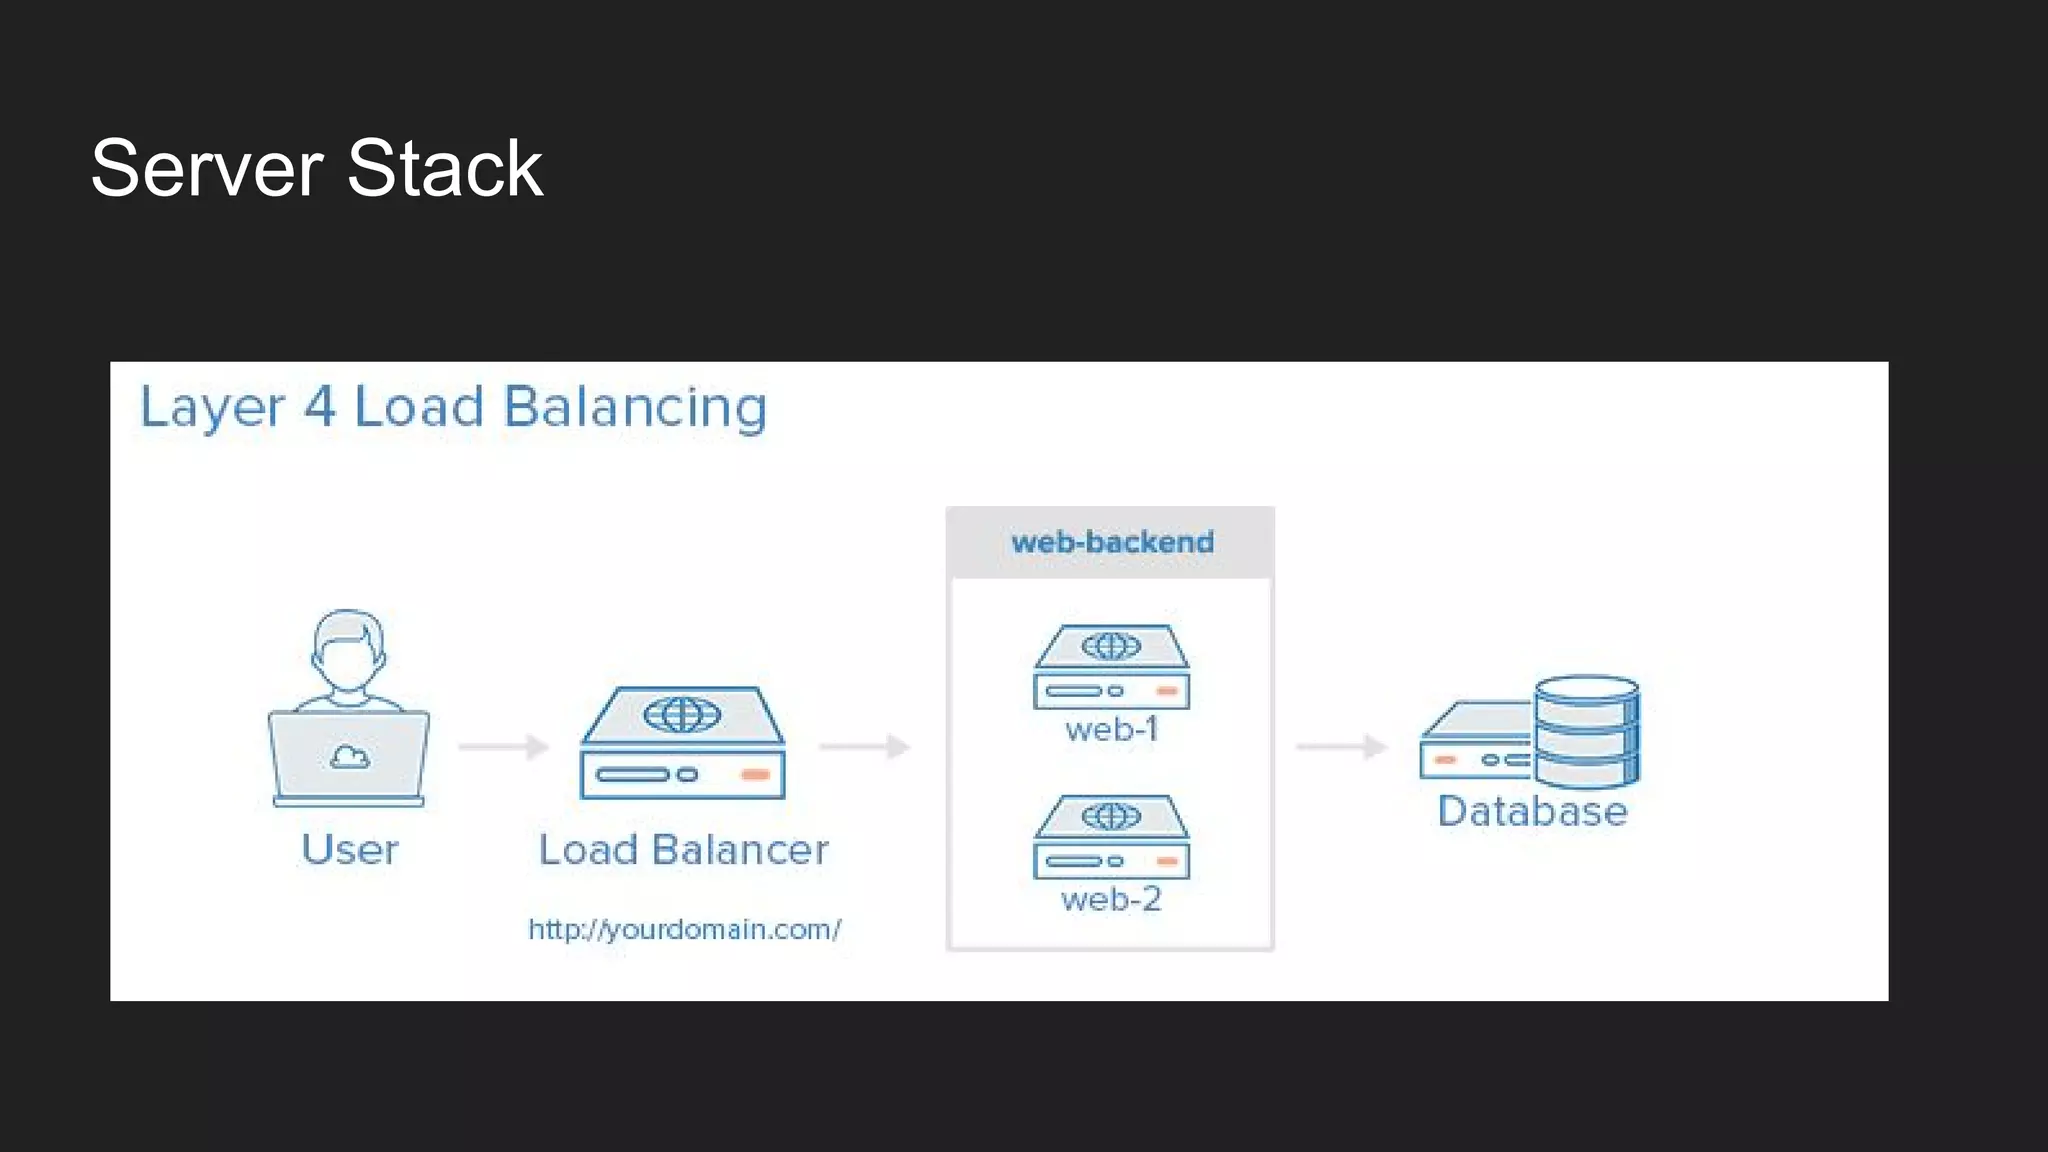
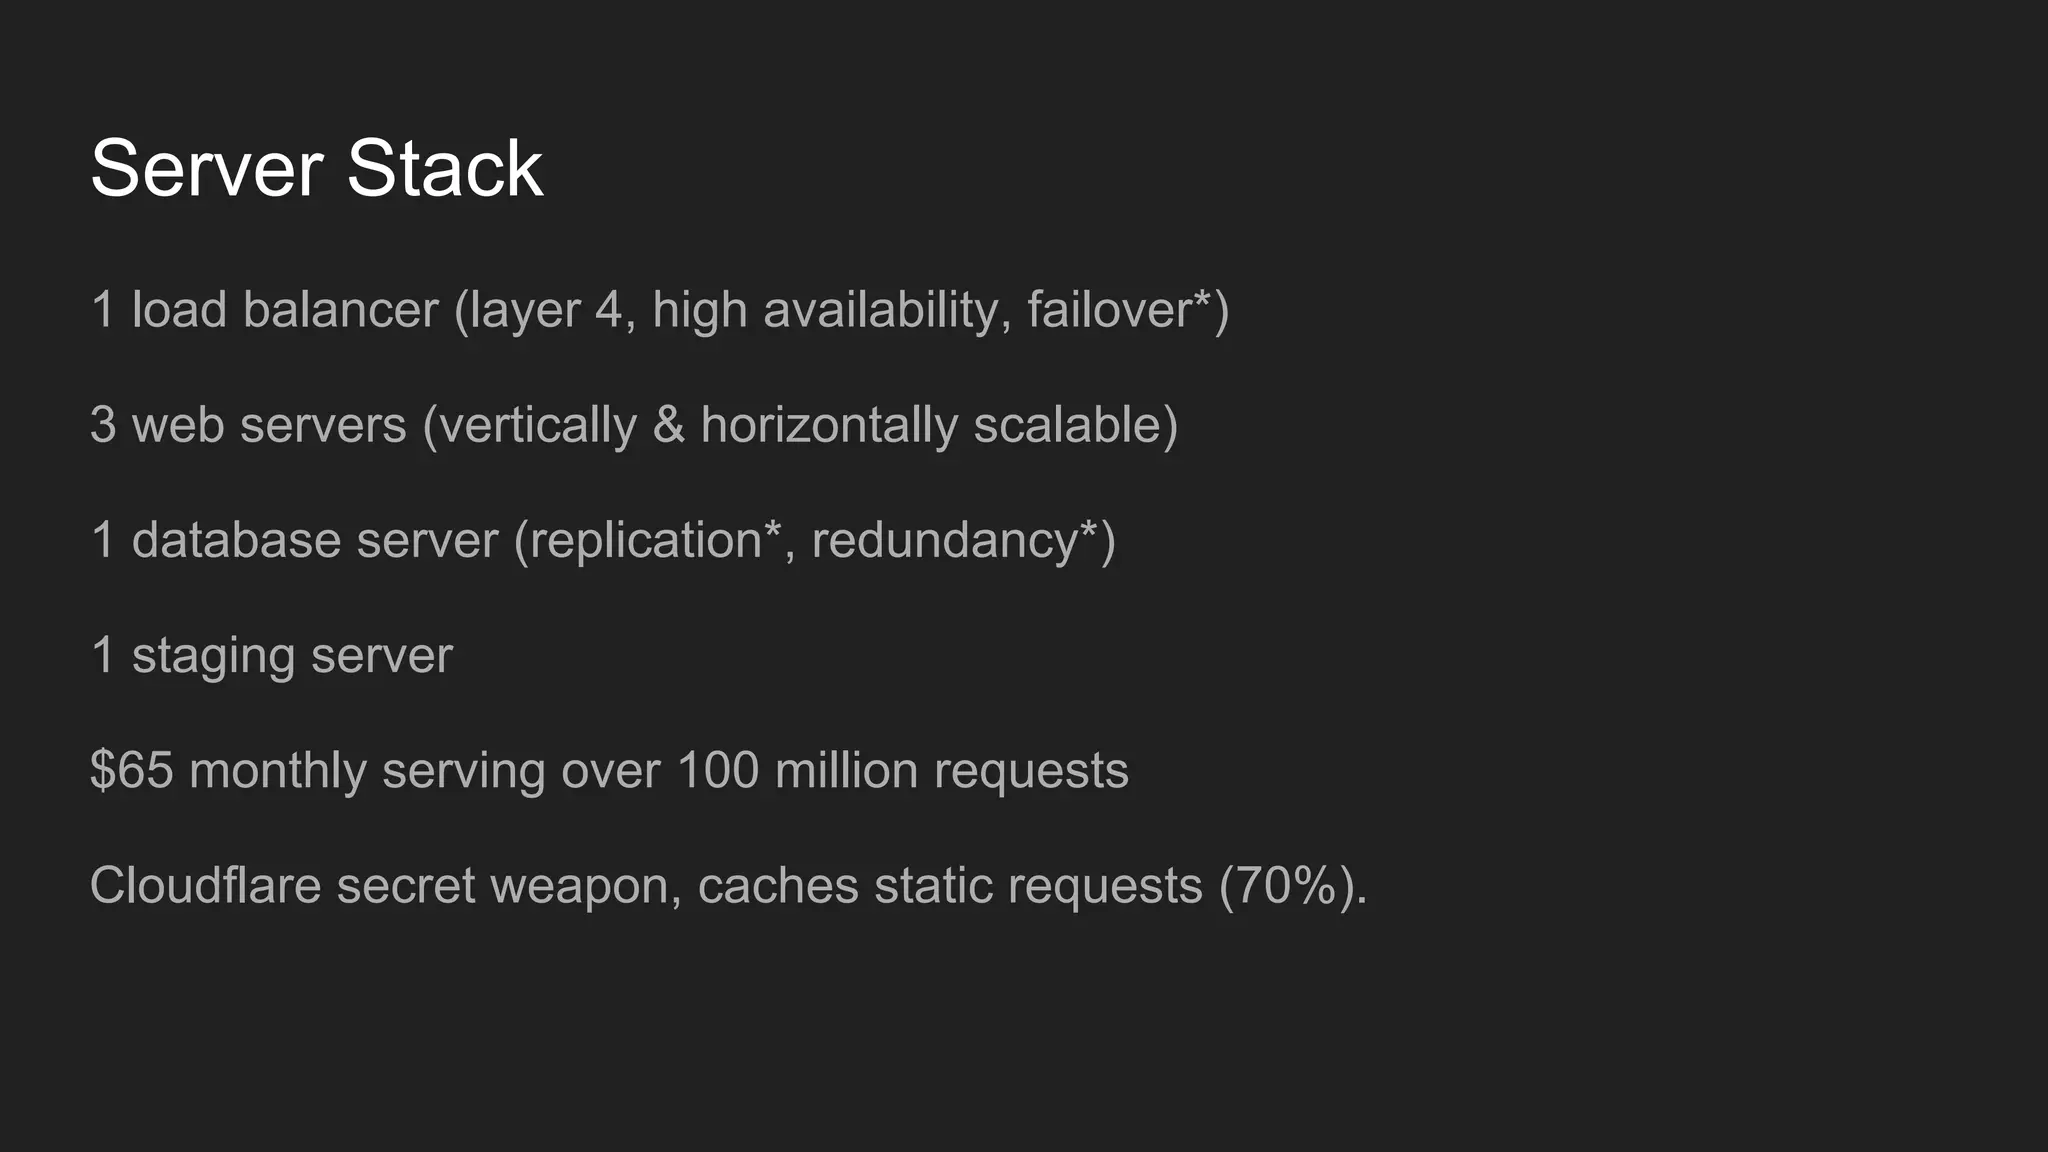
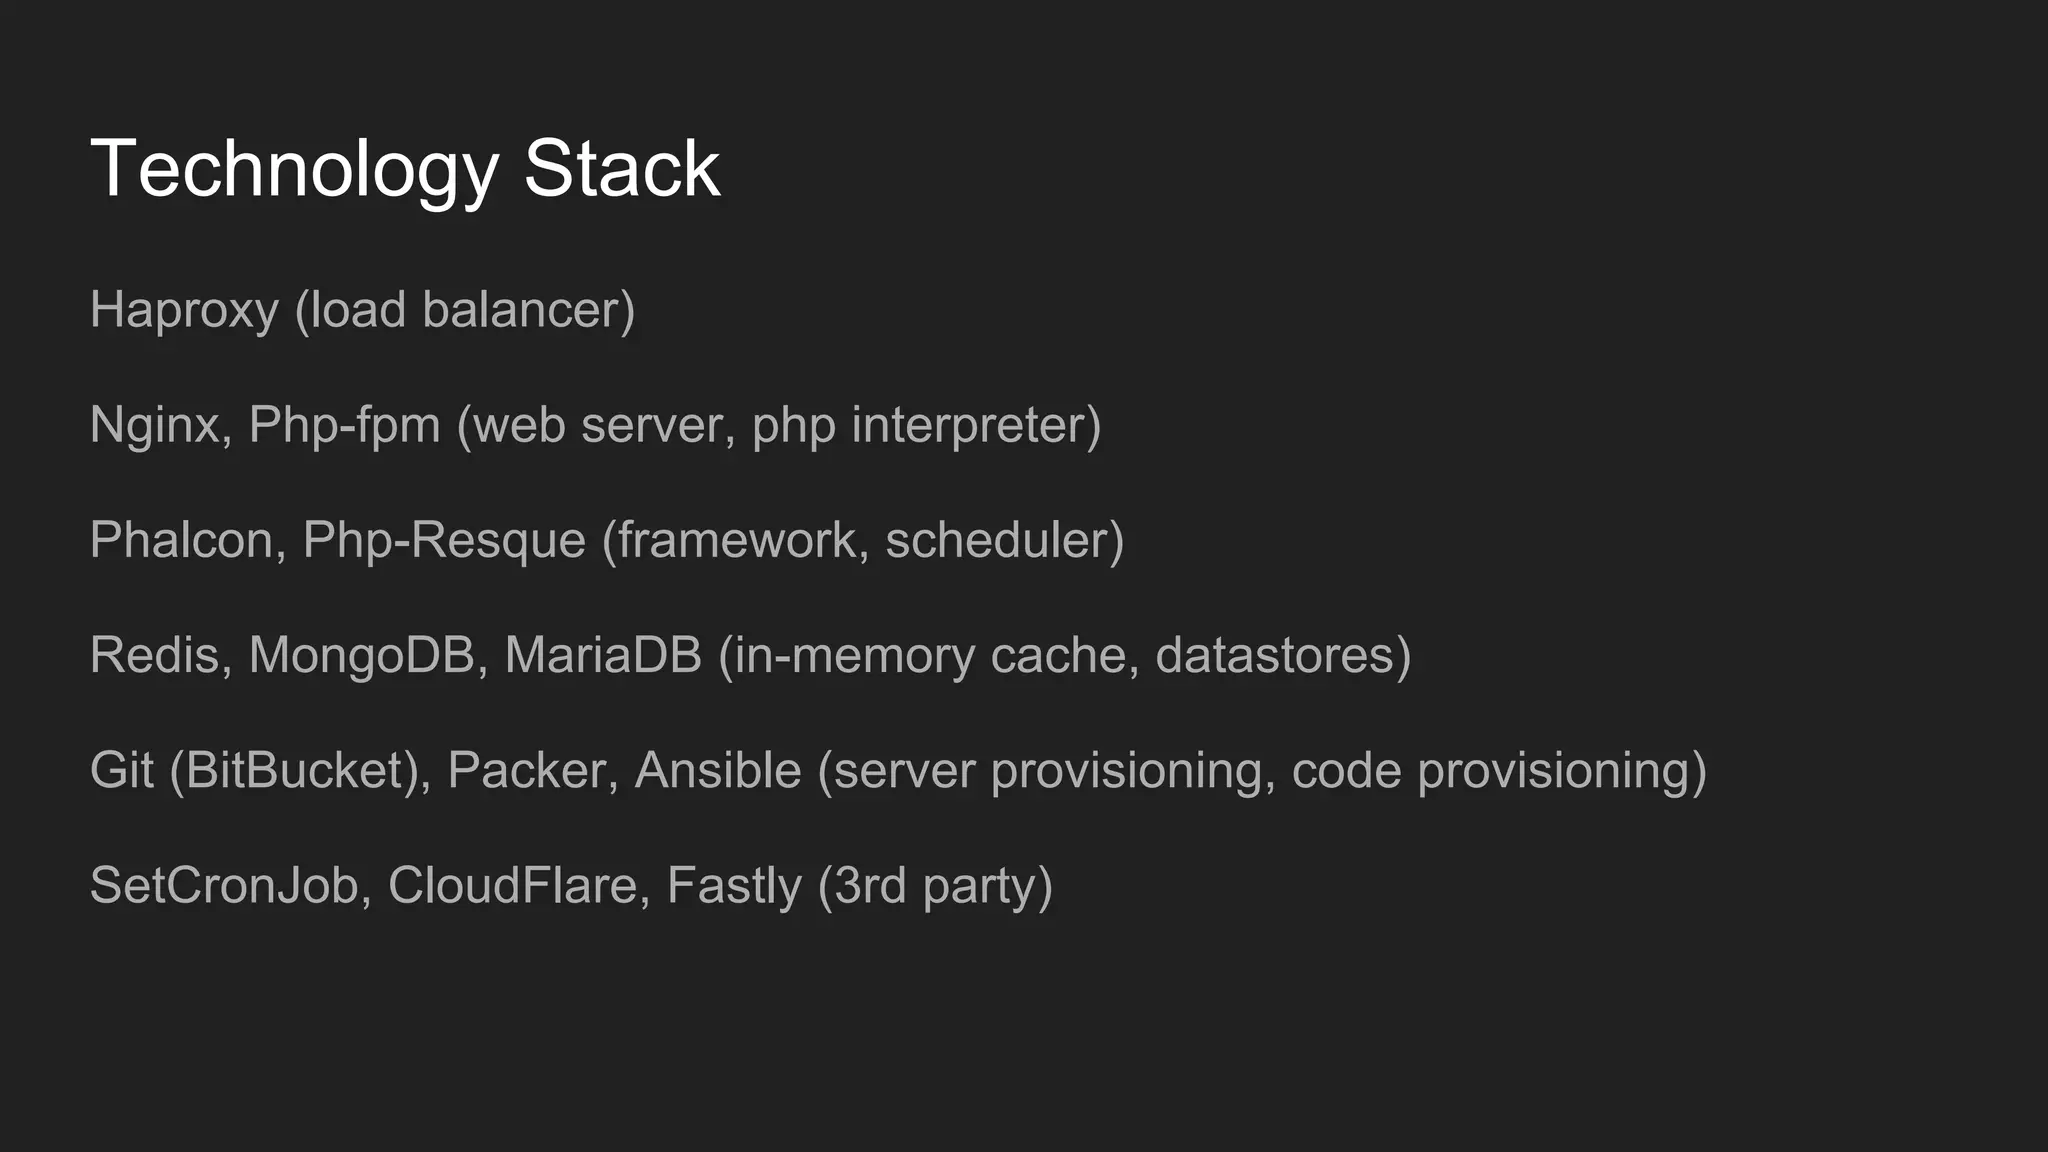


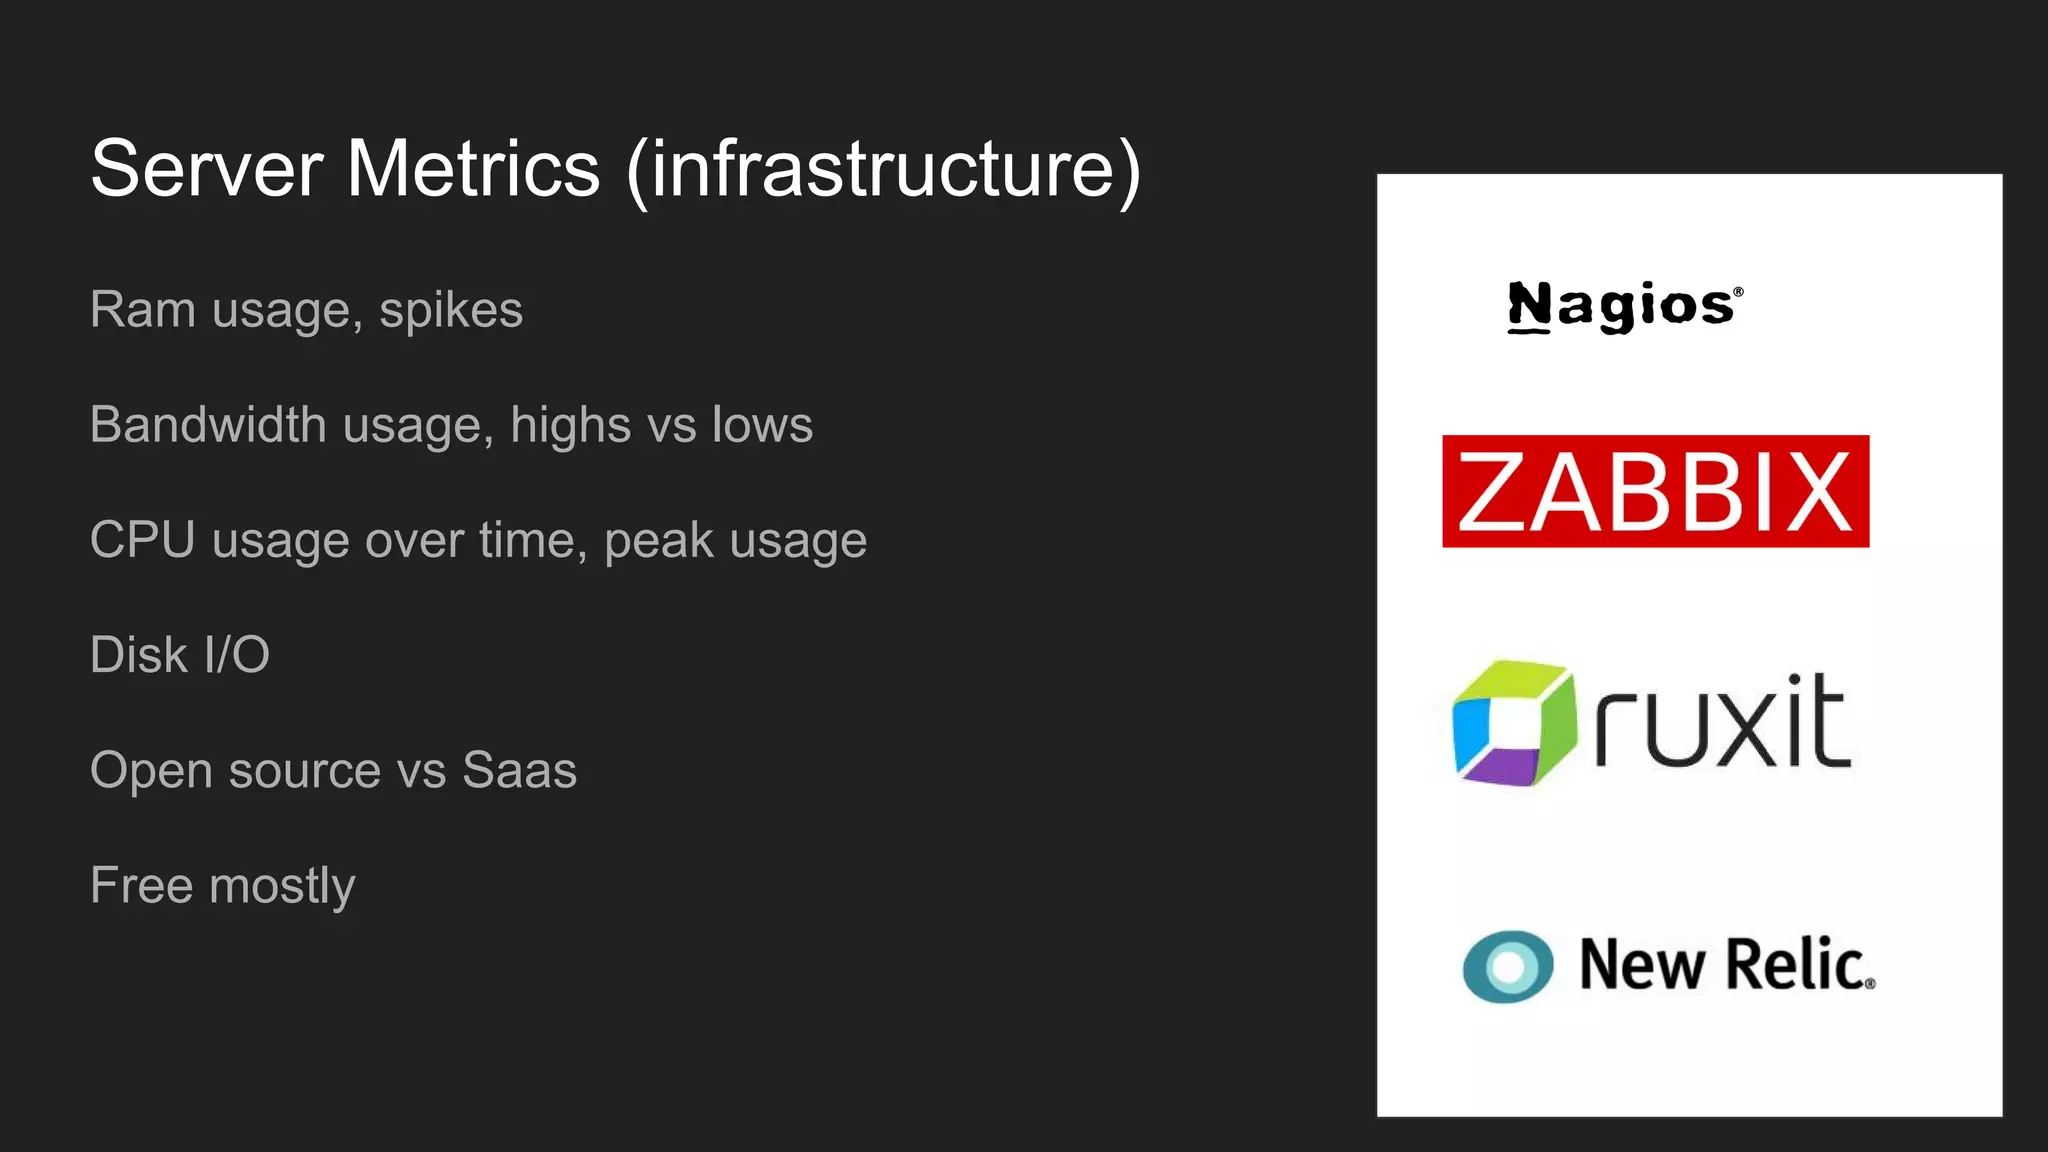
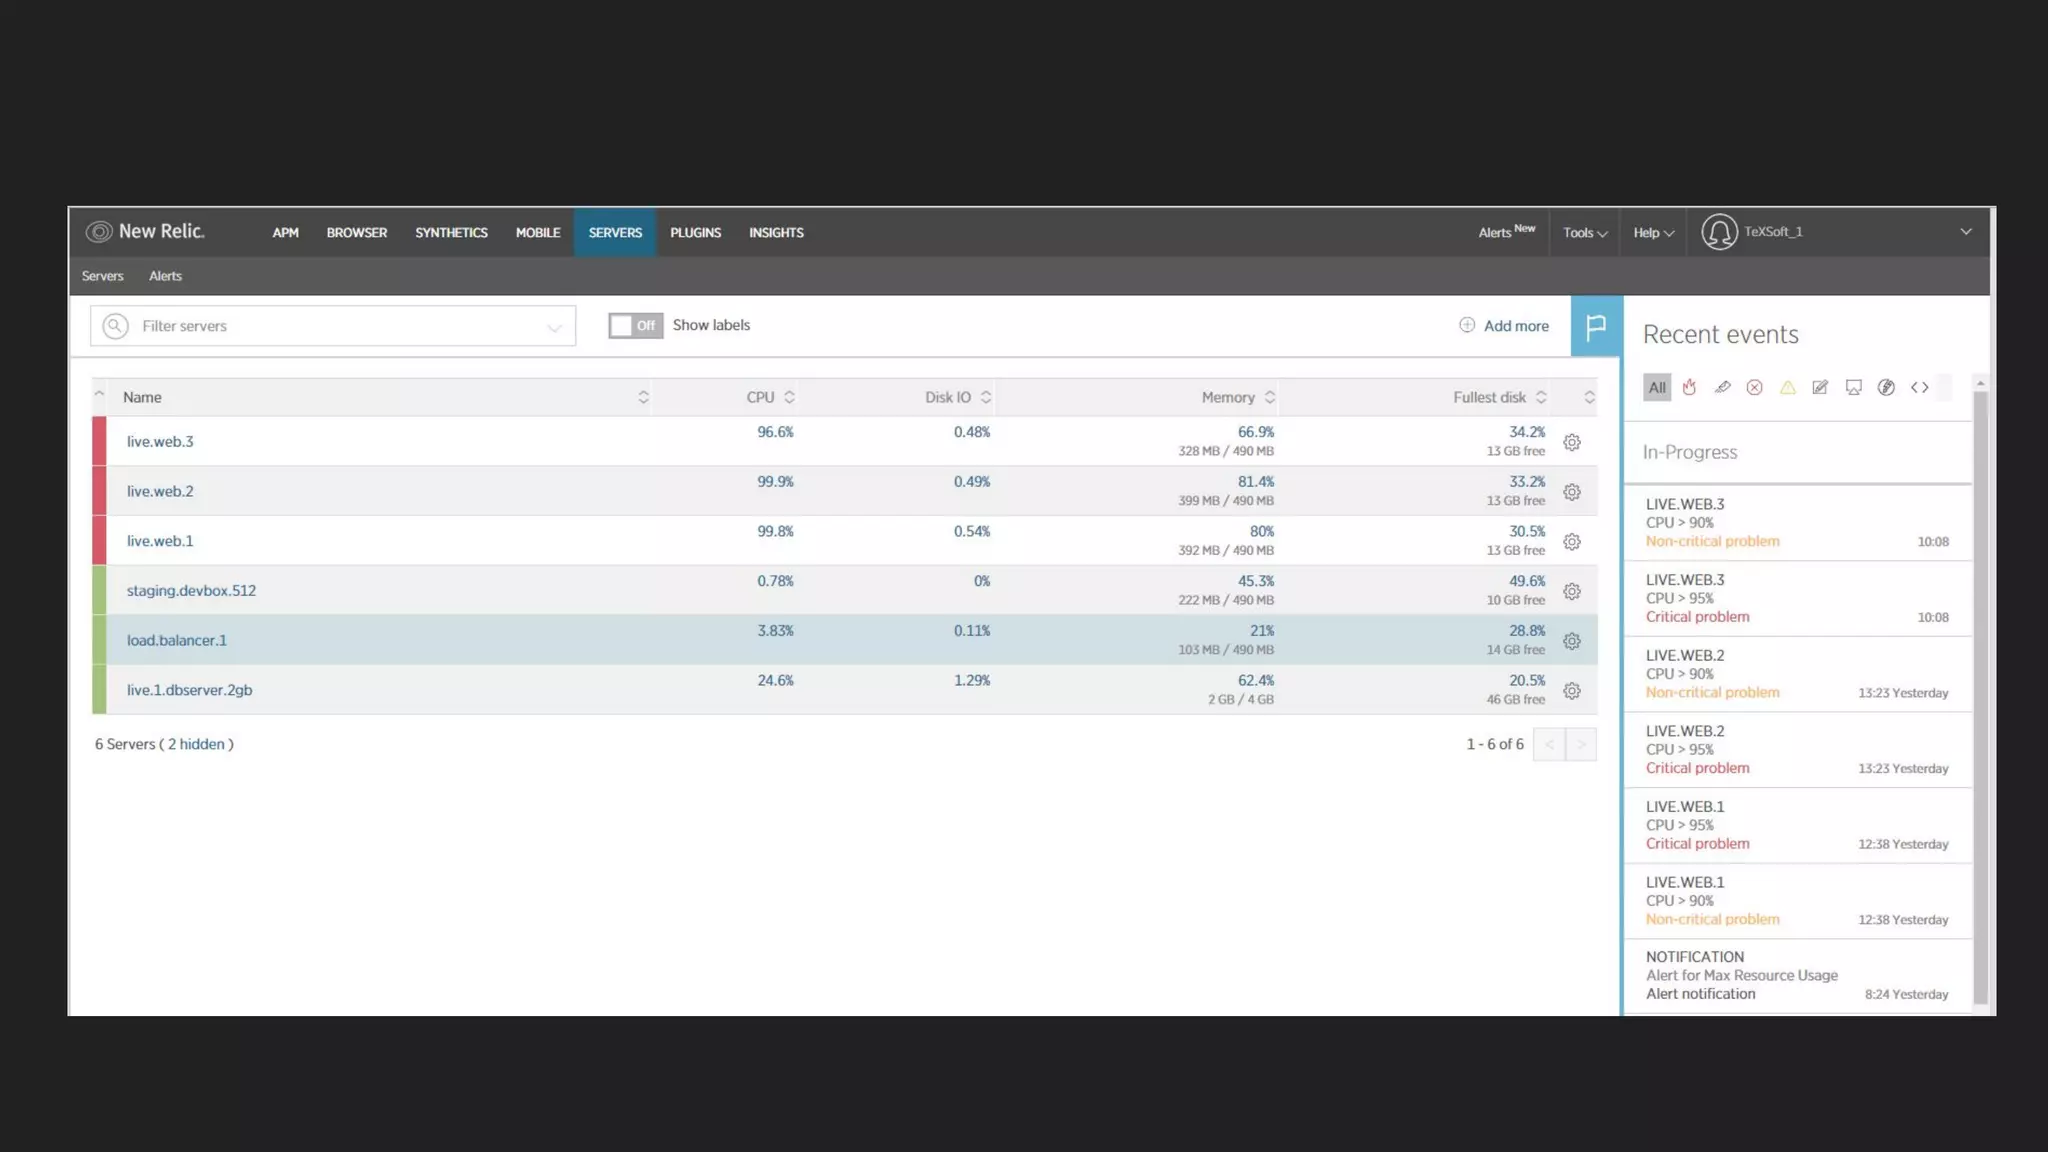
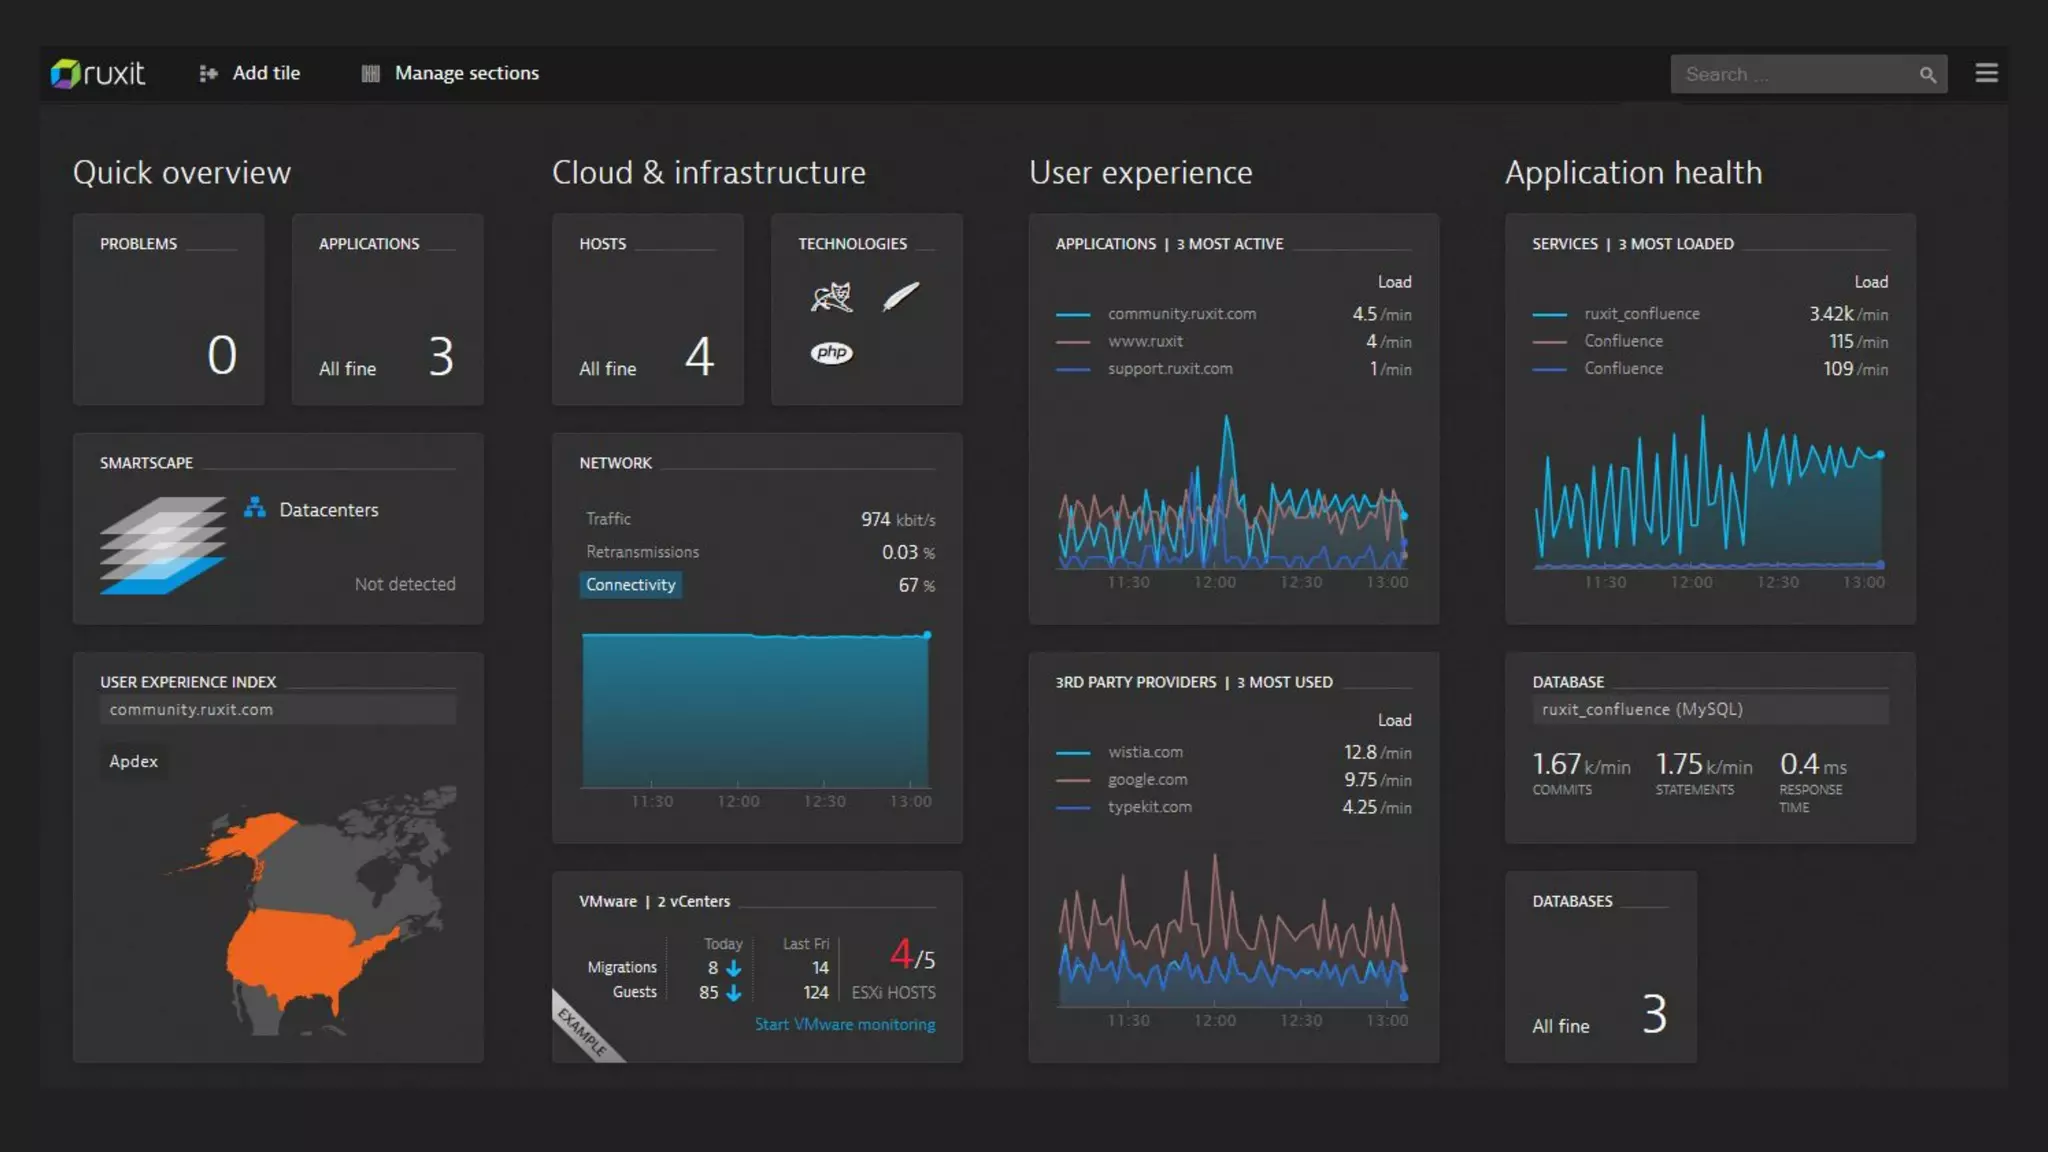
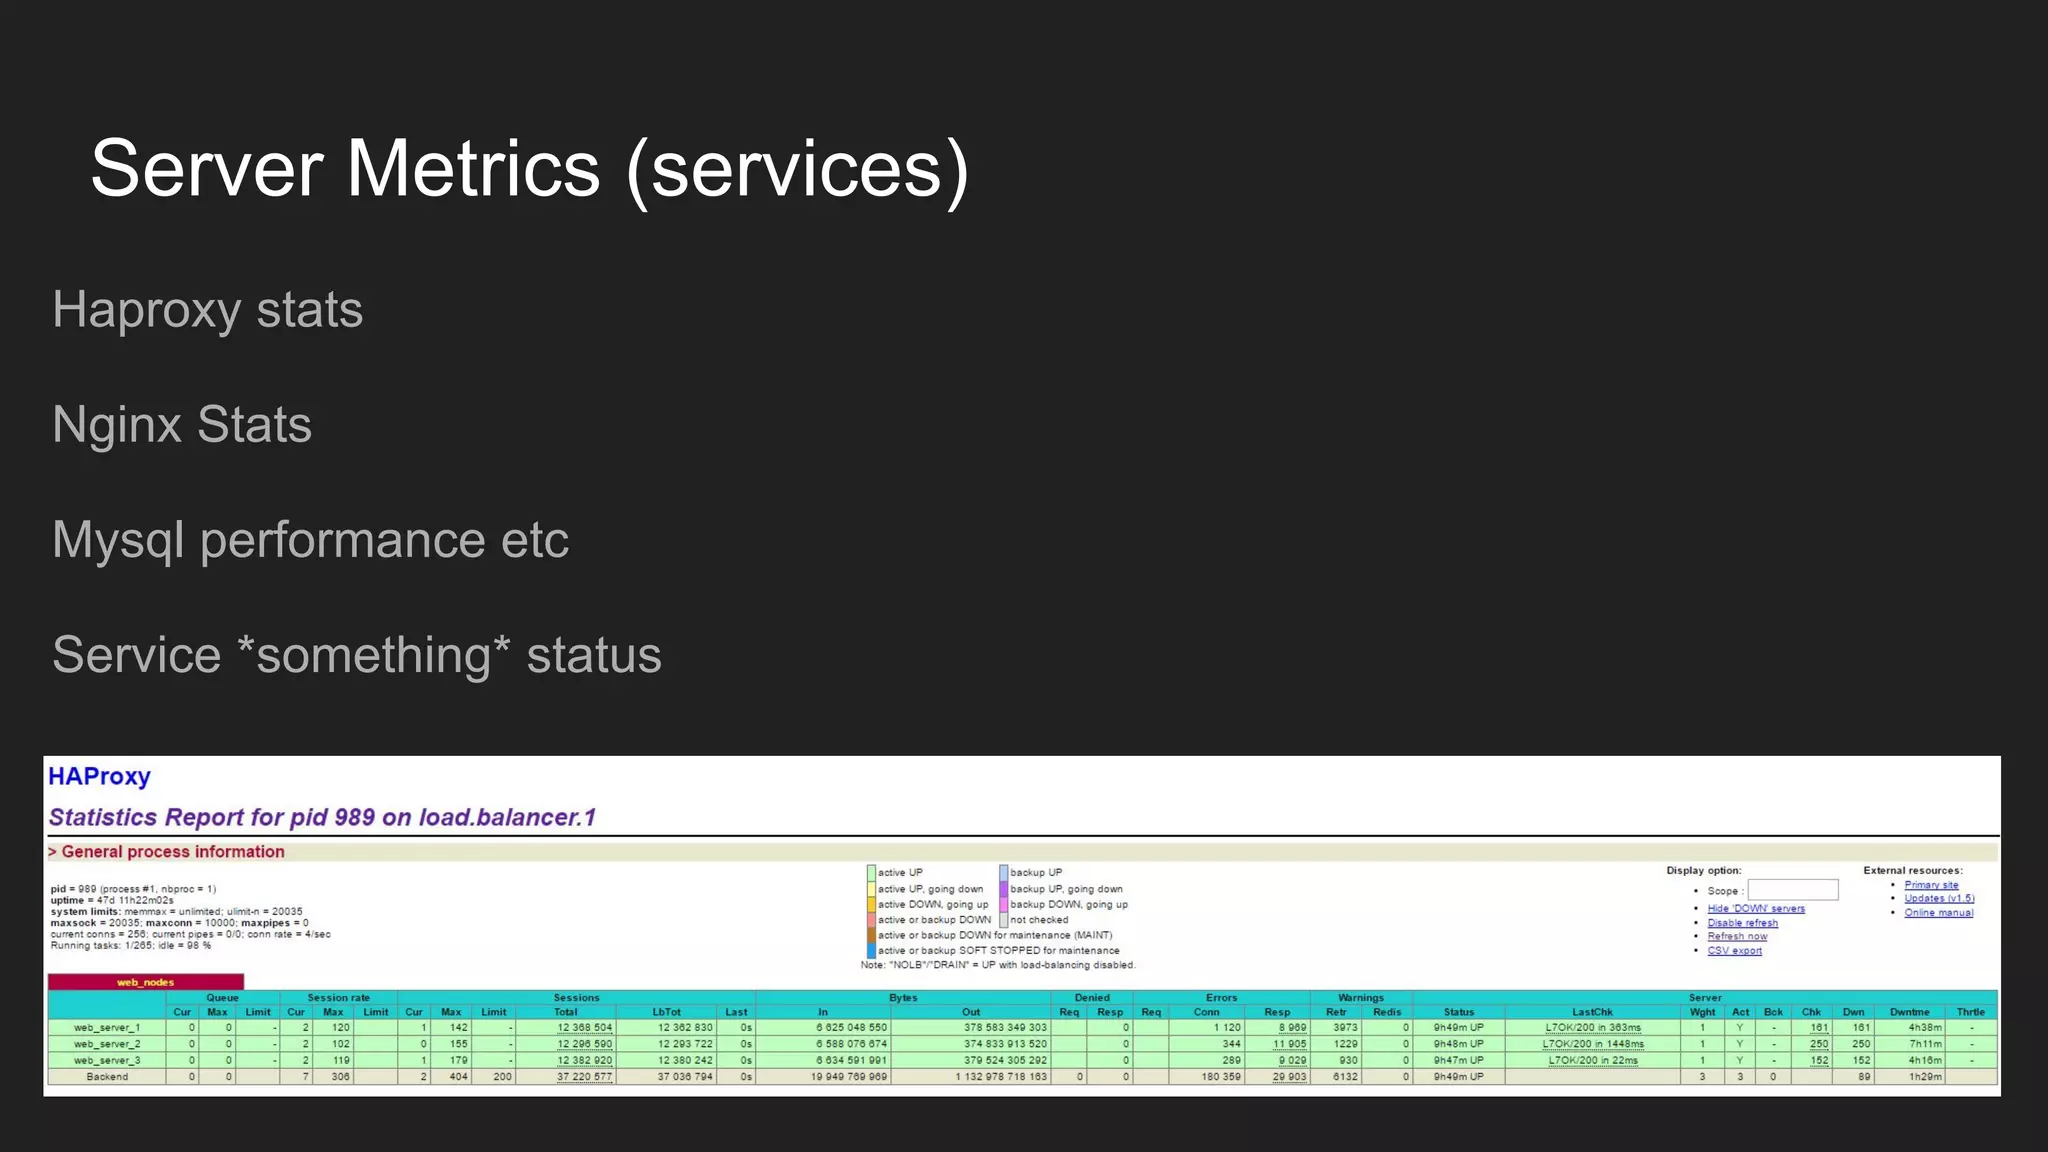
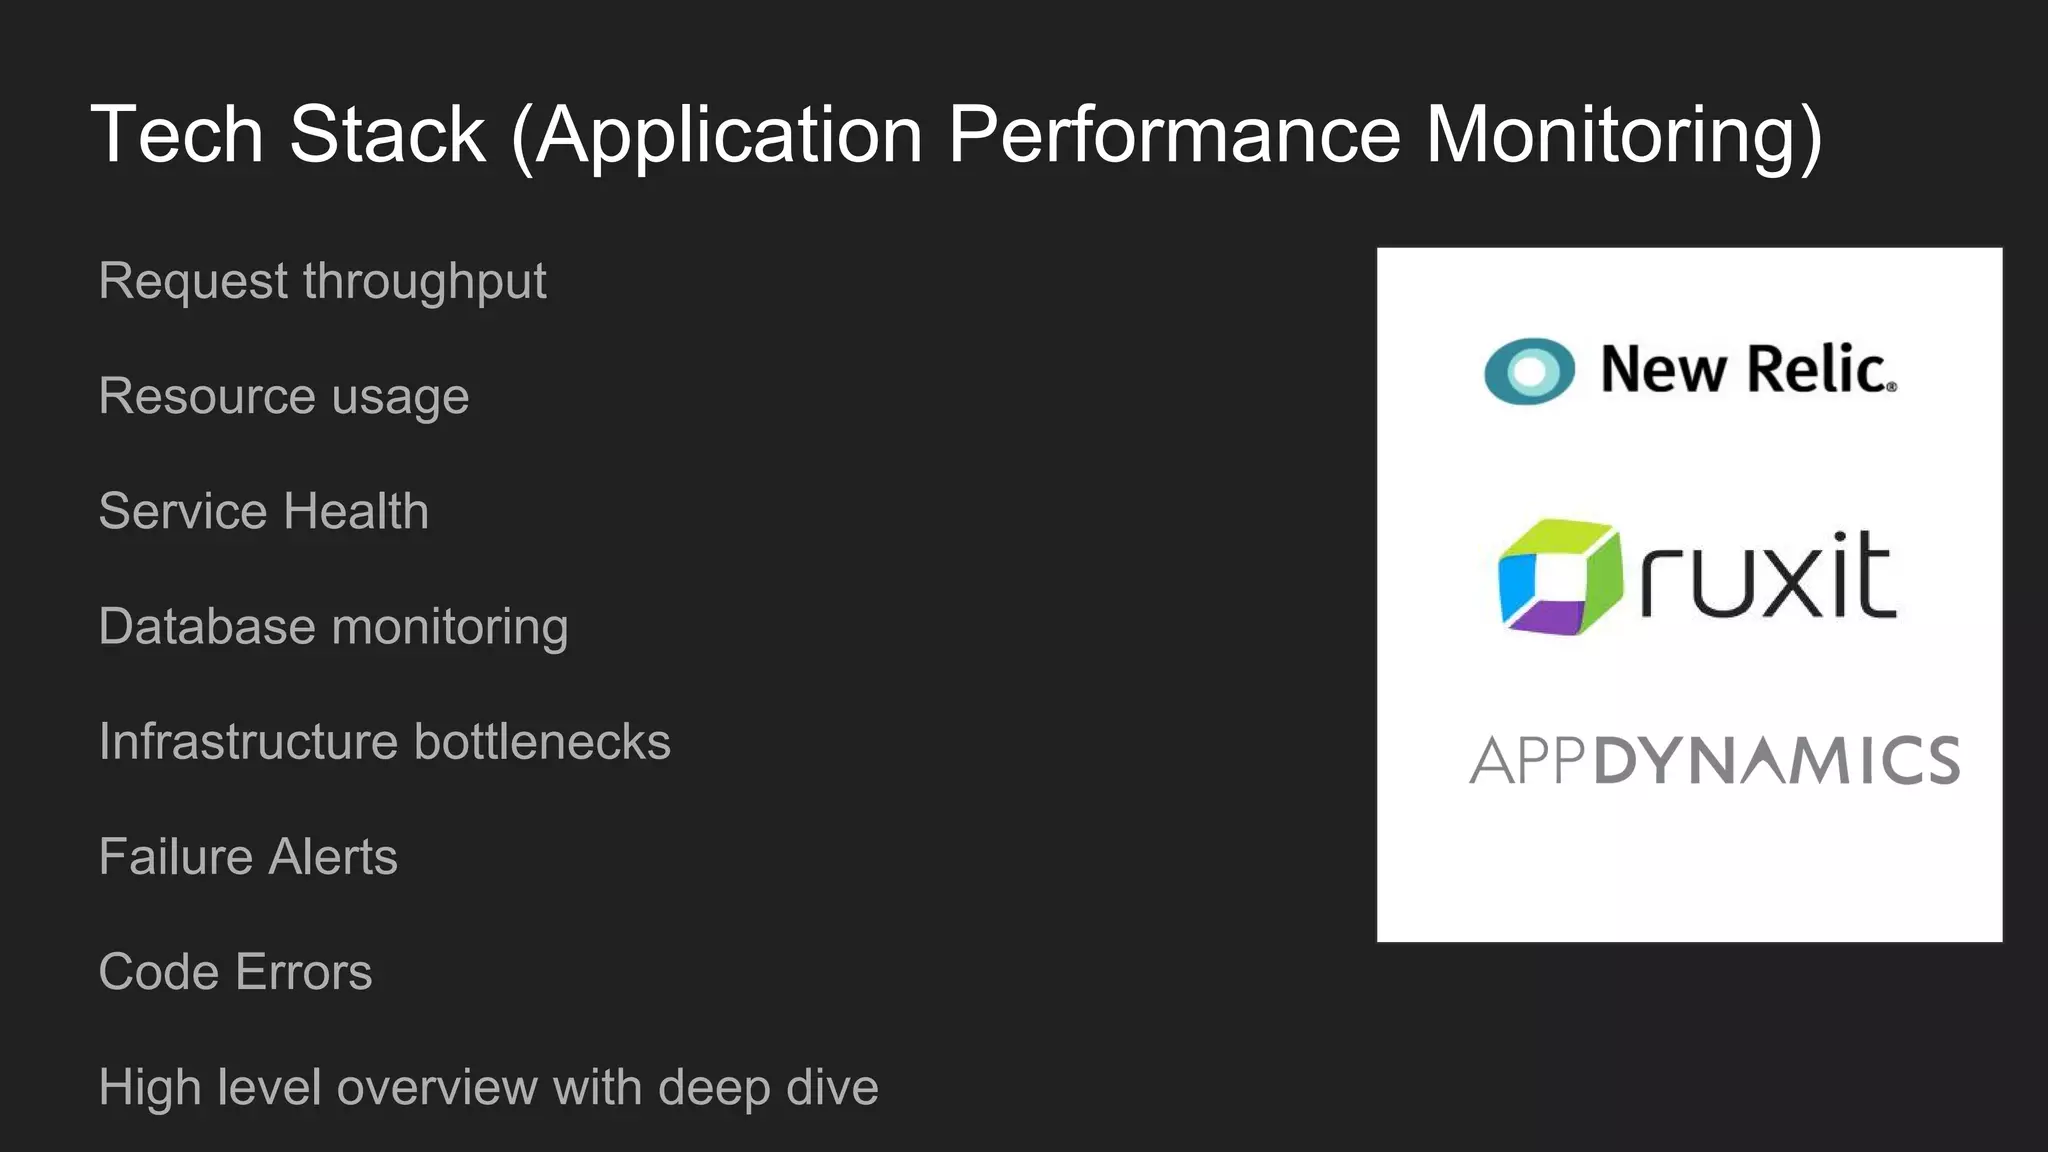


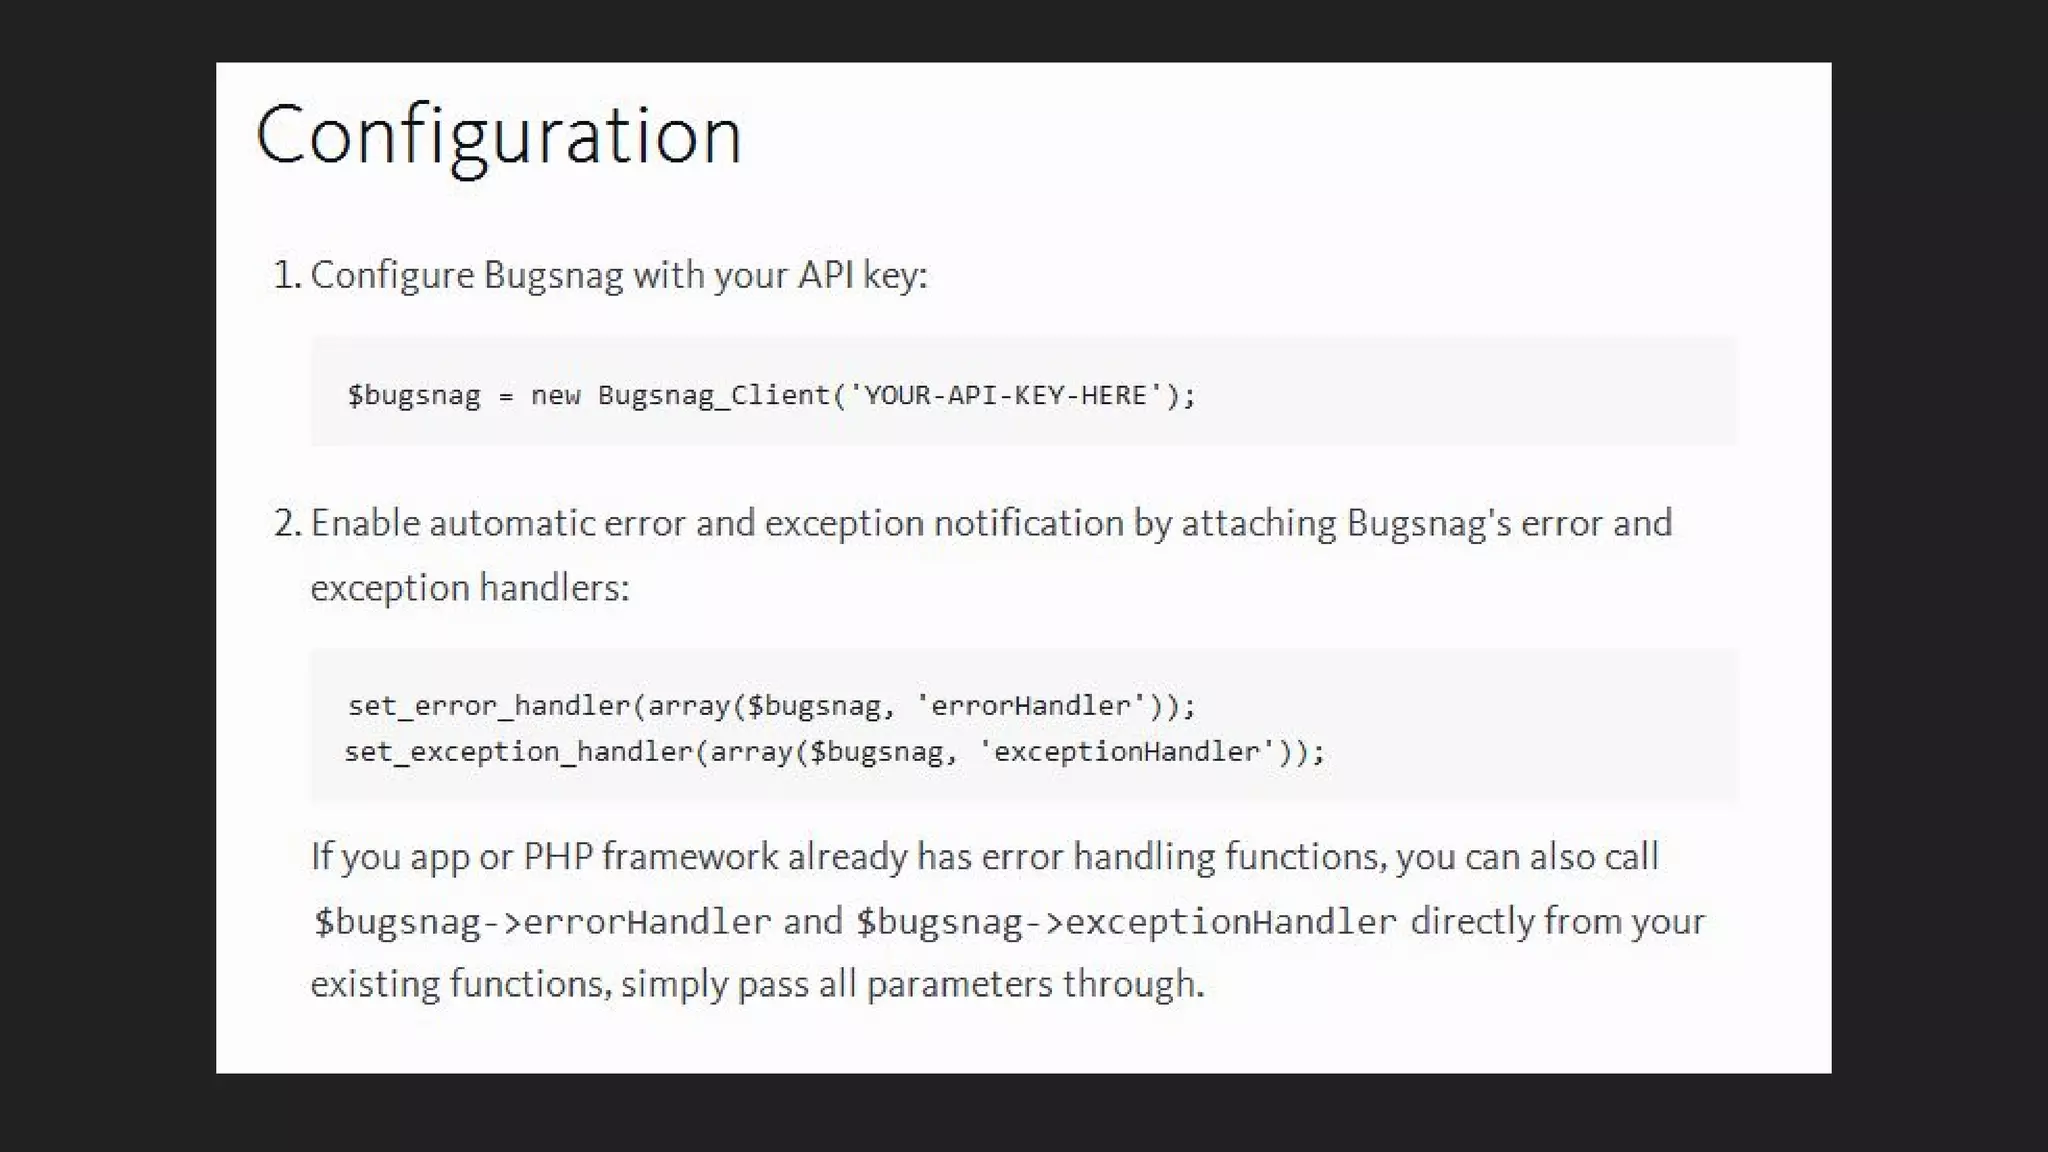
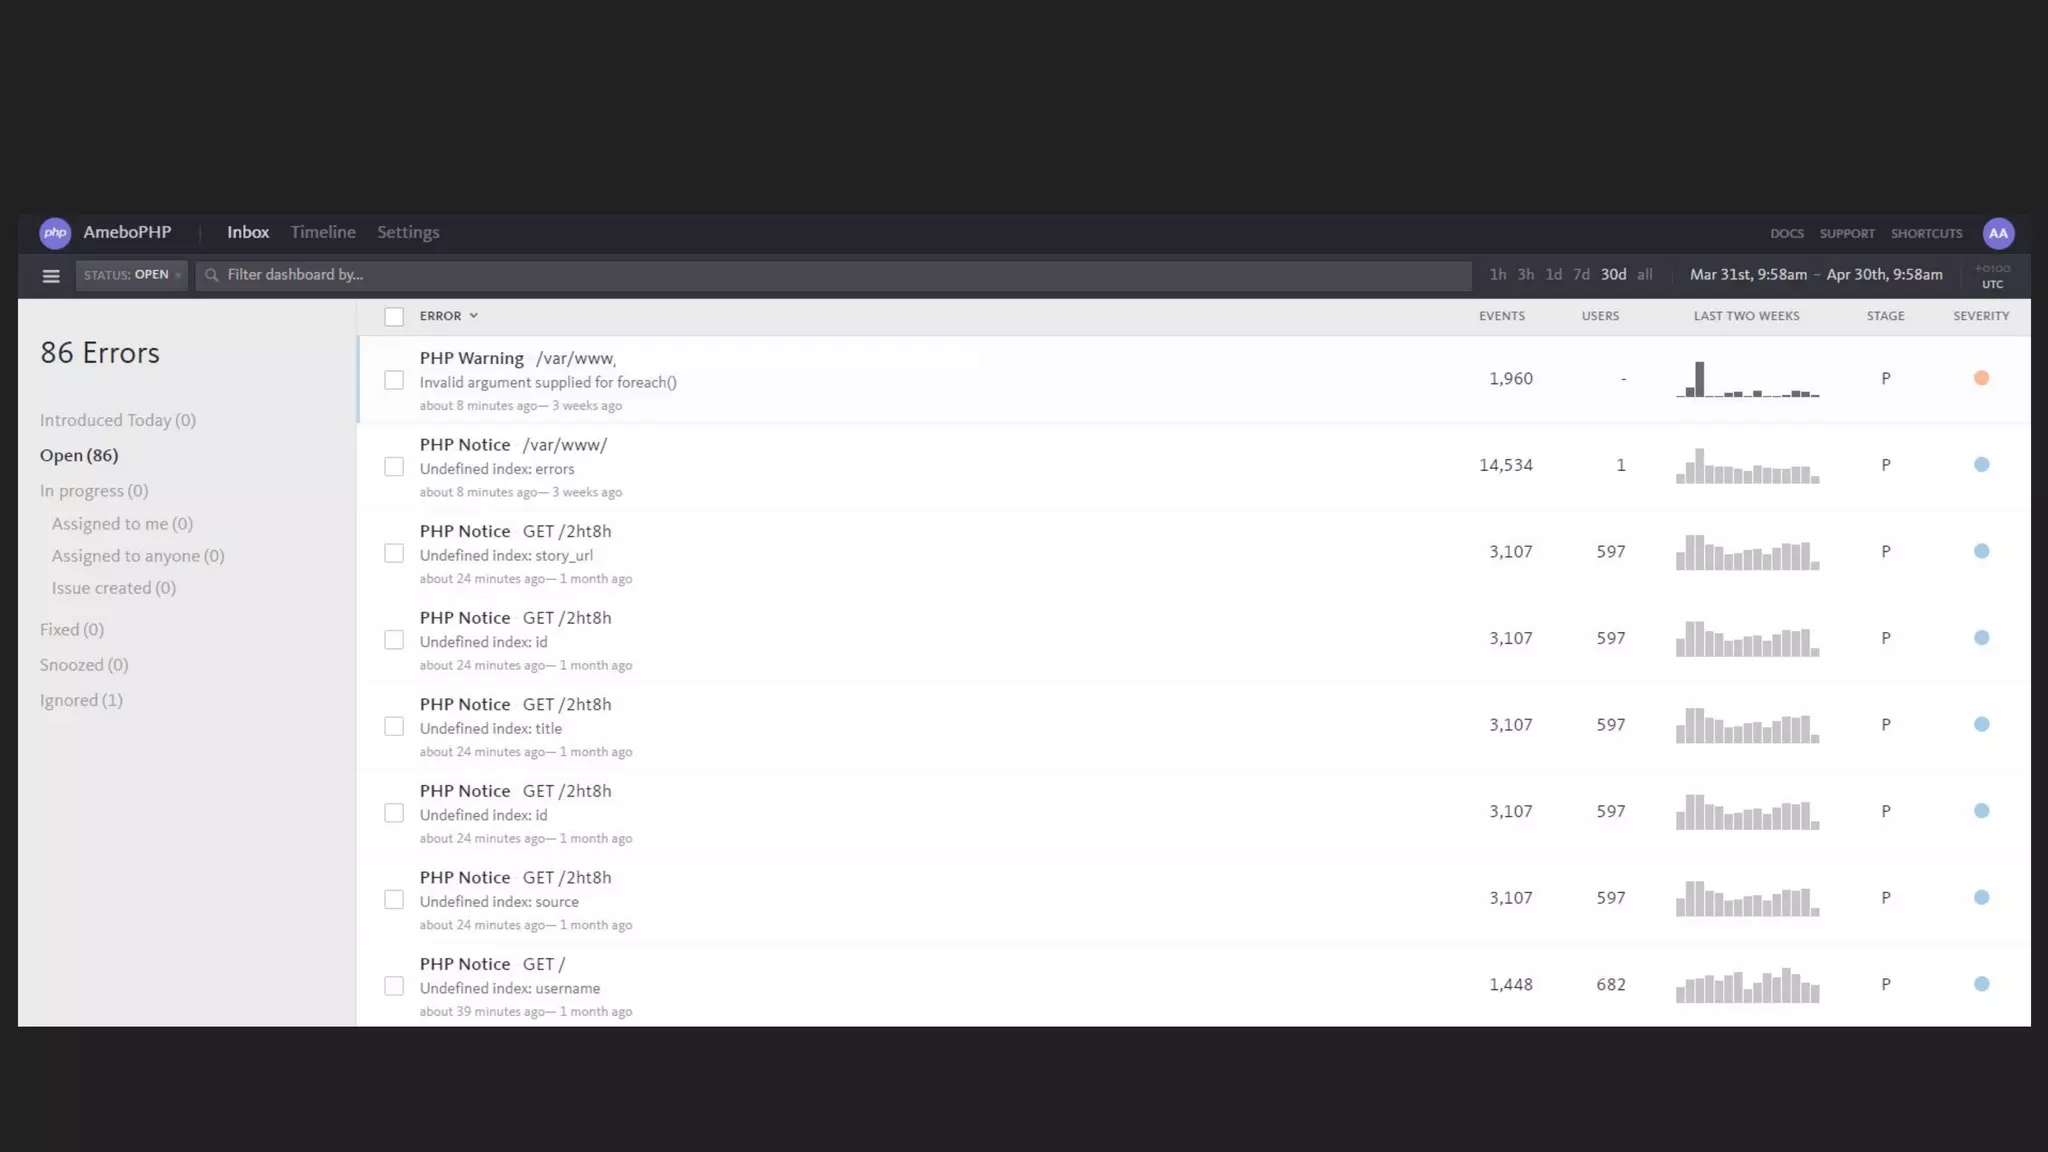


This document discusses server monitoring strategies for scaling applications. It recommends: 1) Using a load balancer and multiple scalable web and database servers to handle increased traffic loads from hundreds of thousands of users on multi-platform apps. 2) Monitoring key server metrics like CPU usage, bandwidth usage, and application errors to improve stability and catch issues. 3) Tracking logs, client errors, and infrastructure bottlenecks to debug problems and prevent outages like those that led some companies to be "acquired" due to technical failures.


![[Webinar] AWS Monitoring with Site24x7](https://cdn.slidesharecdn.com/ss_thumbnails/site24x7-awsmonitoringwithsite24x704thnov2015-151105060402-lva1-app6891-thumbnail.jpg?width=640&height=640&fit=bounds)