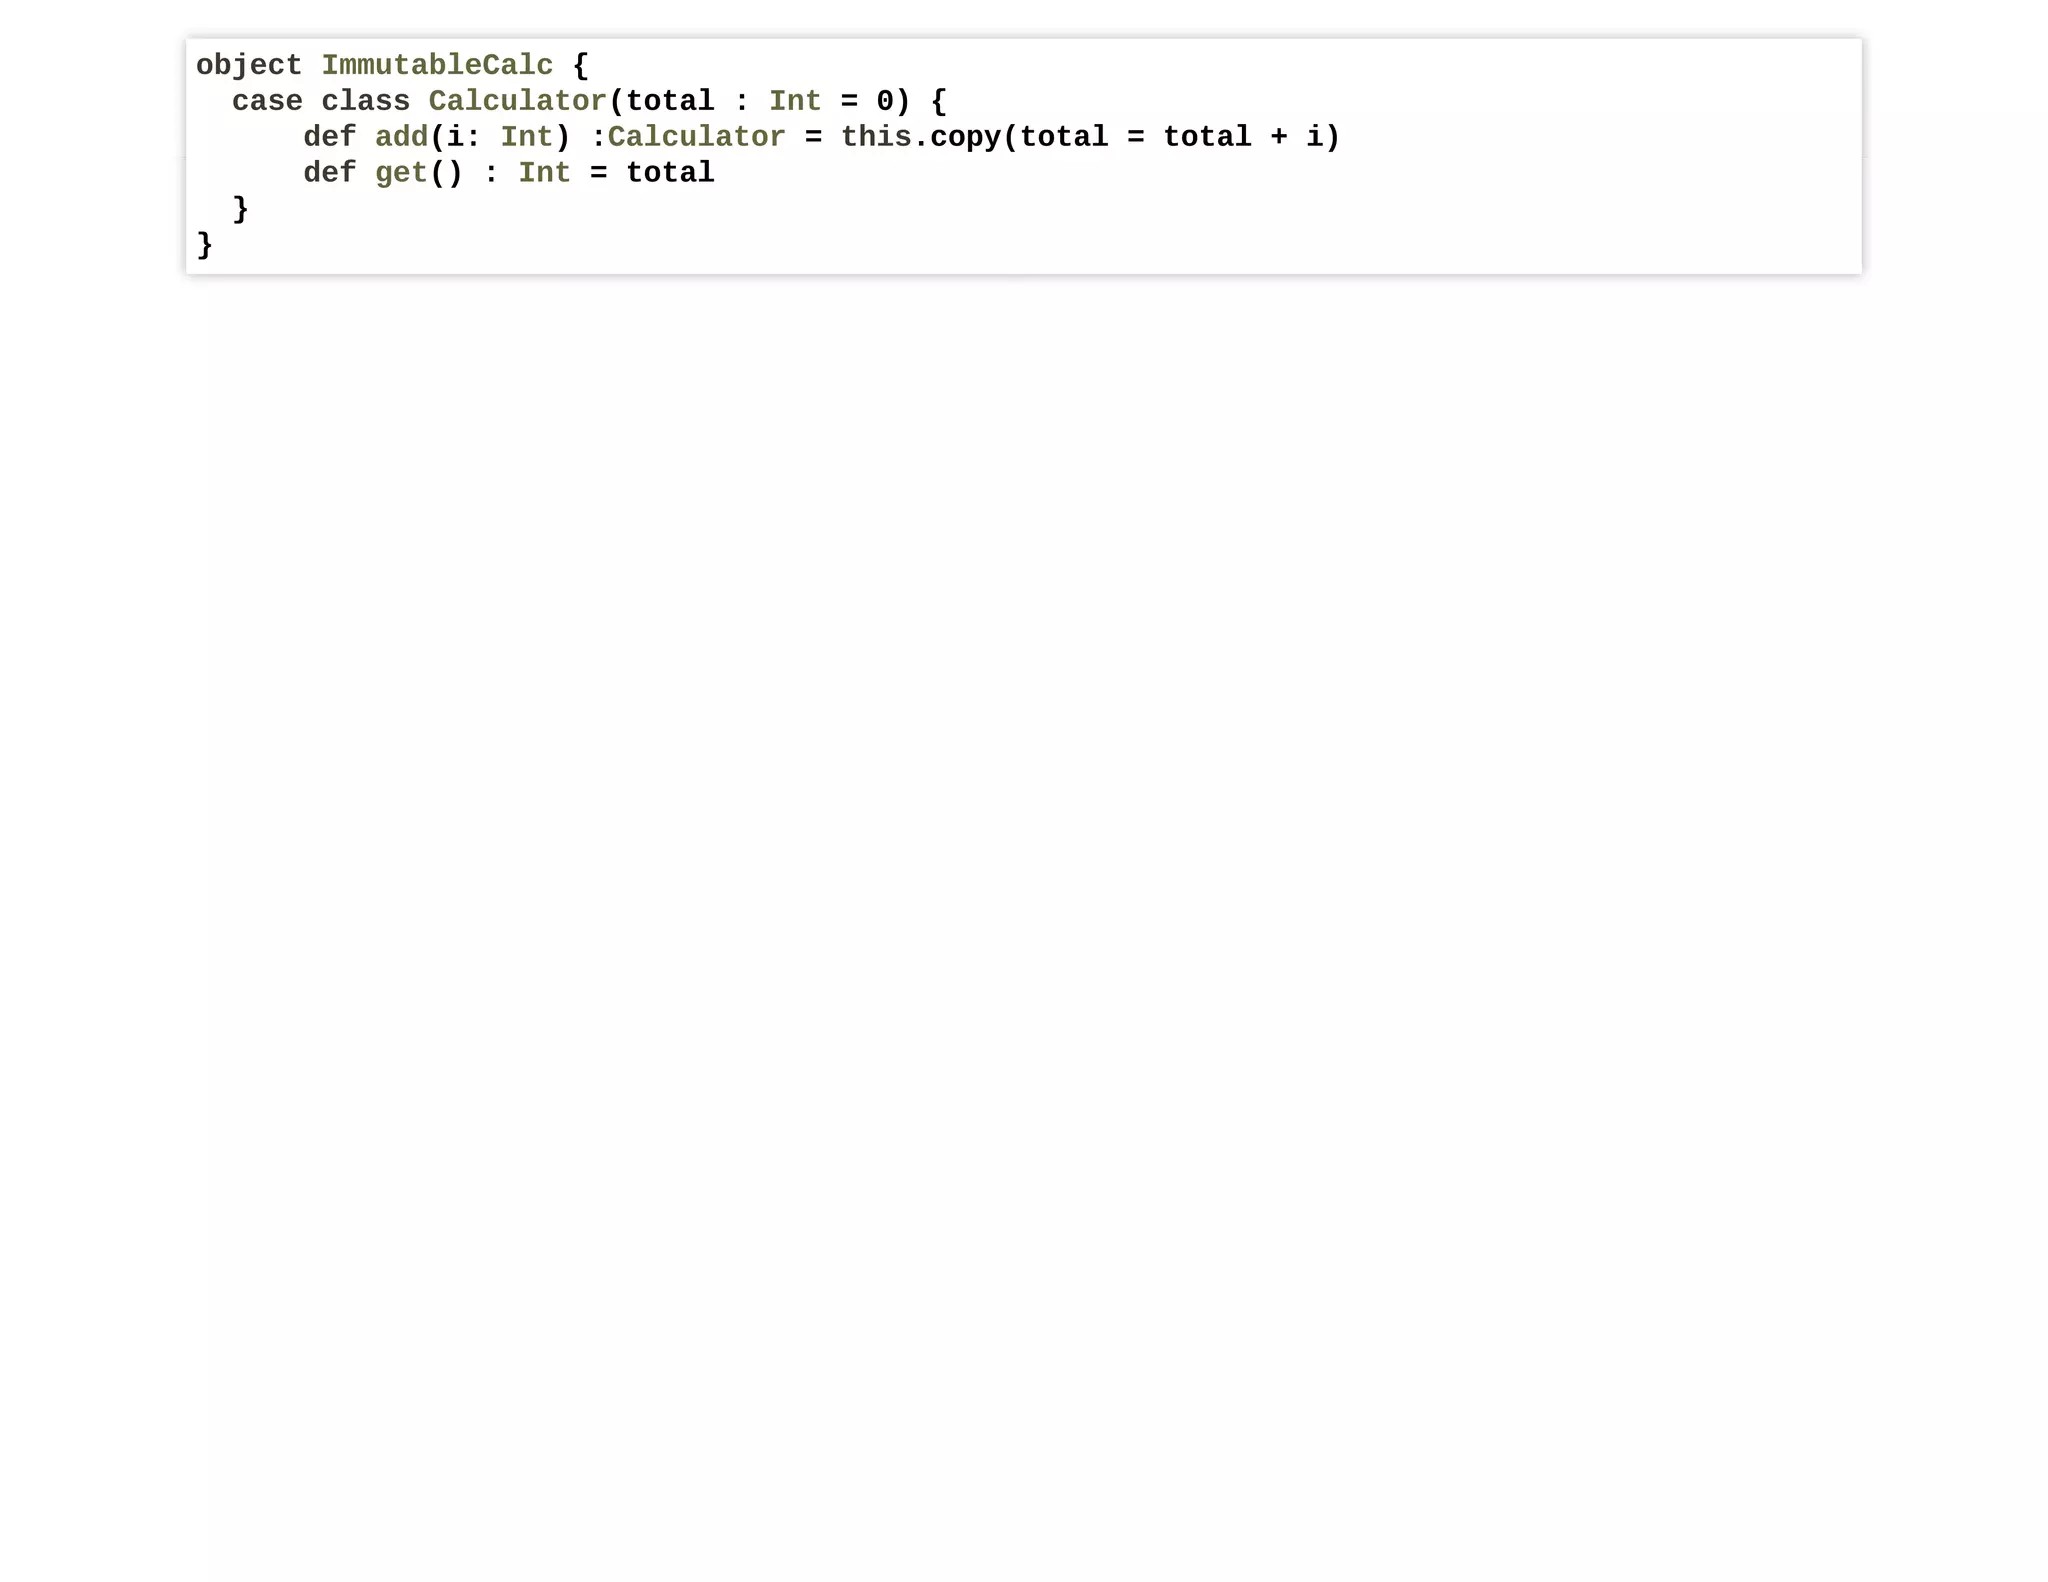
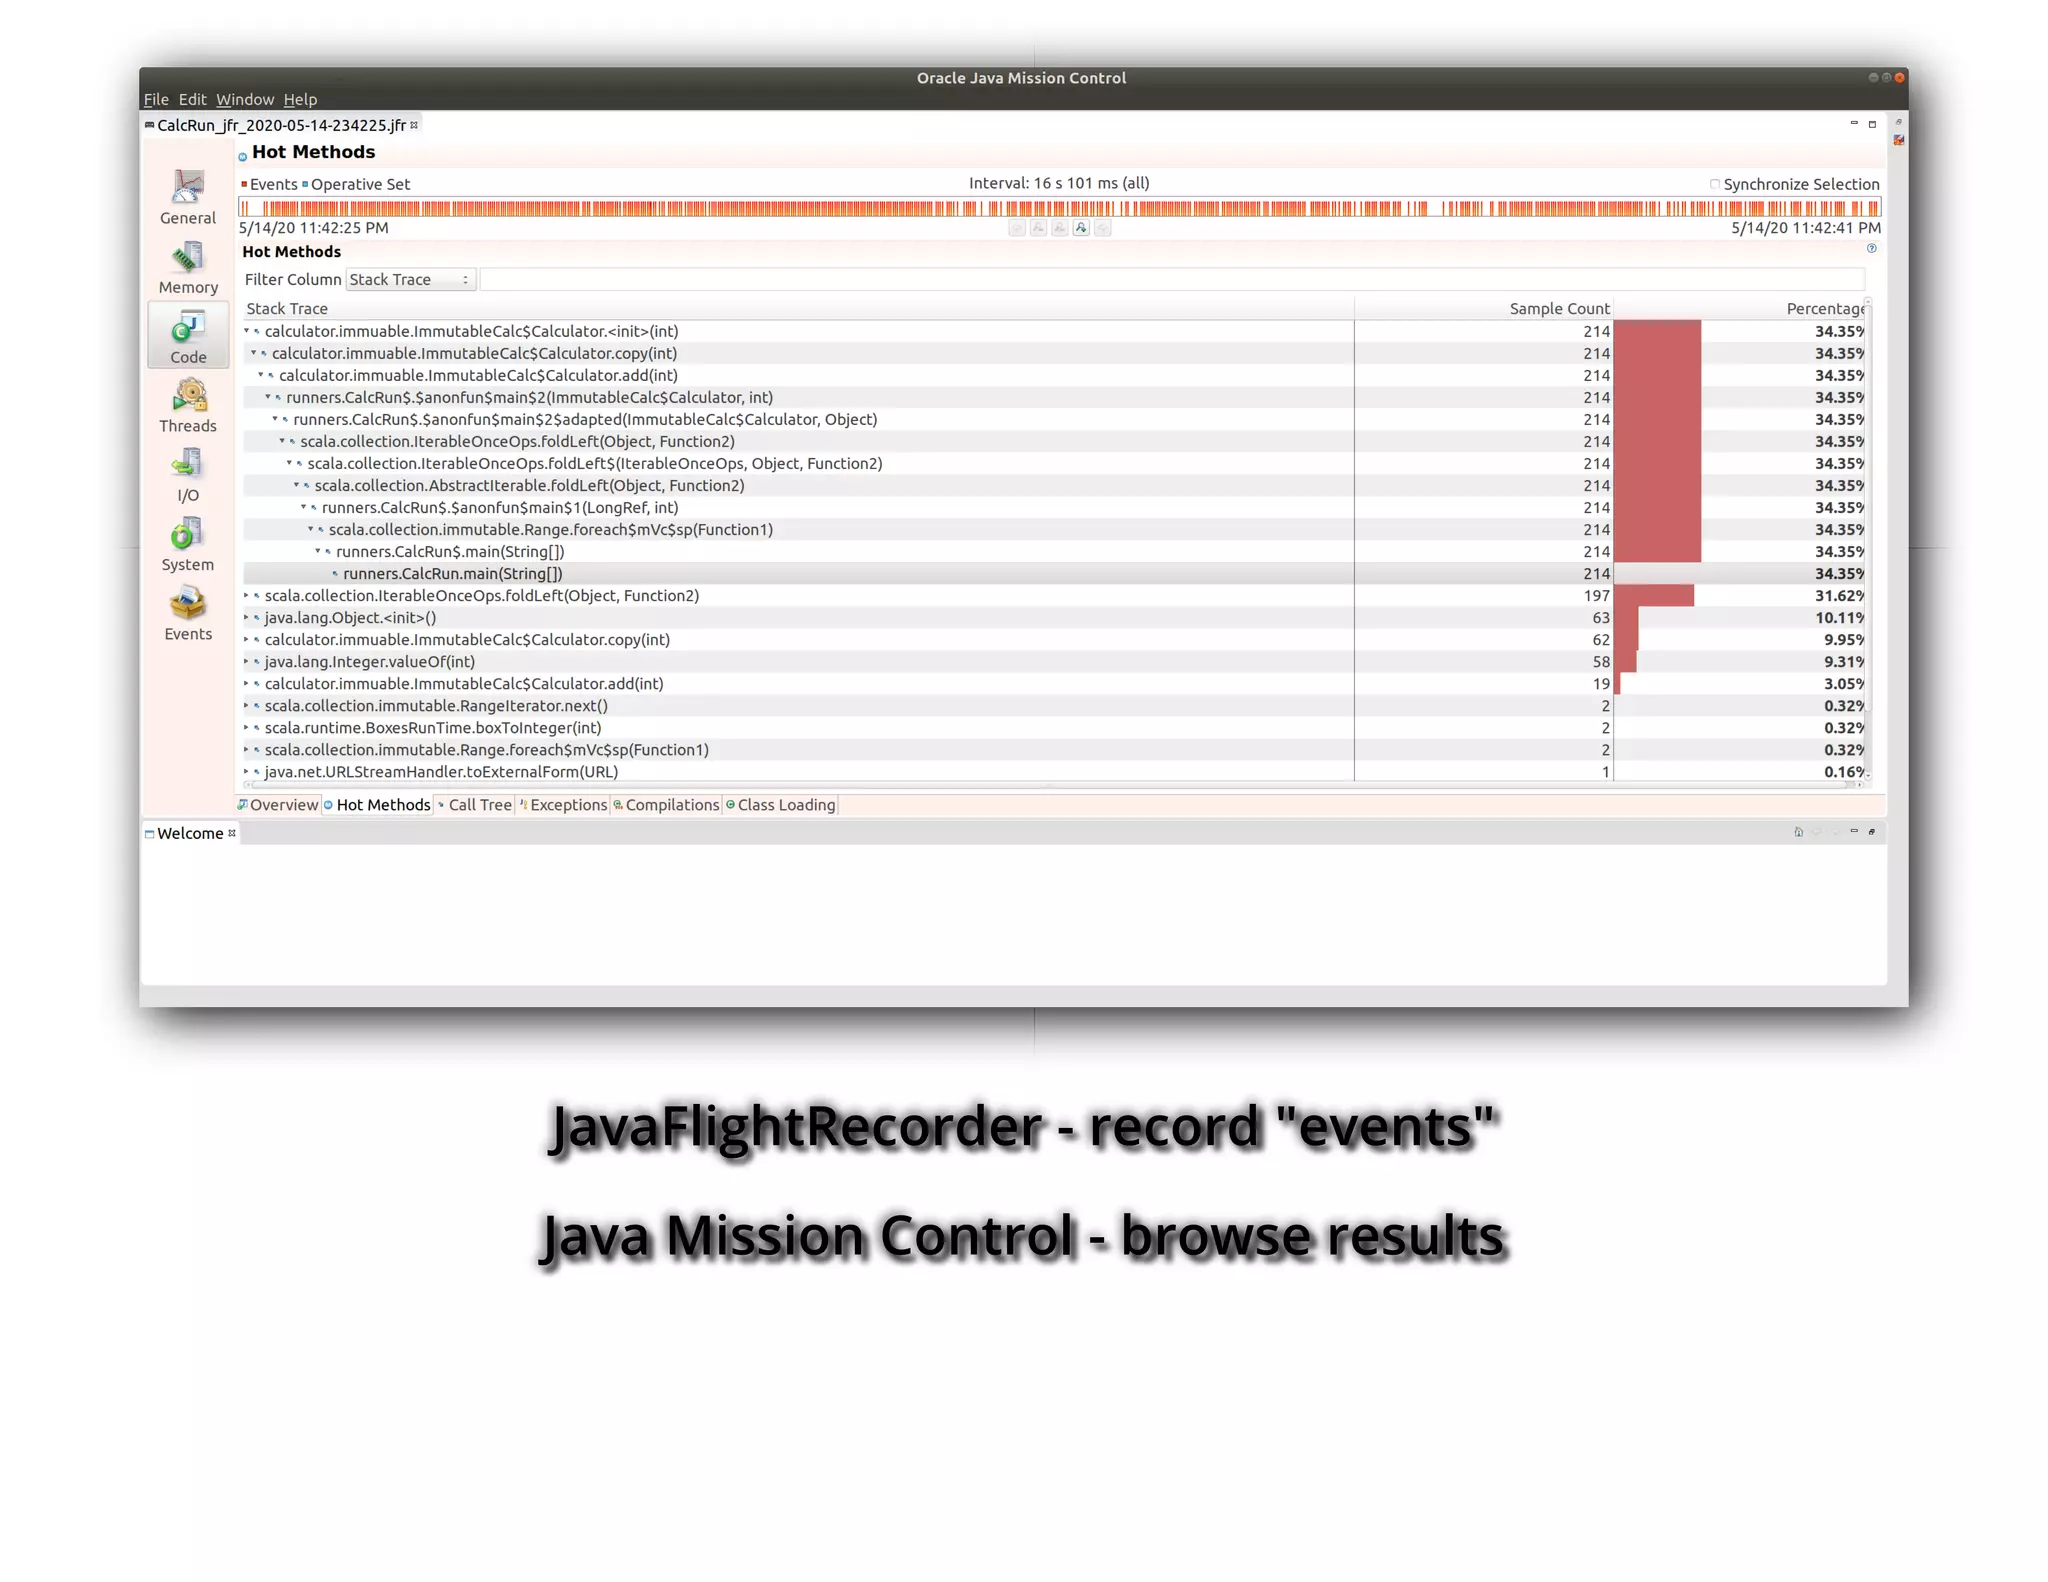
The document discusses performance myths and optimizations in Scala code. It begins with an example of calculating Fibonacci numbers on a 68040 processor and how branch prediction strategies can impact performance. Benchmark results are shown comparing immutable and mutable implementations of a calculator, with the immutable version being much slower. Tools for measuring performance like JMH, Java Flight Recorder and Java Mission Control are also introduced. The document cautions that performance can depend heavily on context and benchmarks only show tools, not decisions that should be made based on numbers.


![public calculator.immuable.ImmutableCalc$Calculator add(int);
Code:
0: aload_0 ; stack = [this]
1: aload_0 ; stack = [this,this]
2: invokevirtual #31 ; total() ; stack = [this,this.total]
5: iload_1 ; stack = [this, this.total, i]
6: iadd ; stack = [this, total + i]
7: invokevirtual #34 ; copy(...); stack = [newObject]
10: areturn ;return newObject
https://en.wikipedia.org/wiki/Java_bytecode_instruction_listings](https://image.slidesharecdn.com/scalatoasm-200515154847/75/Scala-to-assembly-44-2048.jpg)
![Run it
object CalcRun {
def main(args: Array[String]): Unit = {
var sum = 0L
for ( i <-0 to 100000) {
val calc = ImmutableCalc.Calculator()
sum+=(1 to 10000).foldLeft( calc)((c,i) => c.add(i)).get()
}
println(sum)
}
}](https://image.slidesharecdn.com/scalatoasm-200515154847/75/Scala-to-assembly-46-2048.jpg)


![VM version: JDK 11.0.6, OpenJDK 64-Bit Server VM, 11.0.6+9-jvmci-20.0-
b02
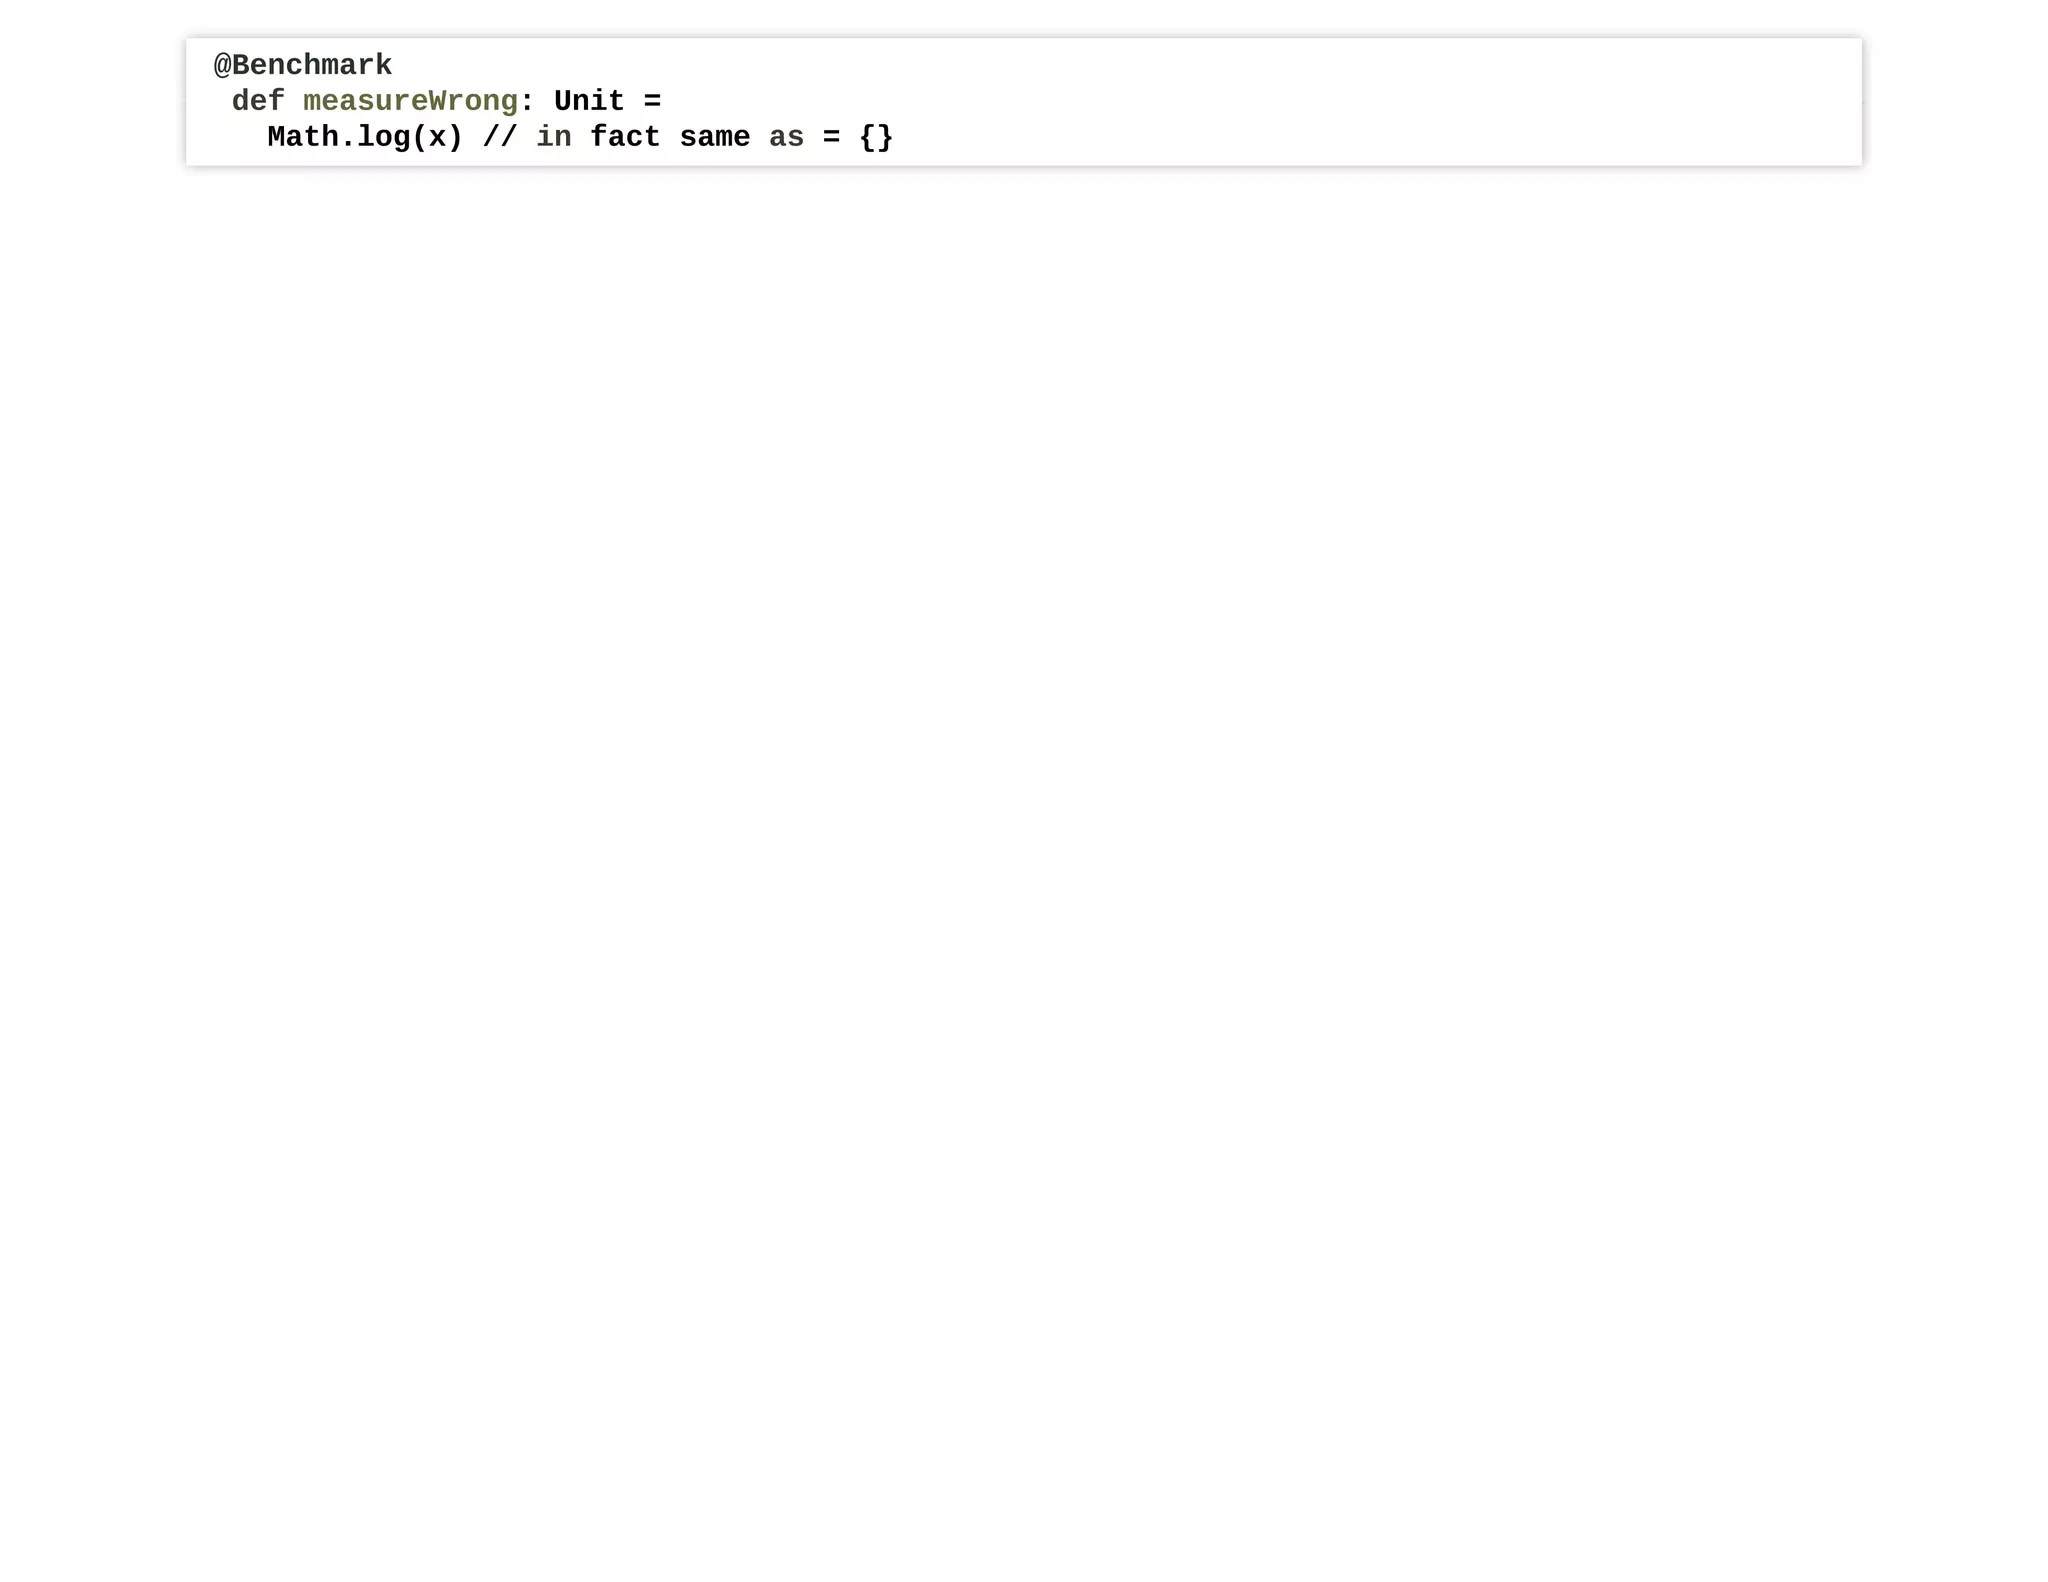
@Benchmark
def measureWrong: Unit =
Math.log(x)
@Benchmark
def measureRight: Double =
Math.log(x)
[info] JMHSample_08_DeadCode.measureRight avgt 3 9.891 ± 13.465 ns/op
[info] JMHSample_08_DeadCode.measureWrong avgt 3 0.383 ± 0.132 ns/op](https://image.slidesharecdn.com/scalatoasm-200515154847/75/Scala-to-assembly-54-2048.jpg)


![VM version: JDK 1.8.0_242, OpenJDK 64-Bit Server VM, 25.242-b08
[info] Benchmark Mode Cnt Score Error Units
[info] CalcCost.freeMonadScalaZ avgt 5 154761.225 ± 10652.856 ns/op
[info] CalcCost.immutable avgt 5 15393.204 ± 670.565 ns/op
[info] CalcCost.imperative avgt 5 284.435 ± 11.790 ns/op
[info] CalcCost.tfIO avgt 5 123841.734 ± 30096.835 ns/op](https://image.slidesharecdn.com/scalatoasm-200515154847/75/Scala-to-assembly-60-2048.jpg)

![VM version: JDK 14.0.1, OpenJDK 64-Bit Server VM, 14.0.1+7
[info] CalcCost.freeMonadScalaZ avgt 5 130559.311 ± 21298.291 ns/op
[info] CalcCost.immutable avgt 5 3682.014 ± 510.659 ns/op
[info] CalcCost.imperative avgt 5 263.753 ± 8.953 ns/op
[info] CalcCost.tfIO avgt 5 100277.673 ± 4185.455 ns/op](https://image.slidesharecdn.com/scalatoasm-200515154847/75/Scala-to-assembly-62-2048.jpg)
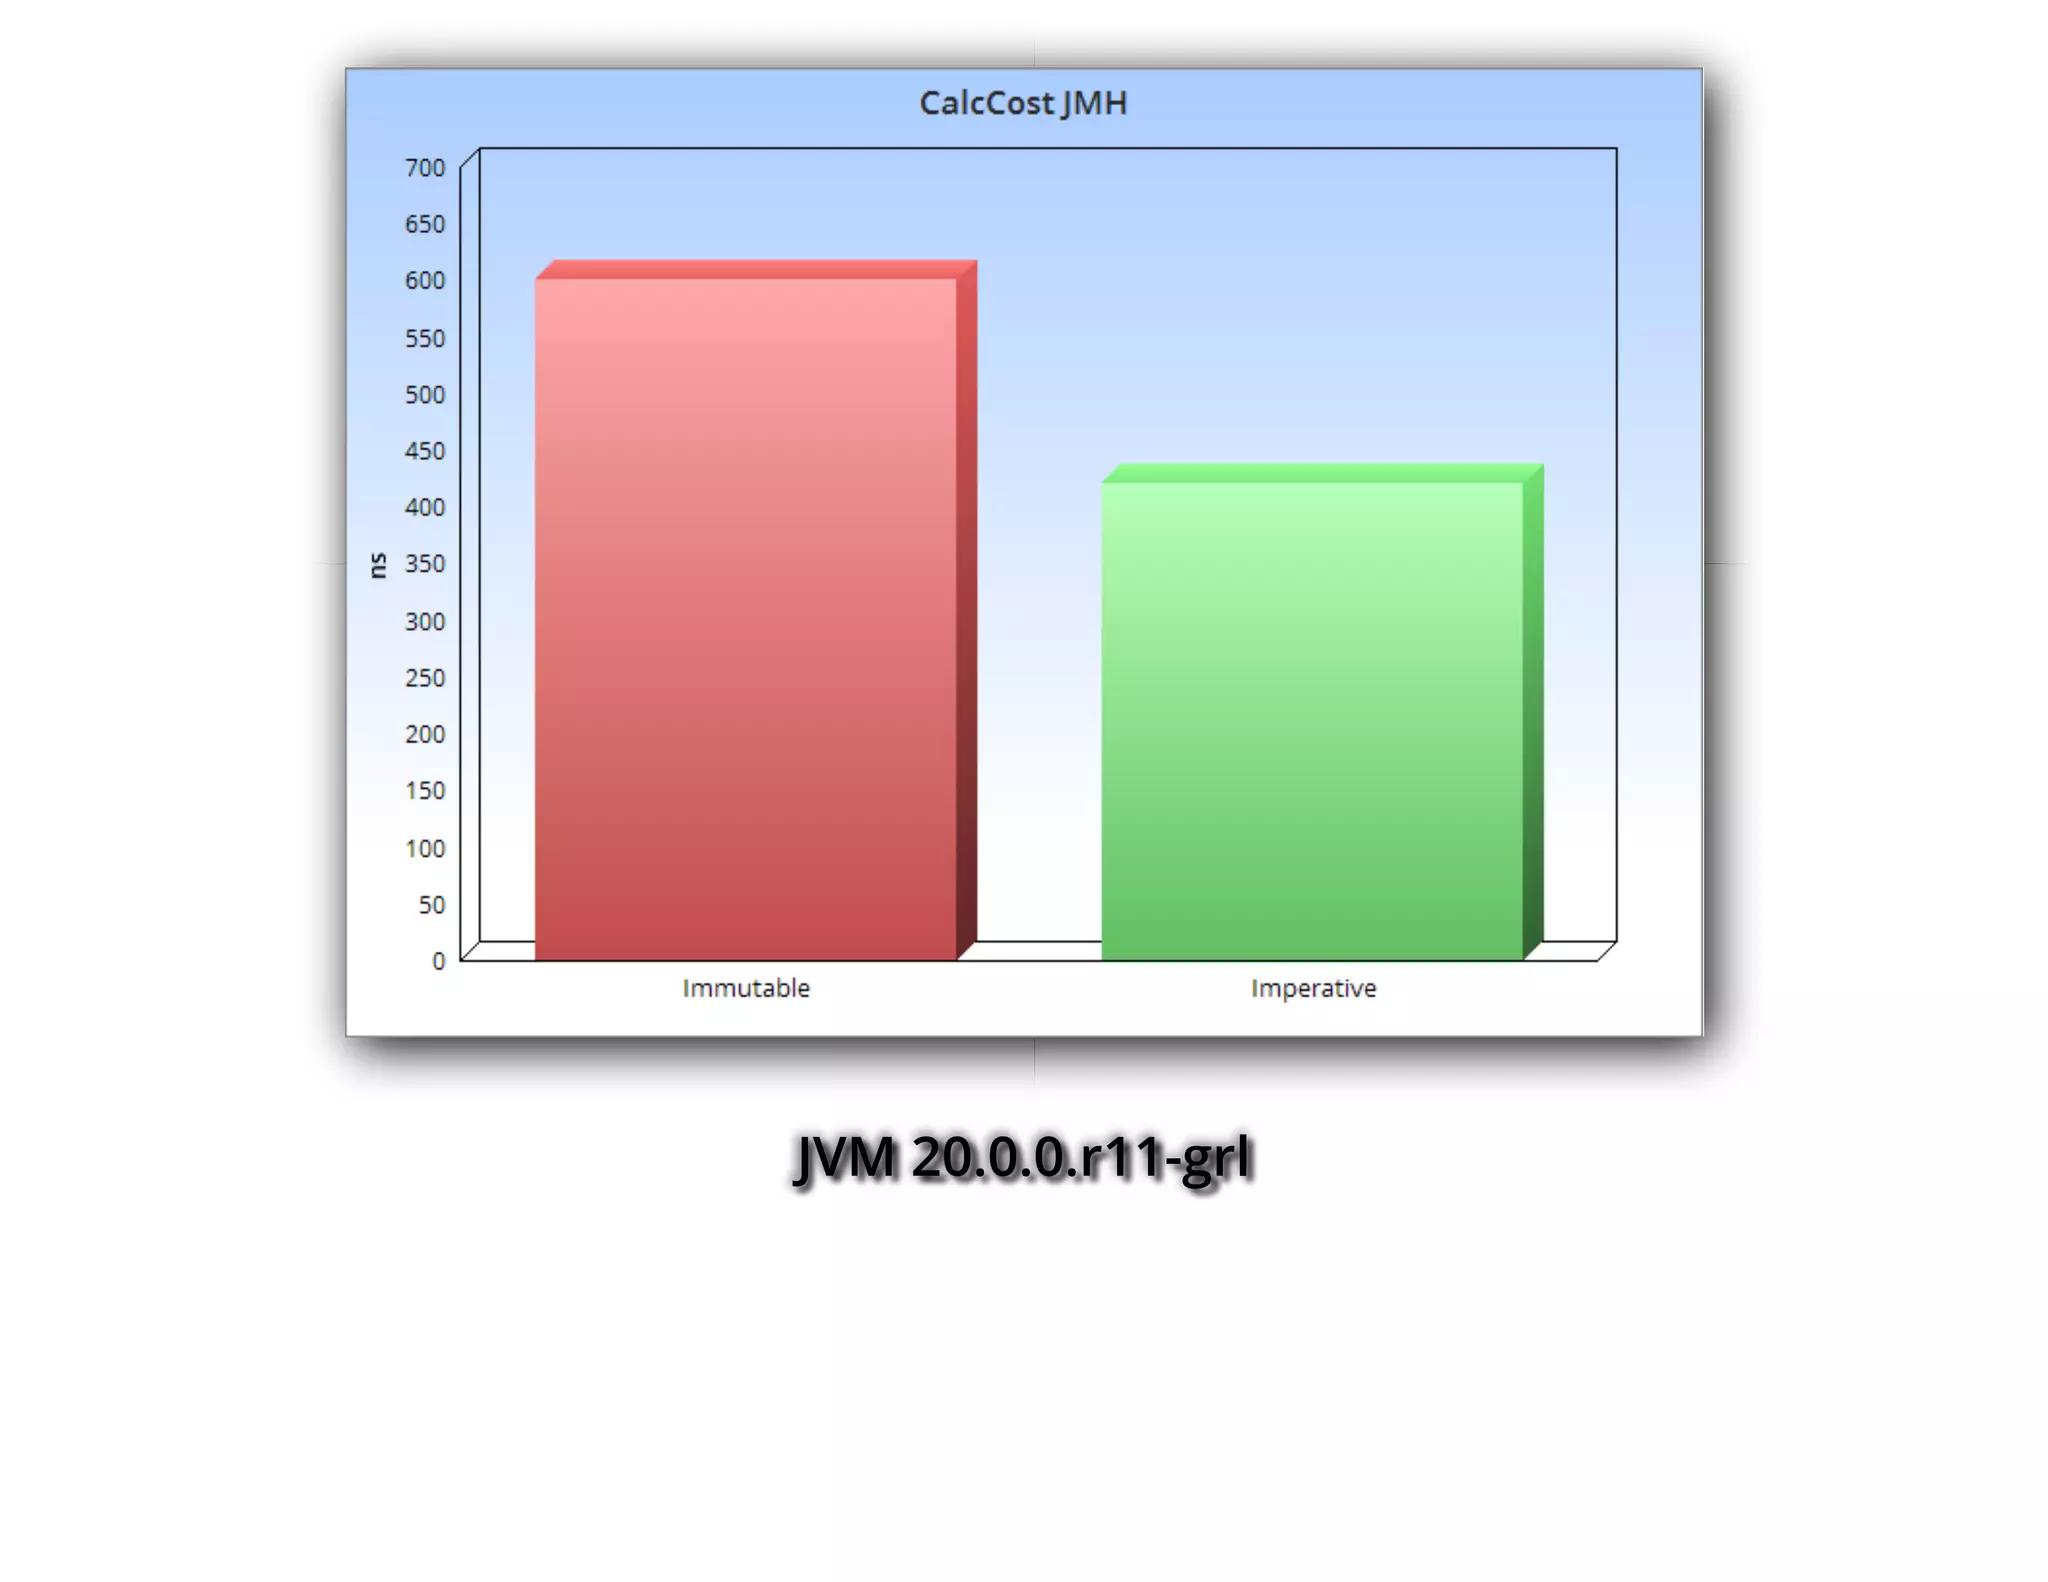
![20.0.0.r11-grl
[info] CalcCost.freeMonadScalaZ avgt 15 147832.984 ± 15674.721 ns/op
[info] CalcCost.immutable avgt 15 601.389 ± 8.249 ns/op
[info] CalcCost.imperative avgt 15 420.588 ± 103.107 ns/op
[info] CalcCost.tfIO avgt 15 121616.405 ± 5716.283 ns/op](https://image.slidesharecdn.com/scalatoasm-200515154847/75/Scala-to-assembly-64-2048.jpg)


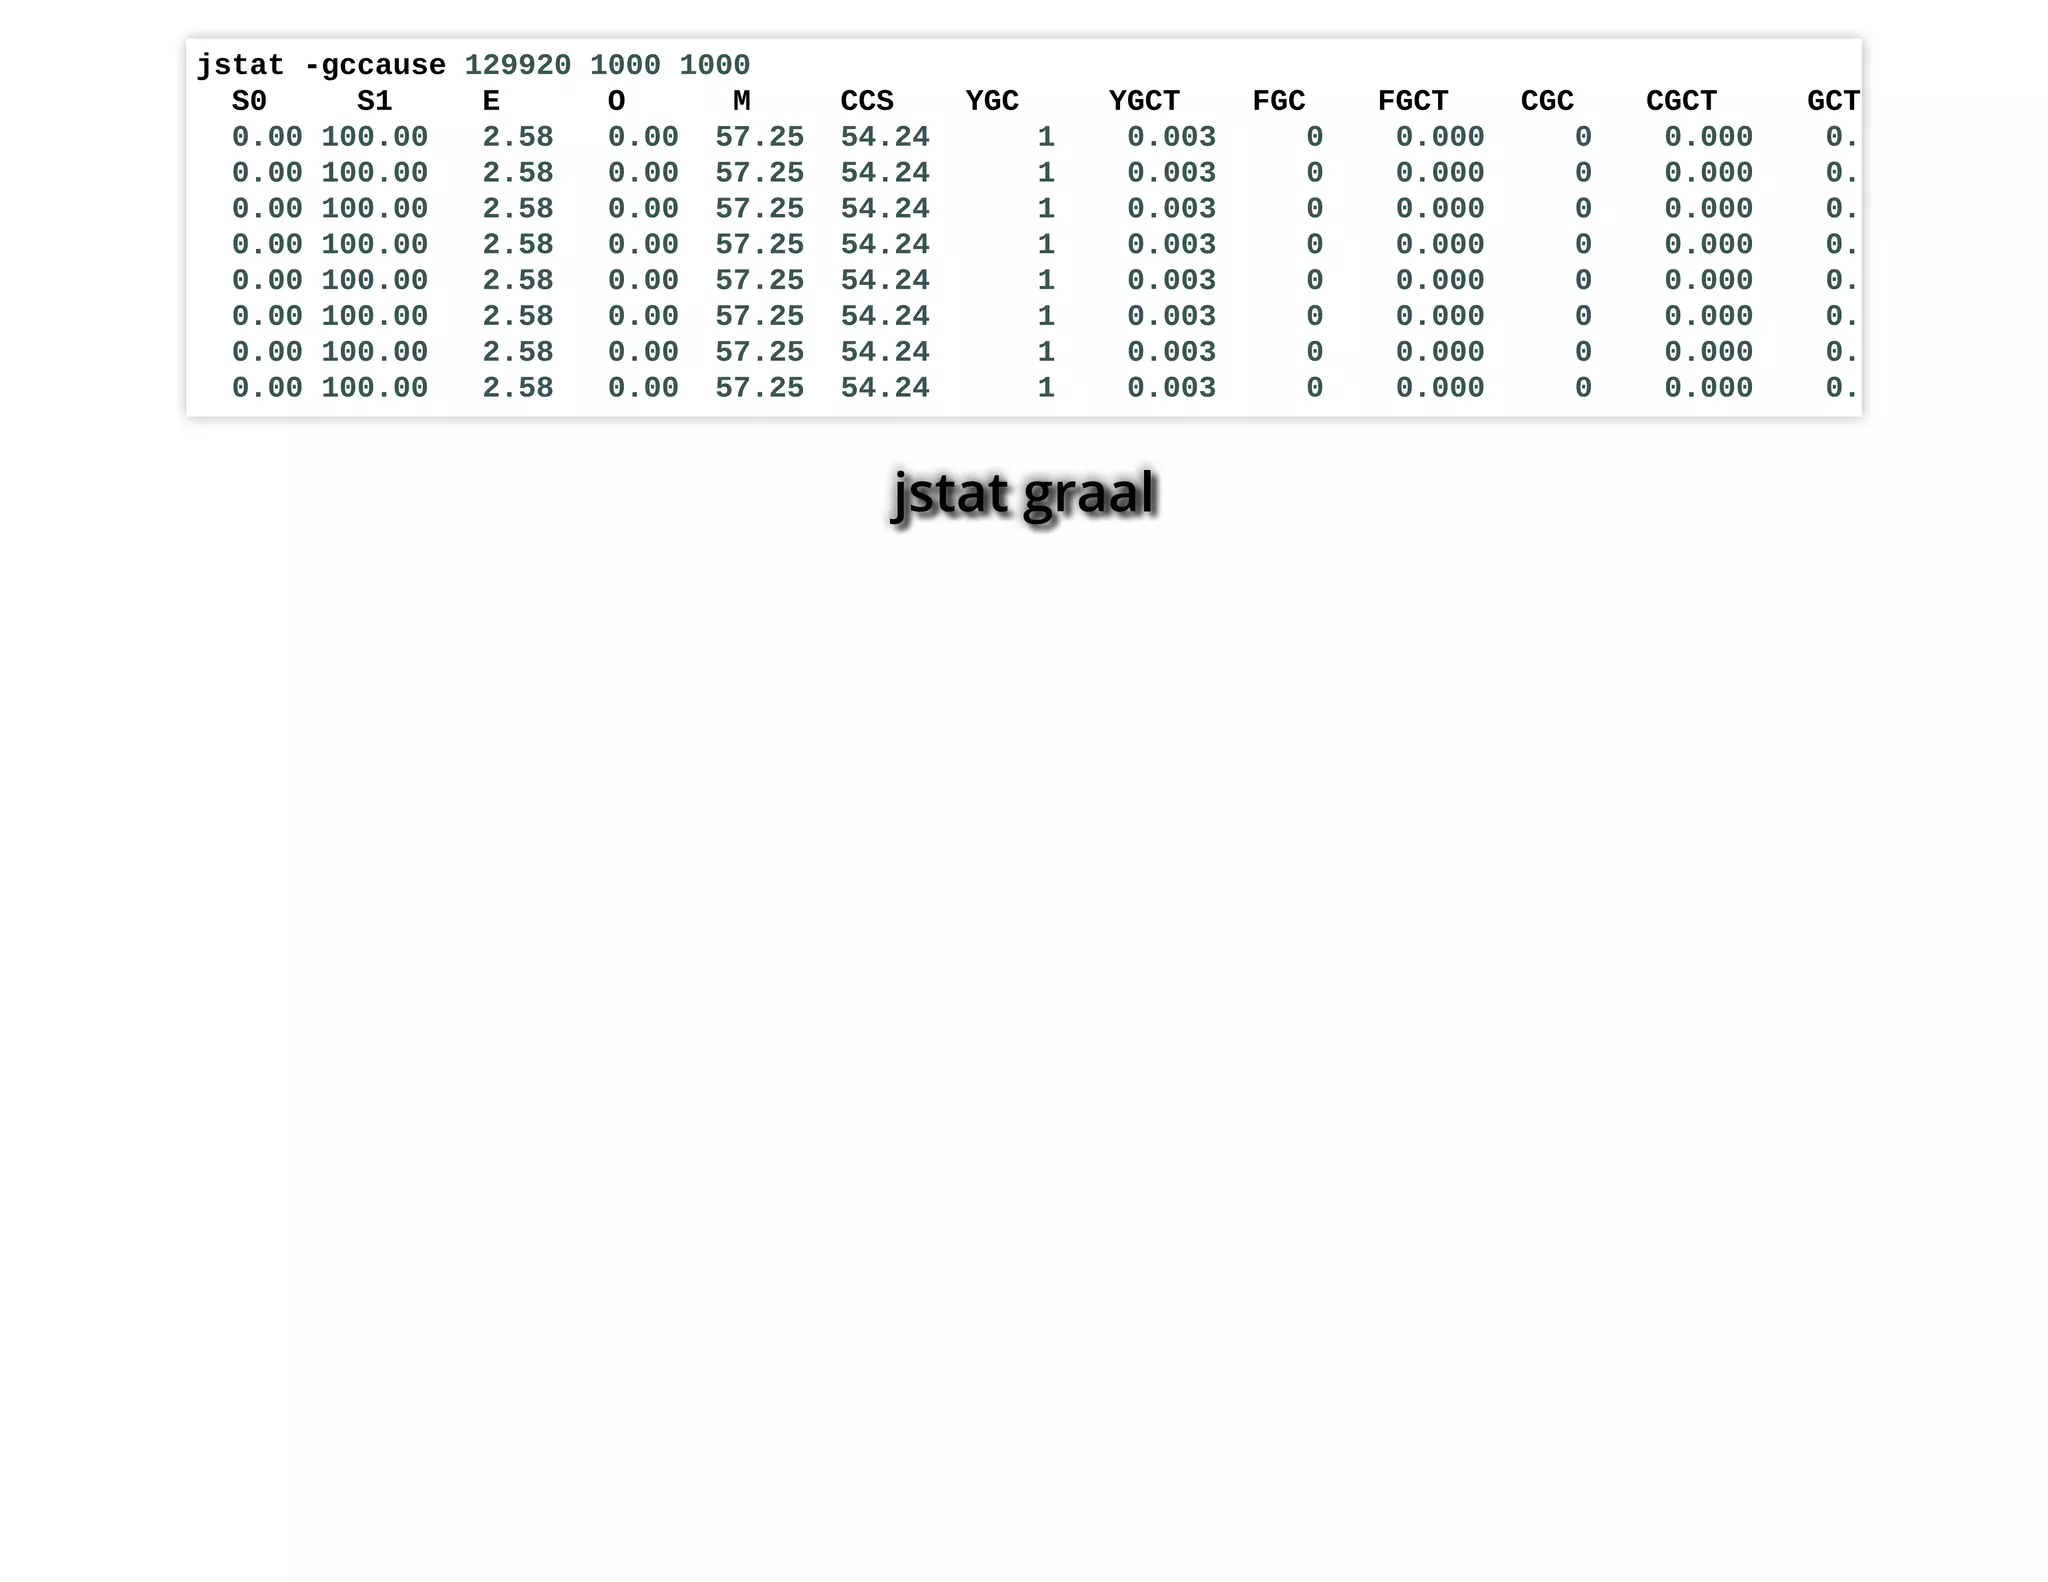
![jstack 91221 (java 8)
"main" #1 prio=5 os_prio=0 tid=0x00007f33b400d800 nid=0x14812 runnable [0x00007f33bdf38000]
java.lang.Thread.State: RUNNABLE
at calculator.immuable.ImmutableCalc$Calculator.<init>(ImmutableCalc.scala:4)
at calculator.immuable.ImmutableCalc$Calculator.copy(ImmutableCalc.scala:4)
at calculator.immuable.ImmutableCalc$Calculator.add(ImmutableCalc.scala:6)
at runners.CalcRun$.$anonfun$main$2(CalcRun.scala:10)
at runners.CalcRun$.$anonfun$main$2$adapted(CalcRun.scala:10)
at runners.CalcRun$$$Lambda$4/801197928.apply(Unknown Source)
at scala.collection.IterableOnceOps.foldLeft(IterableOnce.scala:636)
at scala.collection.IterableOnceOps.foldLeft$(IterableOnce.scala:632)
at scala.collection.AbstractIterable.foldLeft(Iterable.scala:921)
at runners.CalcRun$.$anonfun$main$1(CalcRun.scala:10)](https://image.slidesharecdn.com/scalatoasm-200515154847/75/Scala-to-assembly-74-2048.jpg)


![[Constants]
# {method} {0x00007f93f0e2fc48} 'add' '(I)Lcalculator/immuable/ImmutableCalc$Calculator;' in
# this: rsi:rsi = 'calculator/immuable/ImmutableCalc$Calculator'
# parm0: rdx = int
# [sp+0x80] (sp of caller)
0x00007f93f1422680: mov 0x8(%rsi),%r10d
0x00007f93f1422684: shl $0x3,%r10
0x00007f93f1422688: cmp %rax,%r10
0x00007f93f142268b: jne 0x00007f93f1045ba0 ; {runtime_call}
0x00007f93f1422691: nopl 0x0(%rax,%rax,1)
0x00007f93f1422699: nopl 0x0(%rax)
[Verified Entry Point]
0x00007f93f14226a0: mov %eax,-0x14000(%rsp)
0x00007f93f14226a7: push %rbp
0x00007f93f14226a8: sub $0x70,%rsp
0x00007f93f14226ac: movabs $0x7f93f0e43db0,%rdi
0x00007f93f14226b6: mov 0x8(%rdi),%eax
0x00007f93f14226b9: add $0x8,%eax
0x00007f93f14226bc: mov %eax,0x8(%rdi)
0x00007f93f14226bf: movabs $0x7f93f0e2fc48,%rdi ; {metadata({method} {0x00007f93f0e2fc48} 'add' '(I
0x00007f93f14226c9: and $0x3ff8,%eax
0x00007f93f14226cf: cmp $0x0,%eax](https://image.slidesharecdn.com/scalatoasm-200515154847/75/Scala-to-assembly-79-2048.jpg)
![-XX:PrintAssemblyOptions=intel
0x00007f11f540f880: mov r10d,DWORD PTR [rsi+0x8]
0x00007f11f540f884: shl r10,0x3
0x00007f11f540f888: cmp r10,rax
0x00007f11f540f88b: jne 0x00007f11f5045ba0 ; {runtime_call}
0x00007f11f540f891: nop DWORD PTR [rax+rax*1+0x0]
0x00007f11f540f899: nop DWORD PTR [rax+0x0]
[Verified Entry Point]
0x00007f11f540f8a0: mov DWORD PTR [rsp-0x14000],eax
0x00007f11f540f8a7: push rbp
0x00007f11f540f8a8: sub rsp,0x70
0x00007f11f540f8ac: movabs rdi,0x7f11e3e43db0
0x00007f11f540f8b6: mov eax,DWORD PTR [rdi+0x8]
0x00007f11f540f8b9: add eax,0x8
0x00007f11f540f8bc: mov DWORD PTR [rdi+0x8],eax
0x00007f11f540f8bf: movabs rdi,0x7f11e3e2fc48 ; {metadata({method} {0x00007f11e3e2fc48} 'add' '(I)L
0x00007f11f540f8c9: and eax,0x3ff8
0x00007f11f540f8cf: cmp eax,0x0
0x00007f11f540f8d2: je 0x00007f11f540f92c ;*aload_0](https://image.slidesharecdn.com/scalatoasm-200515154847/75/Scala-to-assembly-80-2048.jpg)


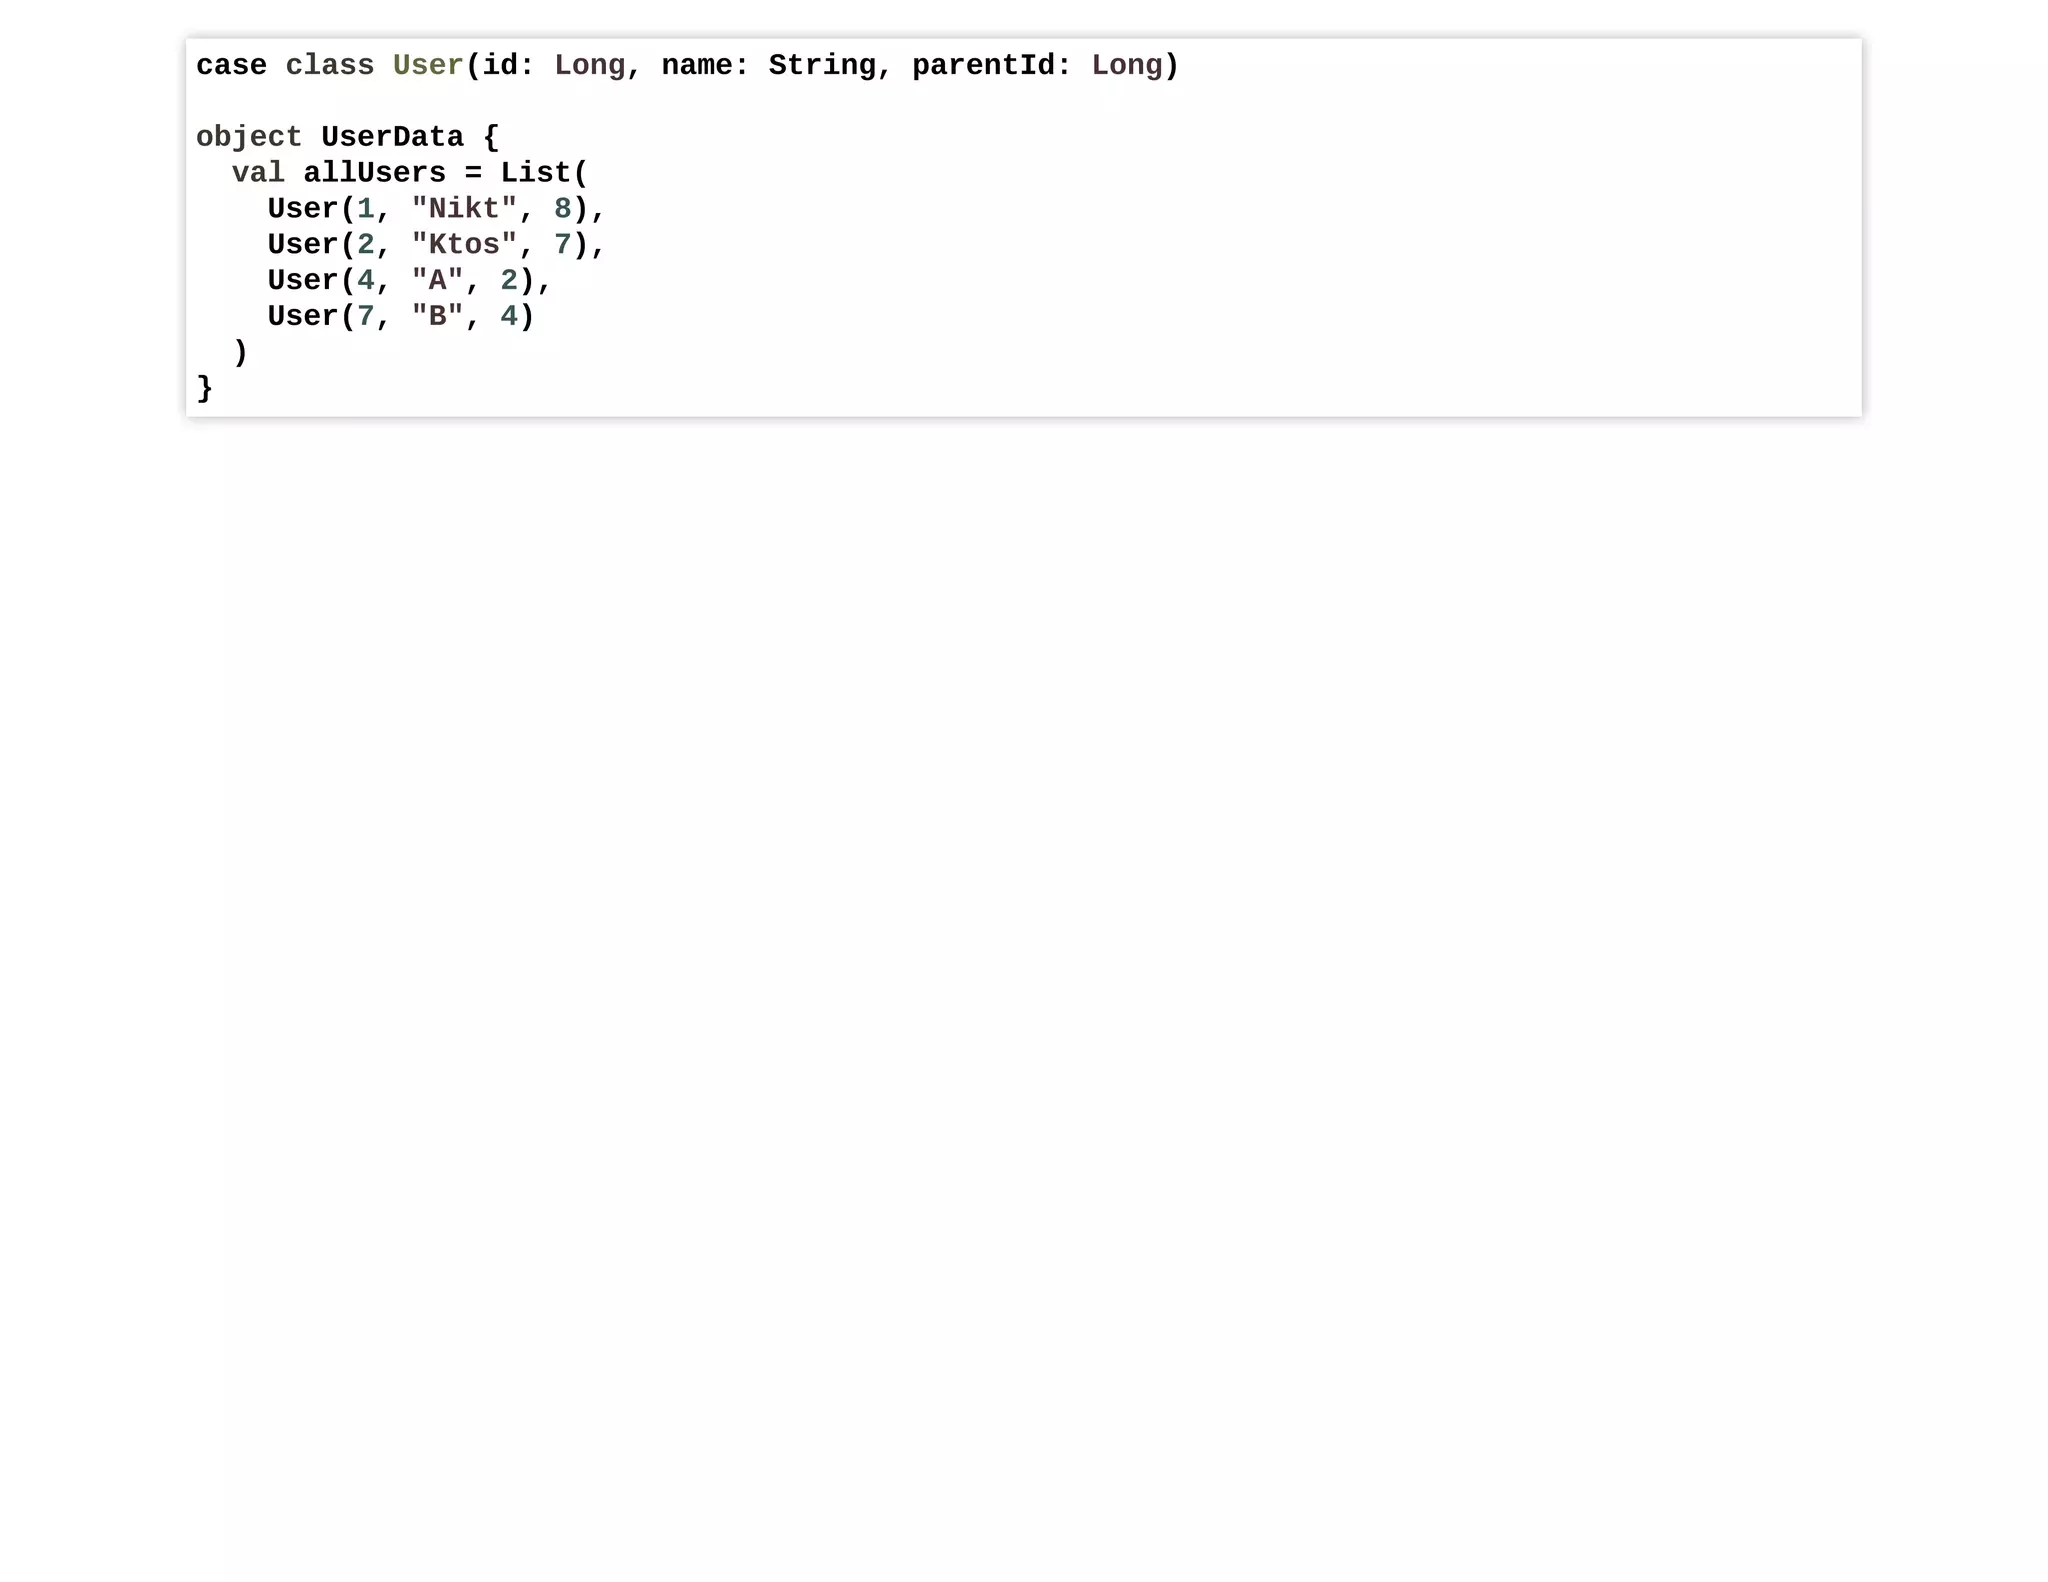
![(scalaz used)
object Users {
val allUsers = UserData.allUsers
def findUser(id: Long): OptionT[Task, User] = OptionT.optionT {
Task.delay({
val found: Option[User] = allUsers.find(u => u.id == id)
found
}
)
}
}
val indices: Seq[Int] = (1 to 100).toList
def run = {
val users: Seq[OptionT[Task, User]] = indices.map(id => Users.findUser(id))
val parents = users.map(u => u.flatMap(z => Users.findUser(z.parentId)))
parents.map(u => u.run.unsafePerformSync).count(u => u.isDefined)
}](https://image.slidesharecdn.com/scalatoasm-200515154847/75/Scala-to-assembly-92-2048.jpg)
![object StackedMonads {
val indices: Seq[Int] = (1 to 100).toList
def run = {
val users = indices.map ( id => Users.findUser(id))
val parents = users.map ((u: Task[Option[User]]) =>
u.flatMap((ou: Option[User]) => ou match {
case None => Task.delay({None})
case Some(x) => Users.findUser(x.parentId)
}
)
)
parents.map (u=>u.unsafePerformSync).count(u =>u.isDefined)
}
def findUser(id: Long): Task[Option[User]] = {
Task.delay {
val found: Option[User] = allUsers.find(u => u.id == id)
found
}
}](https://image.slidesharecdn.com/scalatoasm-200515154847/75/Scala-to-assembly-93-2048.jpg)

![Let's simply use null
object NOMonad {
val indices: Seq[Int] = (1 to 100).toList
def run = {
val users = indices.map(id => Users.findUser(id))
val parents: Seq[User] = users.map(u =>
if (u != null) {
Users.findUser(u.parentId)
} else {
null
}
)
parents.count((u: User) =>u != null)
}
object Users {
val allUsers = UserData.allUsers
def findUser(id: Long): User = {
val found= allUsers.find(u => u.id == id).orNull
found
}
}](https://image.slidesharecdn.com/scalatoasm-200515154847/75/Scala-to-assembly-95-2048.jpg)
![object SimpleDB {
val connection = DB.initializeDB
def run = {
val users = indices.map(id => Users.findUser(id))
val parents: Seq[User] = users.map(u =>
if (u != null) {
Users.findUser(u.parentId)
} else {
null
}
)
parents.count((u: User) => u != null)
}
object Users {
val userQuery = connection.prepareStatement("SELECT * FROM USERS WHERE id= ?")
def findUser(id: Long): User = {
userQuery.clearParameters()
userQuery.setLong(1, id)
val res = userQuery.executeQuery()](https://image.slidesharecdn.com/scalatoasm-200515154847/75/Scala-to-assembly-97-2048.jpg)

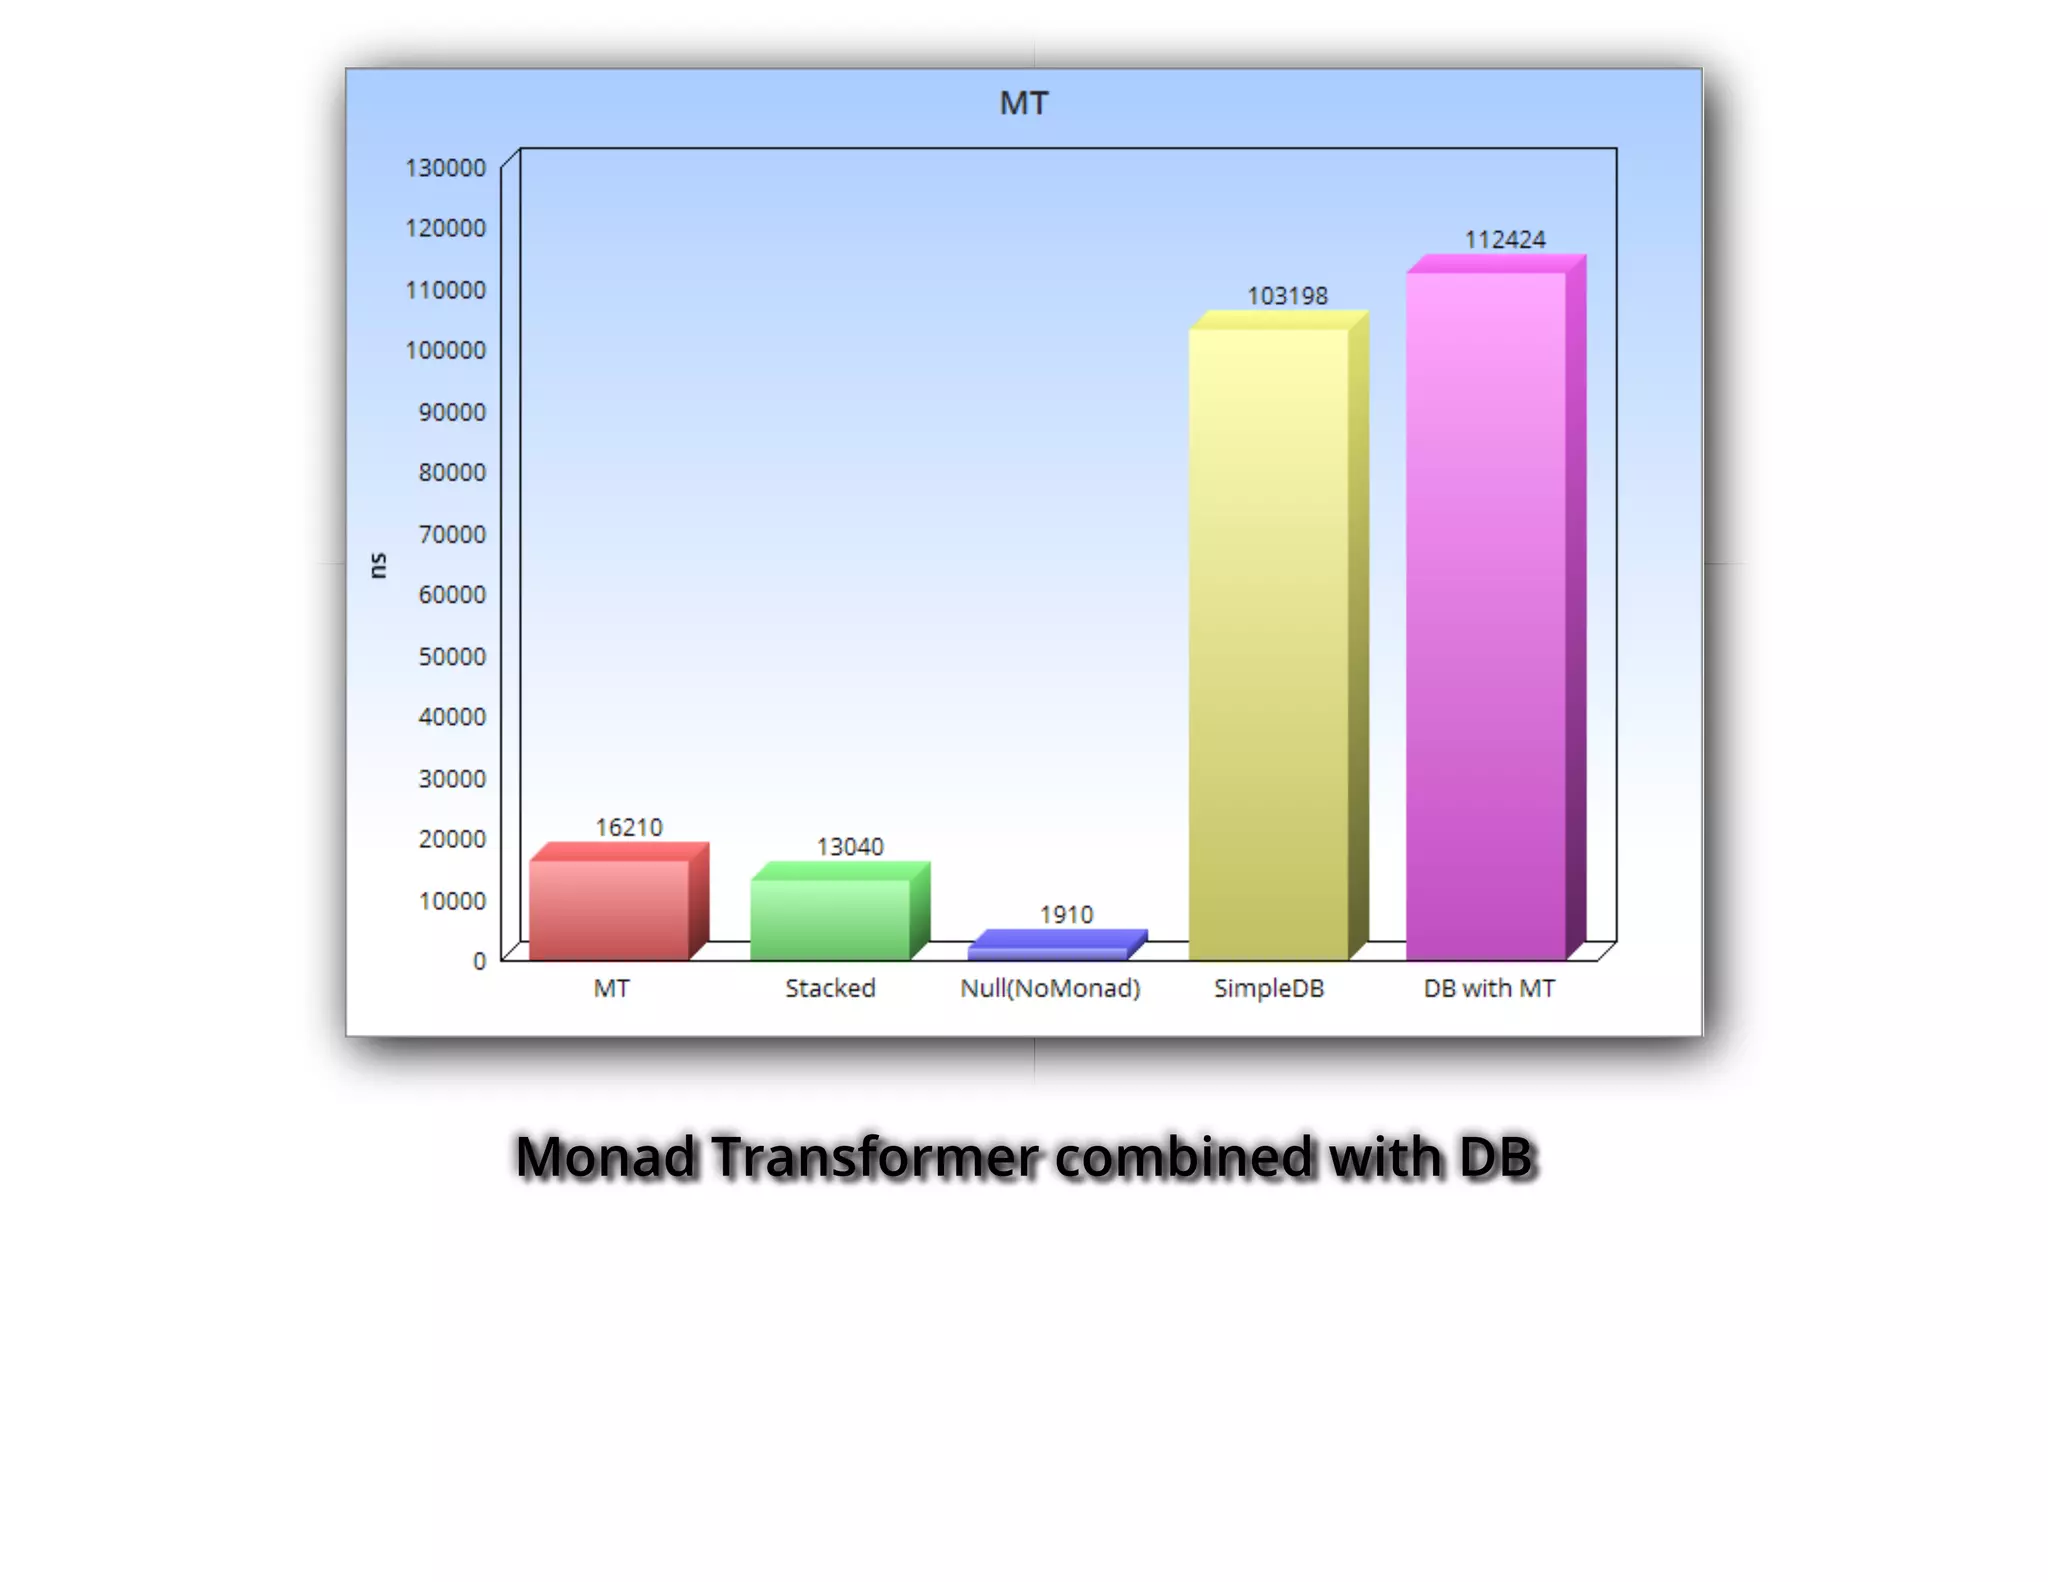


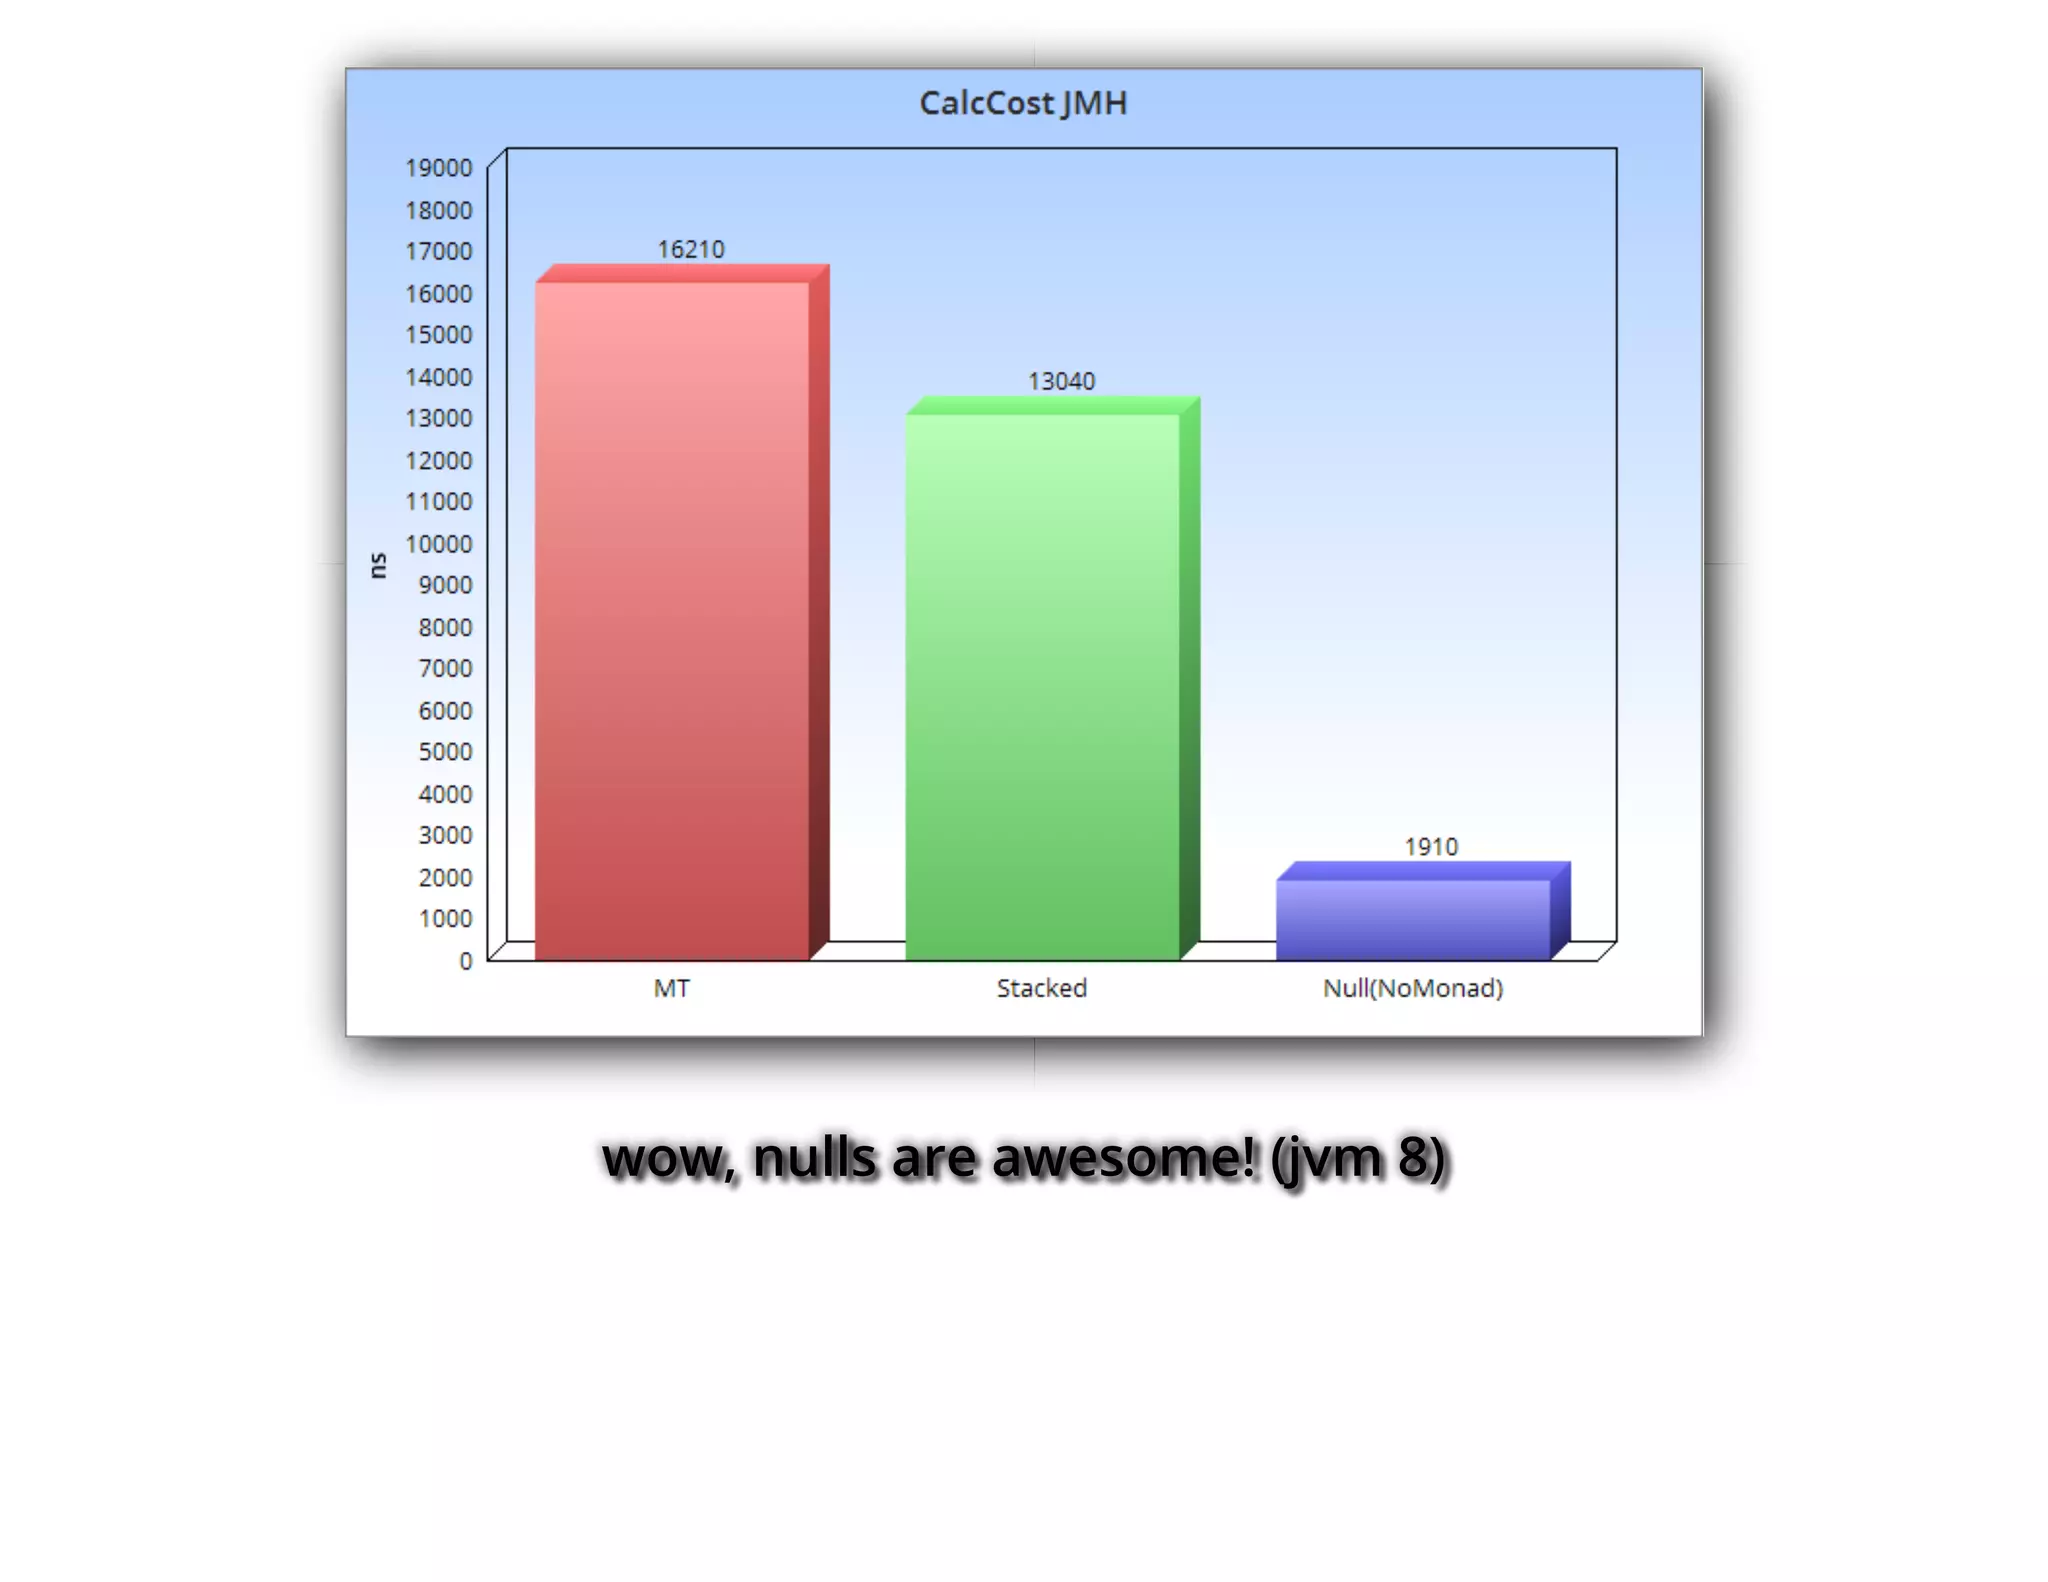
![jvm 8
[info] MT.monadTR avgt 3 16210.589 ± 14114.784 ns/op
[info] MT.monadTRDB avgt 3 112424.770 ± 109957.046 ns/op
[info] MT.noMonad avgt 3 1910.297 ± 64.699 ns/op
[info] MT.optimizedDB avgt 3 685.030 ± 99.553 ns/op
[info] MT.simpleDB avgt 3 103198.262 ± 36190.463 ns/op
[info] MT.stackedMonads avgt 3 13040.031 ± 733.337 ns/op](https://image.slidesharecdn.com/scalatoasm-200515154847/75/Scala-to-assembly-103-2048.jpg)
![jvm 14
[info] MT.monadTR avgt 3 13328.252 ± 9569.020 ns/op
[info] MT.monadTRDB avgt 3 123824.784 ± 148322.320 ns/op
[info] MT.noMonad avgt 3 1934.838 ± 1596.319 ns/op
[info] MT.optimizedDB avgt 3 767.592 ± 49.940 ns/op
[info] MT.simpleDB avgt 3 96992.954 ± 828.014 ns/op
[info] MT.stackedMonads avgt 3 15777.281 ± 7370.754 ns/op](https://image.slidesharecdn.com/scalatoasm-200515154847/75/Scala-to-assembly-104-2048.jpg)
![graal 20
[info] MT.monadTR avgt 3 11057.304 ± 4885.176 ns/op
[info] MT.monadTRDB avgt 3 119223.204 ± 109133.489 ns/op
[info] MT.noMonad avgt 3 1529.025 ± 71.307 ns/op
[info] MT.optimizedDB avgt 3 905.659 ± 34.349 ns/op
[info] MT.simpleDB avgt 3 107627.684 ± 6618.677 ns/op
[info] MT.stackedMonads avgt 3 8534.377 ± 739.795 ns/op](https://image.slidesharecdn.com/scalatoasm-200515154847/75/Scala-to-assembly-105-2048.jpg)


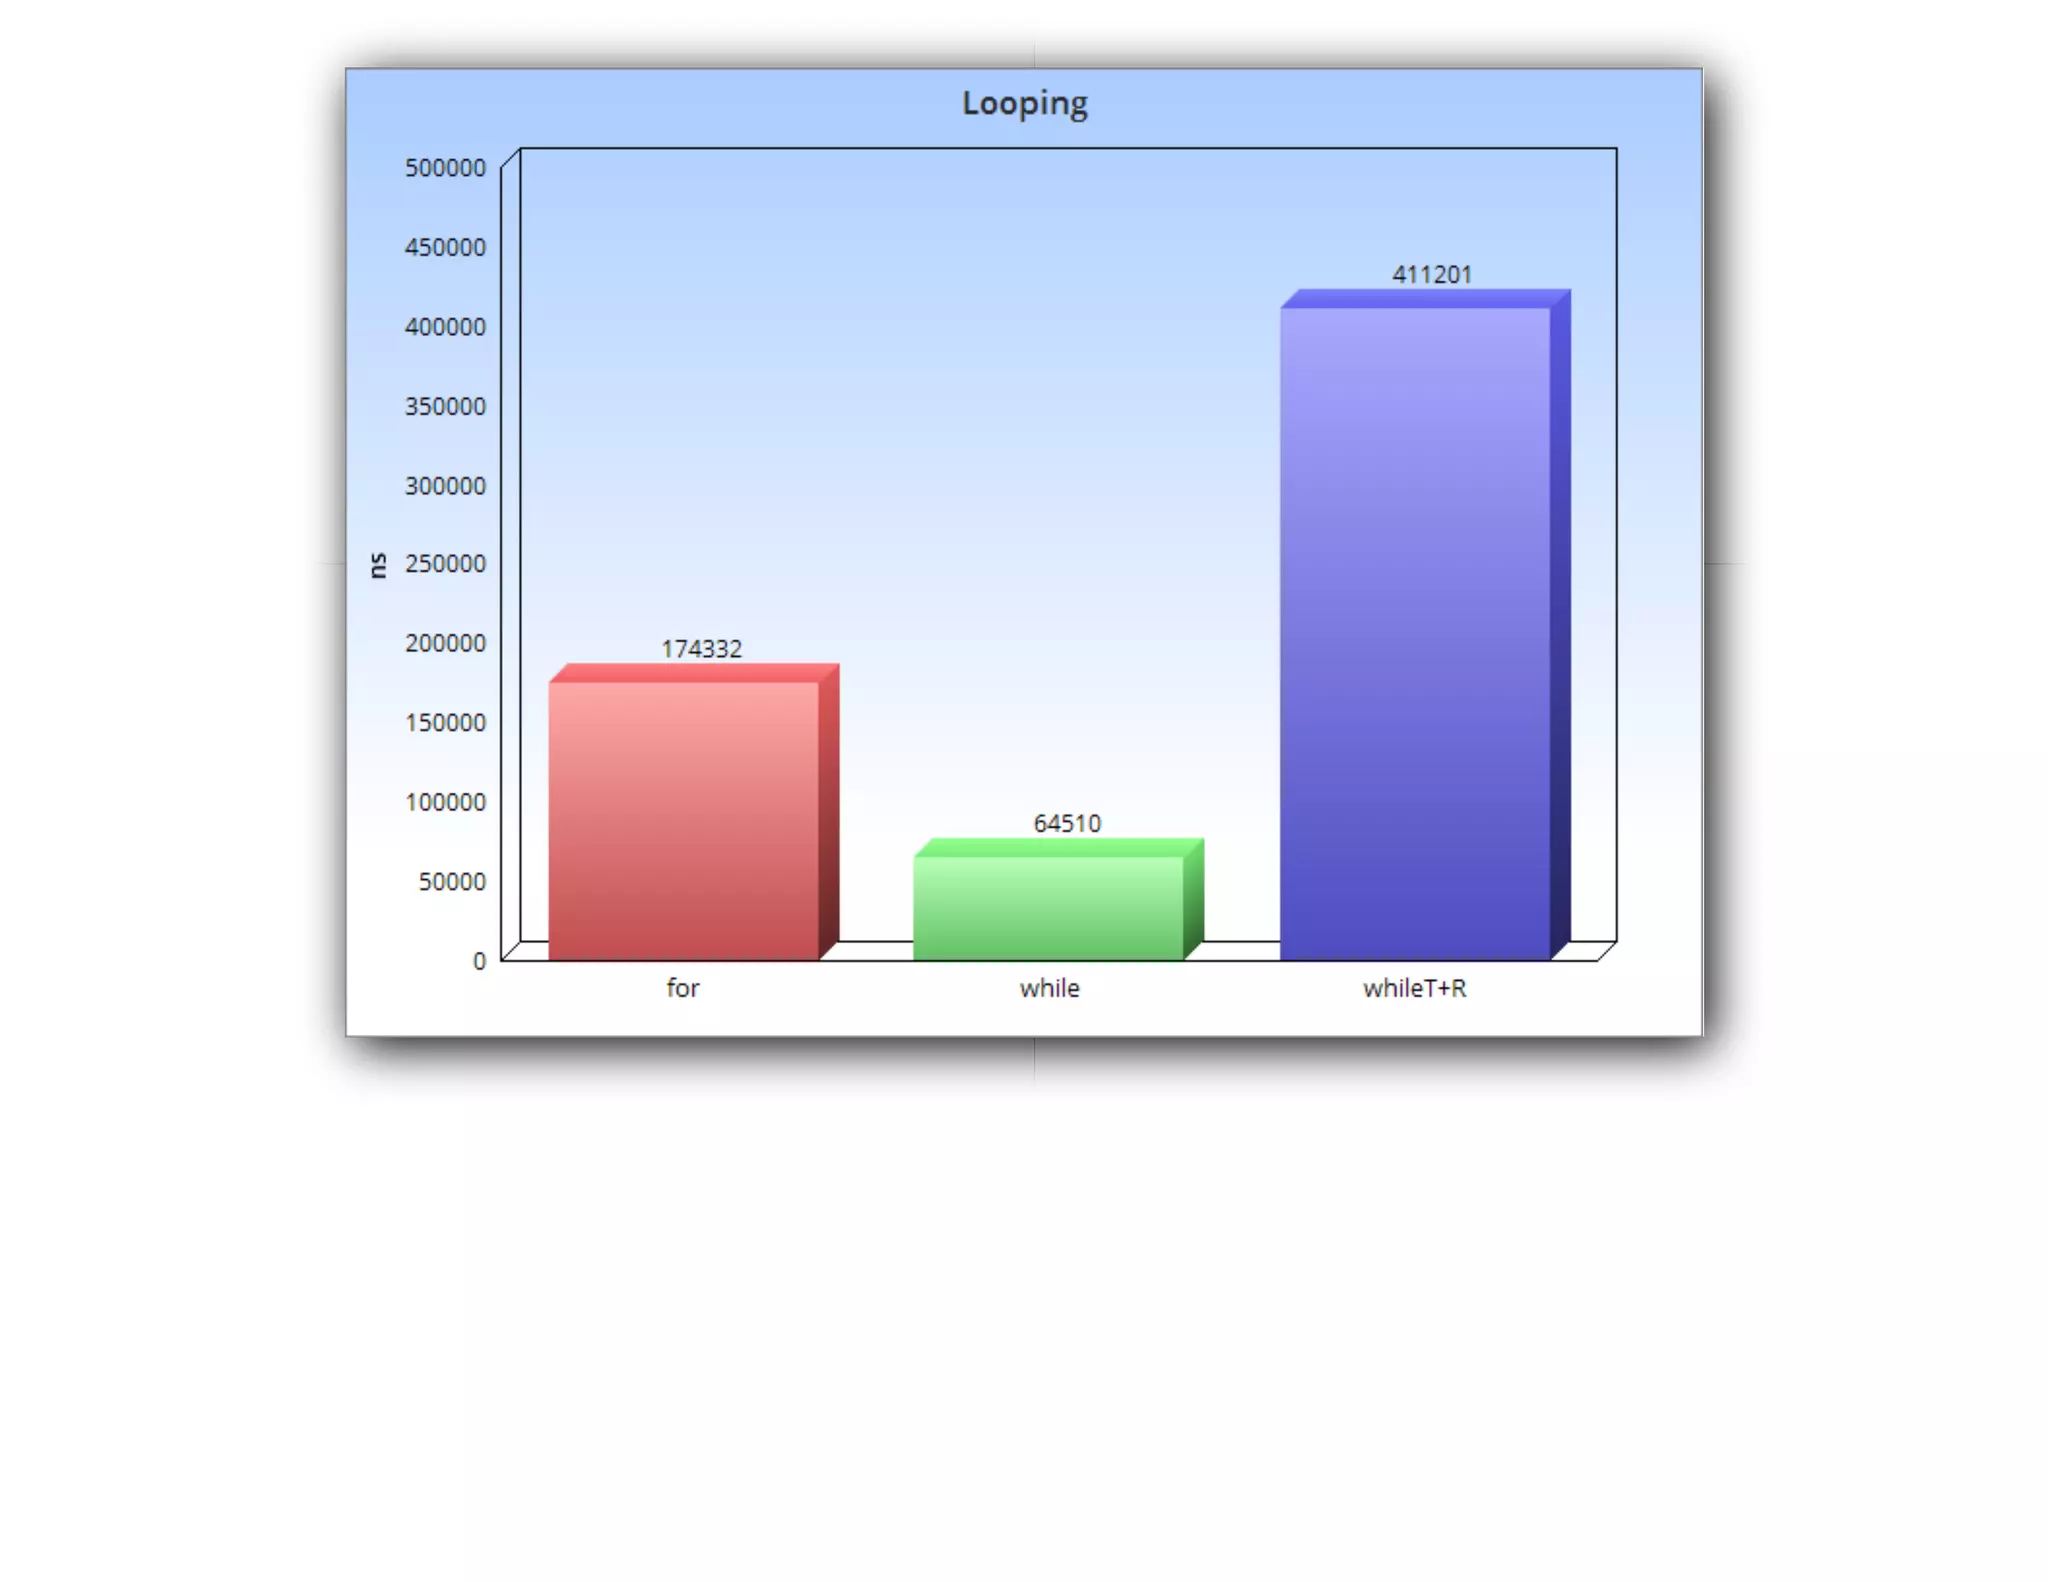
@Benchmark
def forBasedLoop: Long = {
var sum: Long = 0
for (i <- 0 to sz) {
for (j <- 0 to sz) {
sum += array(i)(j)
}
}
sum
}](https://image.slidesharecdn.com/scalatoasm-200515154847/75/Scala-to-assembly-107-2048.jpg)


![[info] 14,650.91 msec task-clock # 0.482 CPUs utilized
[info] 525 context-switches # 0.036 K/sec
[info] 65 cpu-migrations # 0.004 K/sec
[info] 185 page-faults # 0.013 K/sec
[info] 30,370,384,927 cycles # 2.073 GHz (
[info] 285,624,461 stalled-cycles-frontend # 0.94% frontend cycles idle (
[info] 19,572,932,807 stalled-cycles-backend # 64.45% backend cycles idle (
[info] 35,907,154,673 instructions # 1.18 insn per cycle
[info] # 0.55 stalled cycles per insn (
[info] 6,706,376,215 branches # 457.745 M/sec (
[info] 12,810,882 branch-misses # 0.19% of all branches (
[info] 16,163,472,375 L1-dcache-loads # 1103.240 M/sec (
[info] 10,975,494,751 L1-dcache-load-misses # 67.90% of all L1-dcache hits (
[info] <not supported> LLC-loads
[info] <not supported> LLC-load-misses
[info] 175,788,792 L1-icache-loads # 11.998 M/sec (
[info] 7,051,118 L1-icache-load-misses # 4.01% of all L1-icache hits (
[info] 5,302,762,430 dTLB-loads # 361.941 M/sec (
[info] 14,779,238 dTLB-load-misses # 0.28% of all dTLB cache hits (
[info] 245,713 iTLB-loads # 0.017 M/sec (
[info] 1,195,242 iTLB-load-misses # 486.44% of all iTLB cache hits (
[info] 289,031,594 L1-dcache-prefetches # 19.728 M/sec (](https://image.slidesharecdn.com/scalatoasm-200515154847/75/Scala-to-assembly-113-2048.jpg)
![while T+R
[info] 14,650.91 msec task-clock # 0.482 CPUs utilized
[info] 525 context-switches # 0.036 K/sec
[info] 65 cpu-migrations # 0.004 K/sec
[info] 185 page-faults # 0.013 K/sec
[info] 30,370,384,927 cycles # 2.073 GHz (
[info] 285,624,461 stalled-cycles-frontend # 0.94% frontend cycles idle (
[info] 19,572,932,807 stalled-cycles-backend # 64.45% backend cycles idle (
[info] 35,907,154,673 instructions # 1.18 insn per cycle
[info] # 0.55 stalled cycles per insn (
[info] 6,706,376,215 branches # 457.745 M/sec (
[info] 12,810,882 branch-misses # 0.19% of all branches (
[info] 16,163,472,375 L1-dcache-loads # 1103.240 M/sec (
[info] 10,975,494,751 L1-dcache-load-misses # 67.90% of all L1-dcache hits (
[info] <not supported> LLC-loads
[info] <not supported> LLC-load-misses
[info] 175,788,792 L1-icache-loads # 11.998 M/sec (
[info] 7,051,118 L1-icache-load-misses # 4.01% of all L1-icache hits (
[info] 5,302,762,430 dTLB-loads # 361.941 M/sec (
[info] 14,779,238 dTLB-load-misses # 0.28% of all dTLB cache hits (
[info] 245,713 iTLB-loads # 0.017 M/sec (
[info] 1,195,242 iTLB-load-misses # 486.44% of all iTLB cache hits (
[info] 289,031,594 L1-dcache-prefetches # 19.728 M/sec (](https://image.slidesharecdn.com/scalatoasm-200515154847/75/Scala-to-assembly-114-2048.jpg)
![while T+R
L1
[info] 14,650.91 msec task-clock # 0.482 CPUs utilized
[info] 525 context-switches # 0.036 K/sec
[info] 65 cpu-migrations # 0.004 K/sec
[info] 185 page-faults # 0.013 K/sec
[info] 30,370,384,927 cycles # 2.073 GHz (
[info] 285,624,461 stalled-cycles-frontend # 0.94% frontend cycles idle (
[info] 19,572,932,807 stalled-cycles-backend # 64.45% backend cycles idle (
[info] 35,907,154,673 instructions # 1.18 insn per cycle
[info] # 0.55 stalled cycles per insn (
[info] 6,706,376,215 branches # 457.745 M/sec (
[info] 12,810,882 branch-misses # 0.19% of all branches (
[info] 16,163,472,375 L1-dcache-loads # 1103.240 M/sec (
[info] 10,975,494,751 L1-dcache-load-misses # 67.90% of all L1-dcache hits (
[info] <not supported> LLC-loads
[info] <not supported> LLC-load-misses
[info] 175,788,792 L1-icache-loads # 11.998 M/sec (
[info] 7,051,118 L1-icache-load-misses # 4.01% of all L1-icache hits (
[info] 5,302,762,430 dTLB-loads # 361.941 M/sec (
[info] 14,779,238 dTLB-load-misses # 0.28% of all dTLB cache hits (
[info] 245,713 iTLB-loads # 0.017 M/sec (
[info] 1,195,242 iTLB-load-misses # 486.44% of all iTLB cache hits (
[info] 289,031,594 L1-dcache-prefetches # 19.728 M/sec (](https://image.slidesharecdn.com/scalatoasm-200515154847/75/Scala-to-assembly-115-2048.jpg)
![[info] 14,601.12 msec task-clock # 0.481 CPUs utilized
[info] 551 context-switches # 0.038 K/sec
[info] 79 cpu-migrations # 0.005 K/sec
[info] 142 page-faults # 0.010 K/sec
[info] 56,887,530,219 cycles # 3.896 GHz (
[info] 371,071,536 stalled-cycles-frontend # 0.65% frontend cycles idle (
[info] 39,685,104,564 stalled-cycles-backend # 69.76% backend cycles idle (
[info] 85,472,875,315 instructions # 1.50 insn per cycle
[info] # 0.46 stalled cycles per insn (
[info] 7,673,425,909 branches # 525.537 M/sec (
[info] 112,782,902 branch-misses # 1.47% of all branches (
[info] 56,302,951,054 L1-dcache-loads # 3856.070 M/sec (
[info] 7,136,733,184 L1-dcache-load-misses # 12.68% of all L1-dcache hits (
[info] <not supported> LLC-loads
[info] <not supported> LLC-load-misses
[info] 355,107,740 L1-icache-loads # 24.321 M/sec (
[info] 10,933,836 L1-icache-load-misses # 3.08% of all L1-icache hits (
[info] 113,201,590 dTLB-loads # 7.753 M/sec (
[info] 8,907,743 dTLB-load-misses # 7.87% of all dTLB cache hits (
[info] 46,228 iTLB-loads # 0.003 M/sec (
[info] 939,260 iTLB-load-misses # 2031.80% of all iTLB cache hits (
[info] 7,001,888,370 L1-dcache-prefetches # 479.545 M/sec (](https://image.slidesharecdn.com/scalatoasm-200515154847/75/Scala-to-assembly-116-2048.jpg)
![normal while
[info] 14,601.12 msec task-clock # 0.481 CPUs utilized
[info] 551 context-switches # 0.038 K/sec
[info] 79 cpu-migrations # 0.005 K/sec
[info] 142 page-faults # 0.010 K/sec
[info] 56,887,530,219 cycles # 3.896 GHz (
[info] 371,071,536 stalled-cycles-frontend # 0.65% frontend cycles idle (
[info] 39,685,104,564 stalled-cycles-backend # 69.76% backend cycles idle (
[info] 85,472,875,315 instructions # 1.50 insn per cycle
[info] # 0.46 stalled cycles per insn (
[info] 7,673,425,909 branches # 525.537 M/sec (
[info] 112,782,902 branch-misses # 1.47% of all branches (
[info] 56,302,951,054 L1-dcache-loads # 3856.070 M/sec (
[info] 7,136,733,184 L1-dcache-load-misses # 12.68% of all L1-dcache hits (
[info] <not supported> LLC-loads
[info] <not supported> LLC-load-misses
[info] 355,107,740 L1-icache-loads # 24.321 M/sec (
[info] 10,933,836 L1-icache-load-misses # 3.08% of all L1-icache hits (
[info] 113,201,590 dTLB-loads # 7.753 M/sec (
[info] 8,907,743 dTLB-load-misses # 7.87% of all dTLB cache hits (
[info] 46,228 iTLB-loads # 0.003 M/sec (
[info] 939,260 iTLB-load-misses # 2031.80% of all iTLB cache hits (
[info] 7,001,888,370 L1-dcache-prefetches # 479.545 M/sec (](https://image.slidesharecdn.com/scalatoasm-200515154847/75/Scala-to-assembly-117-2048.jpg)
![normal while
L1
[info] 14,601.12 msec task-clock # 0.481 CPUs utilized
[info] 551 context-switches # 0.038 K/sec
[info] 79 cpu-migrations # 0.005 K/sec
[info] 142 page-faults # 0.010 K/sec
[info] 56,887,530,219 cycles # 3.896 GHz (
[info] 371,071,536 stalled-cycles-frontend # 0.65% frontend cycles idle (
[info] 39,685,104,564 stalled-cycles-backend # 69.76% backend cycles idle (
[info] 85,472,875,315 instructions # 1.50 insn per cycle
[info] # 0.46 stalled cycles per insn (
[info] 7,673,425,909 branches # 525.537 M/sec (
[info] 112,782,902 branch-misses # 1.47% of all branches (
[info] 56,302,951,054 L1-dcache-loads # 3856.070 M/sec (
[info] 7,136,733,184 L1-dcache-load-misses # 12.68% of all L1-dcache hits (
[info] <not supported> LLC-loads
[info] <not supported> LLC-load-misses
[info] 355,107,740 L1-icache-loads # 24.321 M/sec (
[info] 10,933,836 L1-icache-load-misses # 3.08% of all L1-icache hits (
[info] 113,201,590 dTLB-loads # 7.753 M/sec (
[info] 8,907,743 dTLB-load-misses # 7.87% of all dTLB cache hits (
[info] 46,228 iTLB-loads # 0.003 M/sec (
[info] 939,260 iTLB-load-misses # 2031.80% of all iTLB cache hits (
[info] 7,001,888,370 L1-dcache-prefetches # 479.545 M/sec (](https://image.slidesharecdn.com/scalatoasm-200515154847/75/Scala-to-assembly-118-2048.jpg)


![[4 dev] lagom](https://cdn.slidesharecdn.com/ss_thumbnails/4devlagom-170403151321-thumbnail.jpg?width=640&height=640&fit=bounds)


