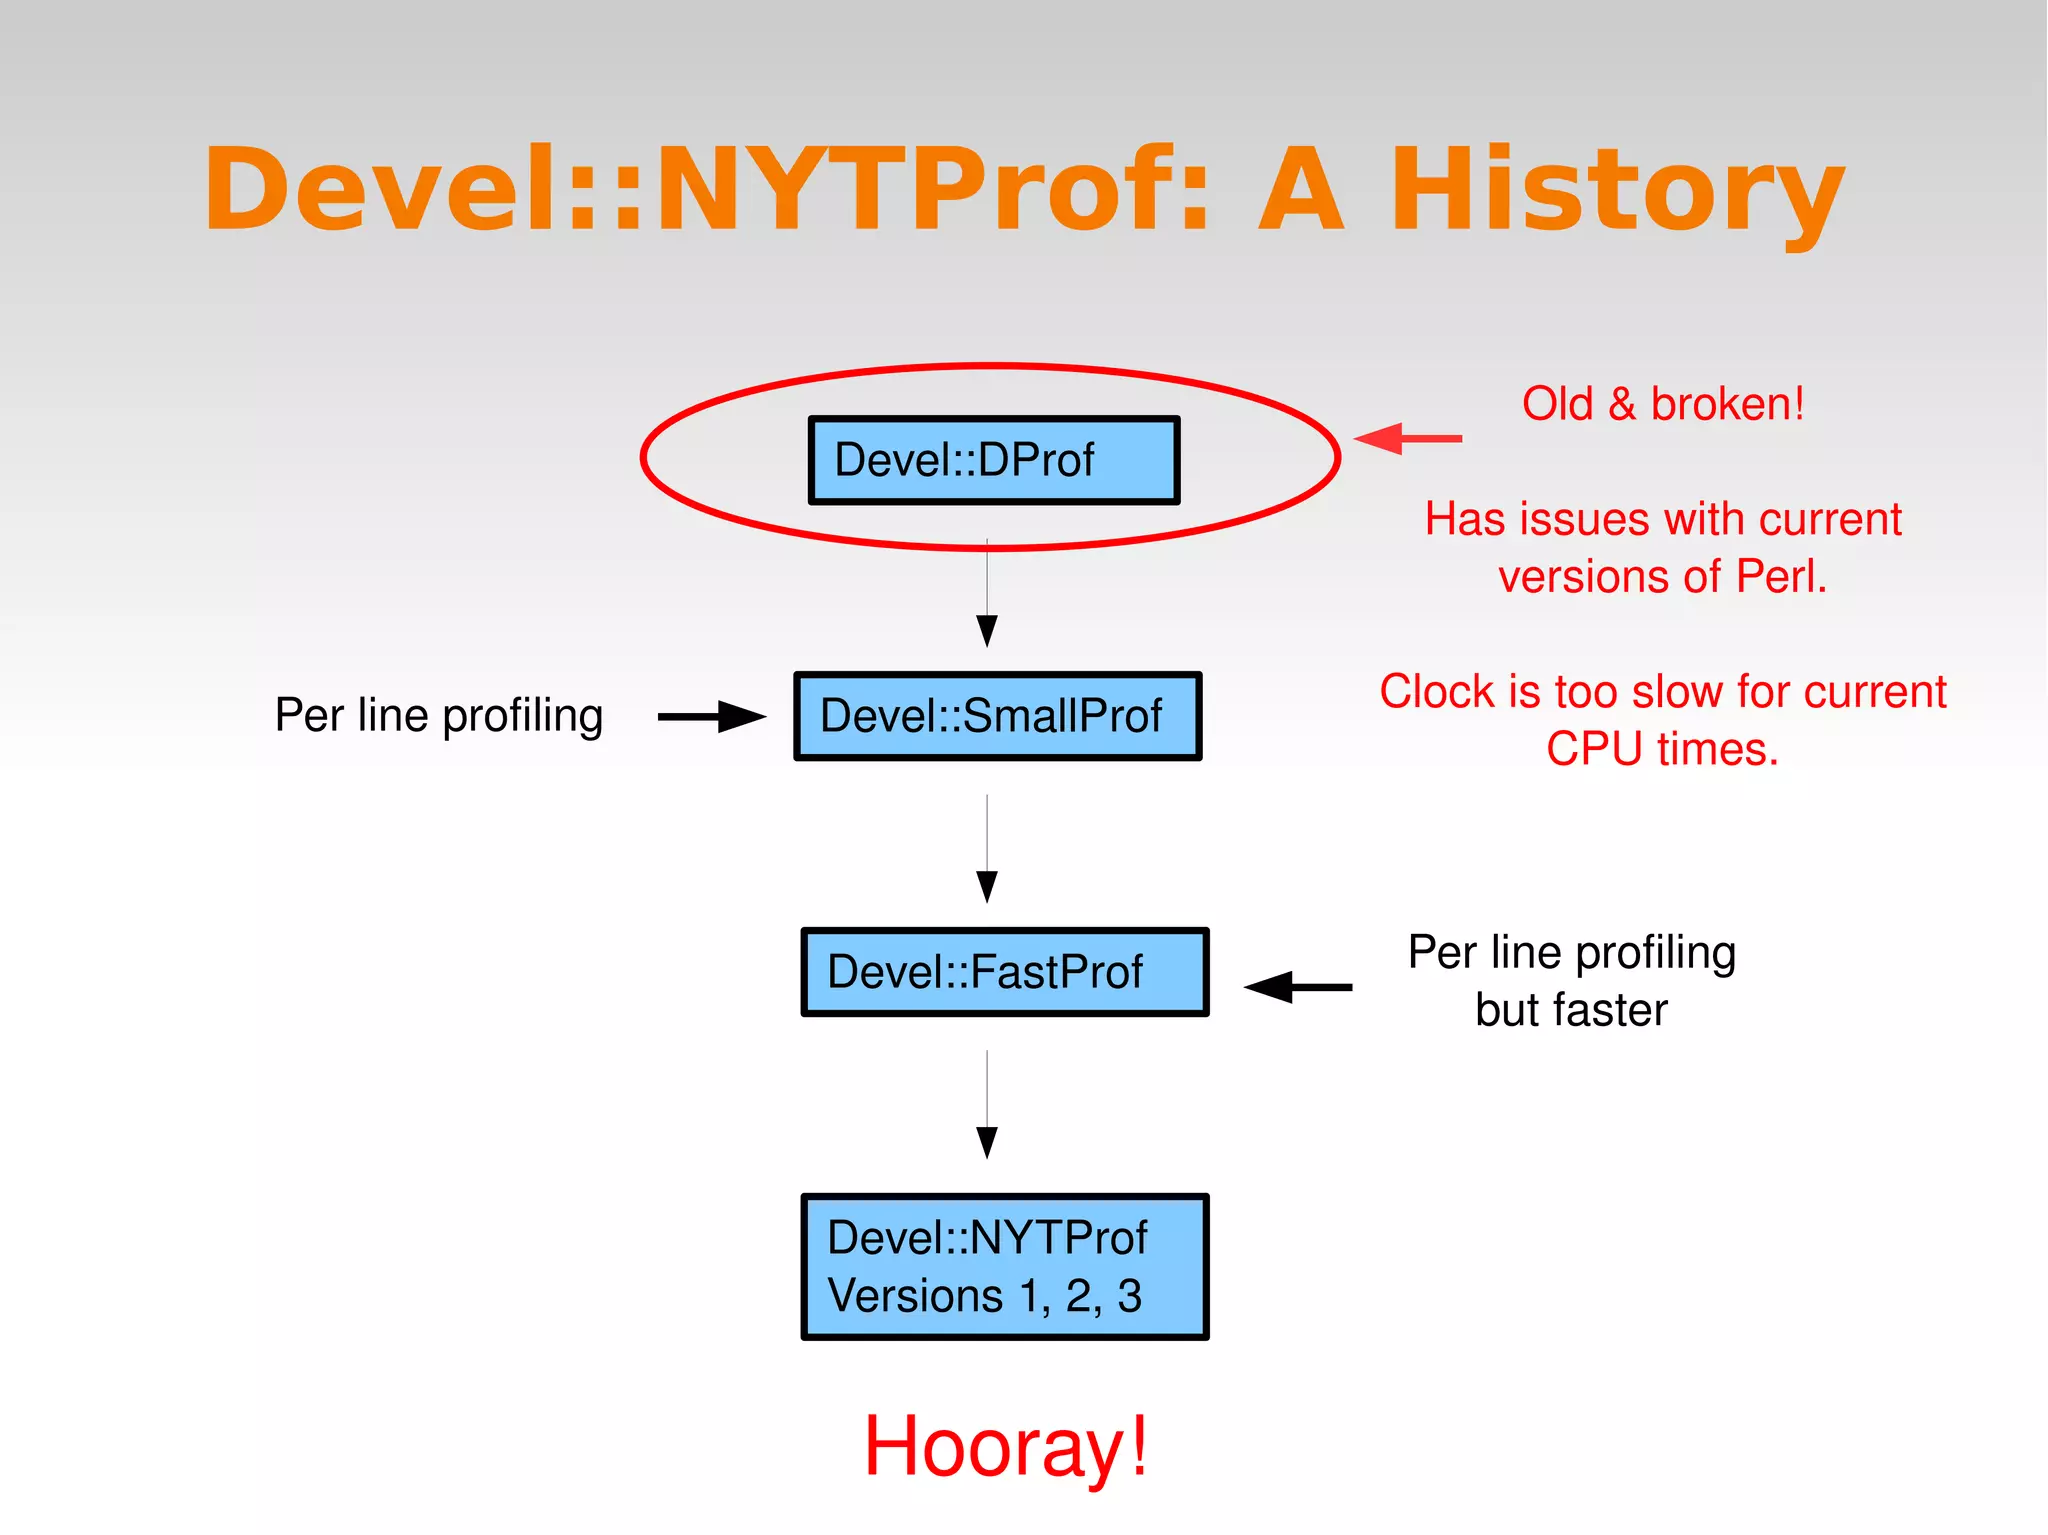
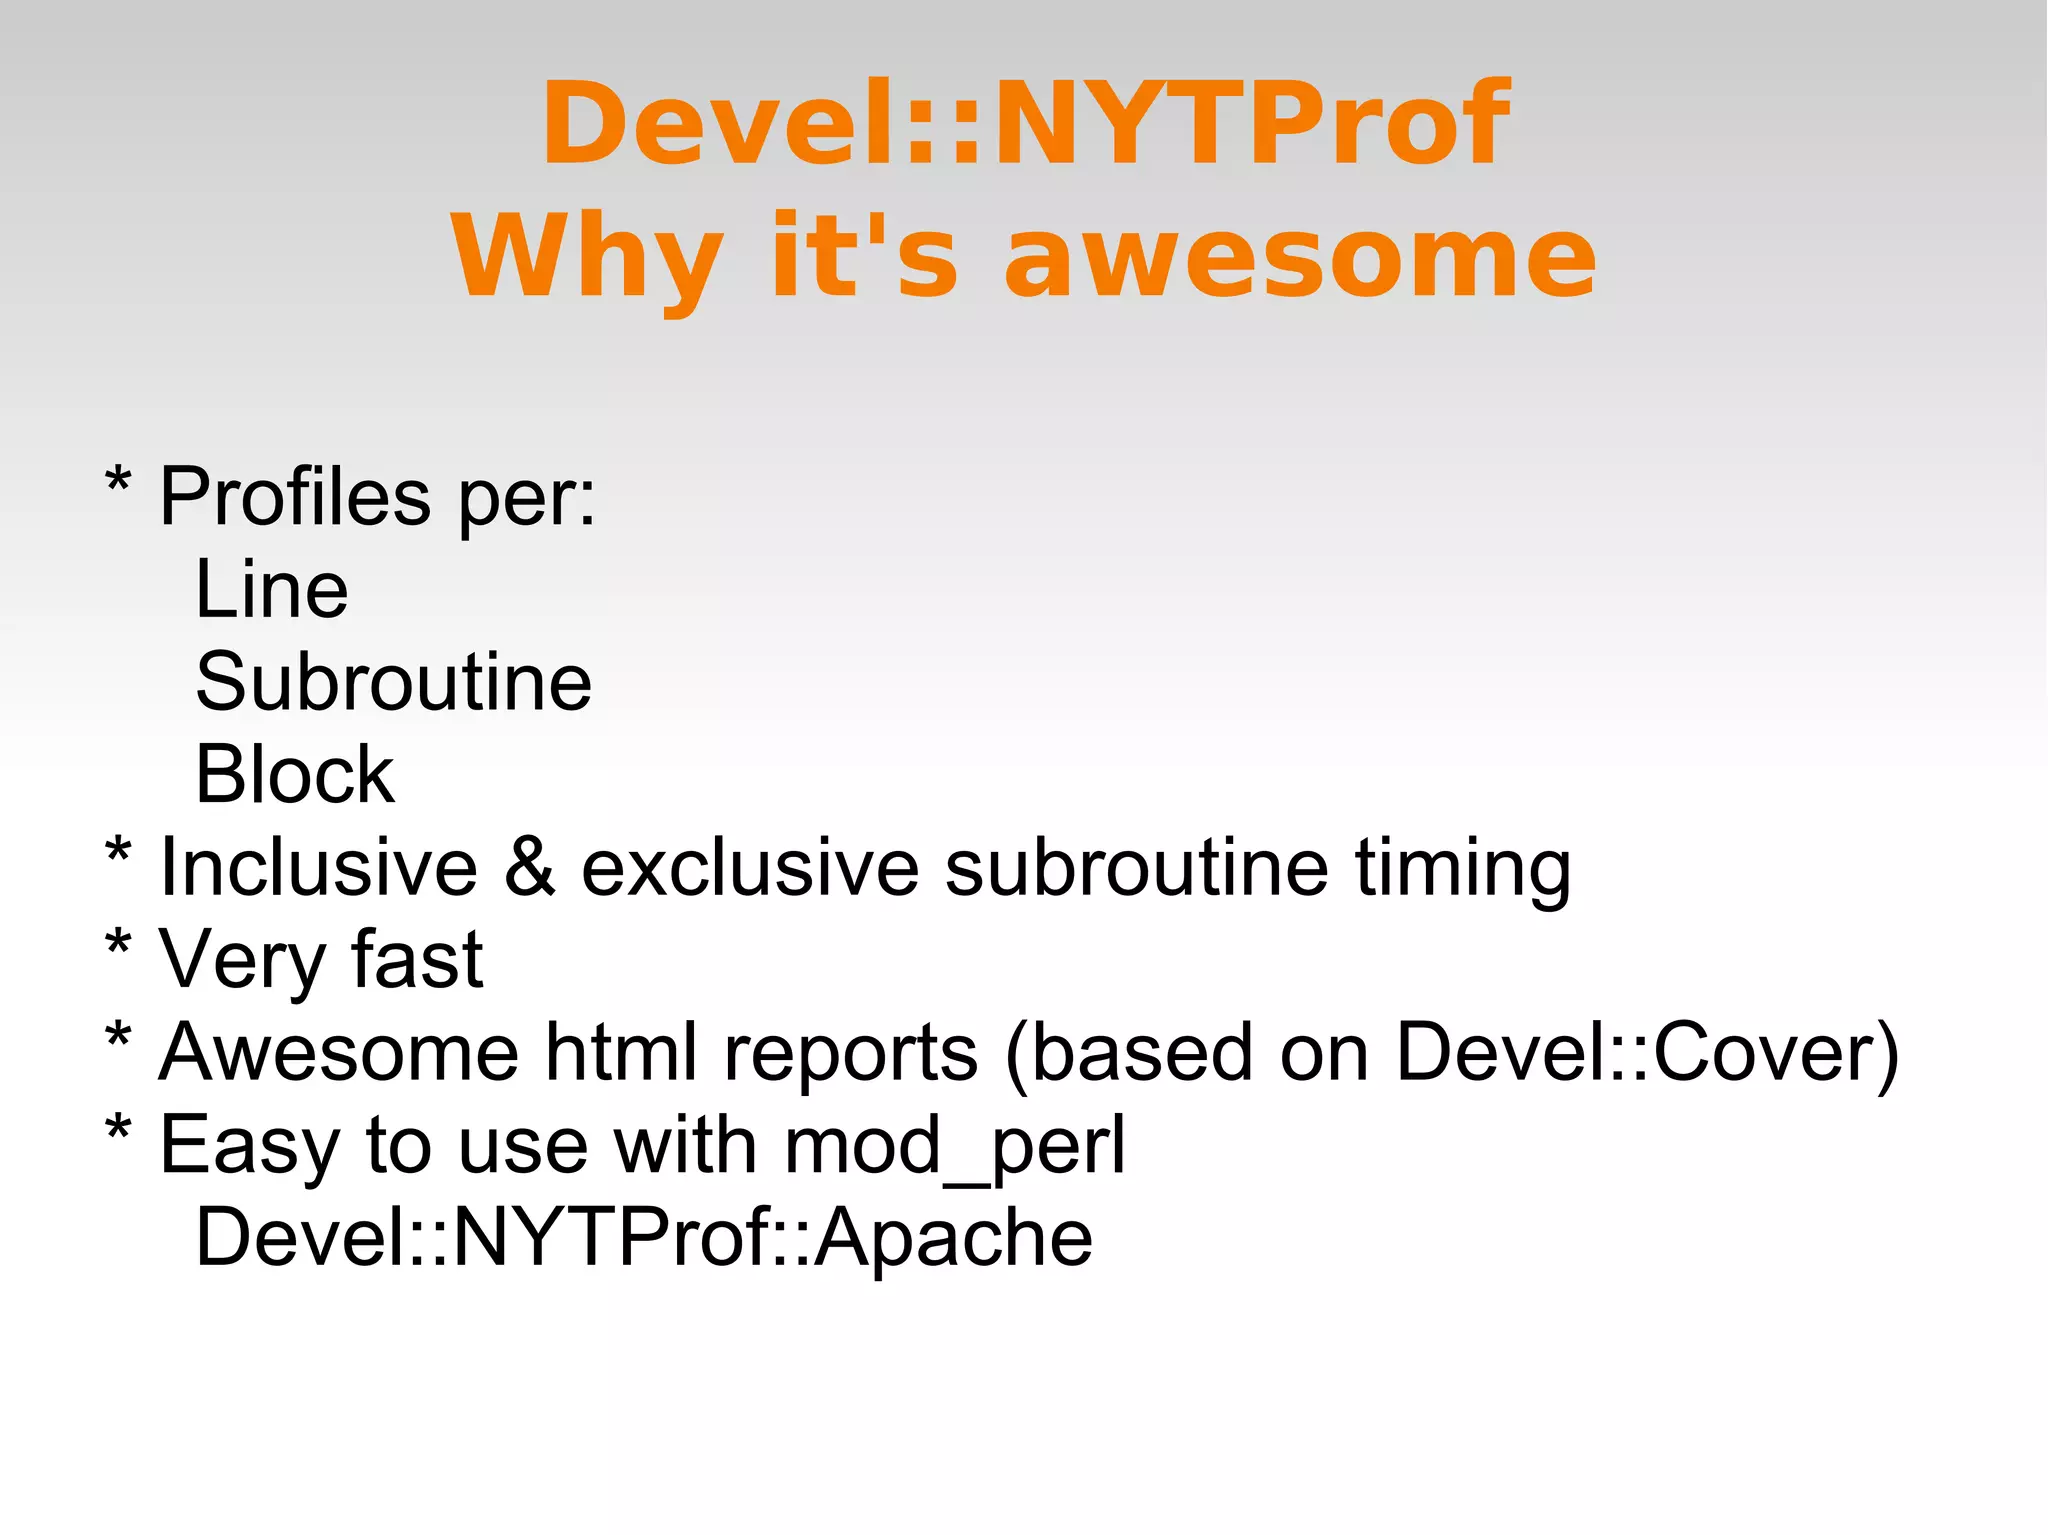
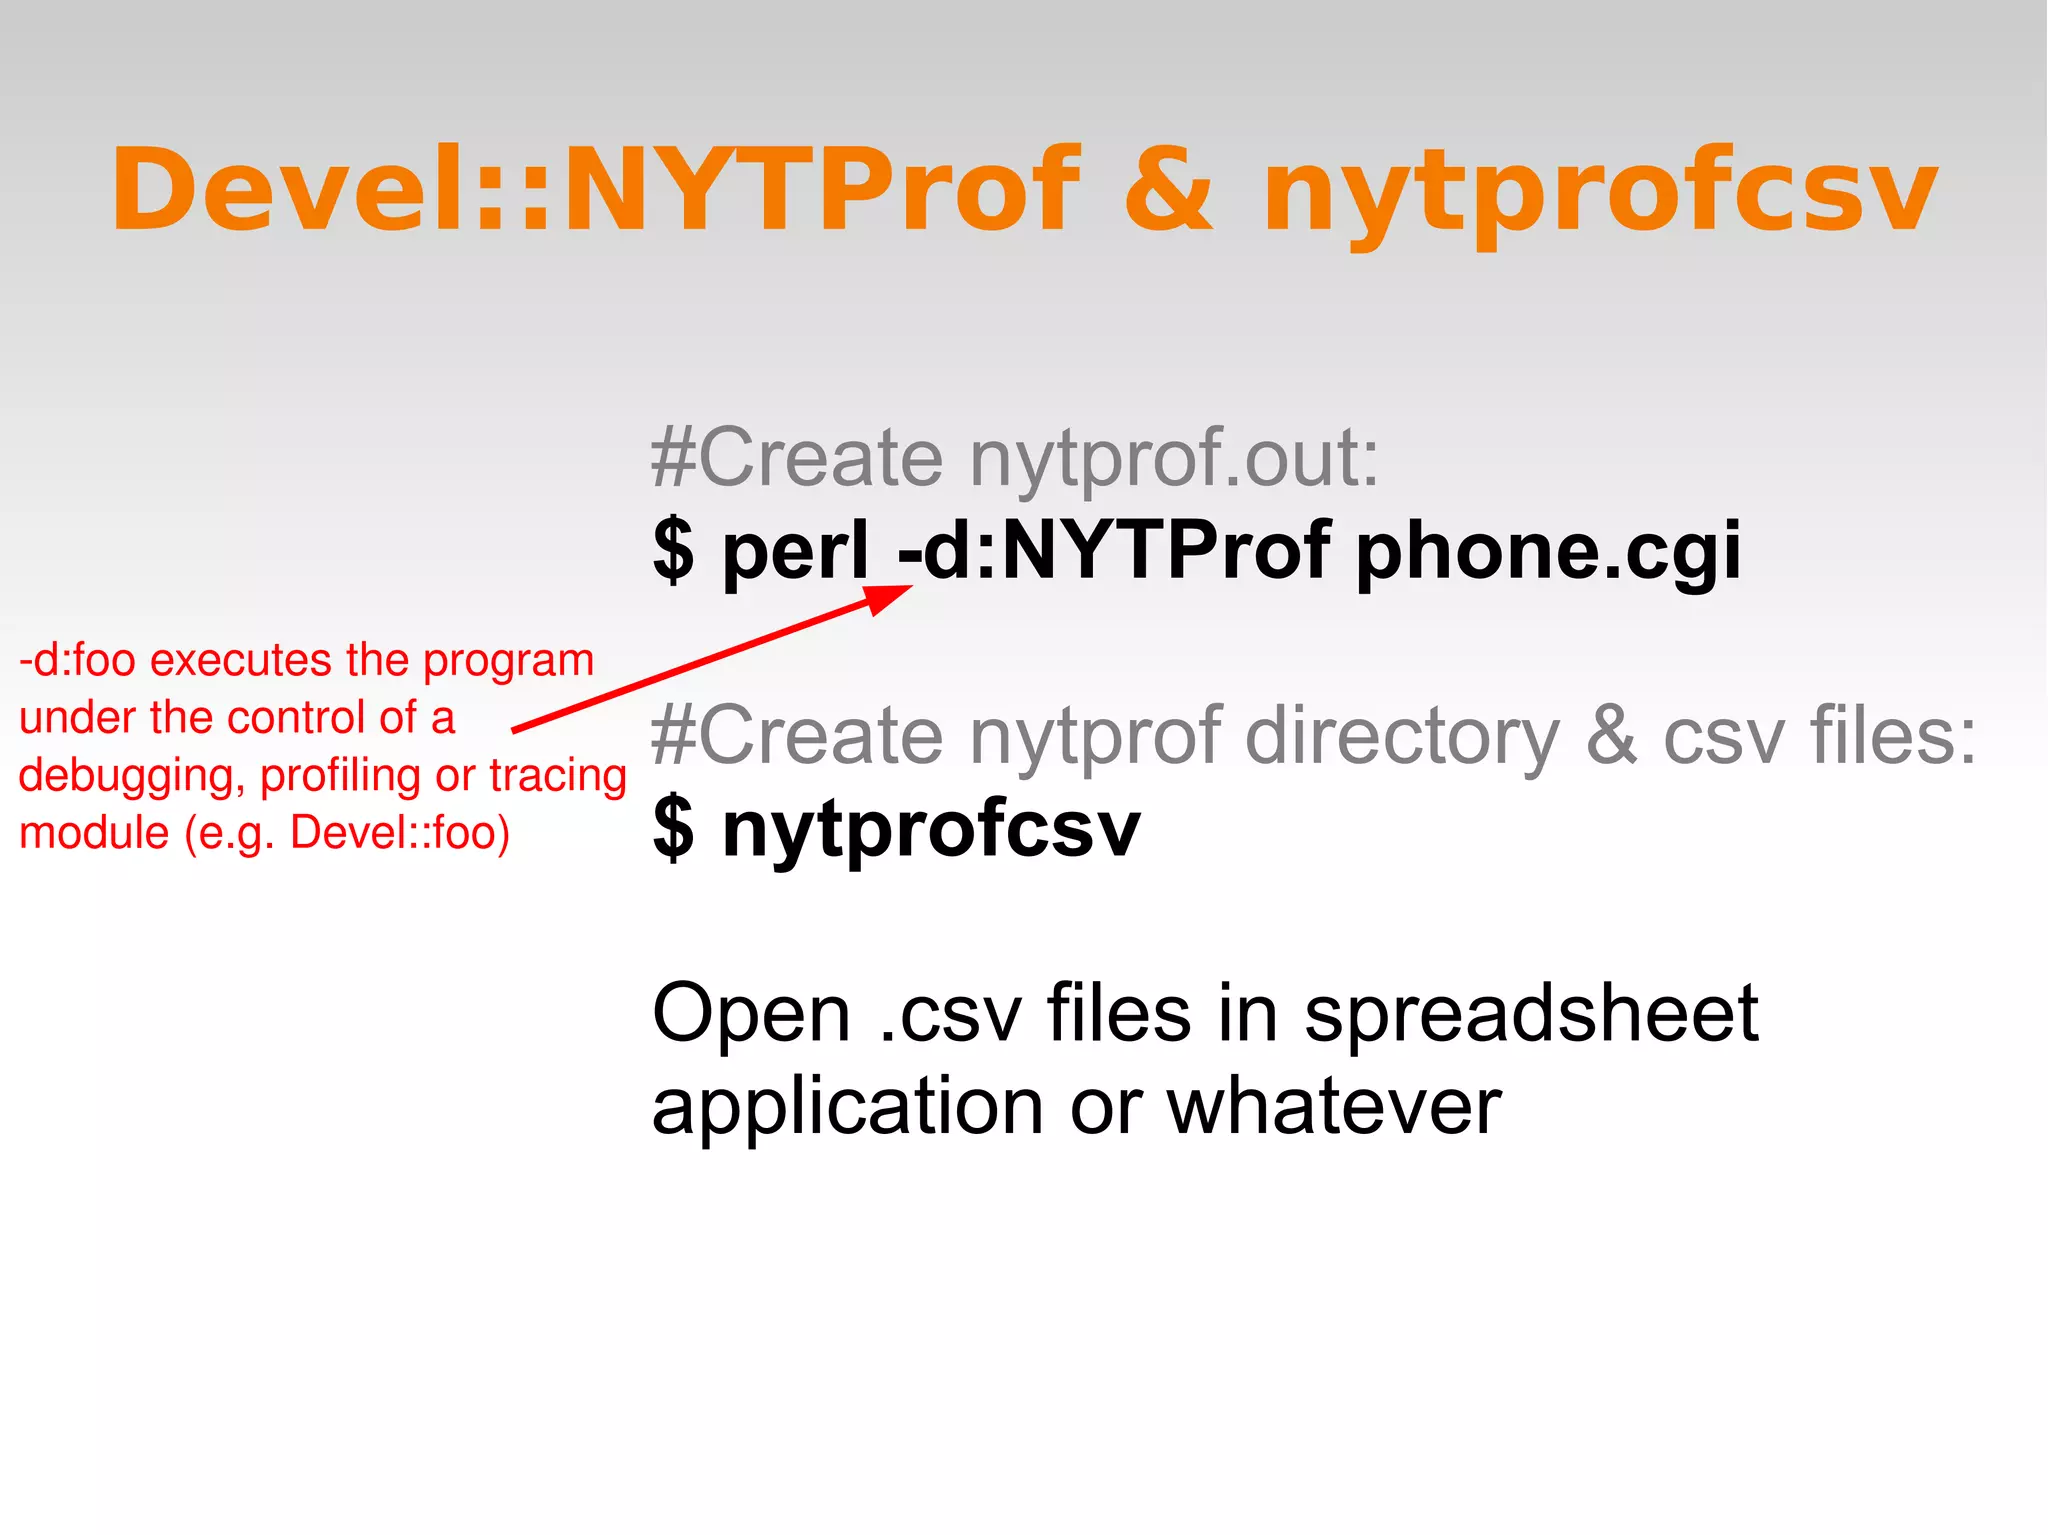
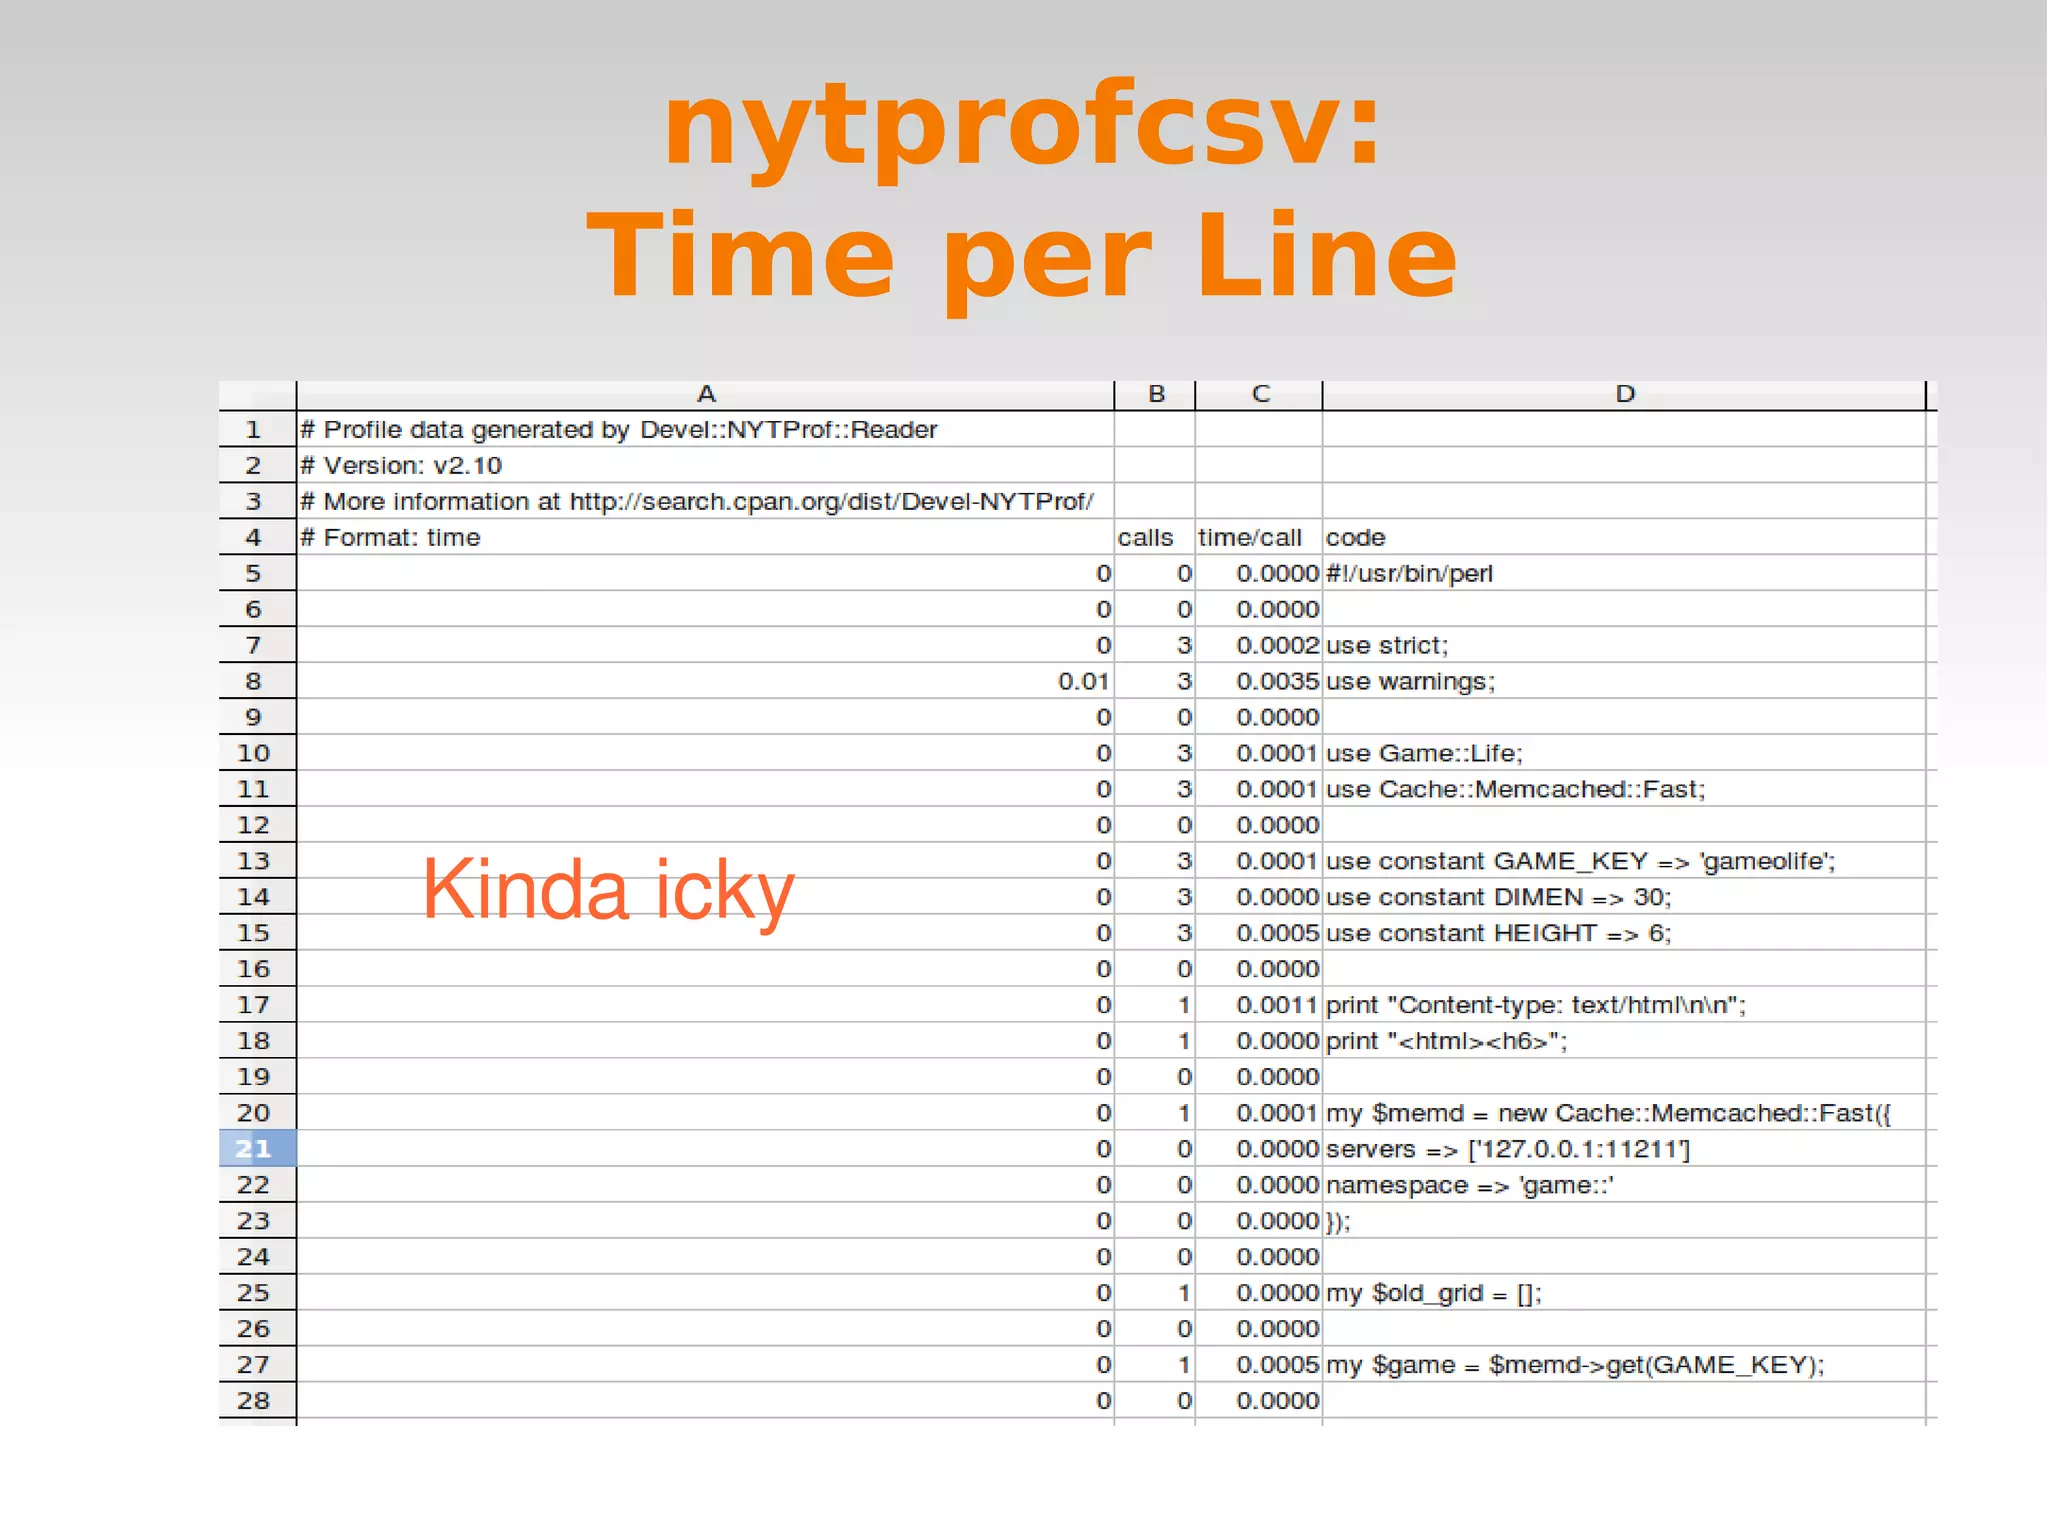
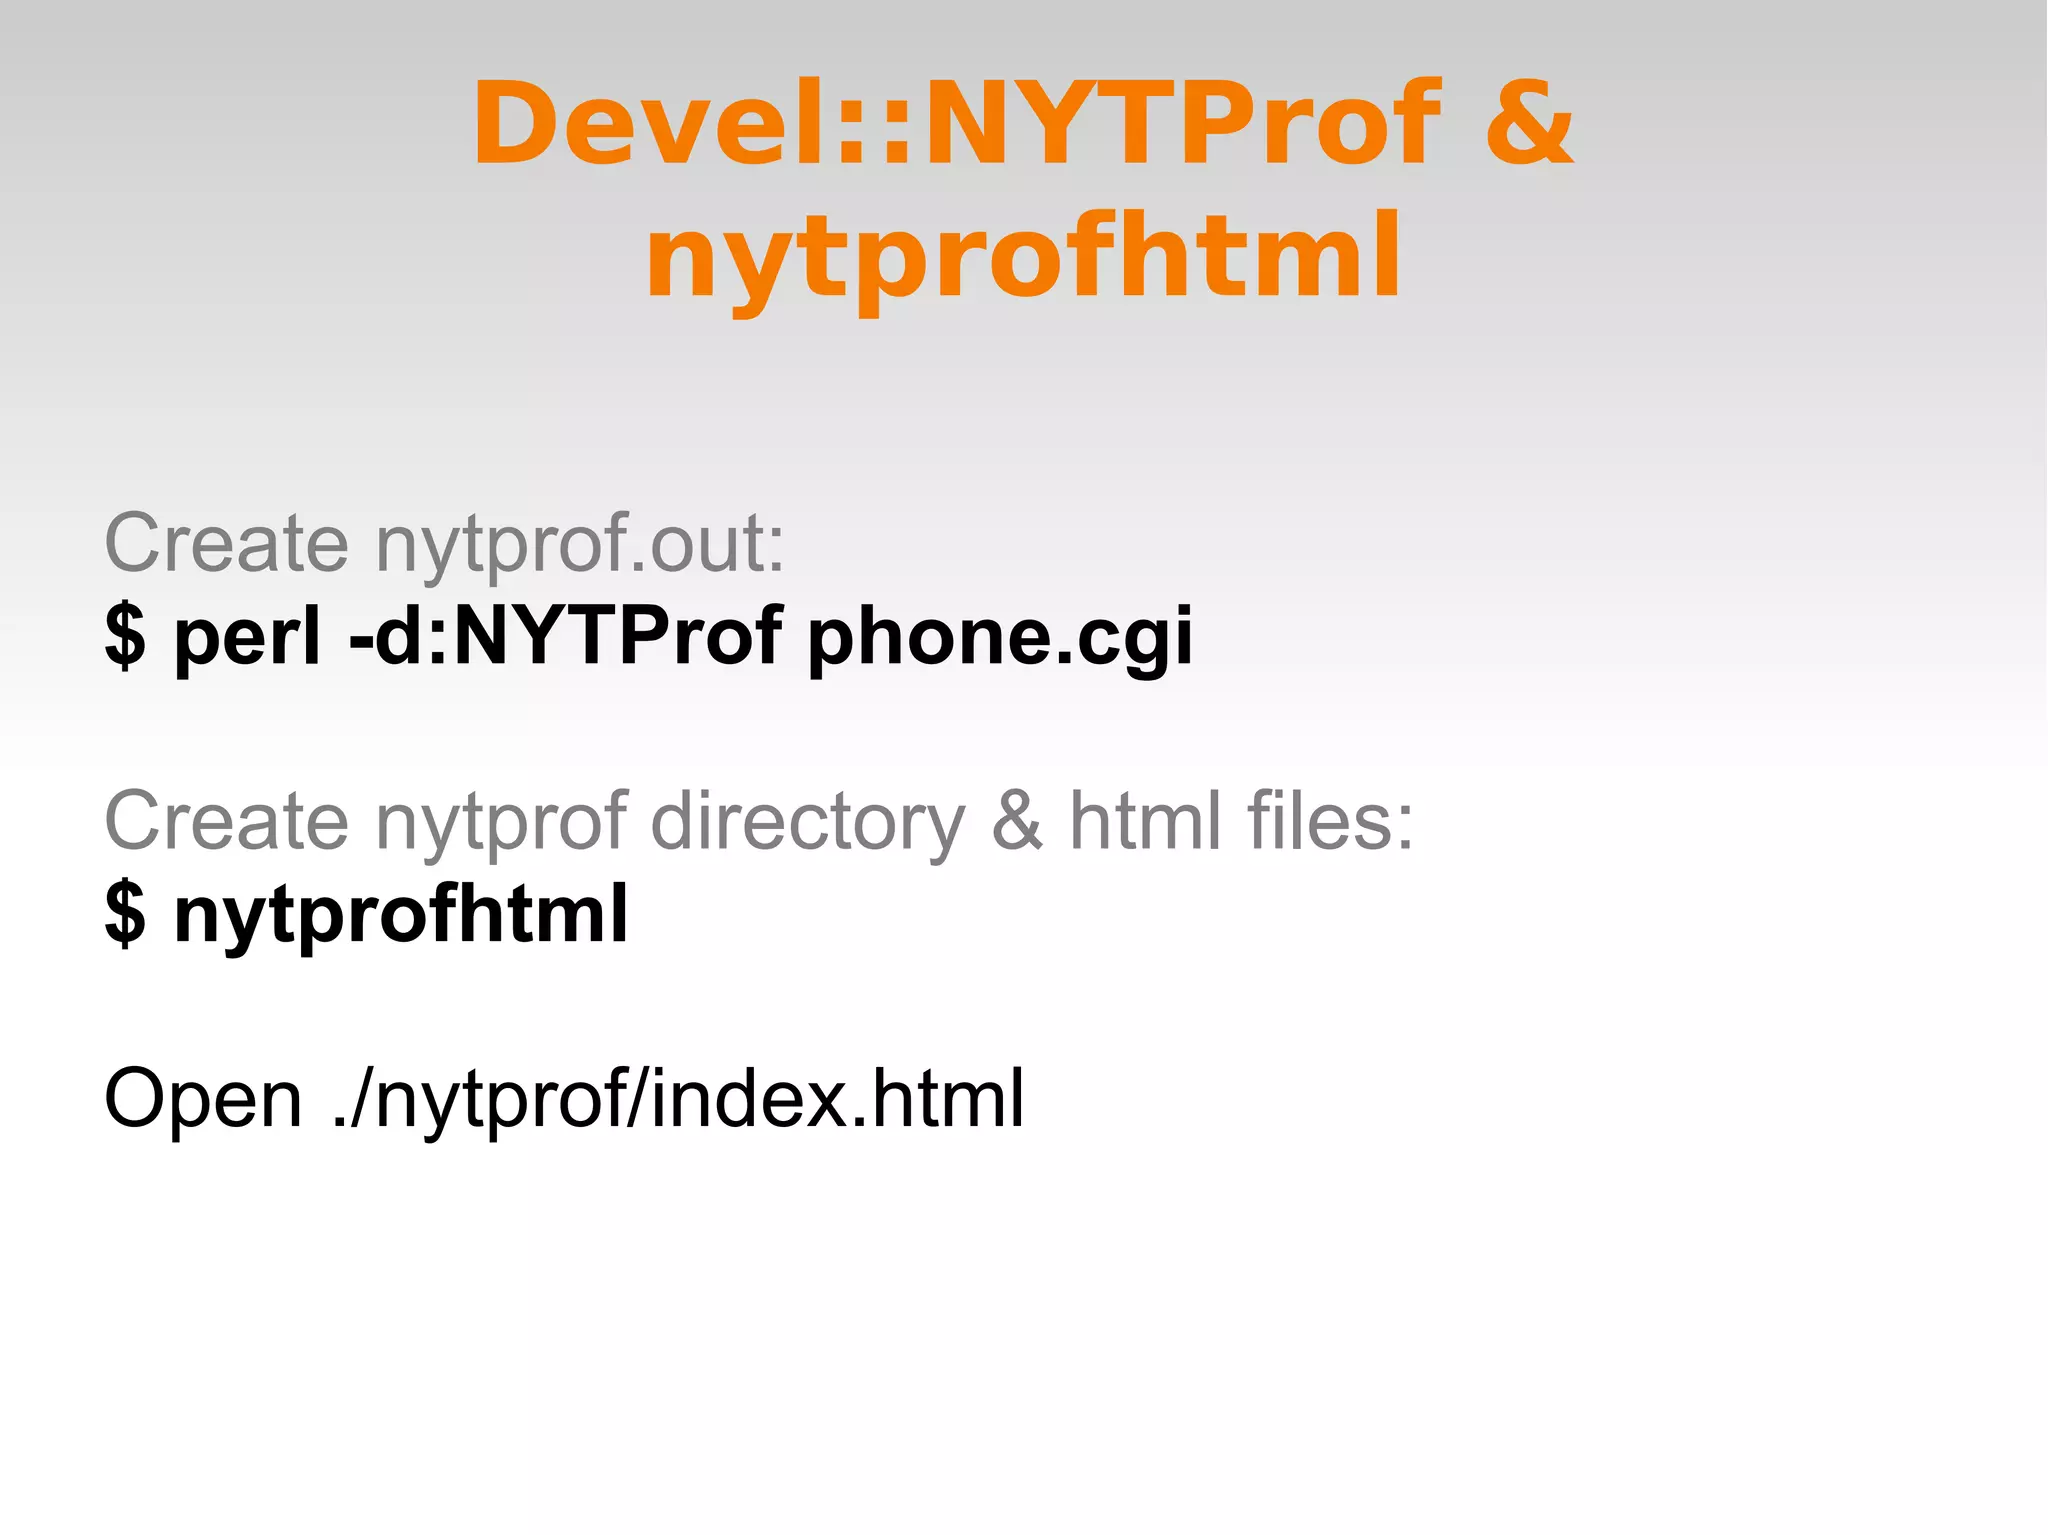
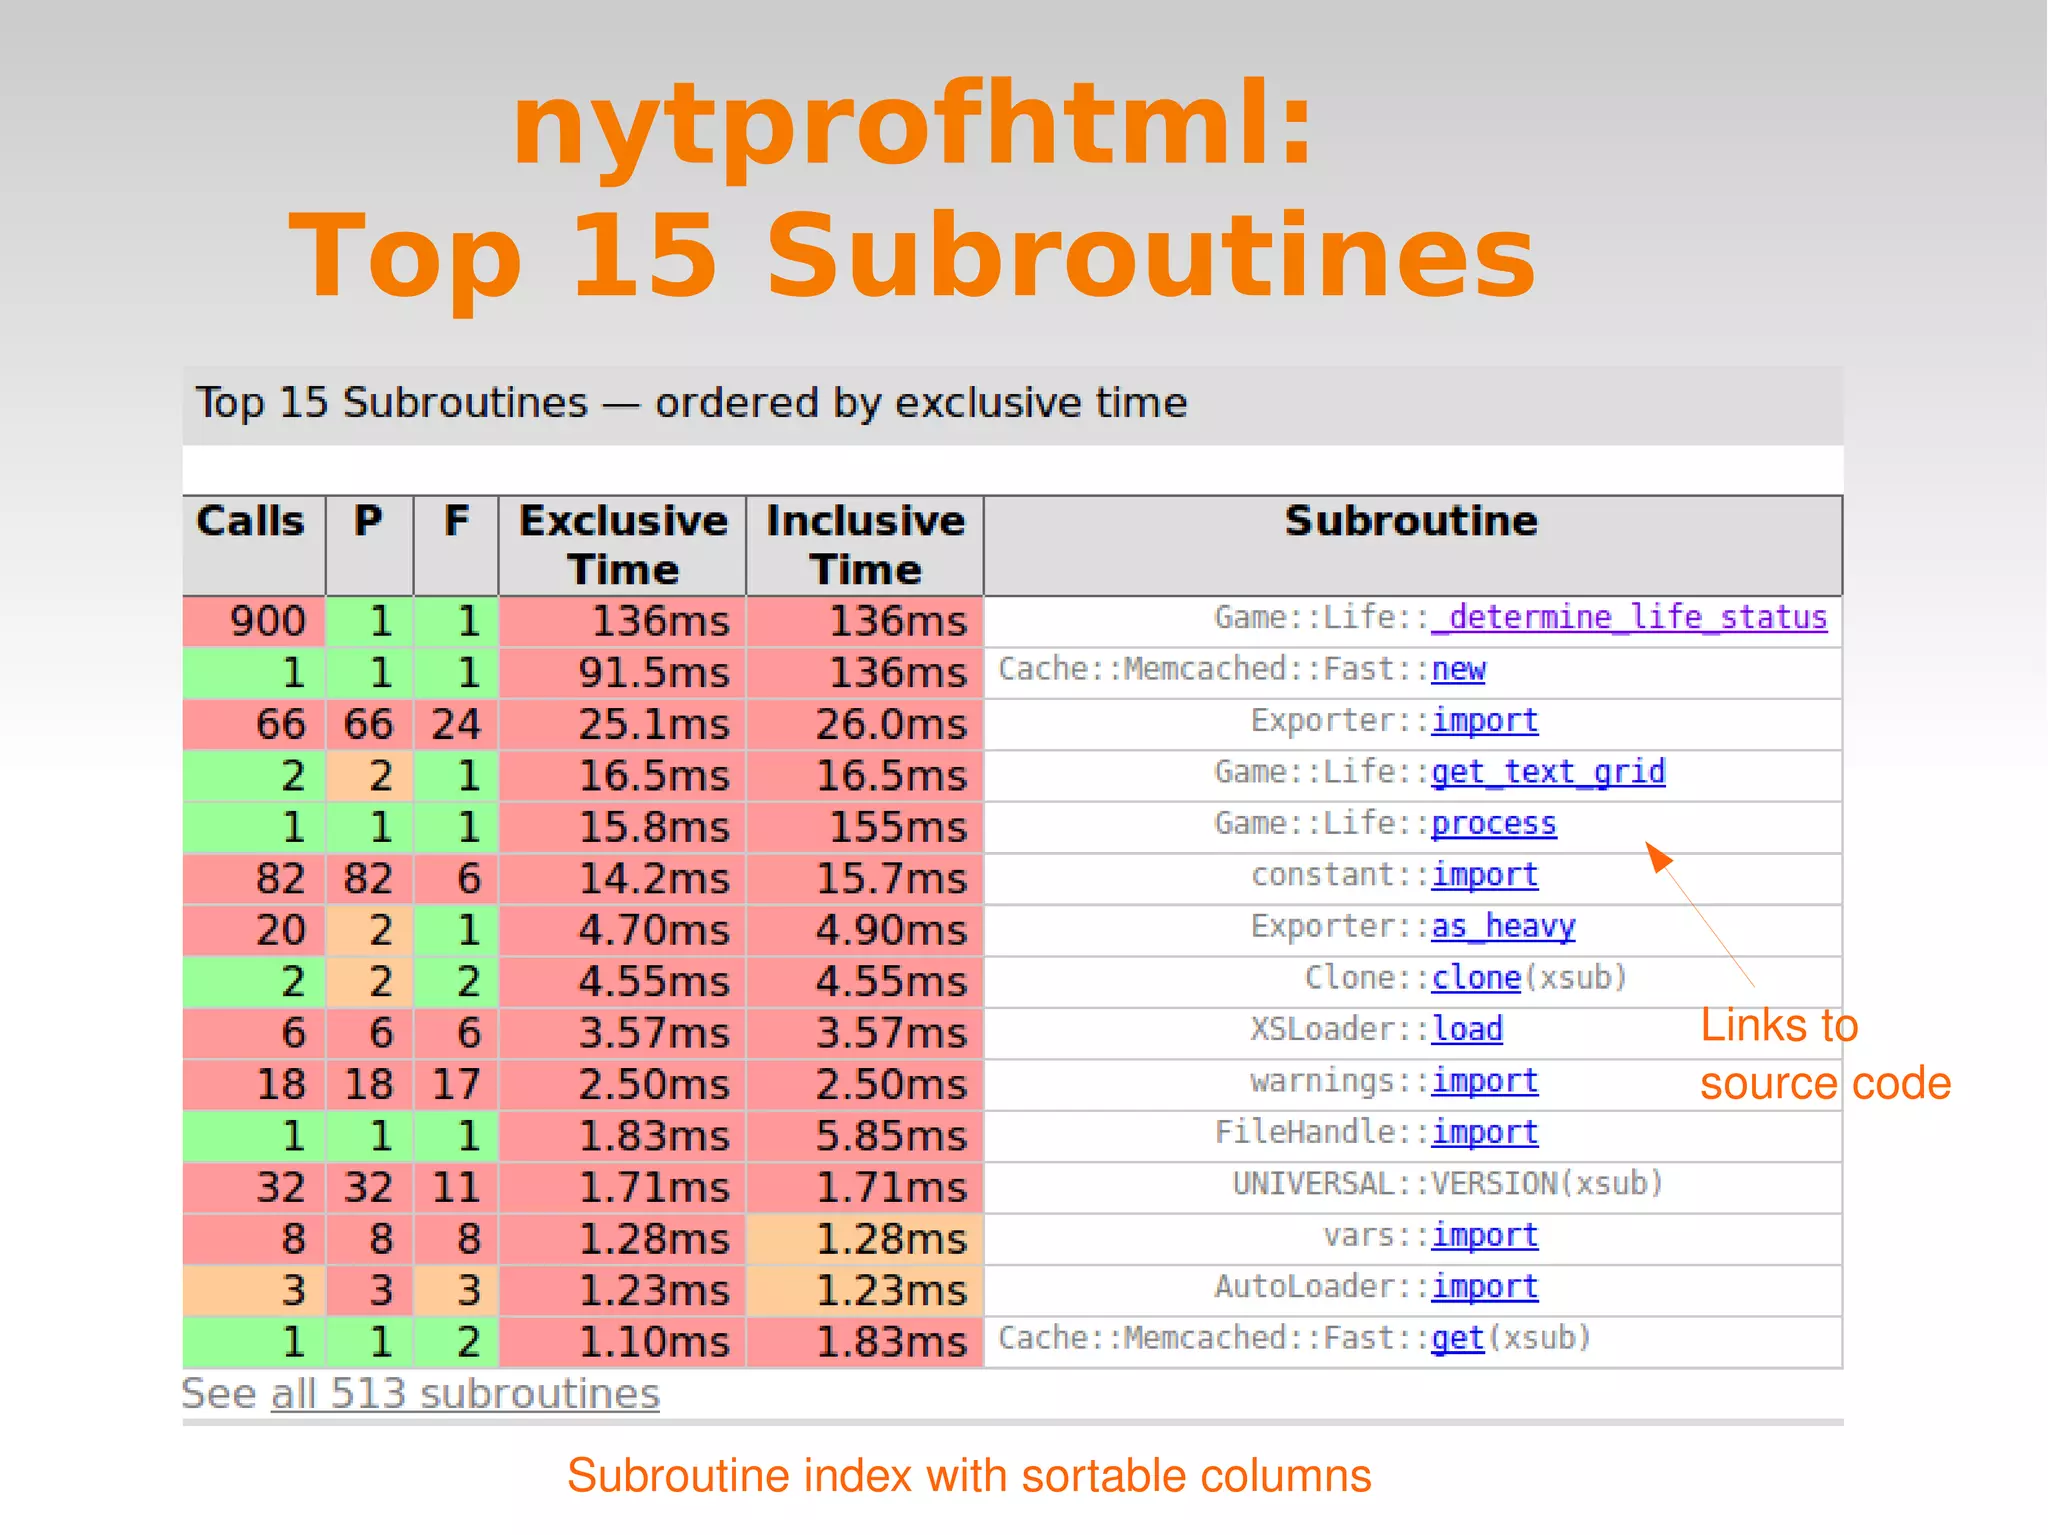
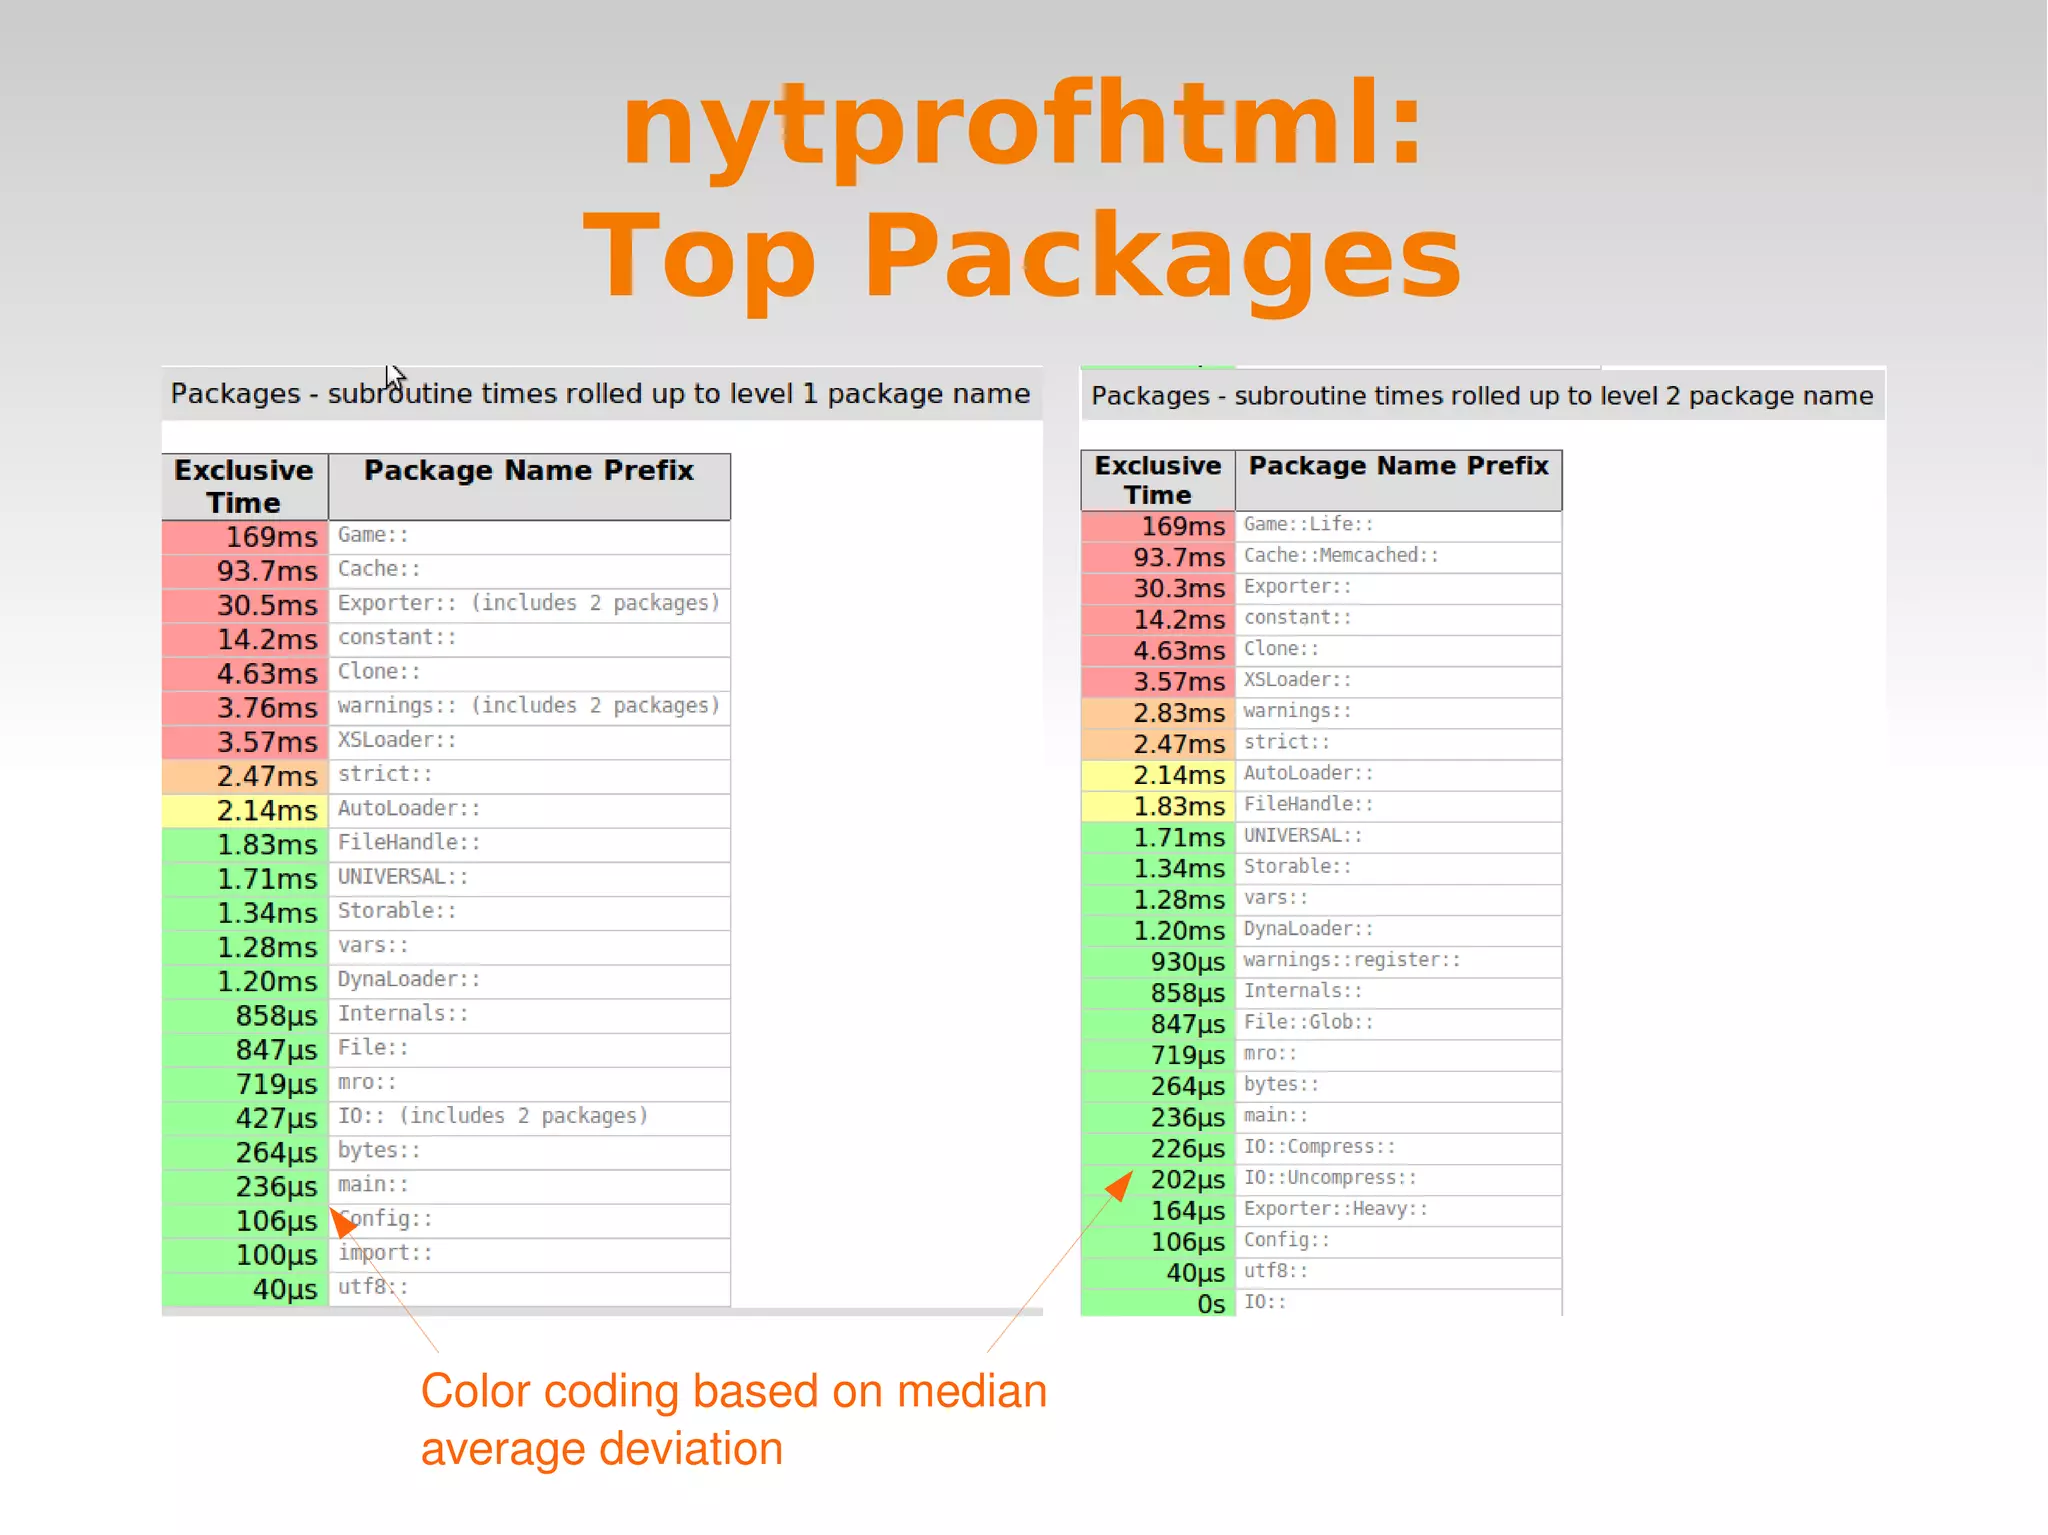
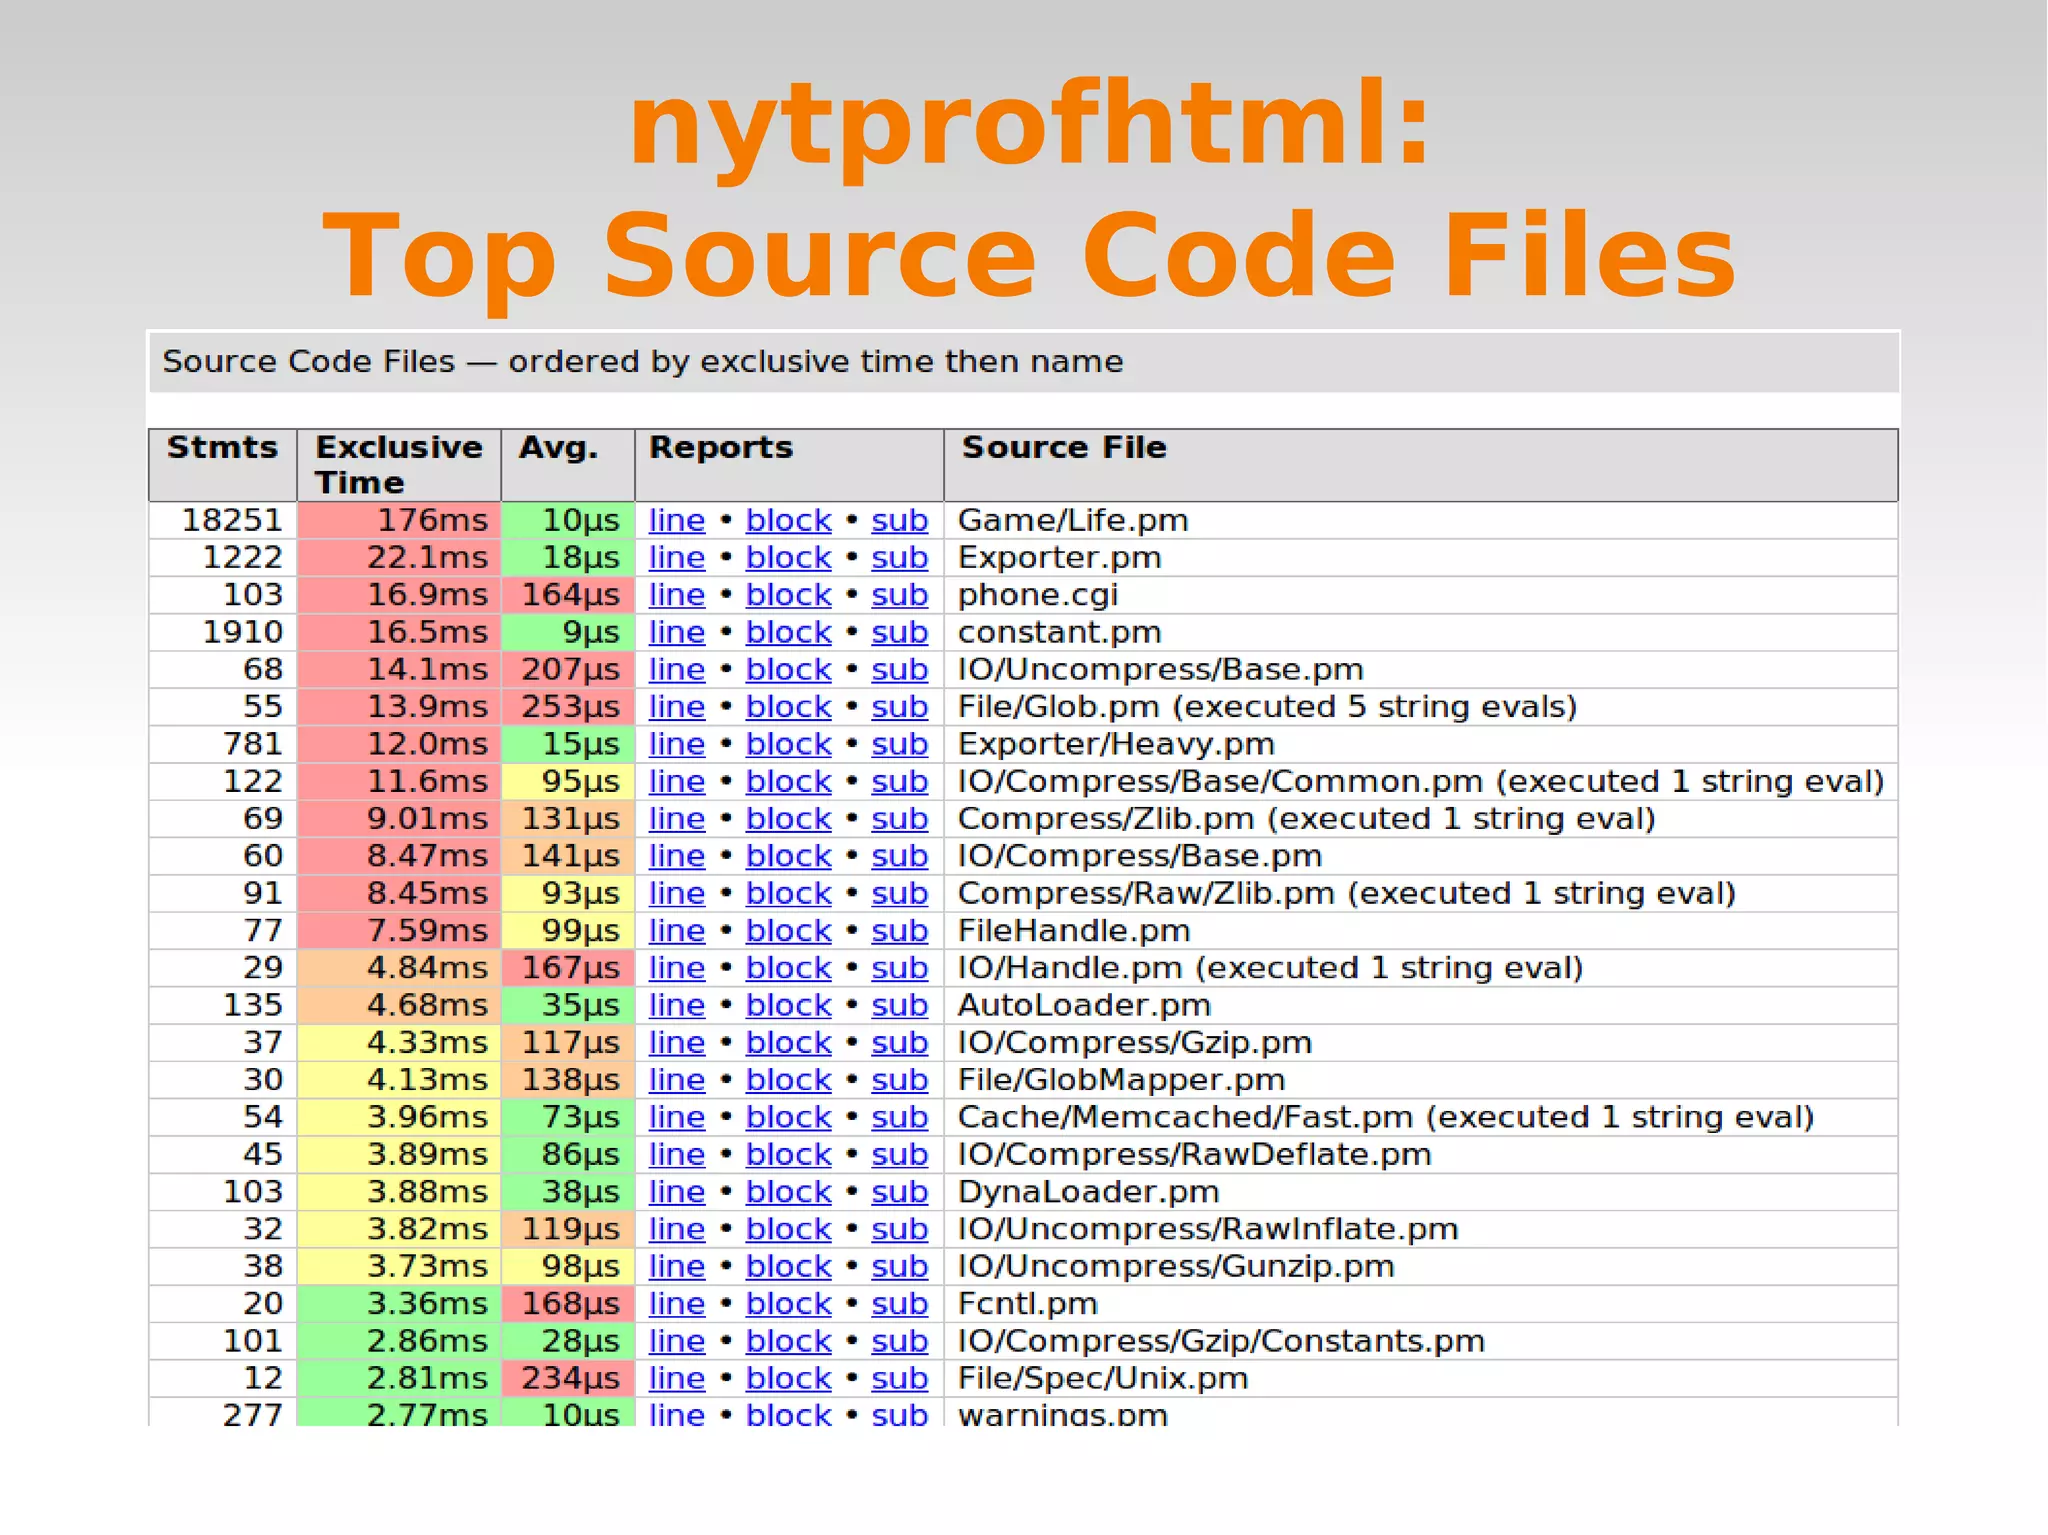
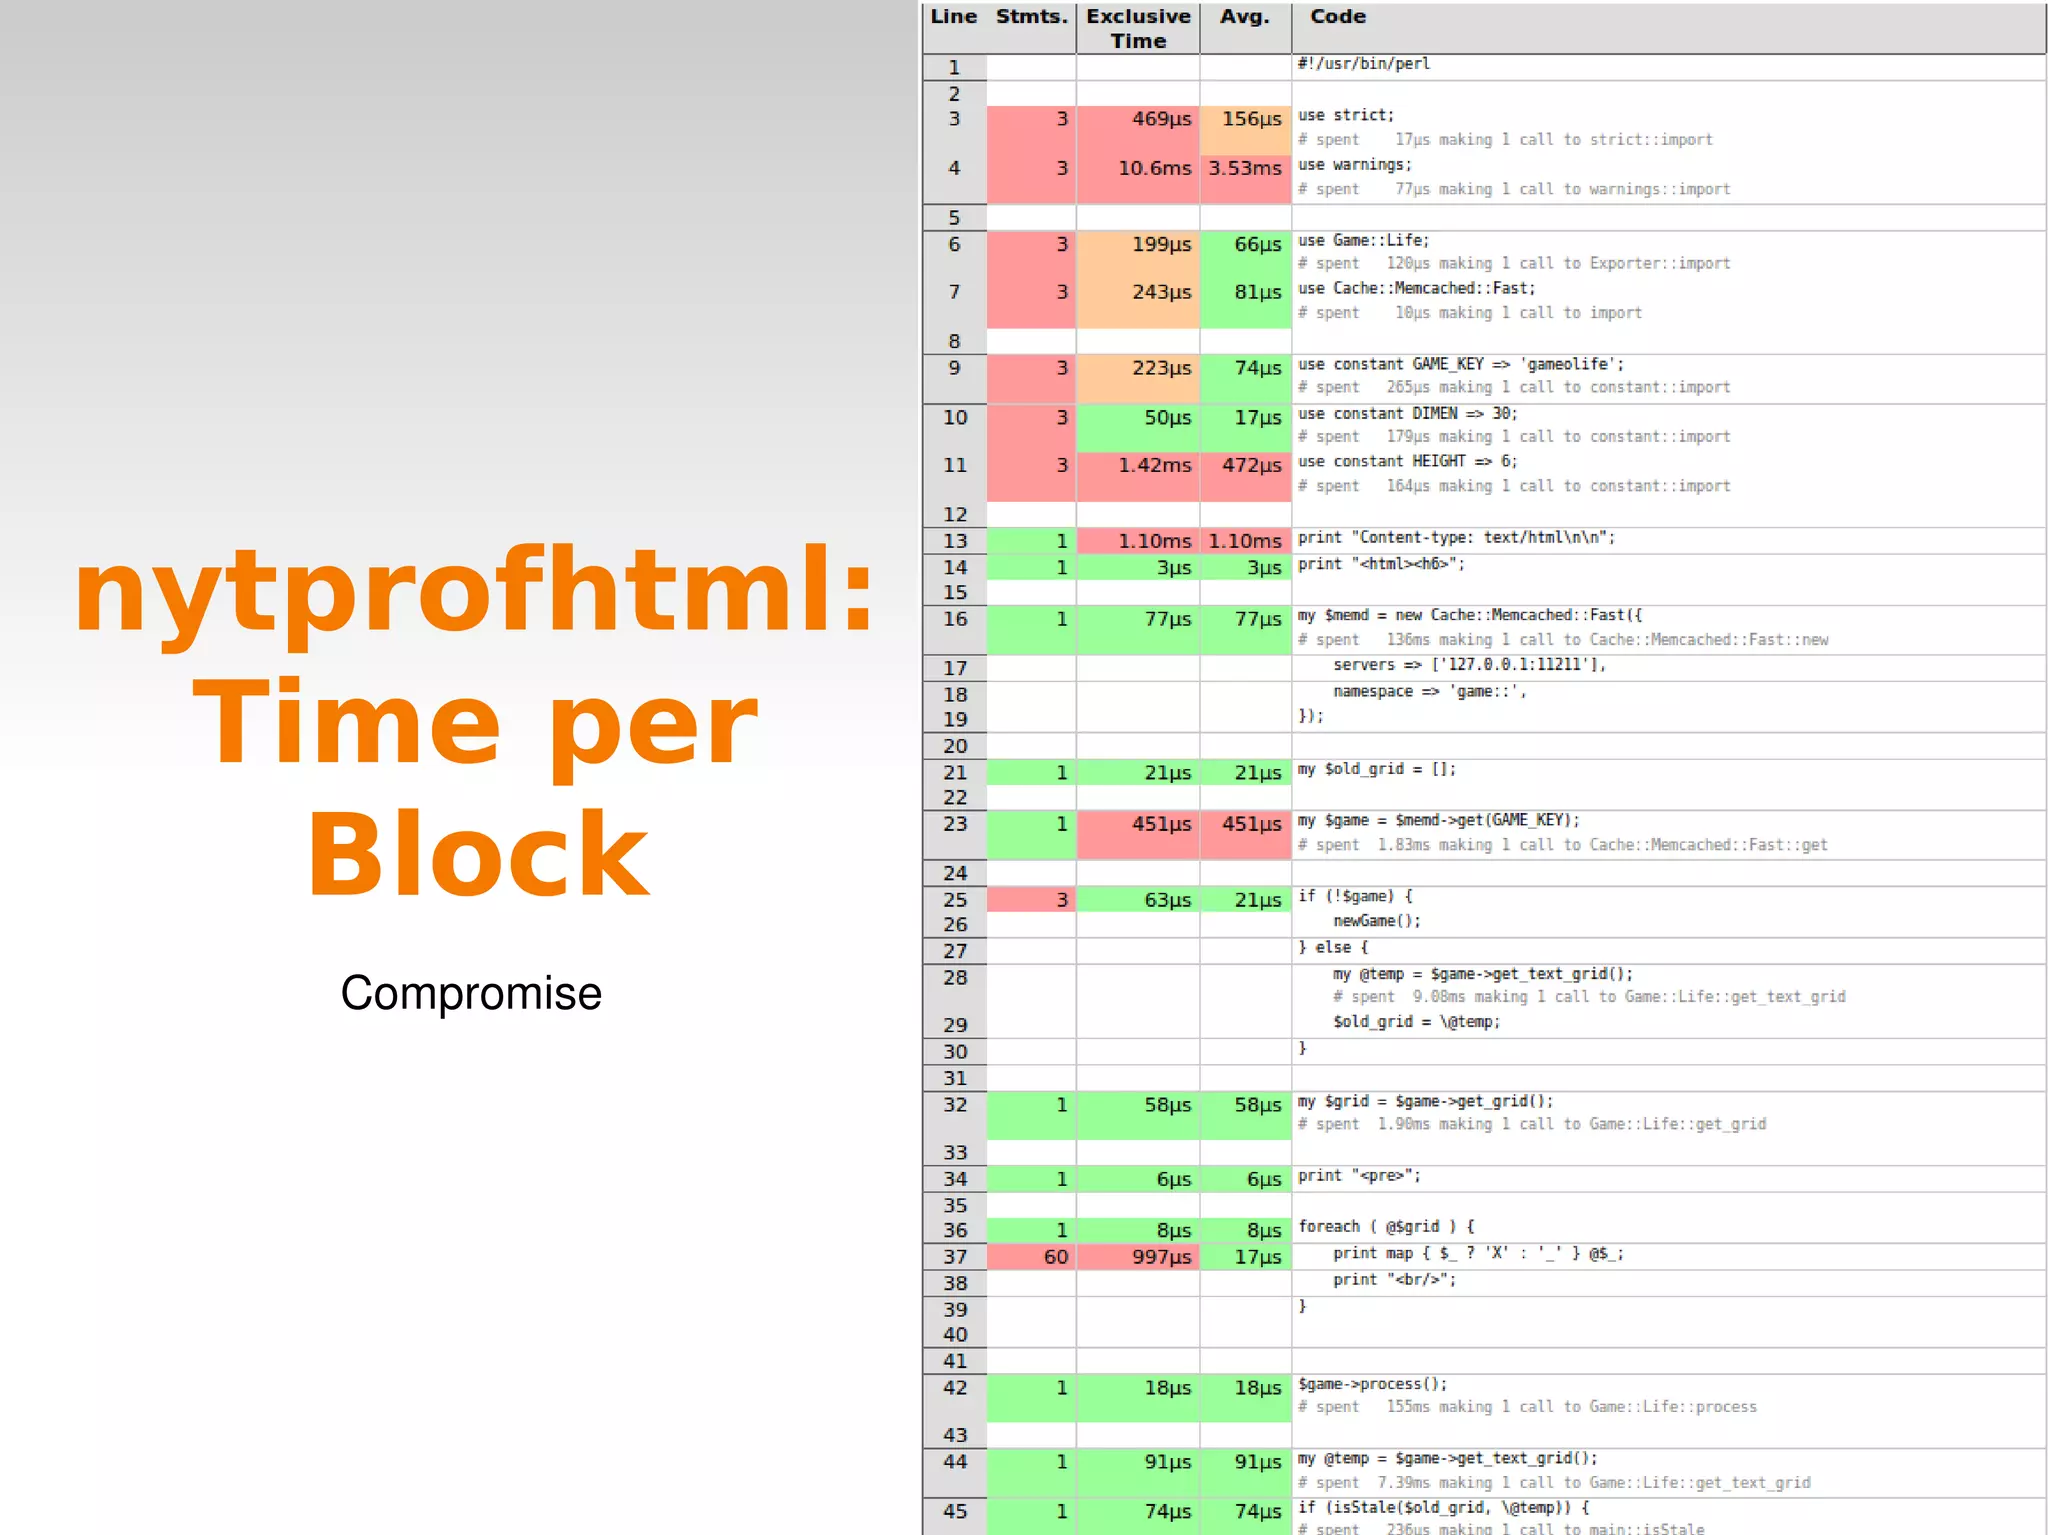
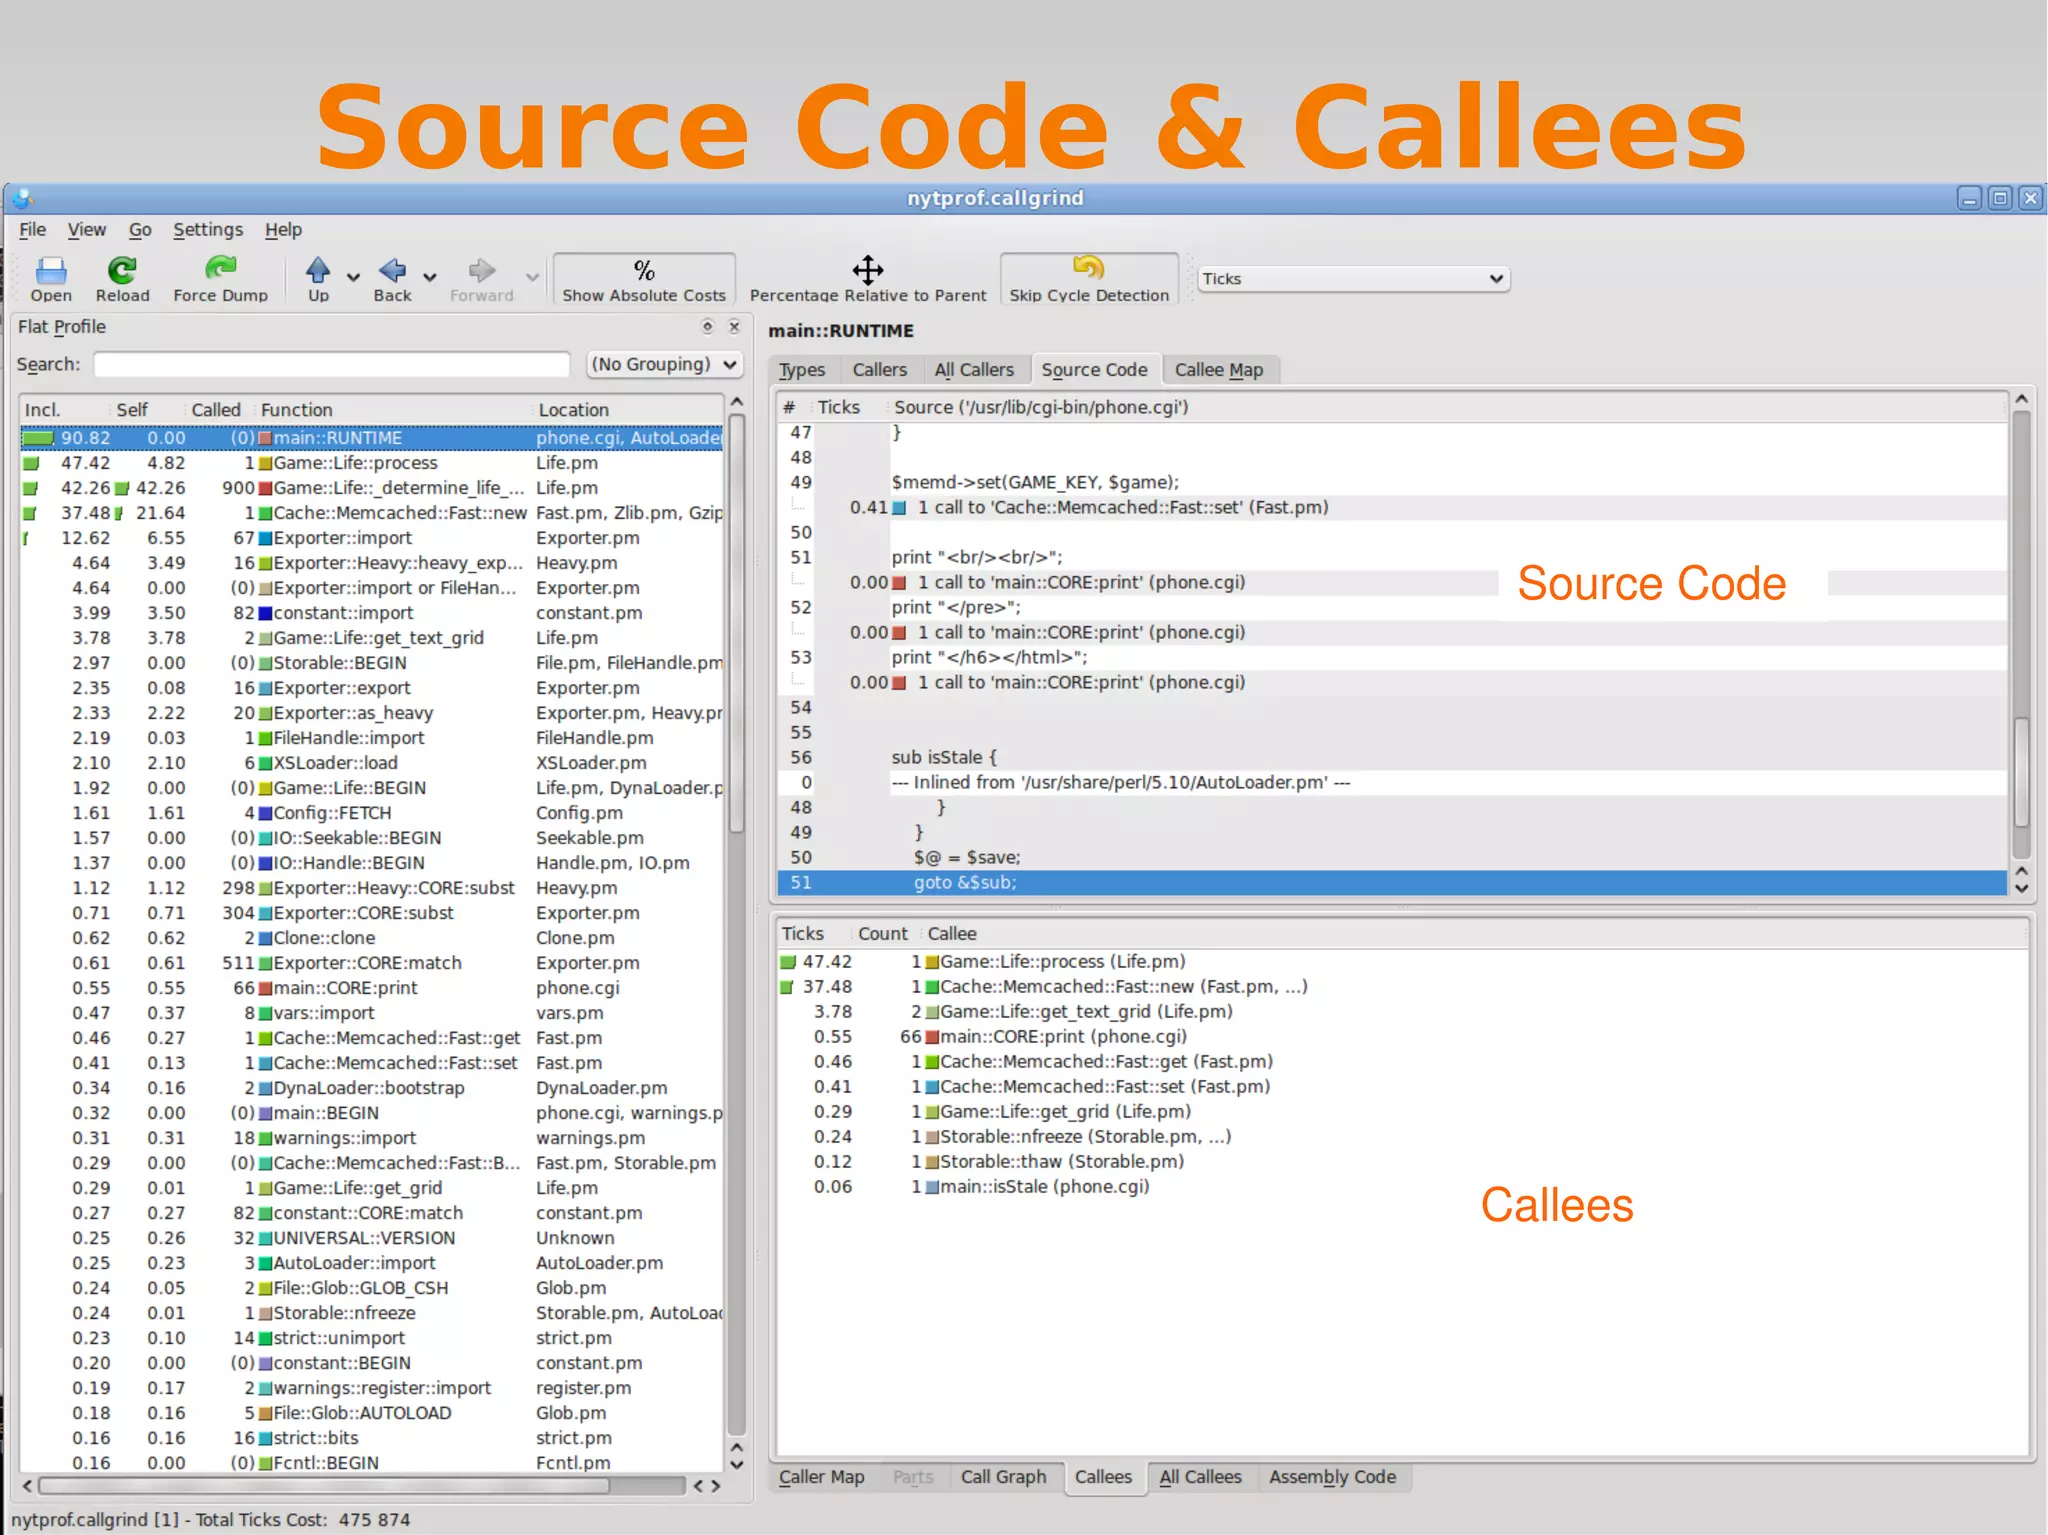
Profiling with Devel::NYTProf
Profiling Profiling:  allows us to know what our programs are doing so we know where to optimize You actually need to profile before optimizing because you never know where the problems are going to be.
Devel::NYTProf: A History Devel::DProf Devel::SmallProf Old & broken! Has issues with current versions of Perl. Clock is too slow for current CPU times. Devel::FastProf Devel::NYTProf Versions 1, 2, 3 Hooray! Per line profiling Per line profiling but faster
Devel::NYTProf Why it's awesome * Profiles per: Line Subroutine Block * Inclusive & exclusive subroutine timing * Very fast * Awesome html reports (based on Devel::Cover) * Easy to use with mod_perl Devel::NYTProf::Apache
#Create nytprof.out: $ perl -d:NYTProf phone.cgi #Create nytprof directory & csv files: $ nytprofcsv Open .csv files in spreadsheet application or whatever Devel::NYTProf & nytprofcsv -d:foo executes the program under the control of a debugging, profiling or tracing module (e.g. Devel::foo)
nytprofcsv: Time per Line nytprofcsv: Time per Line Kinda icky
Devel::NYTProf & nytprofhtml Create nytprof.out: $ perl -d:NYTProf phone.cgi Create nytprof directory & html files: $ nytprofhtml  Open ./nytprof/index.html
nytprofhtml: Top 15 Subroutines Links to source code Subroutine index with sortable columns
nytprofhtml: Top Packages Color coding based on median average deviation
nytprofhtml: Top Source Code Files
nytprofhtml: treemap
nytprofhtml: Time per Sub enter subroutine -  leave subrountine  Color coding relative to rest of file Annotates source code
nytprofhtml: Time per Line start of one statement to the next (;) expensive CPU & IO, too much detail
nytprofhtml: Time per Block Compromise
Kcachegrind Tool to generate and analyze callgraphs (graphs relationships between subroutines) Valgrind Cachegrind Callgrind Kcachegrind Memory debugging & profiling CPU cache profiler Cachegrind with call graphs GUI for Cachegrind
Devel::NYTProf & nytprofcg Currently NYTProf v.2 NYTProf v.3: nytprofcg! http://code.google.com/p/perl-devel-nytprof/source/checkout Creates callgraph data that can be read by Kcachegrind
Devel::NYTProf & nytprofcg Create nytprof.out: $ perl -d:NYTProf phone.cgi Create nytprof.callgraph $ nytprofcg Load callgraph into Kcachegrind $ kcachegrind nytprof.callgraph
Source Code & Callees Callees Source Code
Callee Map & Call Graph Percentage of time in each function Call graph Tree View
Devel::NYTProf::Apache Profile mod_perl! (Not supported on Windows) Add these guys to your apache conf file: PerlPassEnv NYTPROF PerlModule Devel::NYTProf::Apache nytprof.$$.out will end up in /tmp/ unless you specify otherwise by setting the NYTPROF environment variable file=
Resources http://en.oreilly.com/oscon2009/public/schedule/detail/7941 http://blog.timbunce.org/2008/07/15/nytprof-v2-a-major-advance-in-perl-profilers/ http://blog.timbunce.org/2009/08/07/nytprof-v3-a-sneak-peak/#more-301 http://code.google.com/p/perl-devel-nytprof/source/checkout CPAN!

Profiling with Devel::NYTProf

  • 1.
  • 2.
    Profiling Profiling: allows us to know what our programs are doing so we know where to optimize You actually need to profile before optimizing because you never know where the problems are going to be.
  • 3.
    Devel::NYTProf: A HistoryDevel::DProf Devel::SmallProf Old & broken! Has issues with current versions of Perl. Clock is too slow for current CPU times. Devel::FastProf Devel::NYTProf Versions 1, 2, 3 Hooray! Per line profiling Per line profiling but faster
  • 4.
    Devel::NYTProf Why it'sawesome * Profiles per: Line Subroutine Block * Inclusive & exclusive subroutine timing * Very fast * Awesome html reports (based on Devel::Cover) * Easy to use with mod_perl Devel::NYTProf::Apache
  • 5.
    #Create nytprof.out: $perl -d:NYTProf phone.cgi #Create nytprof directory & csv files: $ nytprofcsv Open .csv files in spreadsheet application or whatever Devel::NYTProf & nytprofcsv -d:foo executes the program under the control of a debugging, profiling or tracing module (e.g. Devel::foo)
  • 6.
    nytprofcsv: Time perLine nytprofcsv: Time per Line Kinda icky
  • 7.
    Devel::NYTProf & nytprofhtmlCreate nytprof.out: $ perl -d:NYTProf phone.cgi Create nytprof directory & html files: $ nytprofhtml Open ./nytprof/index.html
  • 8.
    nytprofhtml: Top 15Subroutines Links to source code Subroutine index with sortable columns
  • 9.
    nytprofhtml: Top PackagesColor coding based on median average deviation
  • 10.
  • 11.
  • 12.
    nytprofhtml: Time perSub enter subroutine - leave subrountine Color coding relative to rest of file Annotates source code
  • 13.
    nytprofhtml: Time perLine start of one statement to the next (;) expensive CPU & IO, too much detail
  • 14.
    nytprofhtml: Time perBlock Compromise
  • 15.
    Kcachegrind Tool togenerate and analyze callgraphs (graphs relationships between subroutines) Valgrind Cachegrind Callgrind Kcachegrind Memory debugging & profiling CPU cache profiler Cachegrind with call graphs GUI for Cachegrind
  • 16.
    Devel::NYTProf & nytprofcgCurrently NYTProf v.2 NYTProf v.3: nytprofcg! http://code.google.com/p/perl-devel-nytprof/source/checkout Creates callgraph data that can be read by Kcachegrind
  • 17.
    Devel::NYTProf & nytprofcgCreate nytprof.out: $ perl -d:NYTProf phone.cgi Create nytprof.callgraph $ nytprofcg Load callgraph into Kcachegrind $ kcachegrind nytprof.callgraph
  • 18.
    Source Code &Callees Callees Source Code
  • 19.
    Callee Map &Call Graph Percentage of time in each function Call graph Tree View
  • 20.
    Devel::NYTProf::Apache Profile mod_perl!(Not supported on Windows) Add these guys to your apache conf file: PerlPassEnv NYTPROF PerlModule Devel::NYTProf::Apache nytprof.$$.out will end up in /tmp/ unless you specify otherwise by setting the NYTPROF environment variable file=
  • 21.
    Resources http://en.oreilly.com/oscon2009/public/schedule/detail/7941 http://blog.timbunce.org/2008/07/15/nytprof-v2-a-major-advance-in-perl-profilers/http://blog.timbunce.org/2009/08/07/nytprof-v3-a-sneak-peak/#more-301 http://code.google.com/p/perl-devel-nytprof/source/checkout CPAN!