Downloaded 23 times


![USEFUL TOOLS
XHProf Helper for Chrome
XHProf Helper for Firefox
Sets $_COOKIE['_profile'] to 1](https://image.slidesharecdn.com/profilingphp-141120191618-conversion-gate01/75/Profiling-PHP-AmsterdamPHP-Meetup-2014-11-20-41-2048.jpg)

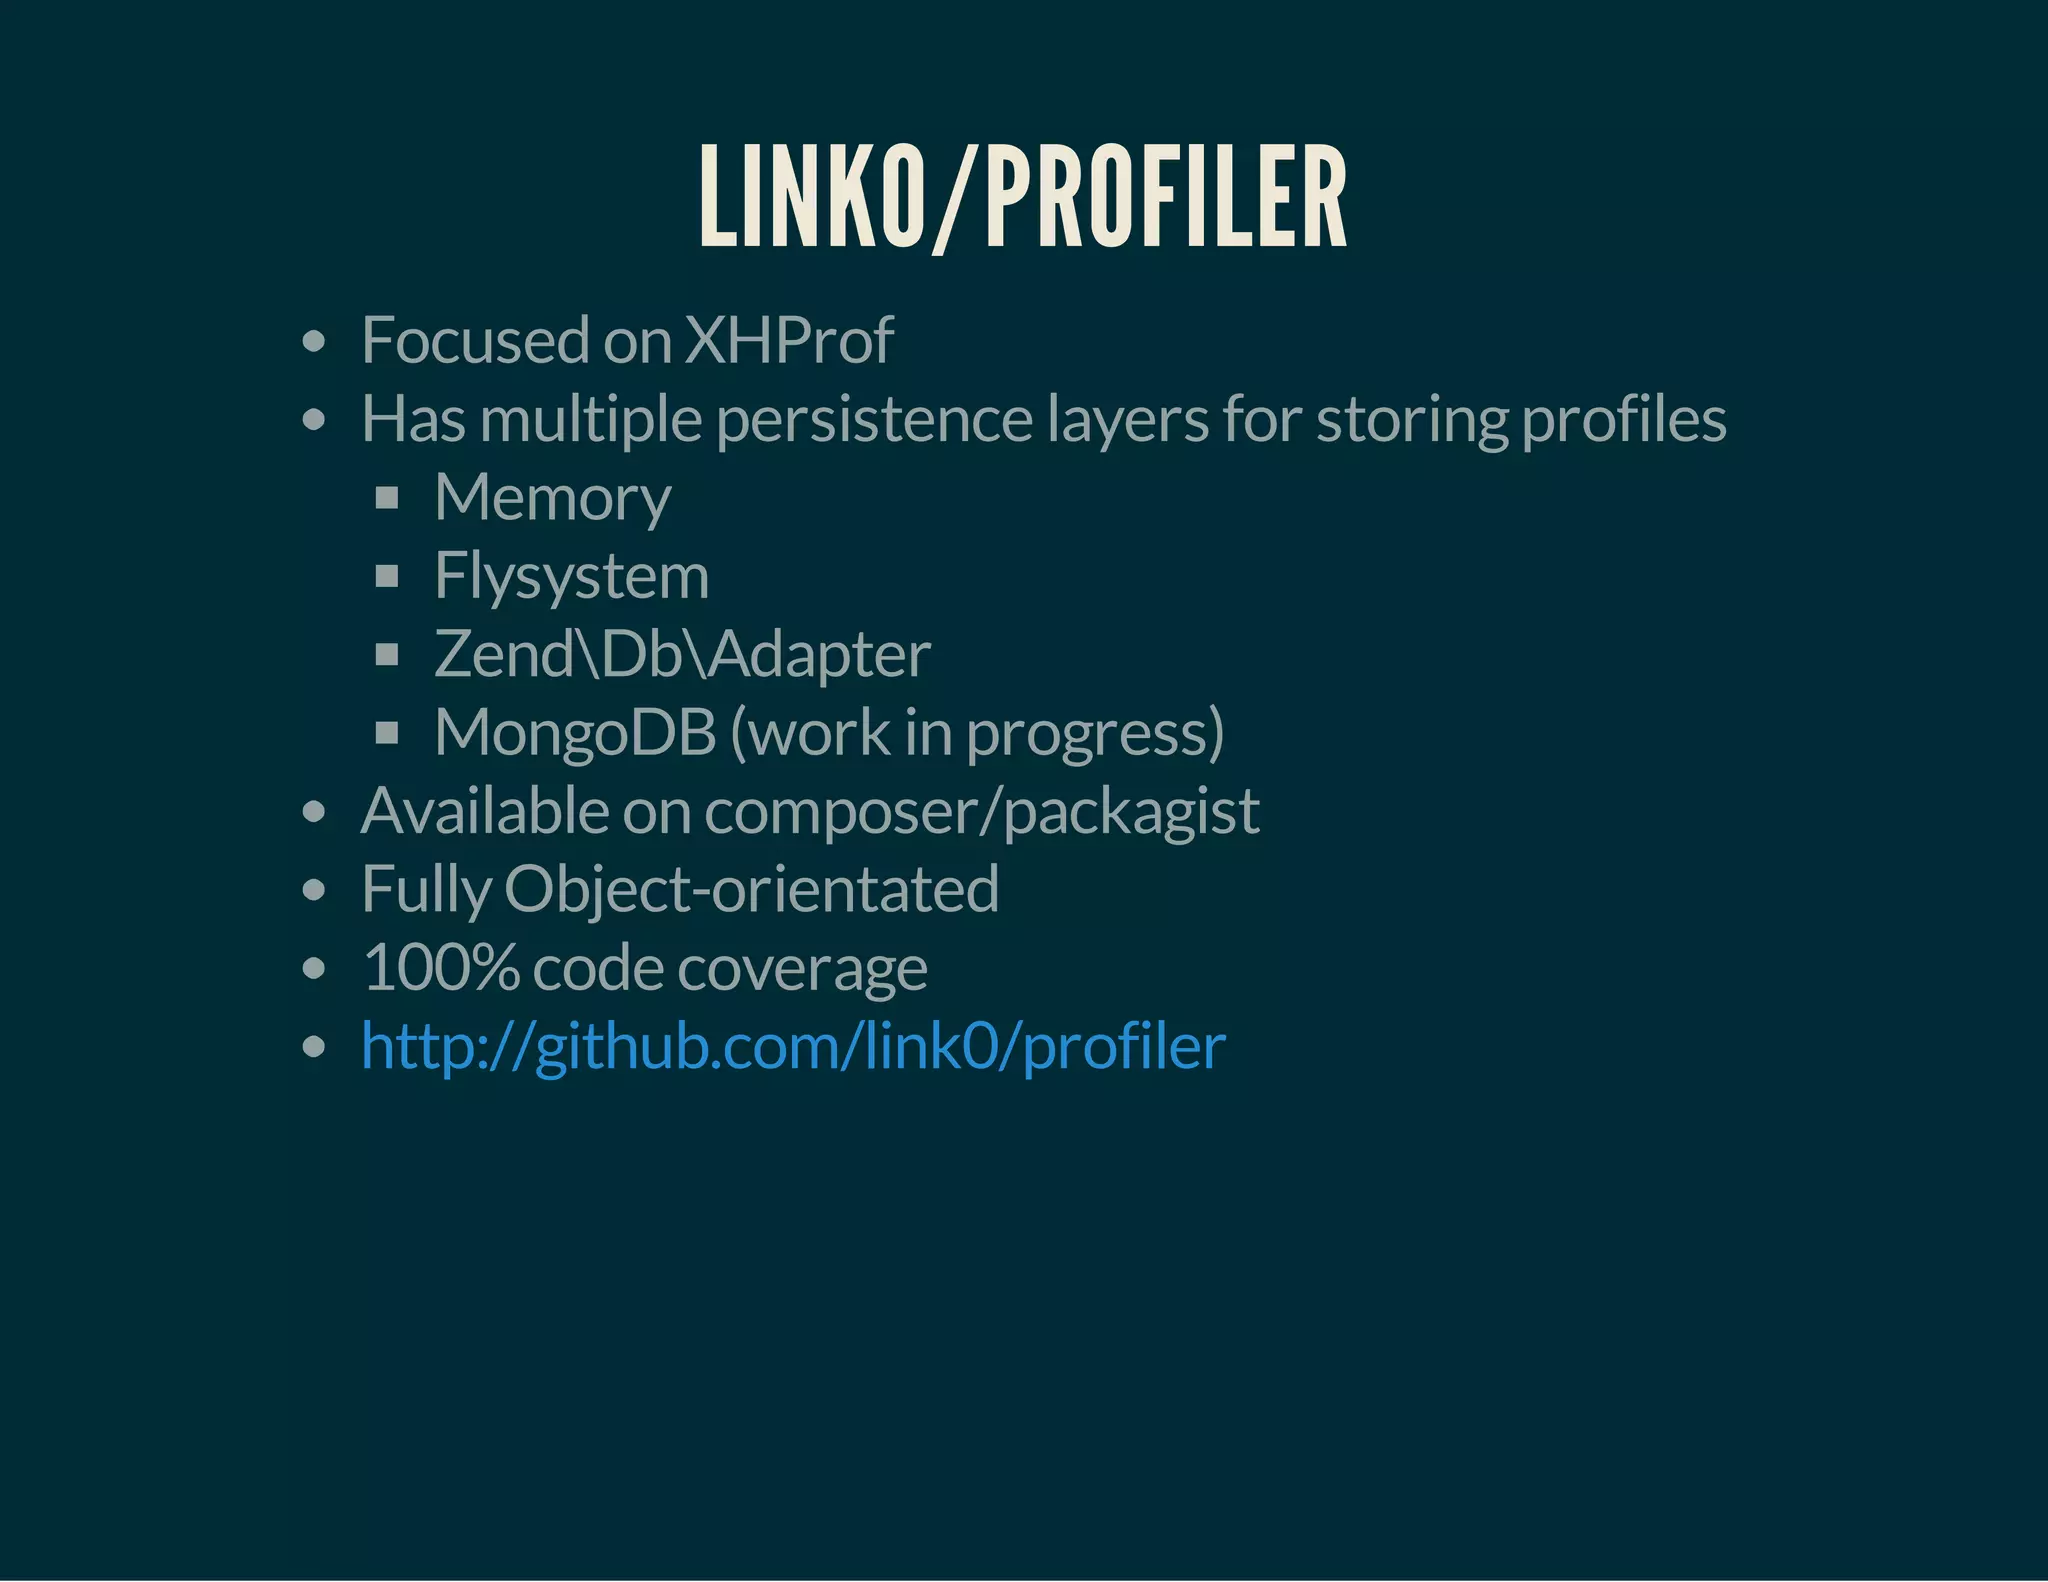


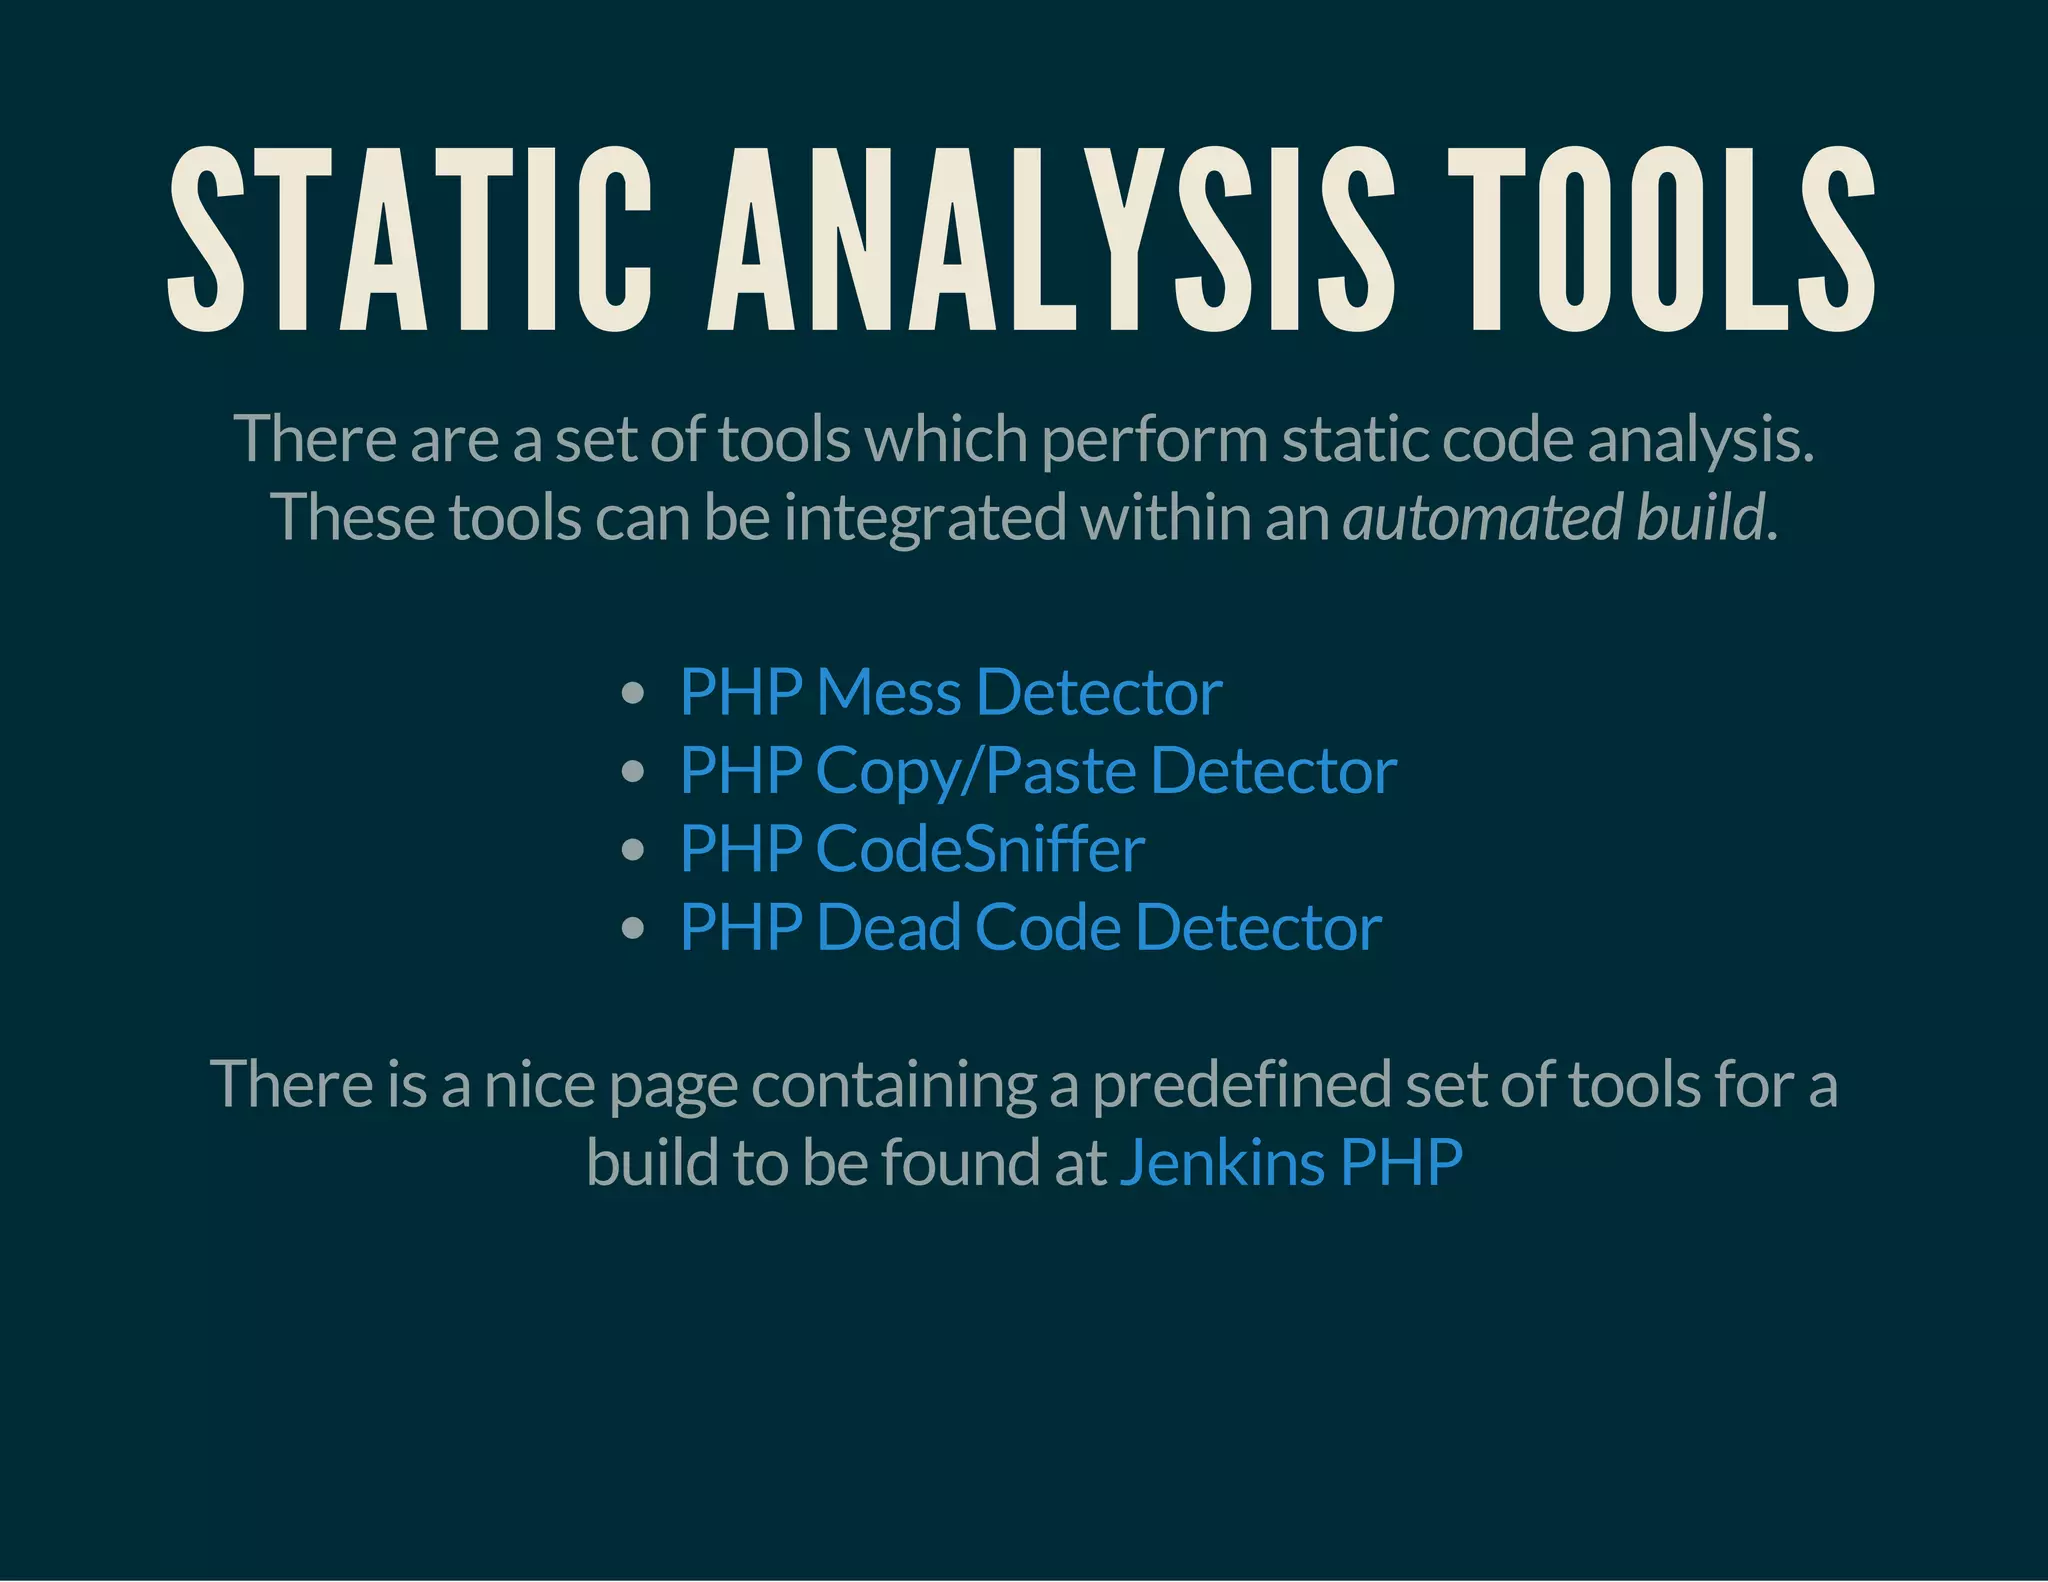
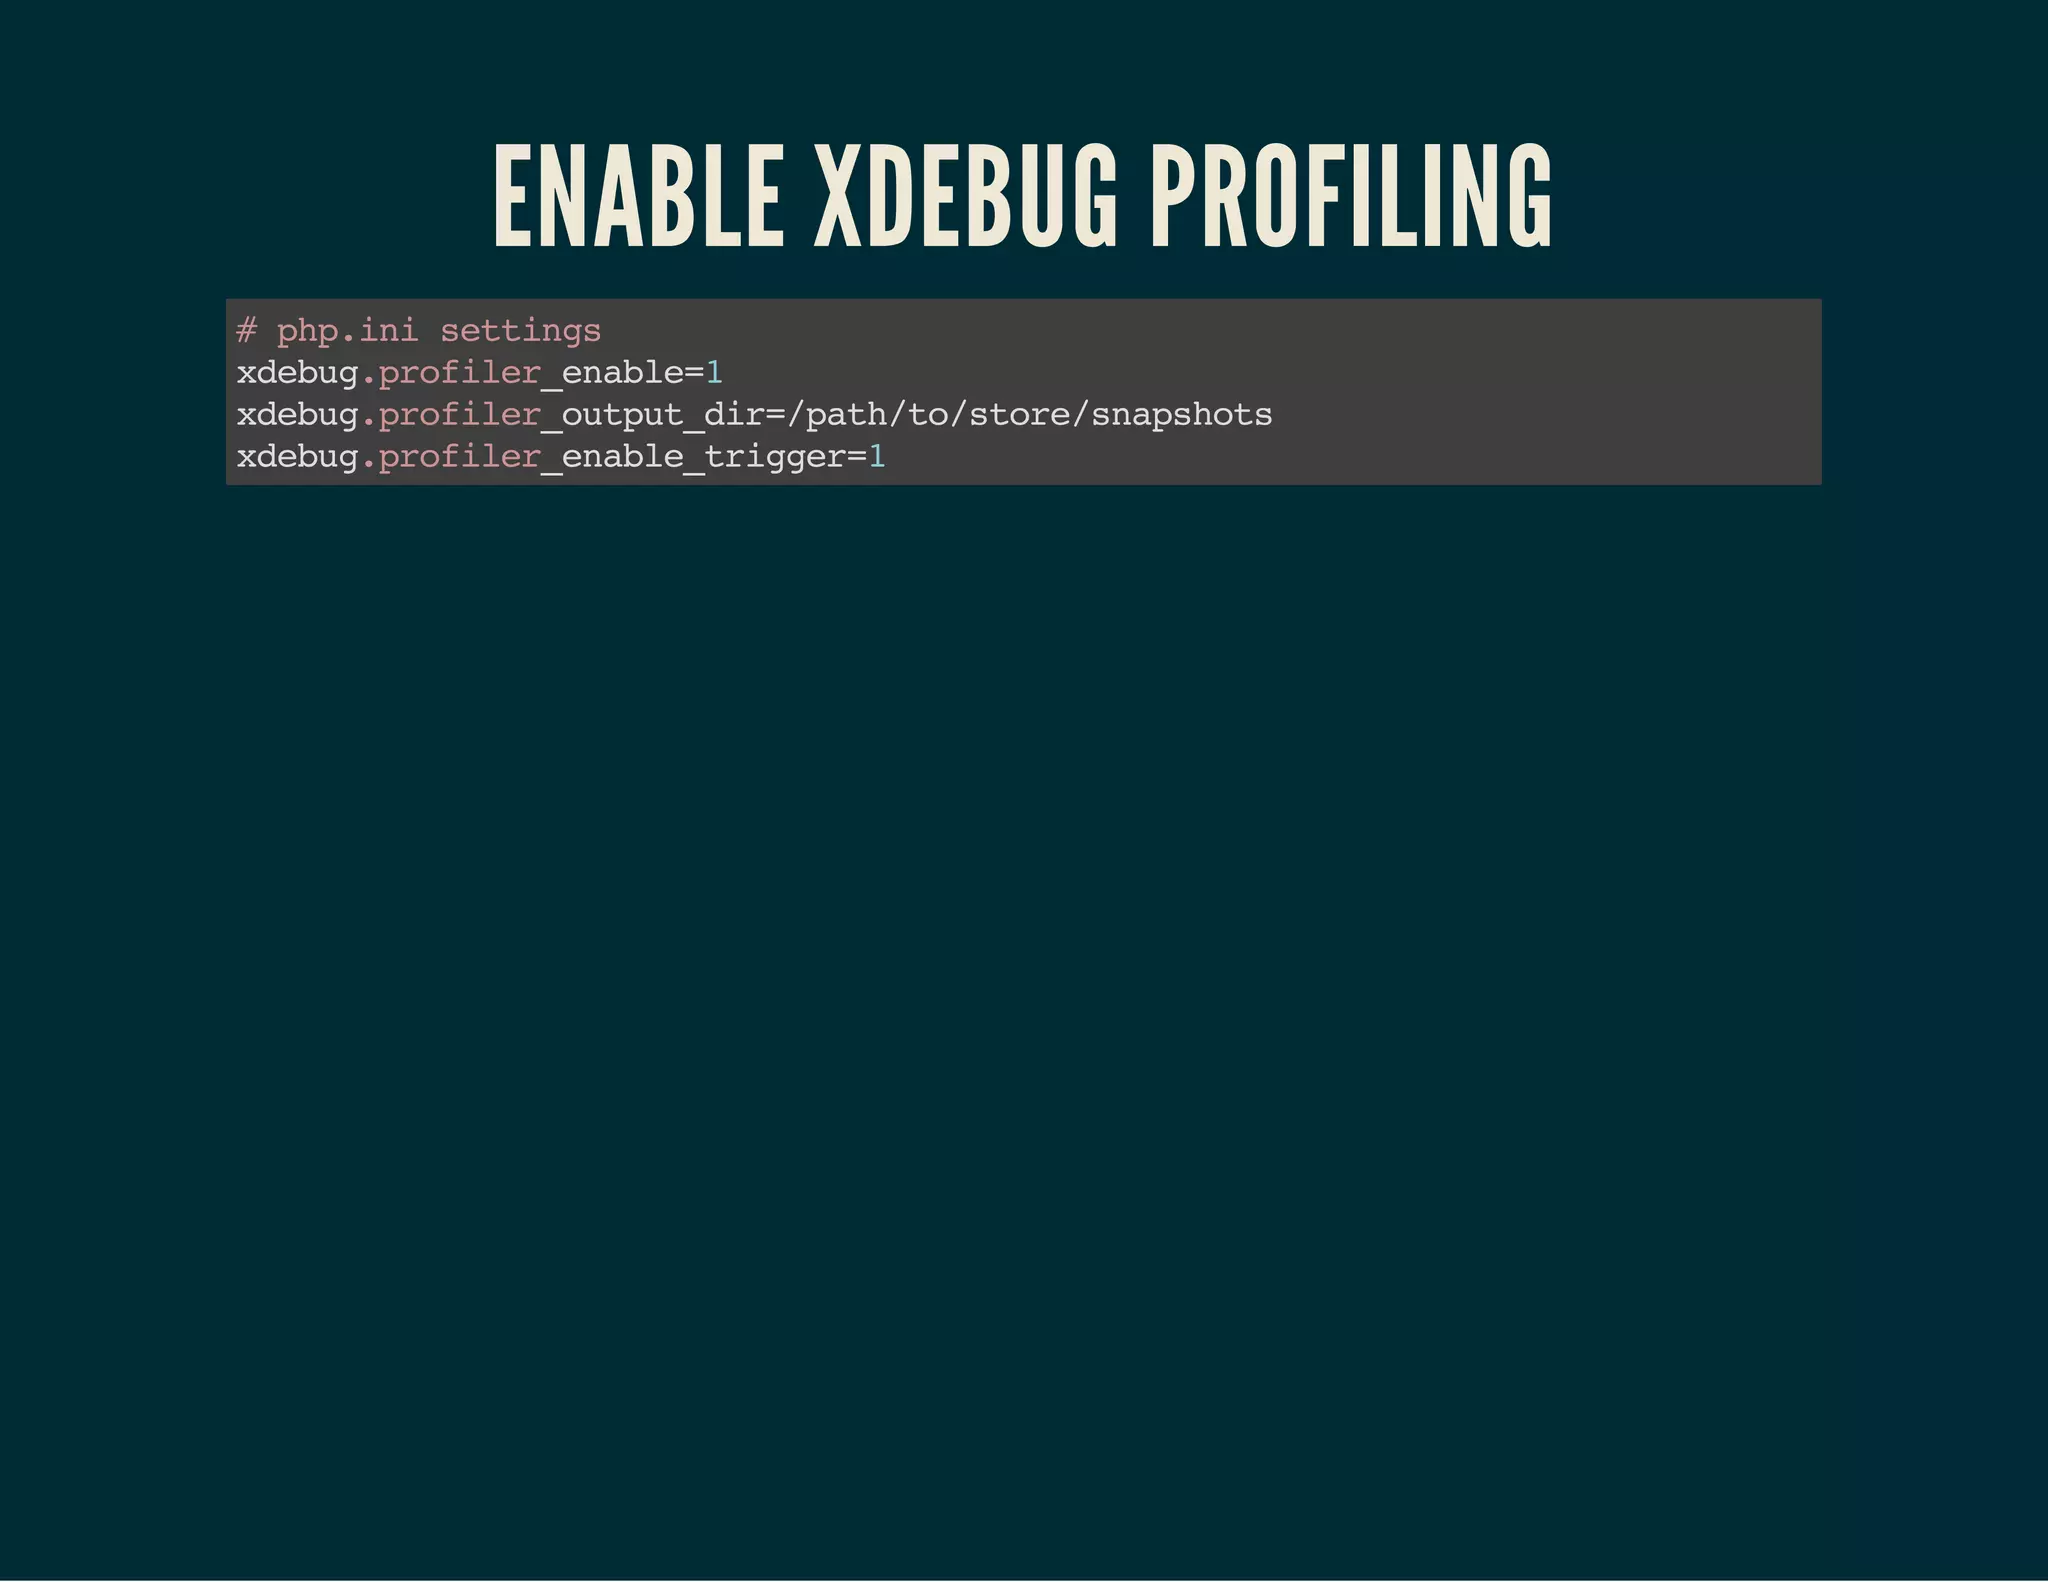
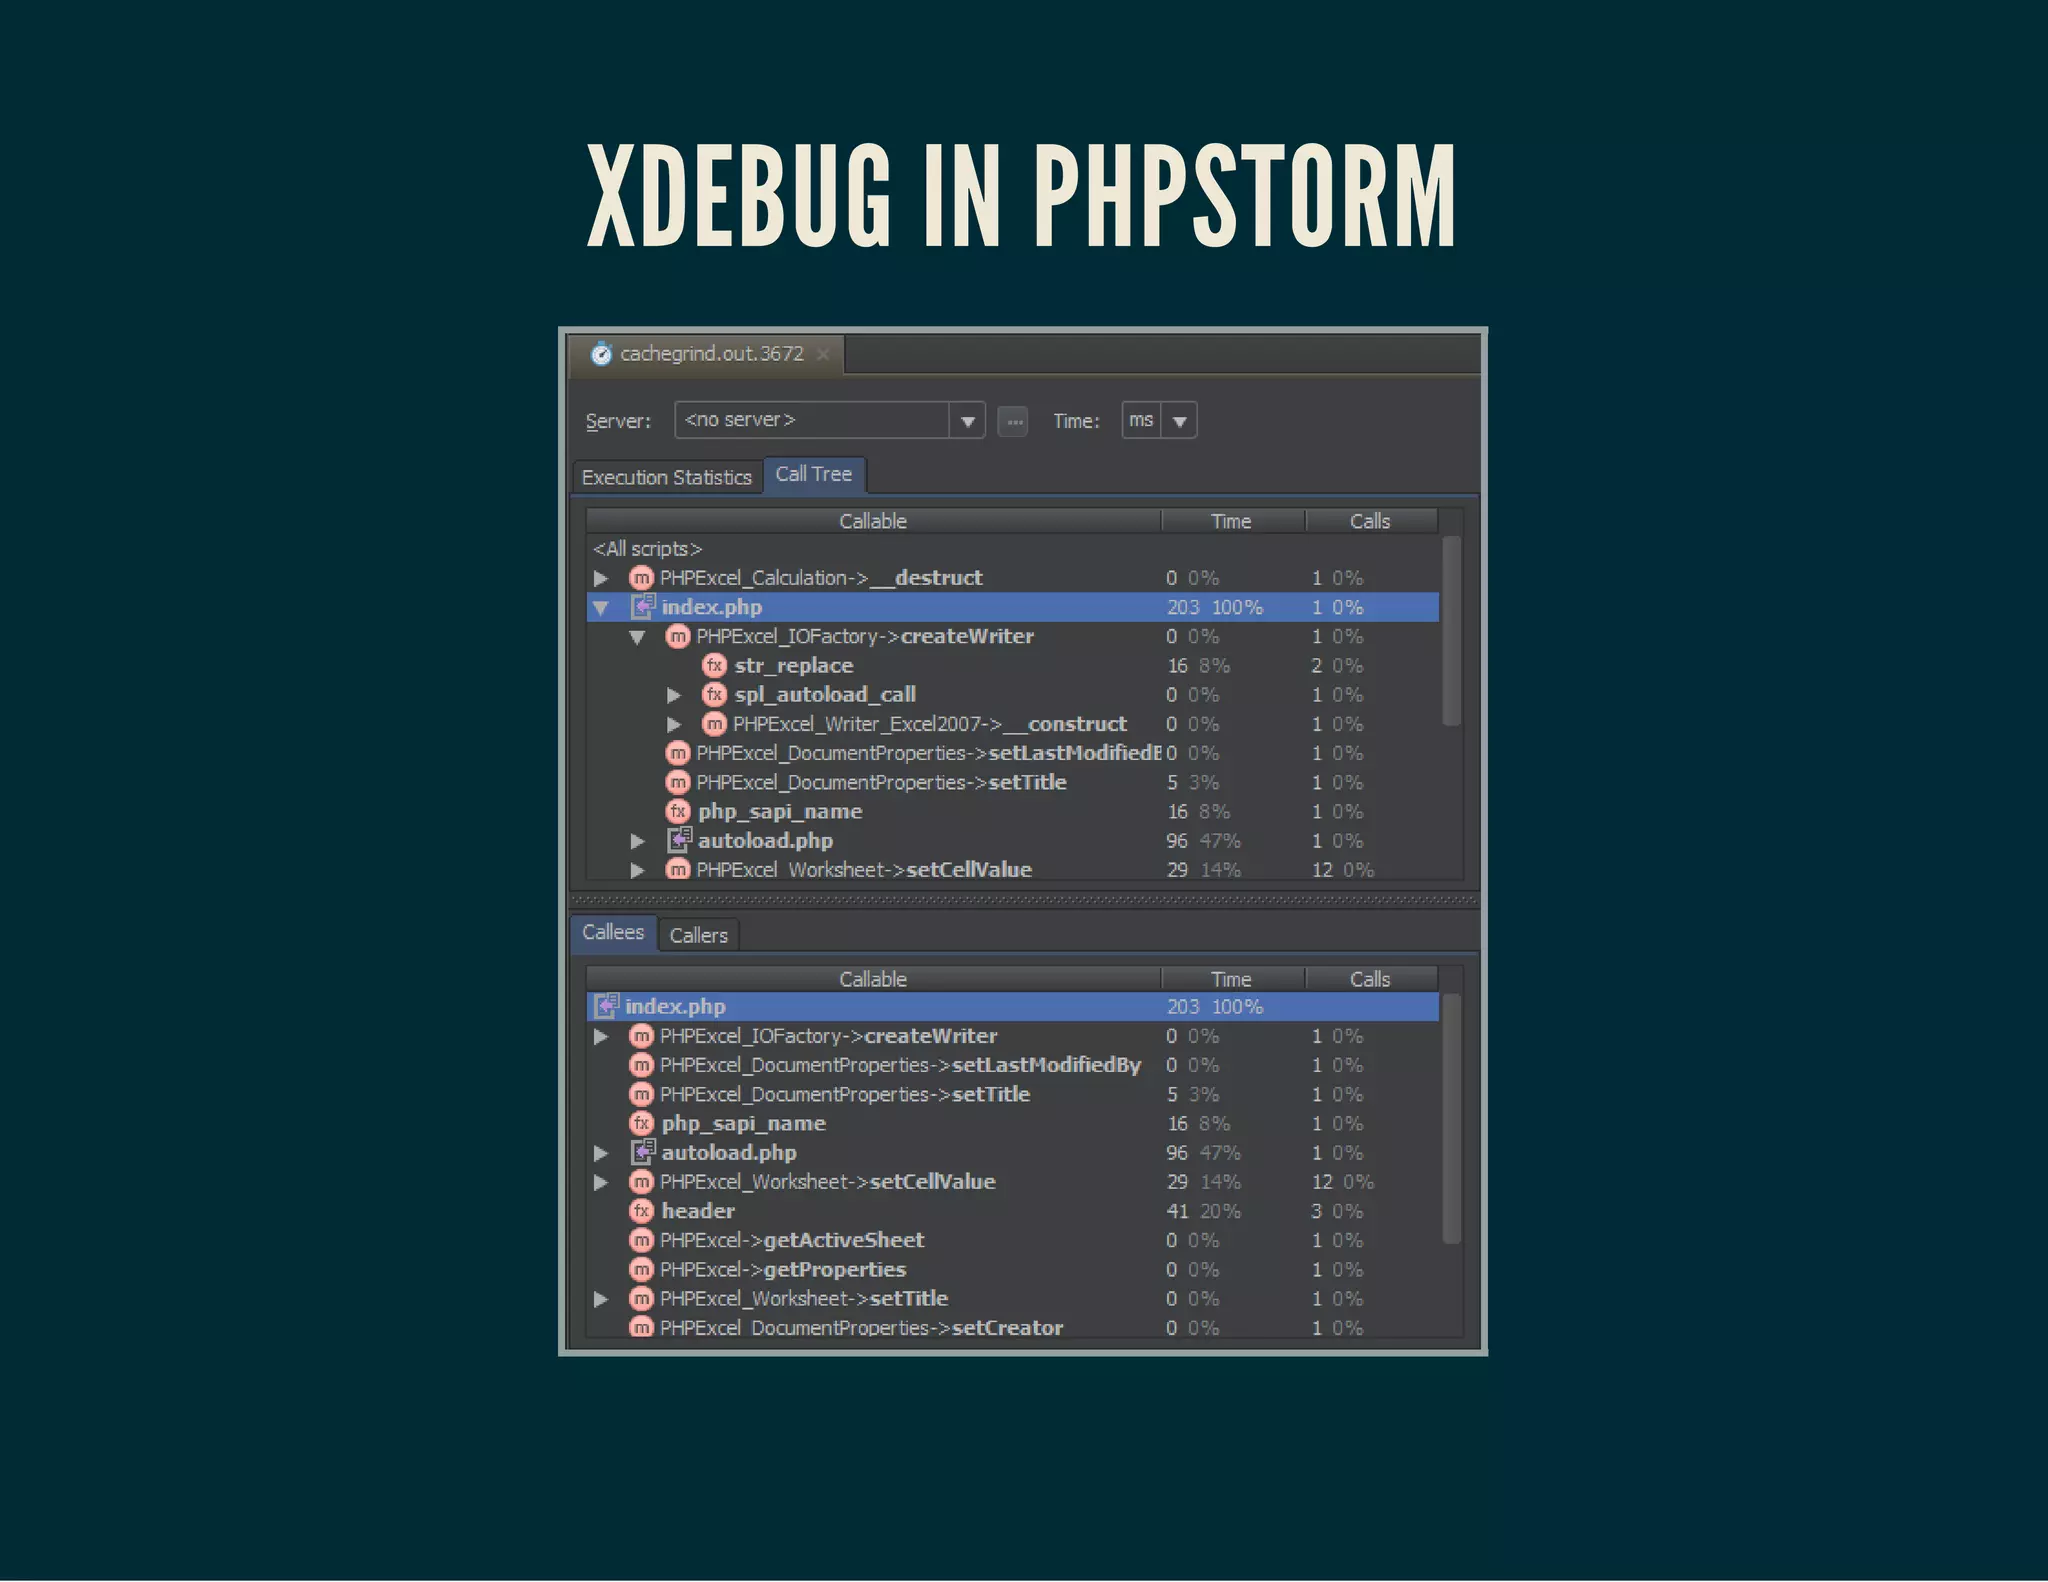
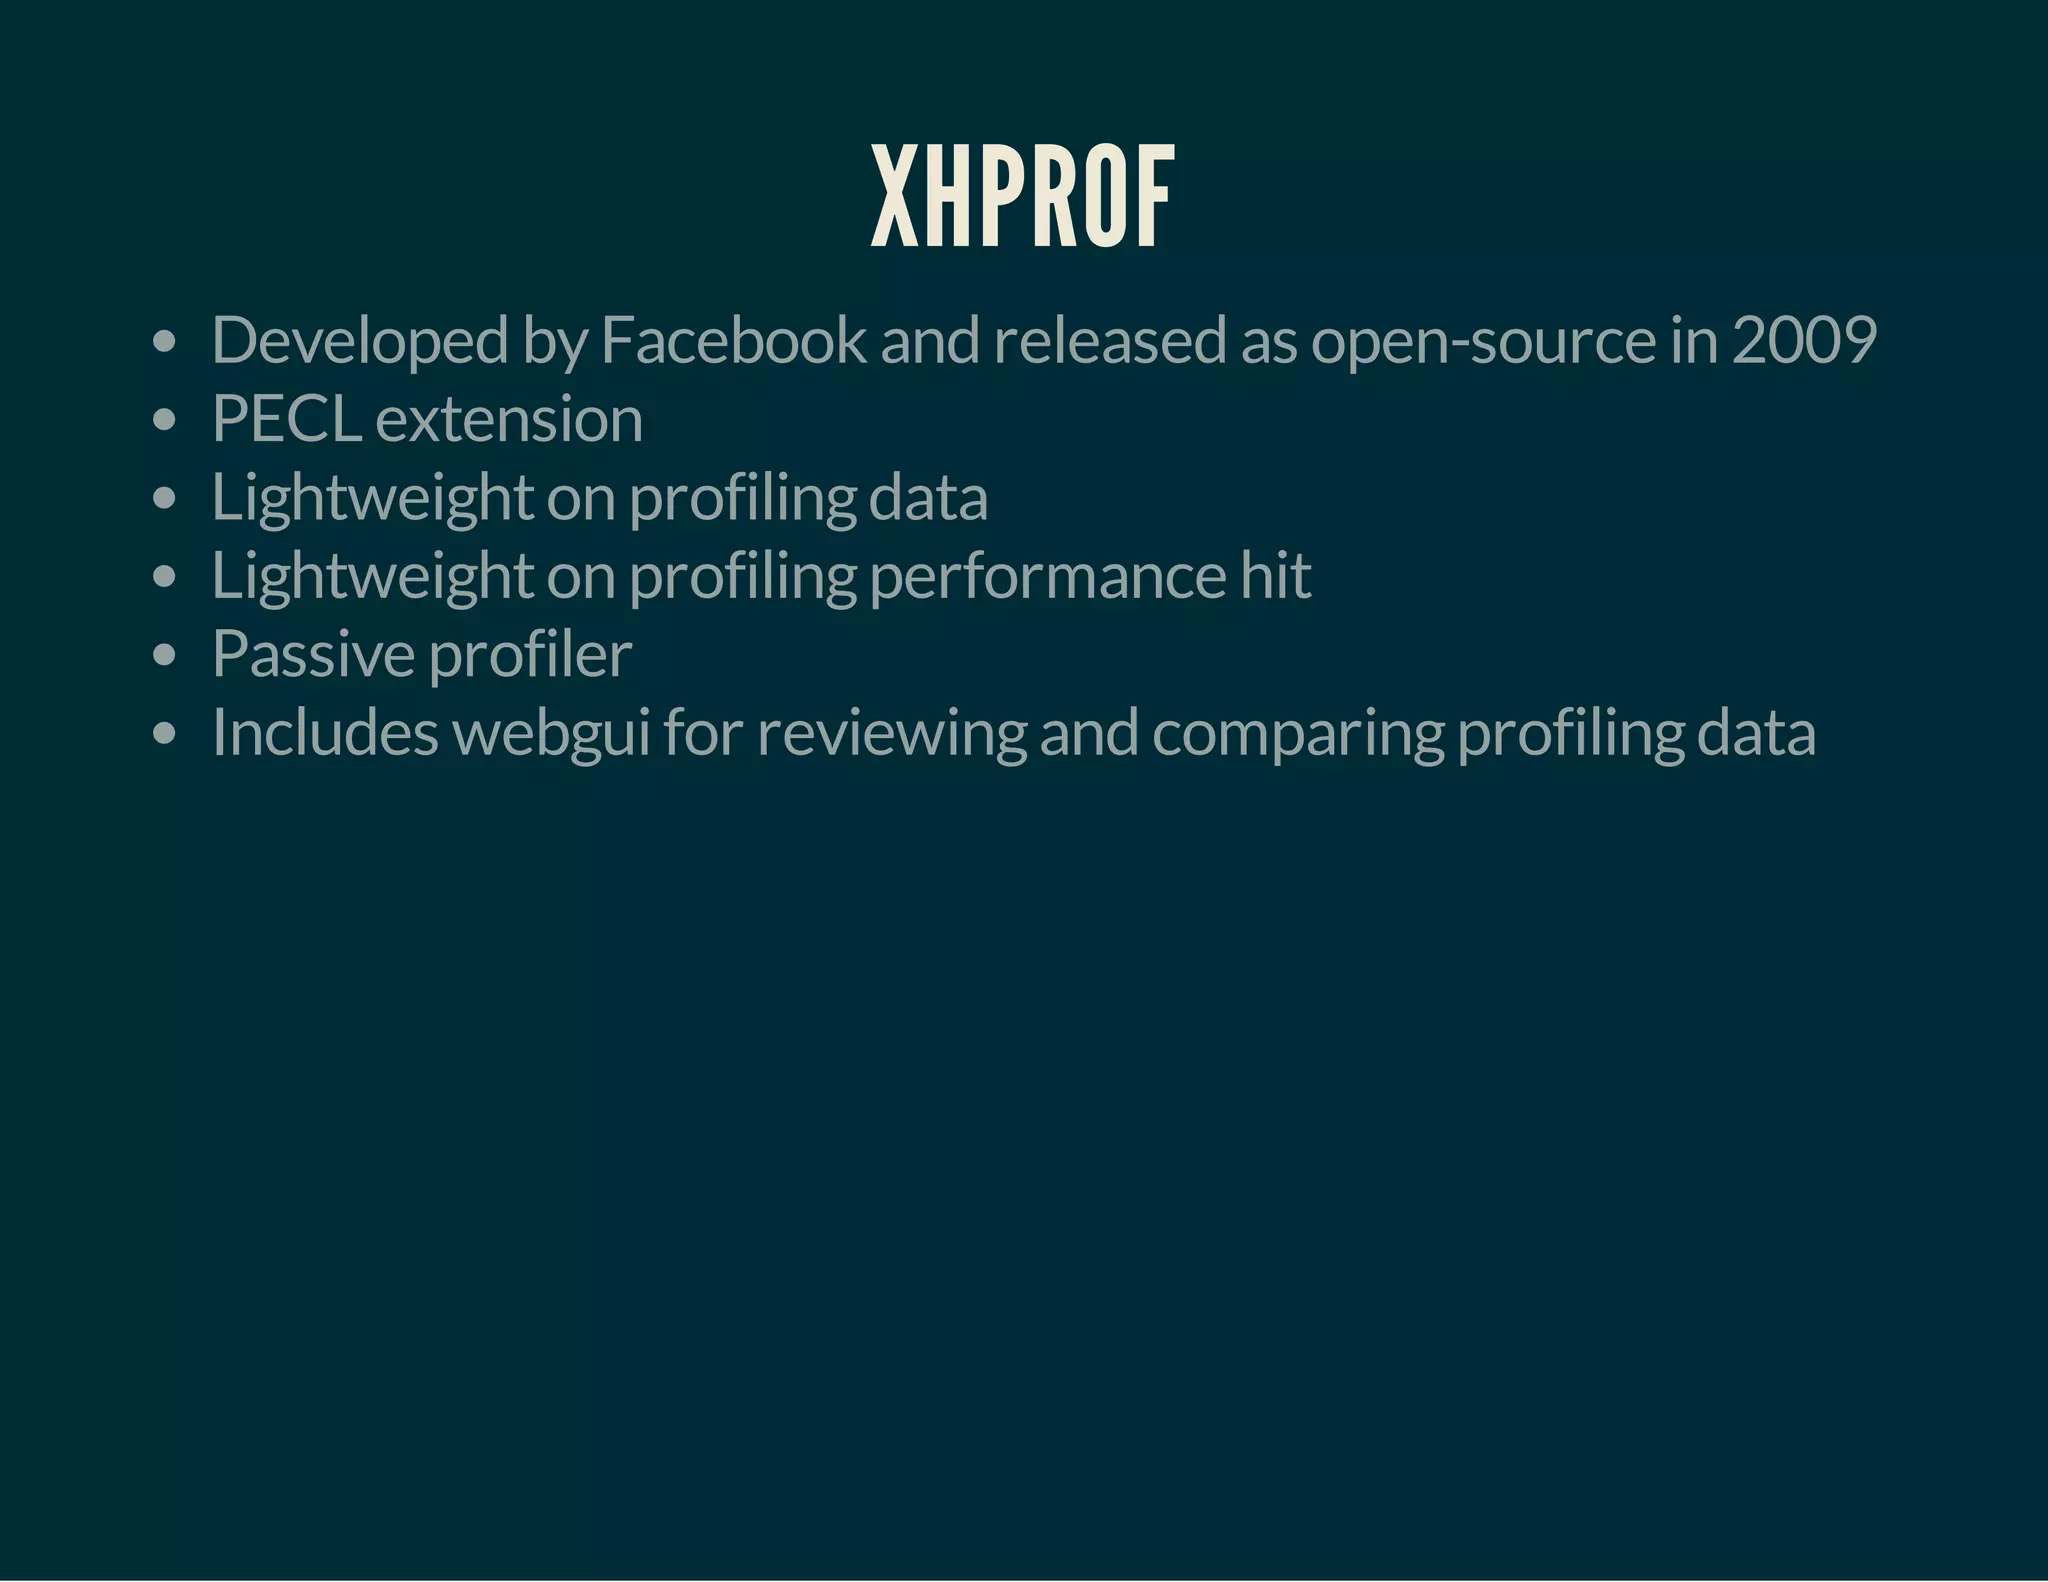
The document discusses profiling in PHP, defining it as dynamic program analysis that measures memory and time complexity, with a focus on optimizing applications. It contrasts dynamic analysis, which involves executing programs, with static analysis that reviews code structure without execution. It also highlights tools for profiling, such as Xdebug and Xhprof, and stresses the importance of profiling for improving application performance and user experience.


![[ CNCF Q1 2024 ] Intro to Continuous Profiling and Grafana Pyroscope.pdf](https://cdn.slidesharecdn.com/ss_thumbnails/cncfq12024introtocontinuousprofilingandgrafanapyroscope-240407162420-9c15afb7-thumbnail.jpg?width=640&height=640&fit=bounds)


