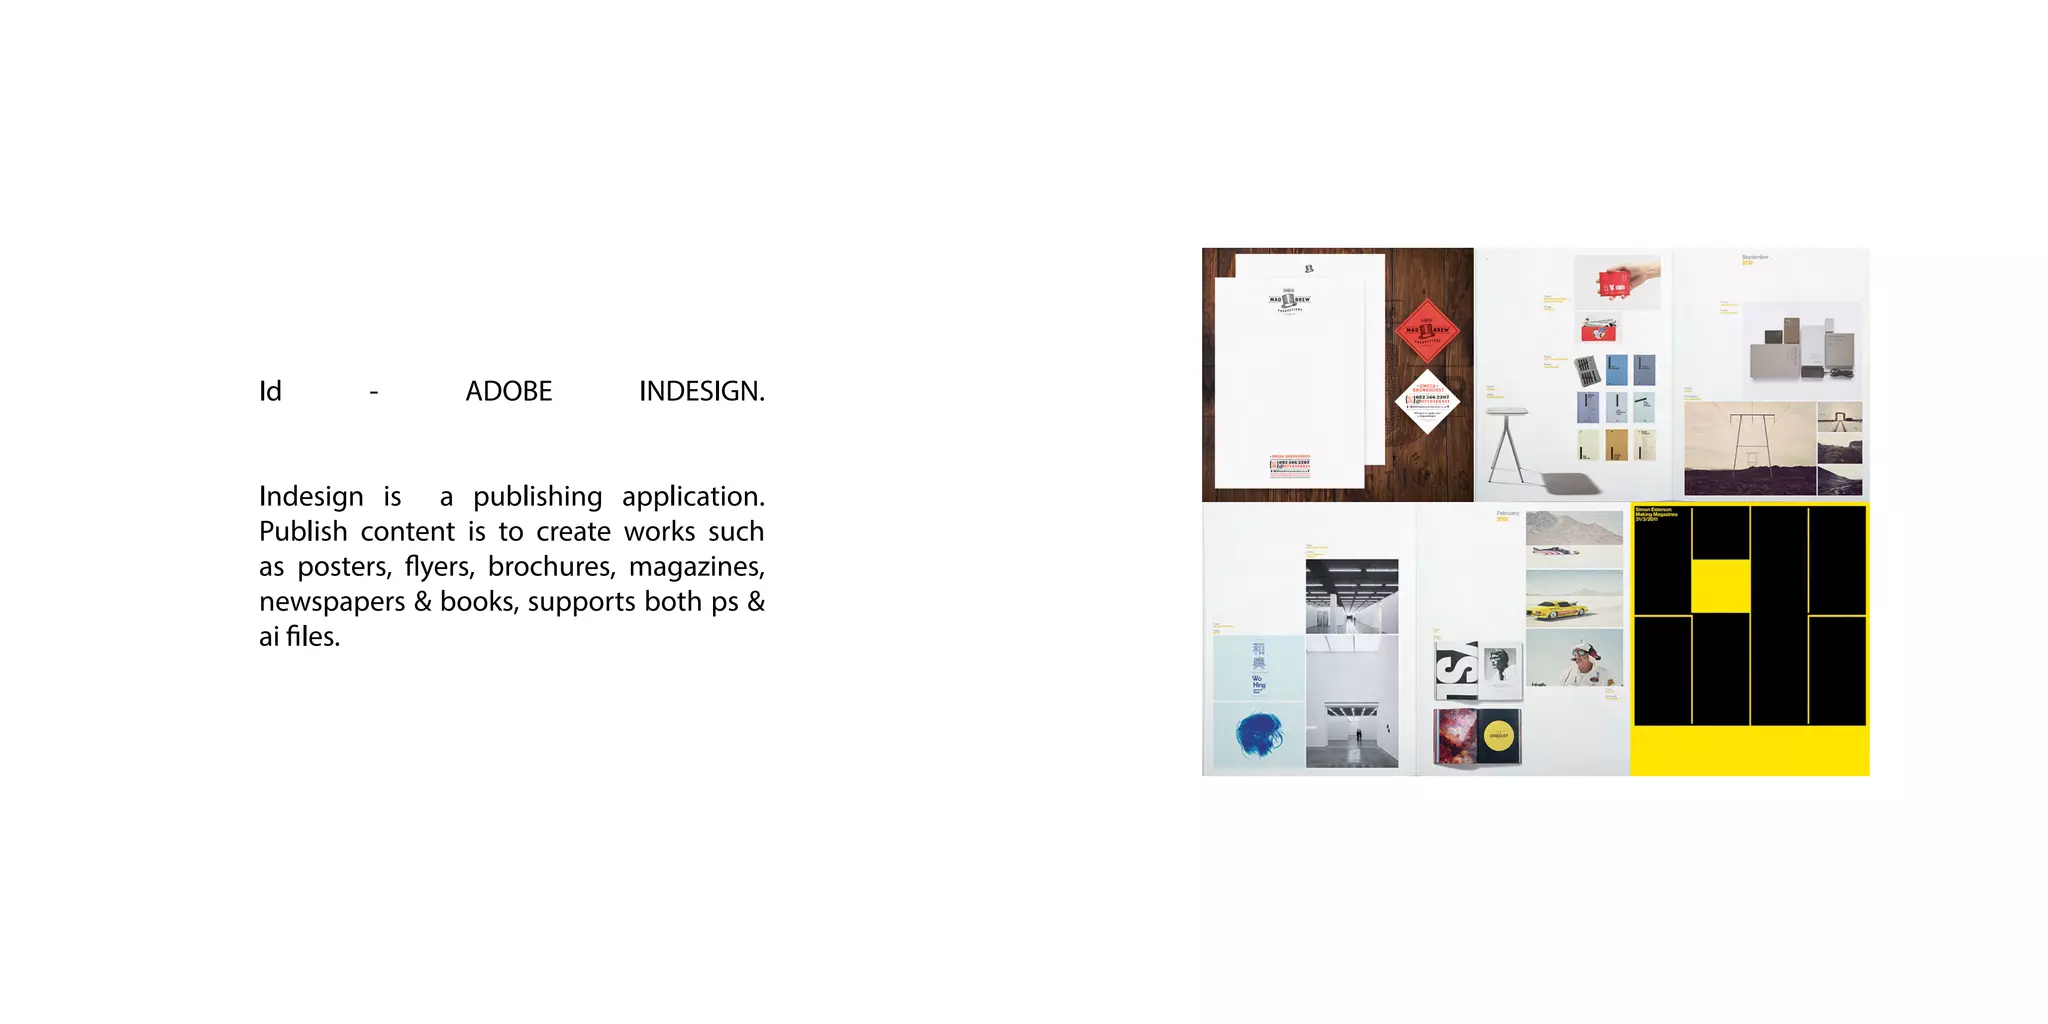
PRESENTATION
-
when ideas take form
Jules Spanou
-ANETA IVANOVA-
GERMANY
OPEN UP YOUR MIND TO OTHERS.
A presentation is a way to open up your
mind to others. It lets your ideas take form.
It is a tool of communication.
Thereisamessagethatyouwanttodeliver
and an imaginary that you want to create.
And they can be found everywhere.
-CHRISTOPHER NOLAN-
MEMENTO
-ROBBY LEONARDI-
INTERACTIVE RESUME
-ARCADE FIRE-
THE WILDERNESS DOWNTOWN
BUT, HOW CAN WE CREATE THEM?
We will look at some examples of
presentations being created for different
sectors and for different purposes.
The things that they have in common and
we should take into consideration while
creating presentations is the semantics
and the syntax of our work and the
practical part of designing them through
the programs and tools that we have.
Creativityneedsthesupportofknowledge
to be able to perform at its best.
“It is not the intention of this little book to
stifle creativity or to reduce it to a bunch
of rules. It is not the formula that prevents
good design from happening, but lack of
knowledgeofthecomplexityoftheDesign
profession. It’s up to the brain to use the
proper formula to achieve the desired
result.”
-MASSIMO VIGNELLI-
THE VIGNELLI CANON
-BRUNO MUNARI-
LA REGOLA E IL CASO
PRESENTATION
Semantics
“Semantics,indesign,meanstounderstand
the subject in all its aspects; to relate the
subject to the sender and the receiver in
such a way that it makes sense to both.
It means to design something that has a
meaning, that is not arbitrary, that has a
reasonforbeing,somethinginwhichevery
detail carries the meaning or has a precise
purpose aimed at a precise target.”
MASSIMO VIGNELLI
In the end you have to create a storytelling
throughout your presentation in order to
have a meaning and deliver your message.
Some elements that will help you to do
that is to have a structure, a flow and a
narration.
A BASIC PRESENTATION STRUCTURE.
There are a lot of different structures in
order to build your presentations, here is a
layout in a simple and efficient form.
-HOOK-
attention getter
-PAIN-
what is the issue, why is it important, who
does it affect
-SOLUTION-
what are you proposing
-CAUSE-
what causes the problem
-GAIN-
how are you going to solve the issue,
how do we know your solution works
-CALL TO ACTION-
motivation | promise
A SMOOTH PRESENTATION FLOW.
Have in mind that the point of view can
change a lot our perception of reality.
Diverge and converge keeping the
information that constitutes and creates
the reality that you want to communicate.
-A BIG IDEA-
focus on one message and spell it out
-MAIN POINTS-
what matters for the audience filter, sort
and order it
-SUPPORTING MATERIAL-
what is it crucial to keep (convergence &
quality)thatcancreateinterest(appropriate
data & substance)
-LINKS-
coherence between the big idea, the
main points and the supporting material
A MESSAGE NARRATION BREAKDOWN.
The brightness of any design solution will
depend on the meaning with which we
invest the arrangement.
YouhavetobuildthestoryontheBIGIDEA
that you have and all its sub-parts.
-MACROSTORY-
relates to the big idea
-MICROSTORIES-
relates to the sub-parts of the big idea
-TRANSITIONS-
the connections that helps the sequence
and the story twists
A POWER TO CHANGE THE WORLD!
By communicating in an effective manner
yourideasyougainthepowertoconvince,
you can be a change maker.
-NANCY DUARTE-
THAT'S RESONATES WITH ME
PRESENTATION
SYNTAX
“Syntax is the discipline that controls the
proper use of grammar in the construc-
tion of phrases and the articulation of a
language, Design. The syntax of design is
provided by many components in the na-
ture of the project. In graphic design, for
instance, they are the overall structure, the
grid, the typefaces, the text and headlines,
the illustrations, etc. The consistency of a
design is provided by the appropriate rela-
tionshipofthevarioussyntacticalelements
of the project: how type relates to grids
and images from page to page through-
out the whole project.” MASSIMO VIGNELLI
In the end you have to create a visual sto-
rytelling throughout your presentation in
order to create the appropriate imaginary
of the idea you want to present. Some el-
ements that will help you to do that are
the grid, the images, the typefaces, the
information design and the aesthetics.
THE GRID SYSTEM.
Grids are more than just the art of placing
elements;there’sasubtlelayerofsemantic
organization of data.
Once you learn how to make a grid, then
you will be able to break it.
-JOSEPH MULLER BROCKMAN-
GRID SYSTEMS IN GRAPHIC DESIGN
THE TYPEFACE YOU NEED.
Selecting and using a particular typeface
gives character to the visuals of your
presentation, suggest a style and
communicates your message.
GOOGLE FONTS | FONTFABRIC | DAFONT |
TYPOGRAPHYSERVED
-SWISS DOTS, VEER. -
HELVETICA THE DOCUMENTARY
THE PROPER IMAGES.
The images that you select for the
presentation can be either ta-ken by you
or can be found online.
All images have to be of a high resolution
(<250dpi), (without any watermarks) and
if they were found online they have to be
cited or at the end of your presentation or
at the page that you placed the image.
PINTEREST | FLICKR | AWWARDS | TUMBLR. |
KALLEGRAPHICS | FFFOUND | PHOTOGRAPHYSERVED
-PHILIPPE HALSMAN-
DALI WITH RHINOCEROS
THE INFORMATION DESIGN.
To deliver information you have to
comprehend what you are trying to
communicate and how it should be best
represented.
To do that you have to keep in mind the
information model, the information type
and the infographic layout.
VISUAL.LY | VISUALCOMPLEXITY | COLUMNFIVEMEDIA |
INFORMATIONISBEAUTIFUL | GOOD.IS/INFOGRAPHICS | PAUL
MIJKSENAAR | DENSITY DESIGN LAB
-LAMOSCA-
GLOBAL EMISSIONS
STATIC REPREASENTATION
-AARON KOBLIN-
FLIGHT PATTERNS
DYNAMIC REPRESENTATION, TEMPORAL ANIMATION
-KURZGESAGT-
HOW THE STOCK EXCHANGE WORKS
DYNAMIC REPRESENTATION
THE INFORMATION MODEL.
In order to design and represent data first
you have to understand the elements that
combines builds your visualisation.
Thereare3mainelementsyoushouldhave
in mind, the objects with their attributes
and the topics you want to communicate,
the space of representation defined
dimensionsandlimitsandtheconnections
andcorrelationsoftheobjectsinthatspace
or in between spaces.
-LONDON UNDERGROUND-
OBJECT, SPACE AND CONNECTIONS
-JAQUES BERTIN-
7 GRAPHIC VARIABLES
PLACE (POSITION), SHAPE, SIZE, VALUE (LIGHT, SIZE, TEXTURE (WITHIN THE
SHAPE), HUE, ORIENTATION (SHAPE) /DIRECTION (LINE)
-GUY DEBORD-
MAPPING PARIS
-YANG LIU-
EAST MEETS WEST
WHICH INFORMATION TYPE?
Spatial
Information that describes of relative
positions and the spatial relationships in a
physical or conceptual location.
Chronological
Information that describes sequential
positions and the casual relationships in a
physical or conceptual timeline.
Quantitative
Informationthatdescribesscale,proportion,
change, and organization of quantities in
space, time or both.
-COLUMN FIVE-
HOW TO GENERATE GOOD IDEAS
WHICH INFORMATION LAYOUT?
Charts:
Flow, Bar, Pie, Organization
Diagrams:
Process, Timeline, Exposition, Locator,
Data, Schematic
- POP CHART LABS-
66 CHEESES AROUND THE WORLD
RAW | D3.JS | PIKTOCHAR | EASEL.LY | INFOGR.AM | GOOG-
LE DEVELOPERS | INFOACTIVE | VENNGAGE | CREATELY
THE VECTOR ICONS.
To create infographics there exist websites
that provide you with vector material that
you can modify if you like.
Becarefulalwayswiththelicencethatthey
provide (creative commons). It is always
nice to cite in the end of the presentation
from where you acquired your items or
who designed them.
ICONFACTORY | ICONFINDER | THE NOUN PROJECT |
ICONMONSTER | ICONBEAST
THE PRESENTATION AESTHETICS.
Youhavetostartbuildinguptheaesthetics
of your presentations.
Thebestwaytodothatistostartfollowing
magazines and graphic designers in order
to start copycating at the beginning their
style and afterwards start building your
own.
-EDDIE OPARA-
PLATFORM
ID | LITTLE WHITE LIES | EYE | COLORS | ELEPHANT |
IDN | CREATIVE REVIEW | ETAPES | COMPUTER ARTS
PAULA SCHER | MASSIMO VIGNELLI |ALAN
FLETCHER | STEFAN SAGMEISTER & JESSI-
CA WALSH | MILTON GLASER | PAUL RAND | IRMA
BOOM | DAVID CARSON | JACQUELINE CASEY
PRESENTATION
PROGRAMS
Ps - ADOBE PHOTOSHOP.
Photoshop is as its name inquires a photo
editing program based on pixels.
pixel= short for Picture Element, which is
the smallest single component of a digital
image.
Il - ADOBE ILLUSTRATOR.
Illustrator is a graphic editing program
based on vectors. Vector graphic is based
on images made up of paths which lead
through locations called control points
(series of mathematical curves).
Id - ADOBE INDESIGN.
Indesign is a publishing application.
Publish content is to create works such
as posters, flyers, brochures, magazines,
newspapers & books, supports both ps &
ai files.
Presentation when ideas take form

Presentation when ideas take form

  • 1.
  • 2.
    -ANETA IVANOVA- GERMANY OPEN UPYOUR MIND TO OTHERS. A presentation is a way to open up your mind to others. It lets your ideas take form. It is a tool of communication. Thereisamessagethatyouwanttodeliver and an imaginary that you want to create. And they can be found everywhere.
  • 3.
    -CHRISTOPHER NOLAN- MEMENTO -ROBBY LEONARDI- INTERACTIVERESUME -ARCADE FIRE- THE WILDERNESS DOWNTOWN BUT, HOW CAN WE CREATE THEM? We will look at some examples of presentations being created for different sectors and for different purposes. The things that they have in common and we should take into consideration while creating presentations is the semantics and the syntax of our work and the practical part of designing them through the programs and tools that we have.
  • 4.
    Creativityneedsthesupportofknowledge to be ableto perform at its best. “It is not the intention of this little book to stifle creativity or to reduce it to a bunch of rules. It is not the formula that prevents good design from happening, but lack of knowledgeofthecomplexityoftheDesign profession. It’s up to the brain to use the proper formula to achieve the desired result.” -MASSIMO VIGNELLI- THE VIGNELLI CANON -BRUNO MUNARI- LA REGOLA E IL CASO
  • 5.
    PRESENTATION Semantics “Semantics,indesign,meanstounderstand the subject inall its aspects; to relate the subject to the sender and the receiver in such a way that it makes sense to both. It means to design something that has a meaning, that is not arbitrary, that has a reasonforbeing,somethinginwhichevery detail carries the meaning or has a precise purpose aimed at a precise target.” MASSIMO VIGNELLI In the end you have to create a storytelling throughout your presentation in order to have a meaning and deliver your message. Some elements that will help you to do that is to have a structure, a flow and a narration.
  • 6.
    A BASIC PRESENTATIONSTRUCTURE. There are a lot of different structures in order to build your presentations, here is a layout in a simple and efficient form. -HOOK- attention getter -PAIN- what is the issue, why is it important, who does it affect -SOLUTION- what are you proposing -CAUSE- what causes the problem -GAIN- how are you going to solve the issue, how do we know your solution works -CALL TO ACTION- motivation | promise
  • 7.
    A SMOOTH PRESENTATIONFLOW. Have in mind that the point of view can change a lot our perception of reality. Diverge and converge keeping the information that constitutes and creates the reality that you want to communicate. -A BIG IDEA- focus on one message and spell it out -MAIN POINTS- what matters for the audience filter, sort and order it -SUPPORTING MATERIAL- what is it crucial to keep (convergence & quality)thatcancreateinterest(appropriate data & substance) -LINKS- coherence between the big idea, the main points and the supporting material
  • 8.
    A MESSAGE NARRATIONBREAKDOWN. The brightness of any design solution will depend on the meaning with which we invest the arrangement. YouhavetobuildthestoryontheBIGIDEA that you have and all its sub-parts. -MACROSTORY- relates to the big idea -MICROSTORIES- relates to the sub-parts of the big idea -TRANSITIONS- the connections that helps the sequence and the story twists
  • 9.
    A POWER TOCHANGE THE WORLD! By communicating in an effective manner yourideasyougainthepowertoconvince, you can be a change maker. -NANCY DUARTE- THAT'S RESONATES WITH ME
  • 10.
    PRESENTATION SYNTAX “Syntax is thediscipline that controls the proper use of grammar in the construc- tion of phrases and the articulation of a language, Design. The syntax of design is provided by many components in the na- ture of the project. In graphic design, for instance, they are the overall structure, the grid, the typefaces, the text and headlines, the illustrations, etc. The consistency of a design is provided by the appropriate rela- tionshipofthevarioussyntacticalelements of the project: how type relates to grids and images from page to page through- out the whole project.” MASSIMO VIGNELLI In the end you have to create a visual sto- rytelling throughout your presentation in order to create the appropriate imaginary of the idea you want to present. Some el- ements that will help you to do that are the grid, the images, the typefaces, the information design and the aesthetics.
  • 11.
    THE GRID SYSTEM. Gridsare more than just the art of placing elements;there’sasubtlelayerofsemantic organization of data. Once you learn how to make a grid, then you will be able to break it. -JOSEPH MULLER BROCKMAN- GRID SYSTEMS IN GRAPHIC DESIGN
  • 12.
    THE TYPEFACE YOUNEED. Selecting and using a particular typeface gives character to the visuals of your presentation, suggest a style and communicates your message. GOOGLE FONTS | FONTFABRIC | DAFONT | TYPOGRAPHYSERVED -SWISS DOTS, VEER. - HELVETICA THE DOCUMENTARY
  • 13.
    THE PROPER IMAGES. Theimages that you select for the presentation can be either ta-ken by you or can be found online. All images have to be of a high resolution (<250dpi), (without any watermarks) and if they were found online they have to be cited or at the end of your presentation or at the page that you placed the image. PINTEREST | FLICKR | AWWARDS | TUMBLR. | KALLEGRAPHICS | FFFOUND | PHOTOGRAPHYSERVED -PHILIPPE HALSMAN- DALI WITH RHINOCEROS
  • 14.
    THE INFORMATION DESIGN. Todeliver information you have to comprehend what you are trying to communicate and how it should be best represented. To do that you have to keep in mind the information model, the information type and the infographic layout. VISUAL.LY | VISUALCOMPLEXITY | COLUMNFIVEMEDIA | INFORMATIONISBEAUTIFUL | GOOD.IS/INFOGRAPHICS | PAUL MIJKSENAAR | DENSITY DESIGN LAB -LAMOSCA- GLOBAL EMISSIONS STATIC REPREASENTATION
  • 15.
    -AARON KOBLIN- FLIGHT PATTERNS DYNAMICREPRESENTATION, TEMPORAL ANIMATION -KURZGESAGT- HOW THE STOCK EXCHANGE WORKS DYNAMIC REPRESENTATION
  • 16.
    THE INFORMATION MODEL. Inorder to design and represent data first you have to understand the elements that combines builds your visualisation. Thereare3mainelementsyoushouldhave in mind, the objects with their attributes and the topics you want to communicate, the space of representation defined dimensionsandlimitsandtheconnections andcorrelationsoftheobjectsinthatspace or in between spaces. -LONDON UNDERGROUND- OBJECT, SPACE AND CONNECTIONS
  • 17.
    -JAQUES BERTIN- 7 GRAPHICVARIABLES PLACE (POSITION), SHAPE, SIZE, VALUE (LIGHT, SIZE, TEXTURE (WITHIN THE SHAPE), HUE, ORIENTATION (SHAPE) /DIRECTION (LINE) -GUY DEBORD- MAPPING PARIS -YANG LIU- EAST MEETS WEST
  • 18.
    WHICH INFORMATION TYPE? Spatial Informationthat describes of relative positions and the spatial relationships in a physical or conceptual location. Chronological Information that describes sequential positions and the casual relationships in a physical or conceptual timeline. Quantitative Informationthatdescribesscale,proportion, change, and organization of quantities in space, time or both. -COLUMN FIVE- HOW TO GENERATE GOOD IDEAS
  • 19.
    WHICH INFORMATION LAYOUT? Charts: Flow,Bar, Pie, Organization Diagrams: Process, Timeline, Exposition, Locator, Data, Schematic - POP CHART LABS- 66 CHEESES AROUND THE WORLD RAW | D3.JS | PIKTOCHAR | EASEL.LY | INFOGR.AM | GOOG- LE DEVELOPERS | INFOACTIVE | VENNGAGE | CREATELY
  • 20.
    THE VECTOR ICONS. Tocreate infographics there exist websites that provide you with vector material that you can modify if you like. Becarefulalwayswiththelicencethatthey provide (creative commons). It is always nice to cite in the end of the presentation from where you acquired your items or who designed them. ICONFACTORY | ICONFINDER | THE NOUN PROJECT | ICONMONSTER | ICONBEAST
  • 21.
    THE PRESENTATION AESTHETICS. Youhavetostartbuildinguptheaesthetics ofyour presentations. Thebestwaytodothatistostartfollowing magazines and graphic designers in order to start copycating at the beginning their style and afterwards start building your own. -EDDIE OPARA- PLATFORM
  • 22.
    ID | LITTLEWHITE LIES | EYE | COLORS | ELEPHANT | IDN | CREATIVE REVIEW | ETAPES | COMPUTER ARTS PAULA SCHER | MASSIMO VIGNELLI |ALAN FLETCHER | STEFAN SAGMEISTER & JESSI- CA WALSH | MILTON GLASER | PAUL RAND | IRMA BOOM | DAVID CARSON | JACQUELINE CASEY
  • 23.
  • 24.
    Ps - ADOBEPHOTOSHOP. Photoshop is as its name inquires a photo editing program based on pixels. pixel= short for Picture Element, which is the smallest single component of a digital image.
  • 25.
    Il - ADOBEILLUSTRATOR. Illustrator is a graphic editing program based on vectors. Vector graphic is based on images made up of paths which lead through locations called control points (series of mathematical curves).
  • 26.
    Id - ADOBEINDESIGN. Indesign is a publishing application. Publish content is to create works such as posters, flyers, brochures, magazines, newspapers & books, supports both ps & ai files.