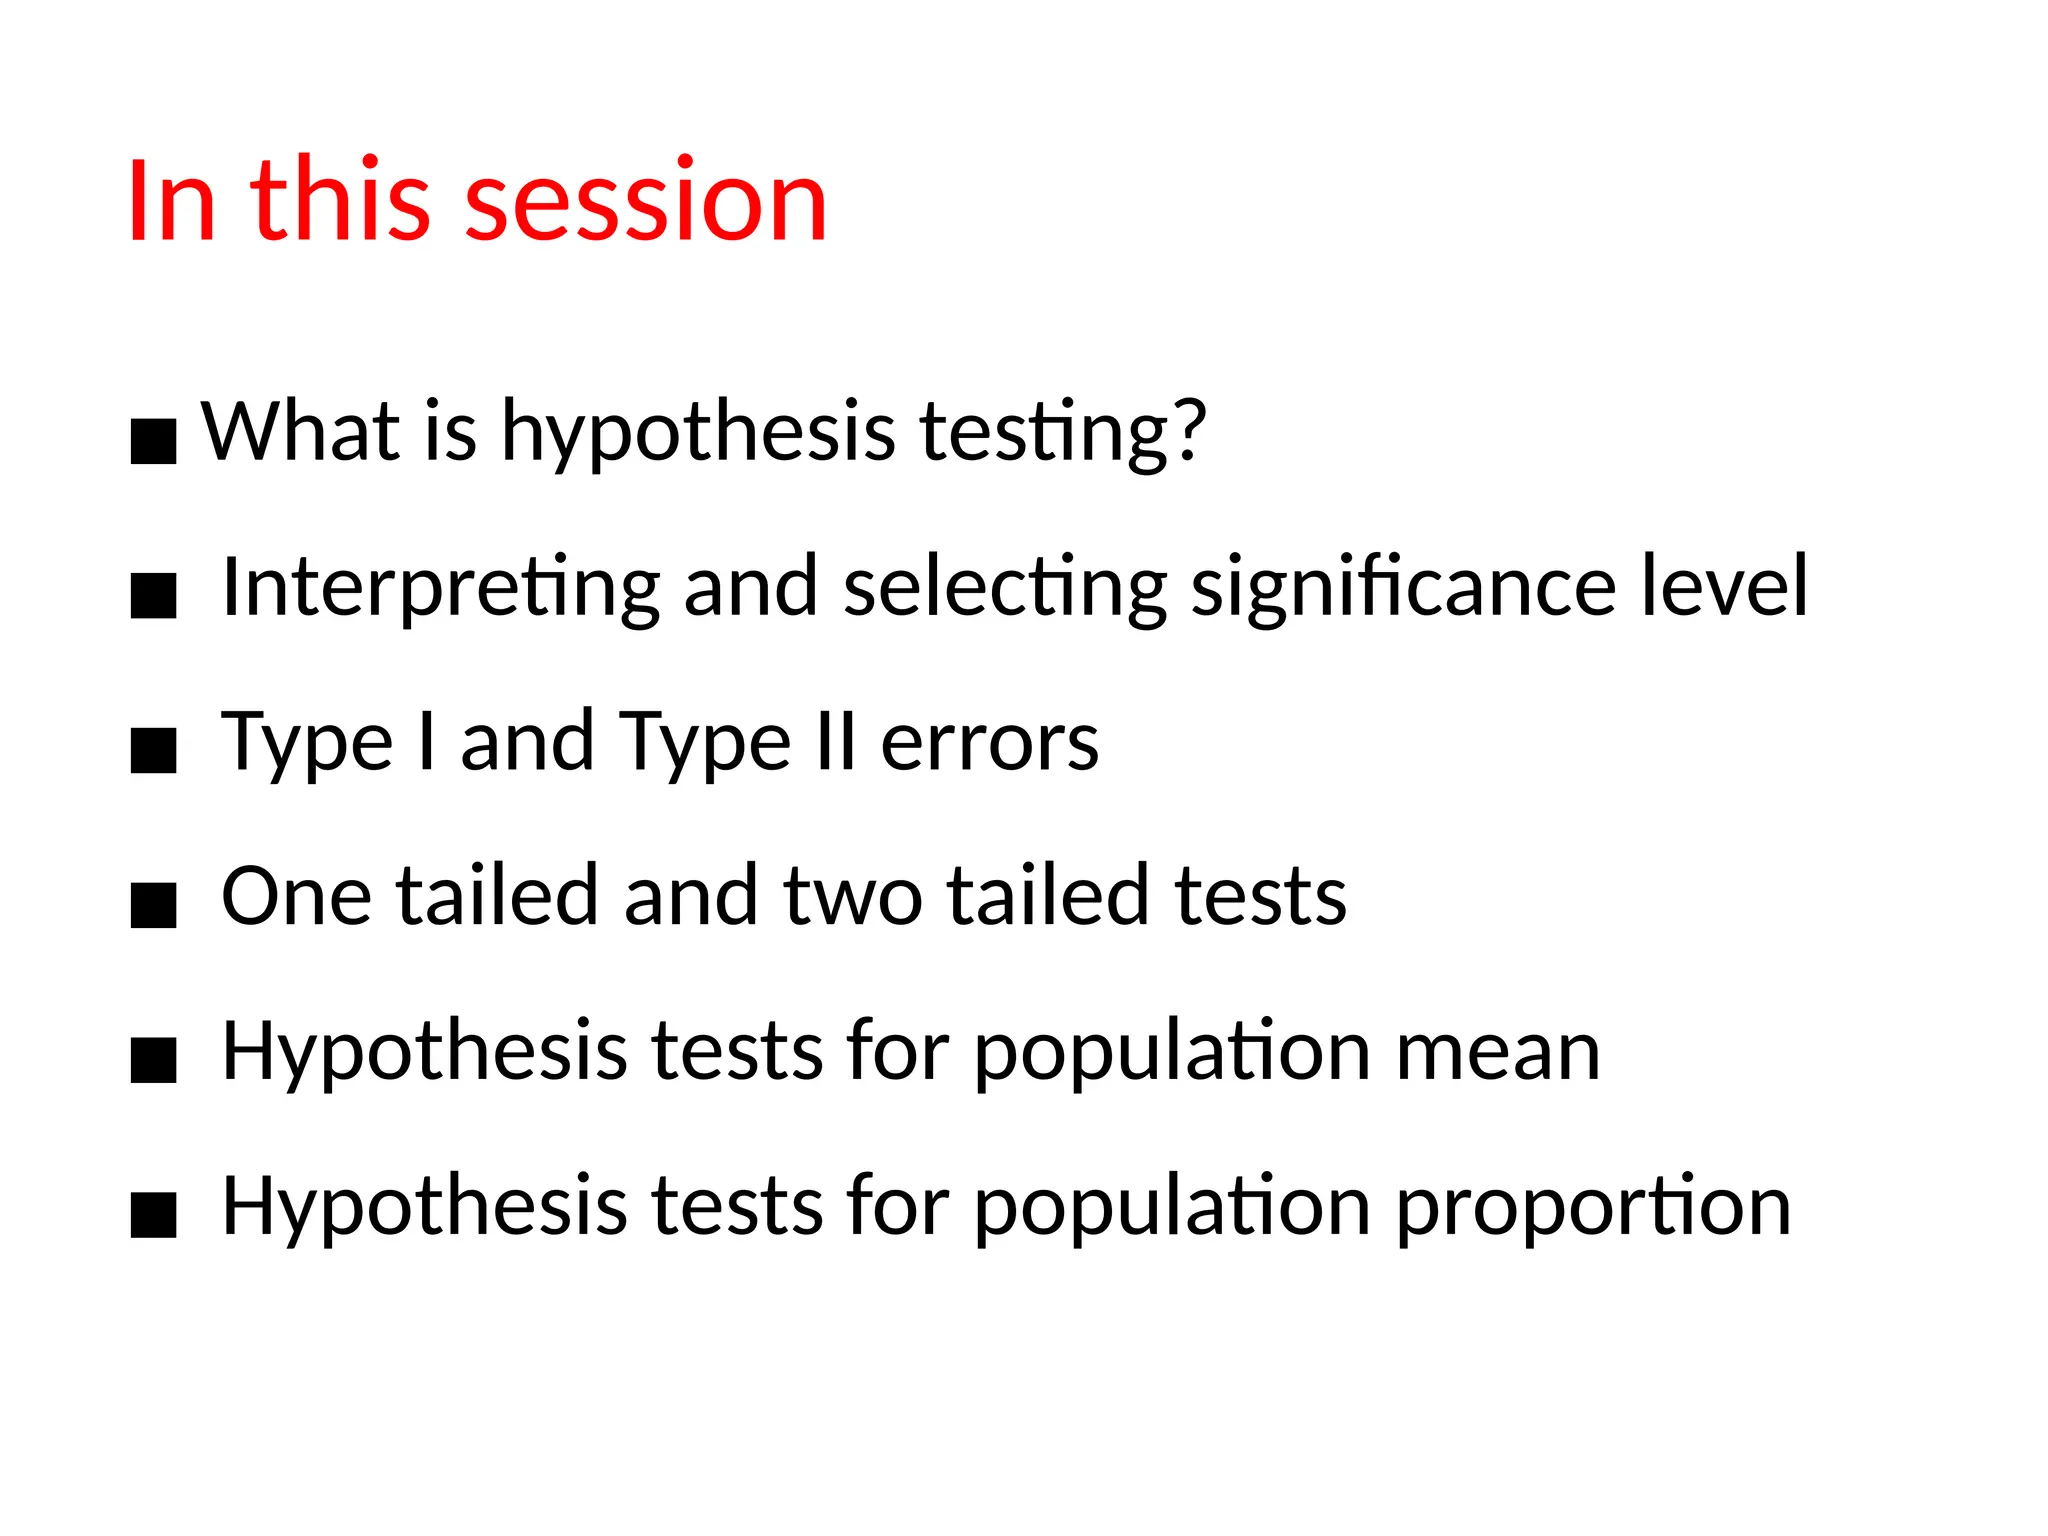
In this session
▪What is hypothesis testing?
▪ Interpreting and selecting significance level
▪ Type I and Type II errors
▪ One tailed and two tailed tests
▪ Hypothesis tests for population mean
▪ Hypothesis tests for population proportion
3.
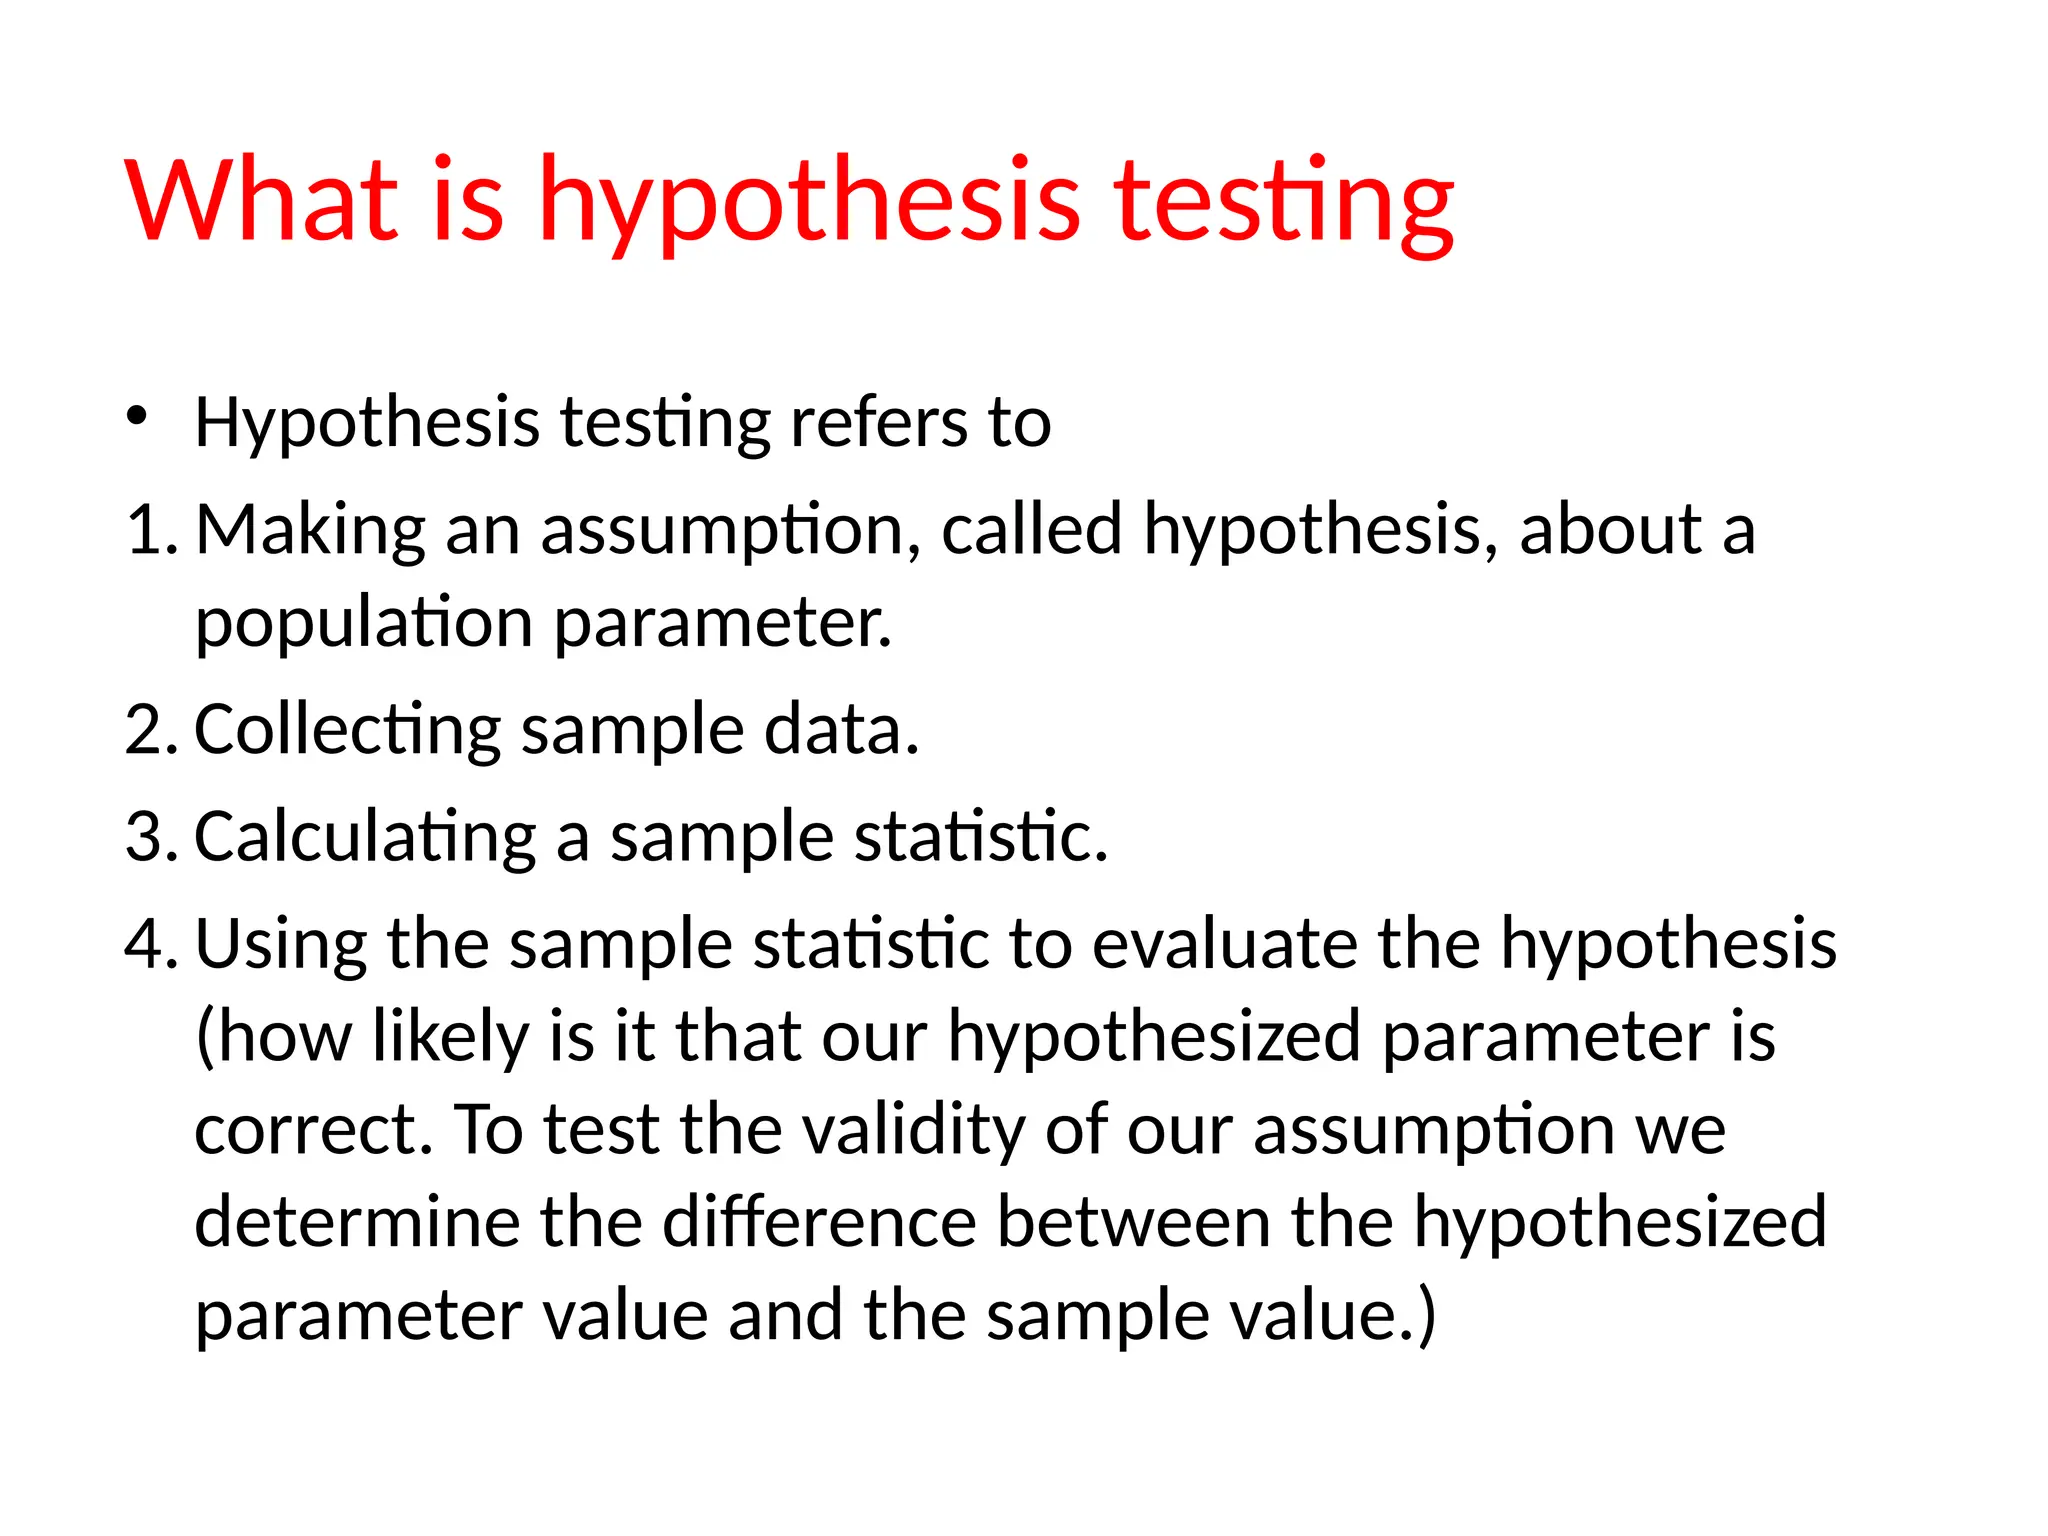
What is hypothesistesting
• Hypothesis testing refers to
1. Making an assumption, called hypothesis, about a
population parameter.
2. Collecting sample data.
3. Calculating a sample statistic.
4. Using the sample statistic to evaluate the hypothesis
(how likely is it that our hypothesized parameter is
correct. To test the validity of our assumption we
determine the difference between the hypothesized
parameter value and the sample value.)
4.
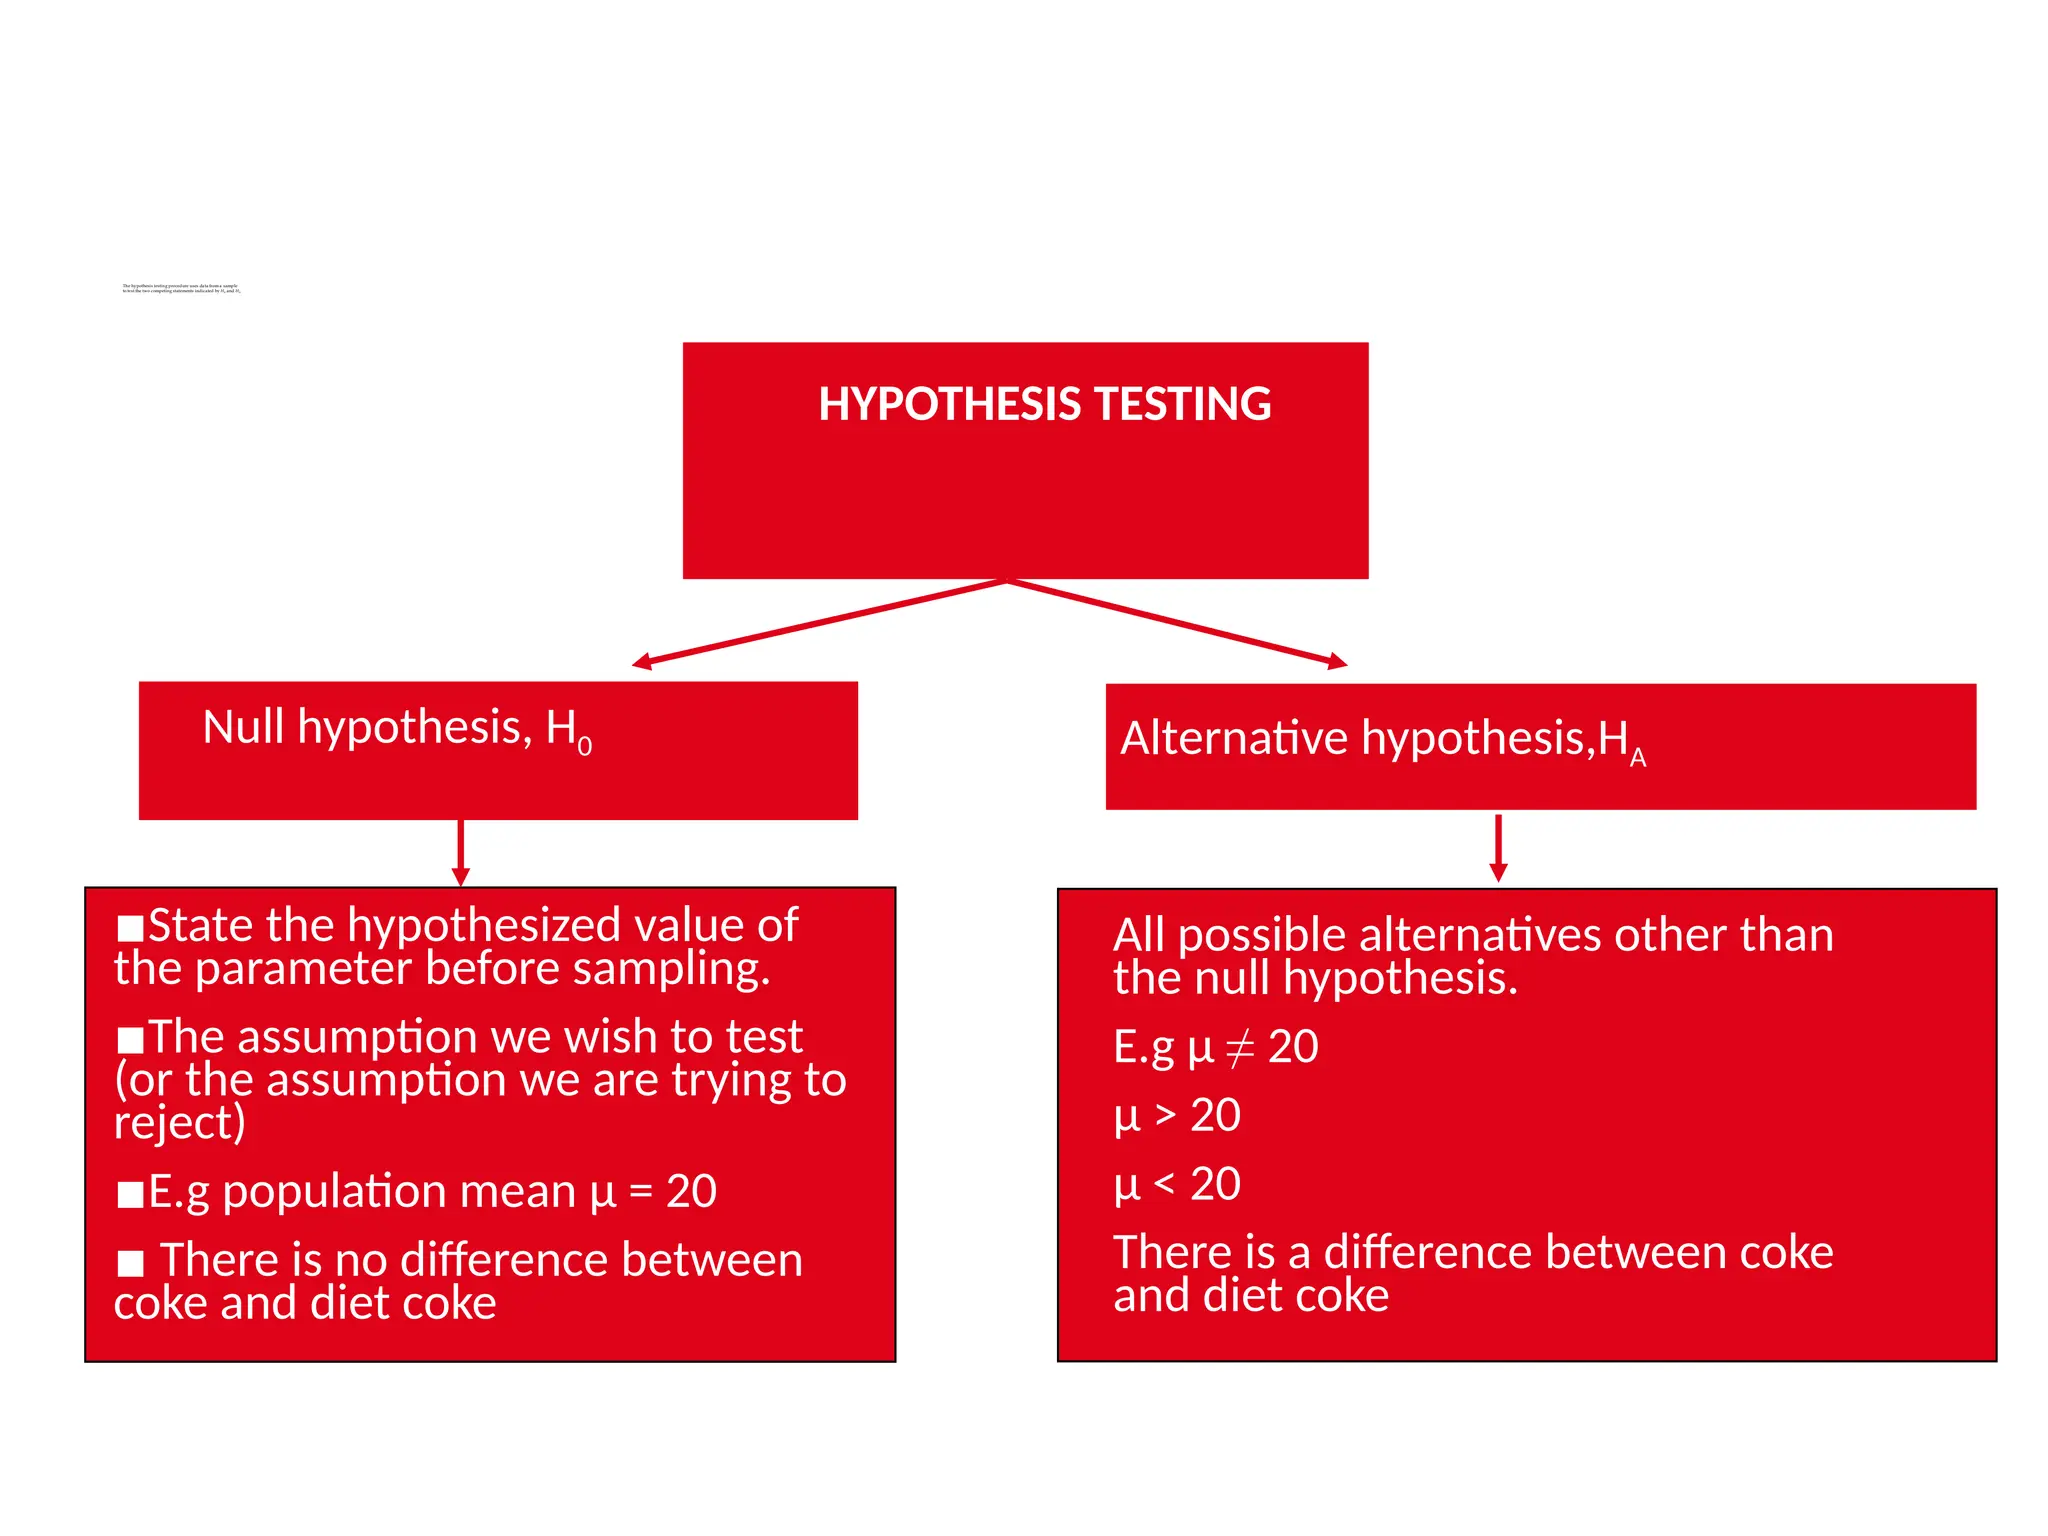
The hypothesis testingprocedure uses data from a sample
to test the two competing statements indicated by H0 and HA
HYPOTHESIS TESTING
Null hypothesis, H0 Alternative hypothesis,HA
▪State the hypothesized value of
the parameter before sampling.
▪The assumption we wish to test
(or the assumption we are trying to
reject)
▪E.g population mean µ = 20
▪ There is no difference between
coke and diet coke
All possible alternatives other than
the null hypothesis.
E.g µ ≠ 20
µ > 20
µ < 20
There is a difference between coke
and diet coke
5.
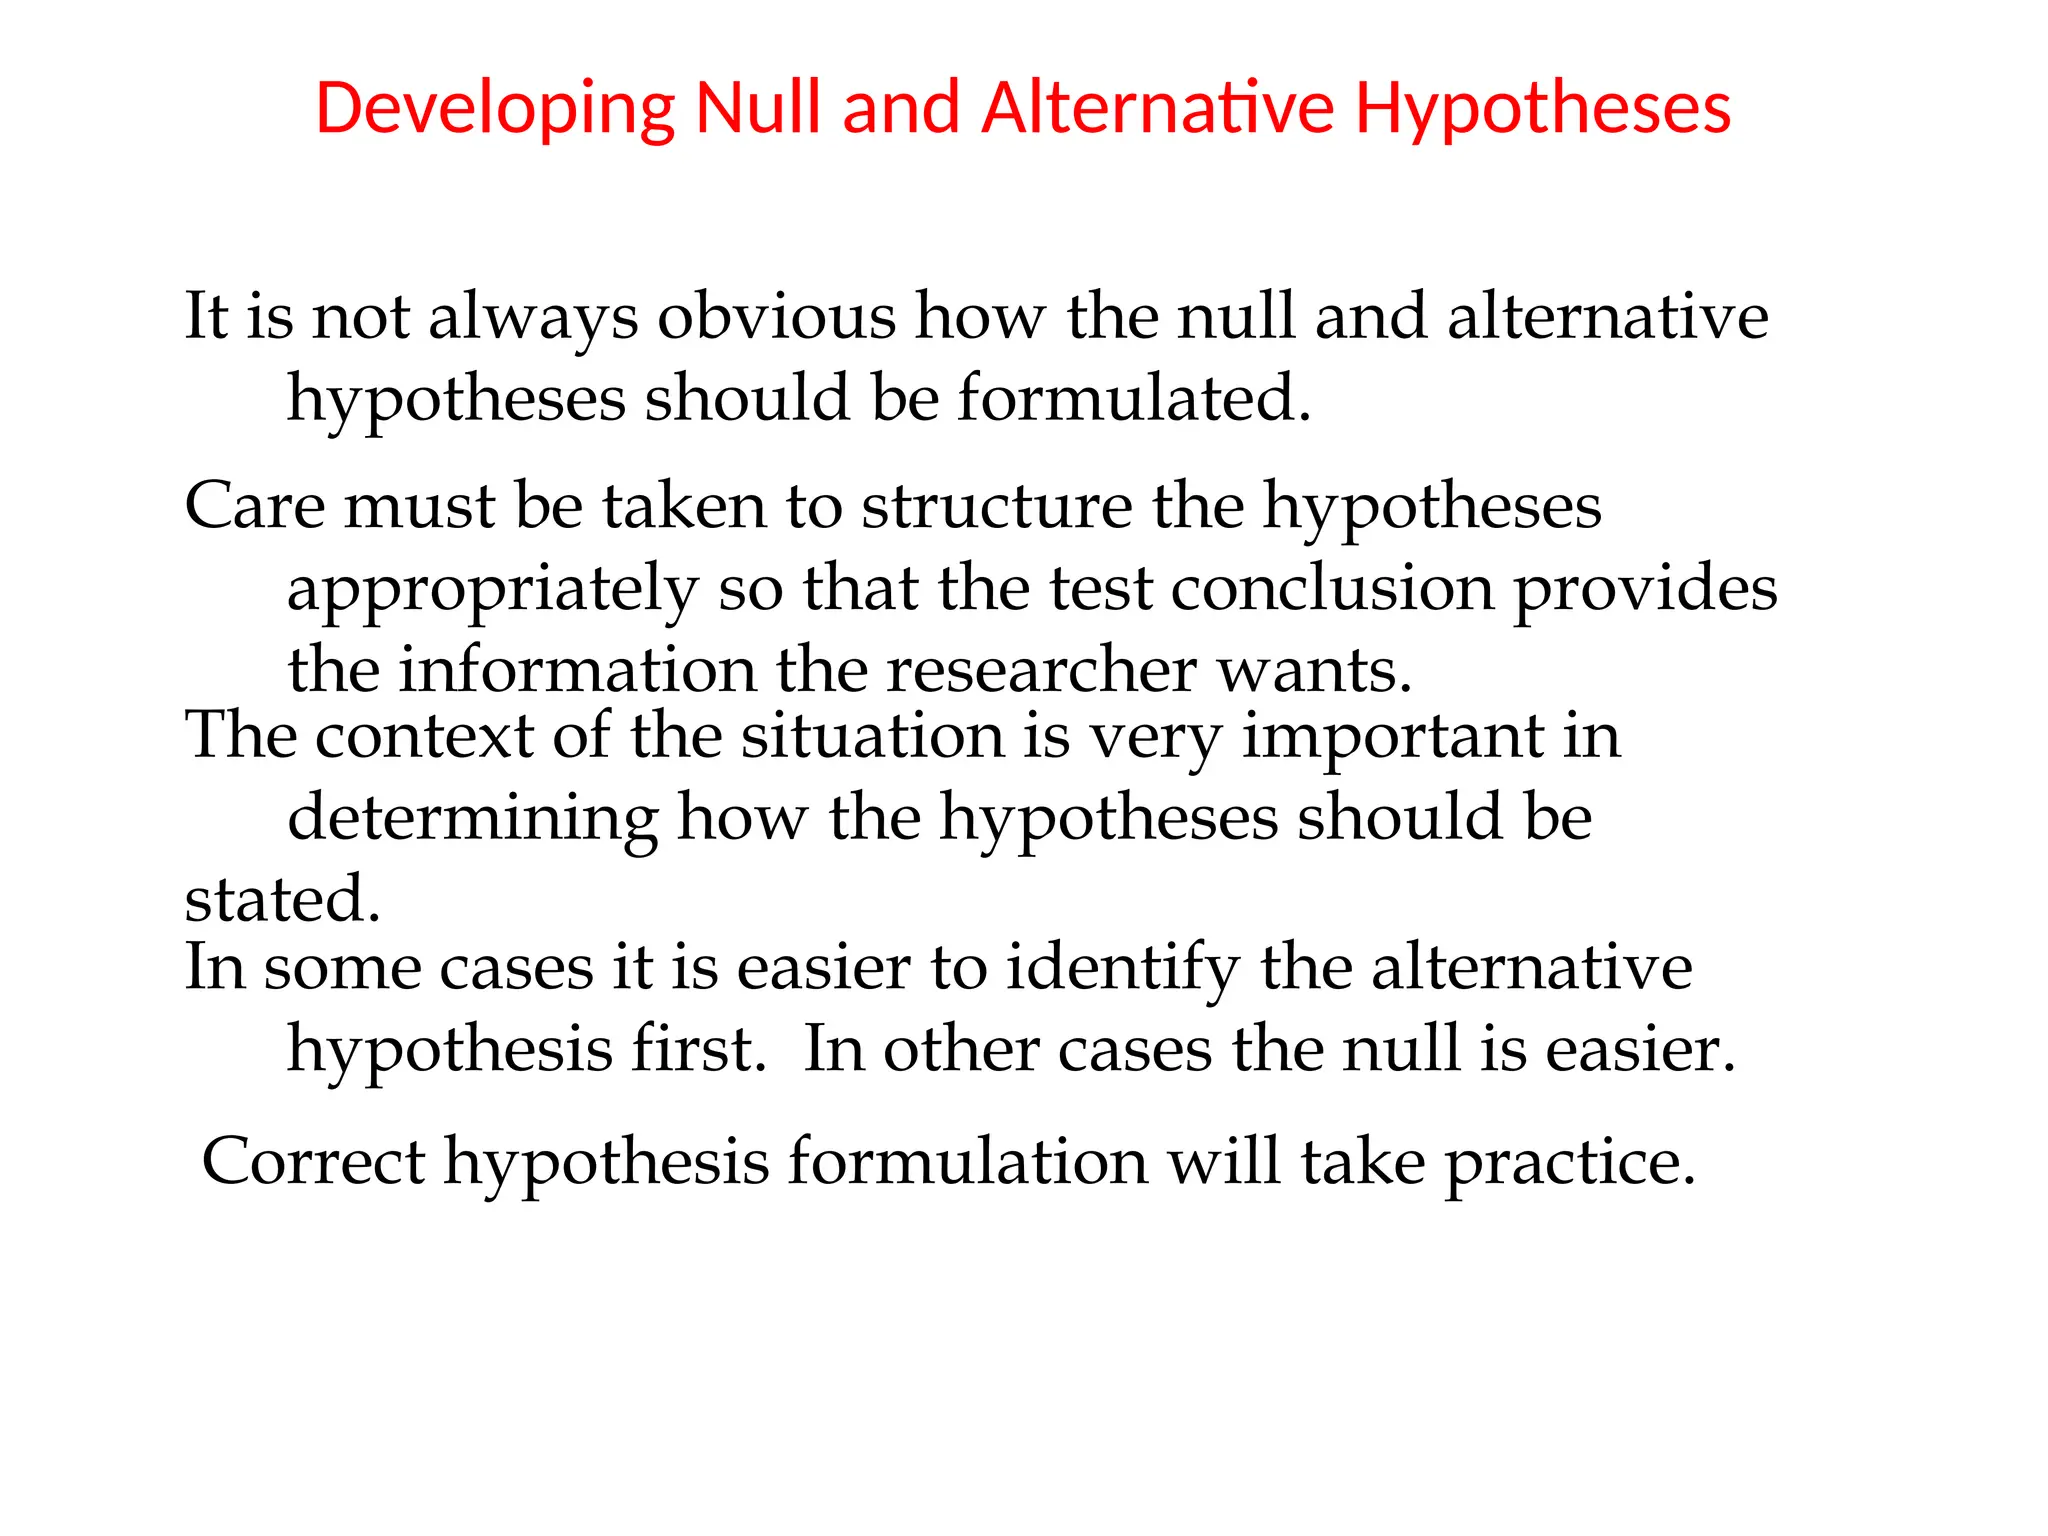
Developing Null andAlternative Hypotheses
It is not always obvious how the null and alternative
hypotheses should be formulated.
Care must be taken to structure the hypotheses
appropriately so that the test conclusion provides
the information the researcher wants.
The context of the situation is very important in
determining how the hypotheses should be
stated.
In some cases it is easier to identify the alternative
hypothesis first. In other cases the null is easier.
Correct hypothesis formulation will take practice.
6.
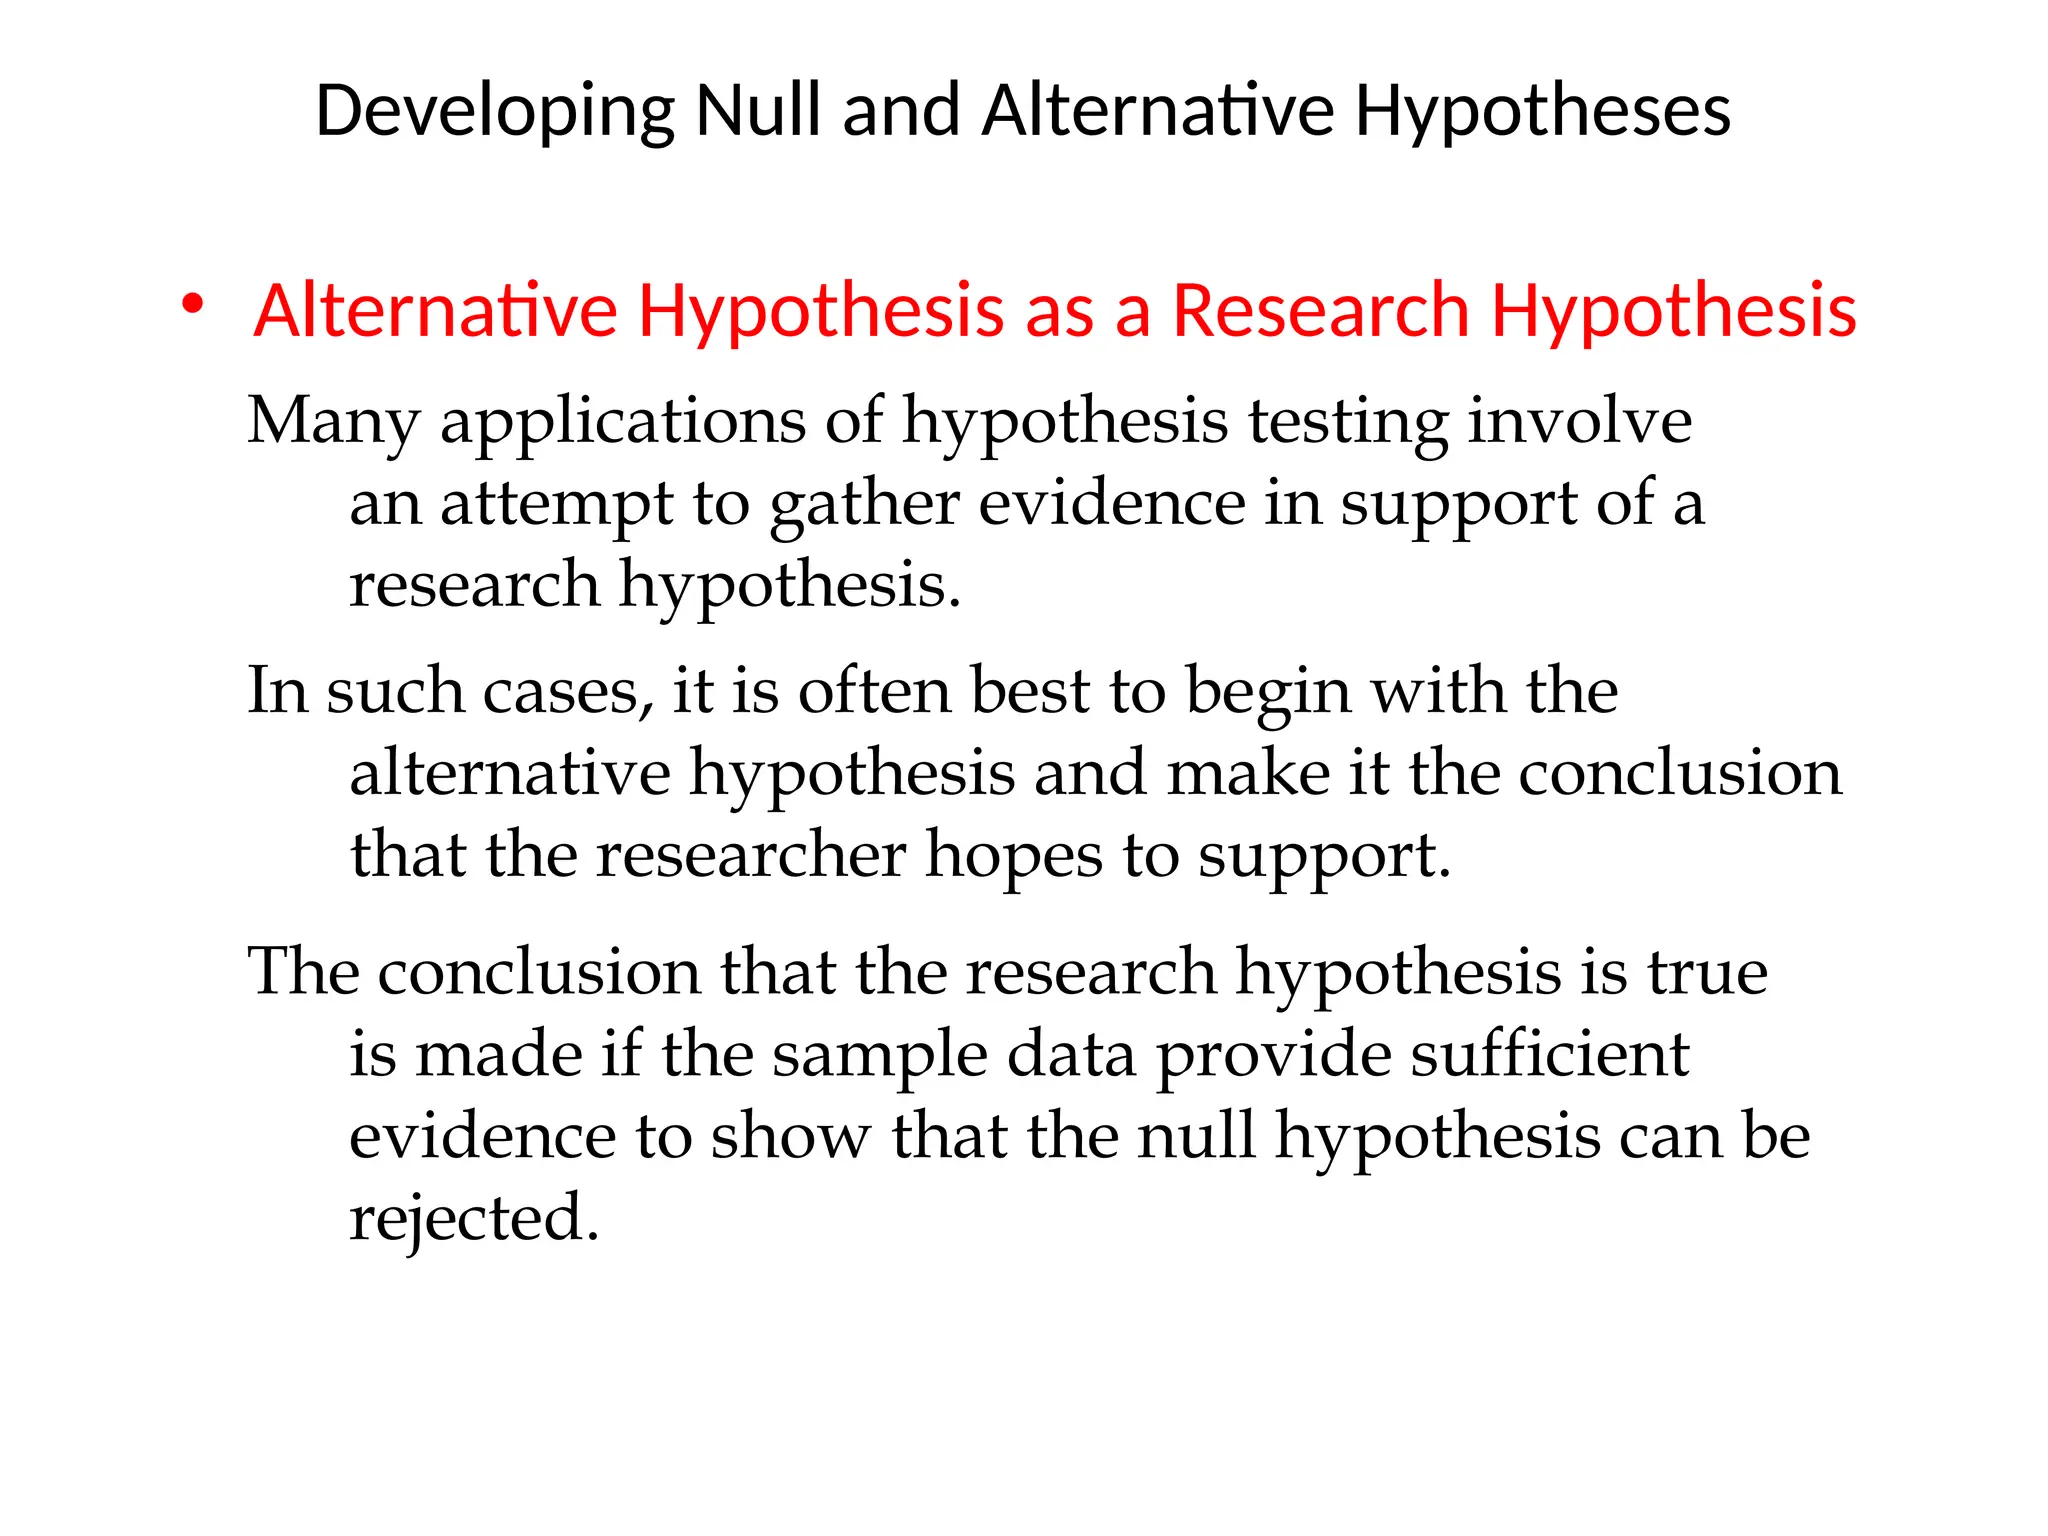
• Alternative Hypothesisas a Research Hypothesis
Developing Null and Alternative Hypotheses
Many applications of hypothesis testing involve
an attempt to gather evidence in support of a
research hypothesis.
In such cases, it is often best to begin with the
alternative hypothesis and make it the conclusion
that the researcher hopes to support.
The conclusion that the research hypothesis is true
is made if the sample data provide sufficient
evidence to show that the null hypothesis can be
rejected.
7.
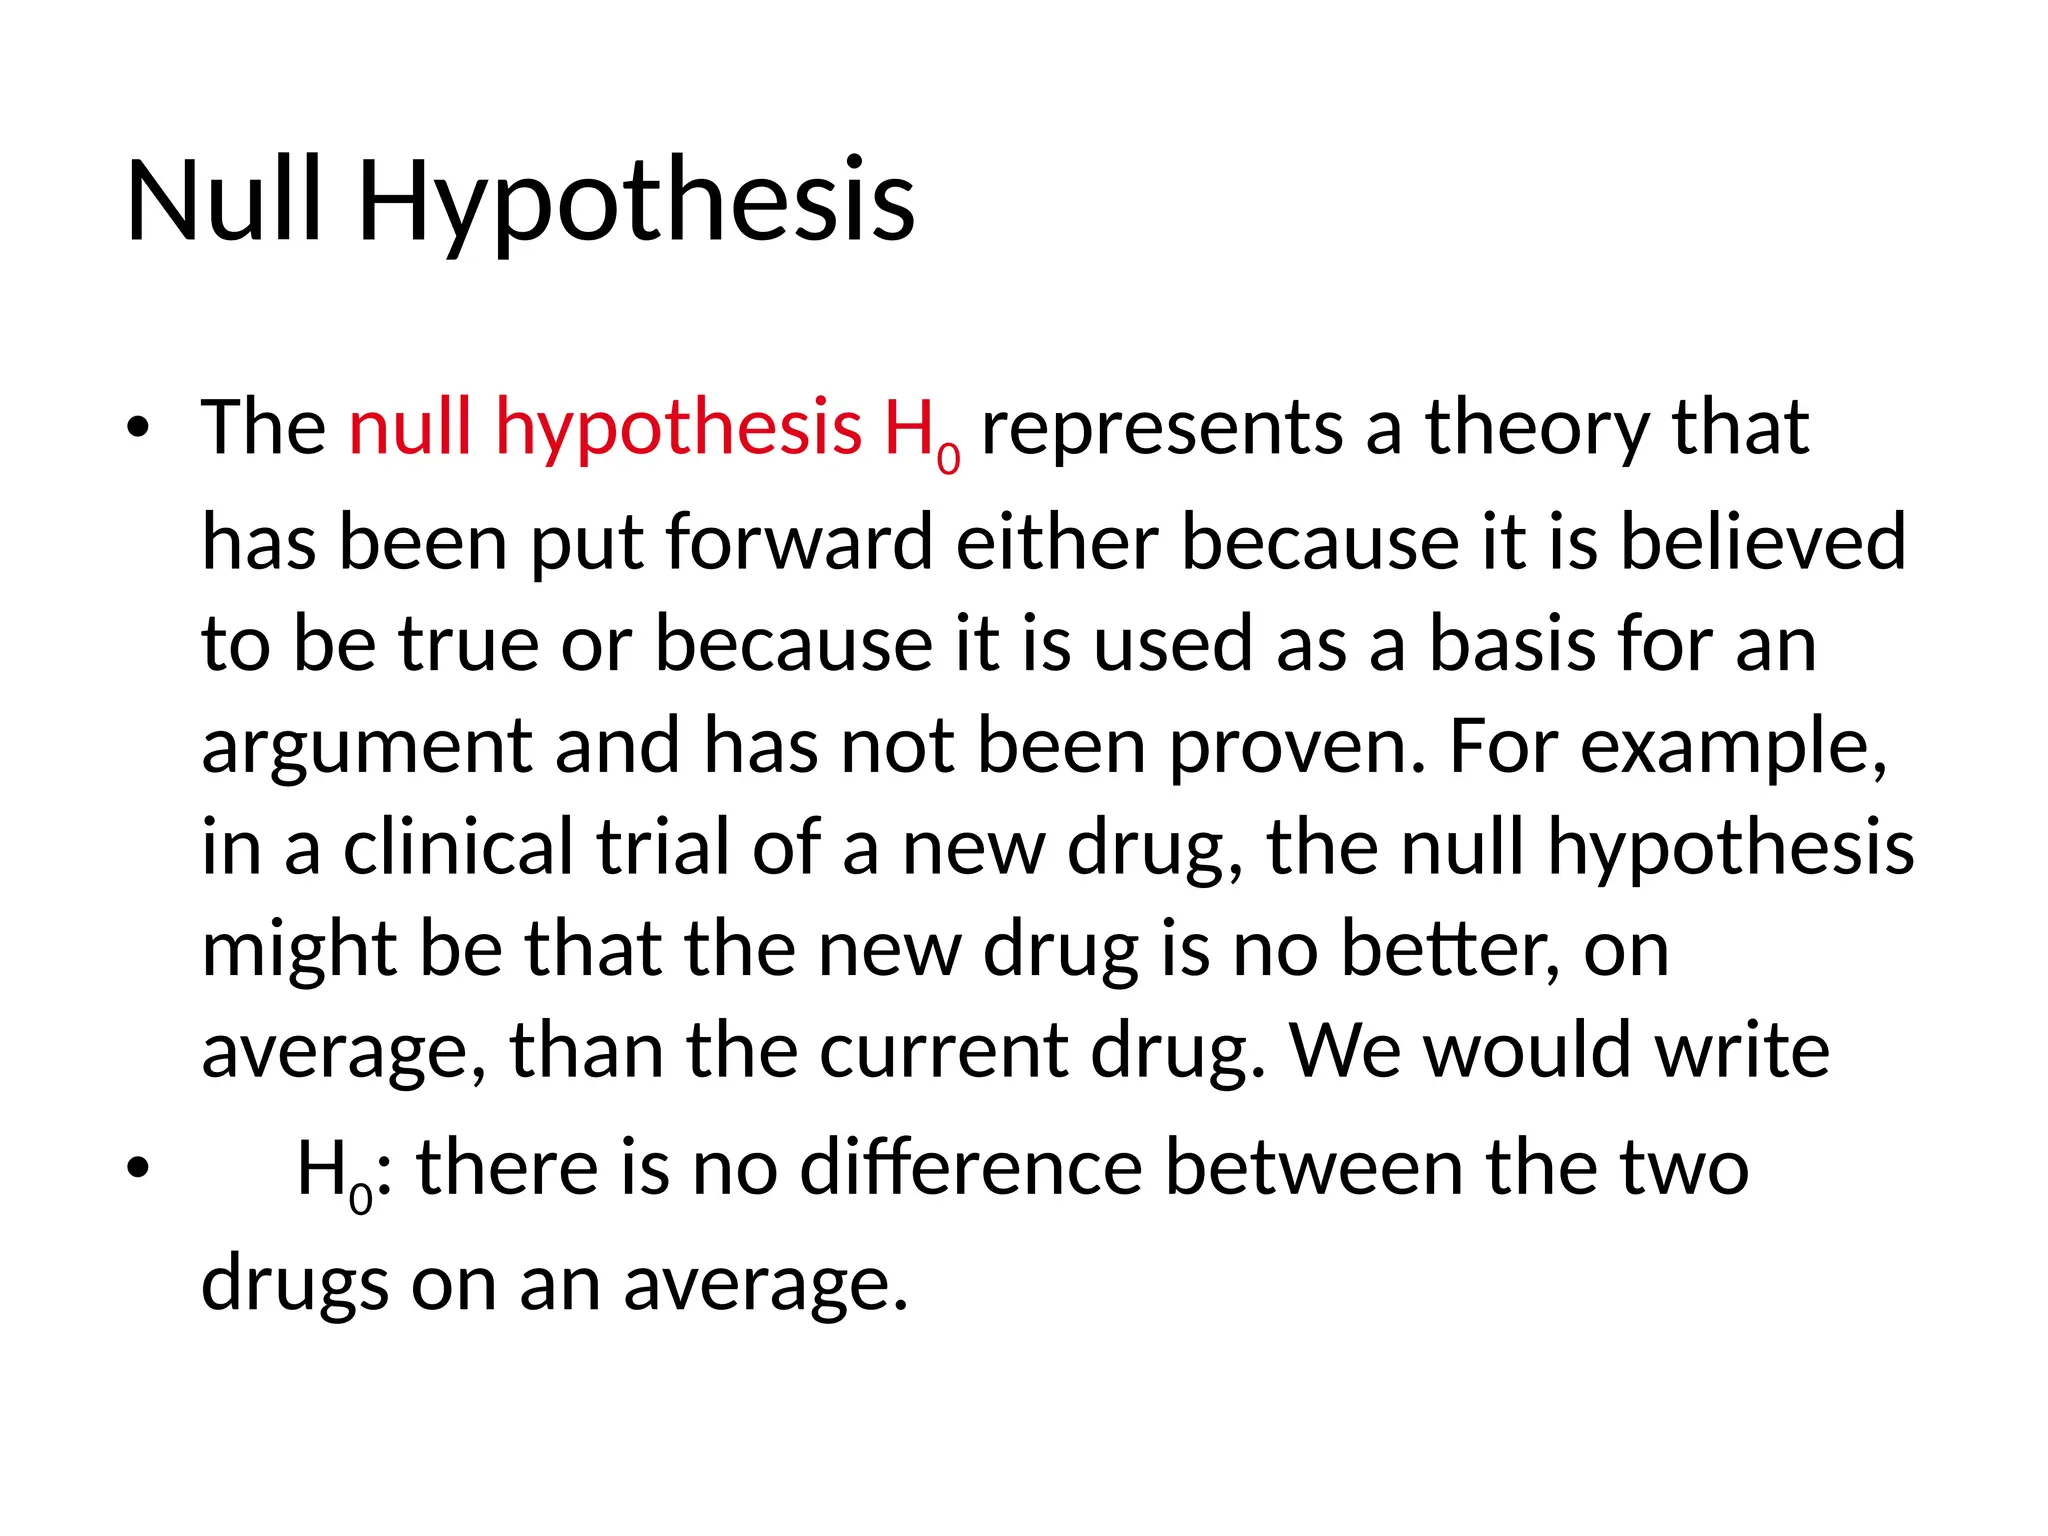
Null Hypothesis
• Thenull hypothesis H0 represents a theory that
has been put forward either because it is believed
to be true or because it is used as a basis for an
argument and has not been proven. For example,
in a clinical trial of a new drug, the null hypothesis
might be that the new drug is no better, on
average, than the current drug. We would write
• H0: there is no difference between the two
drugs on an average.
8.
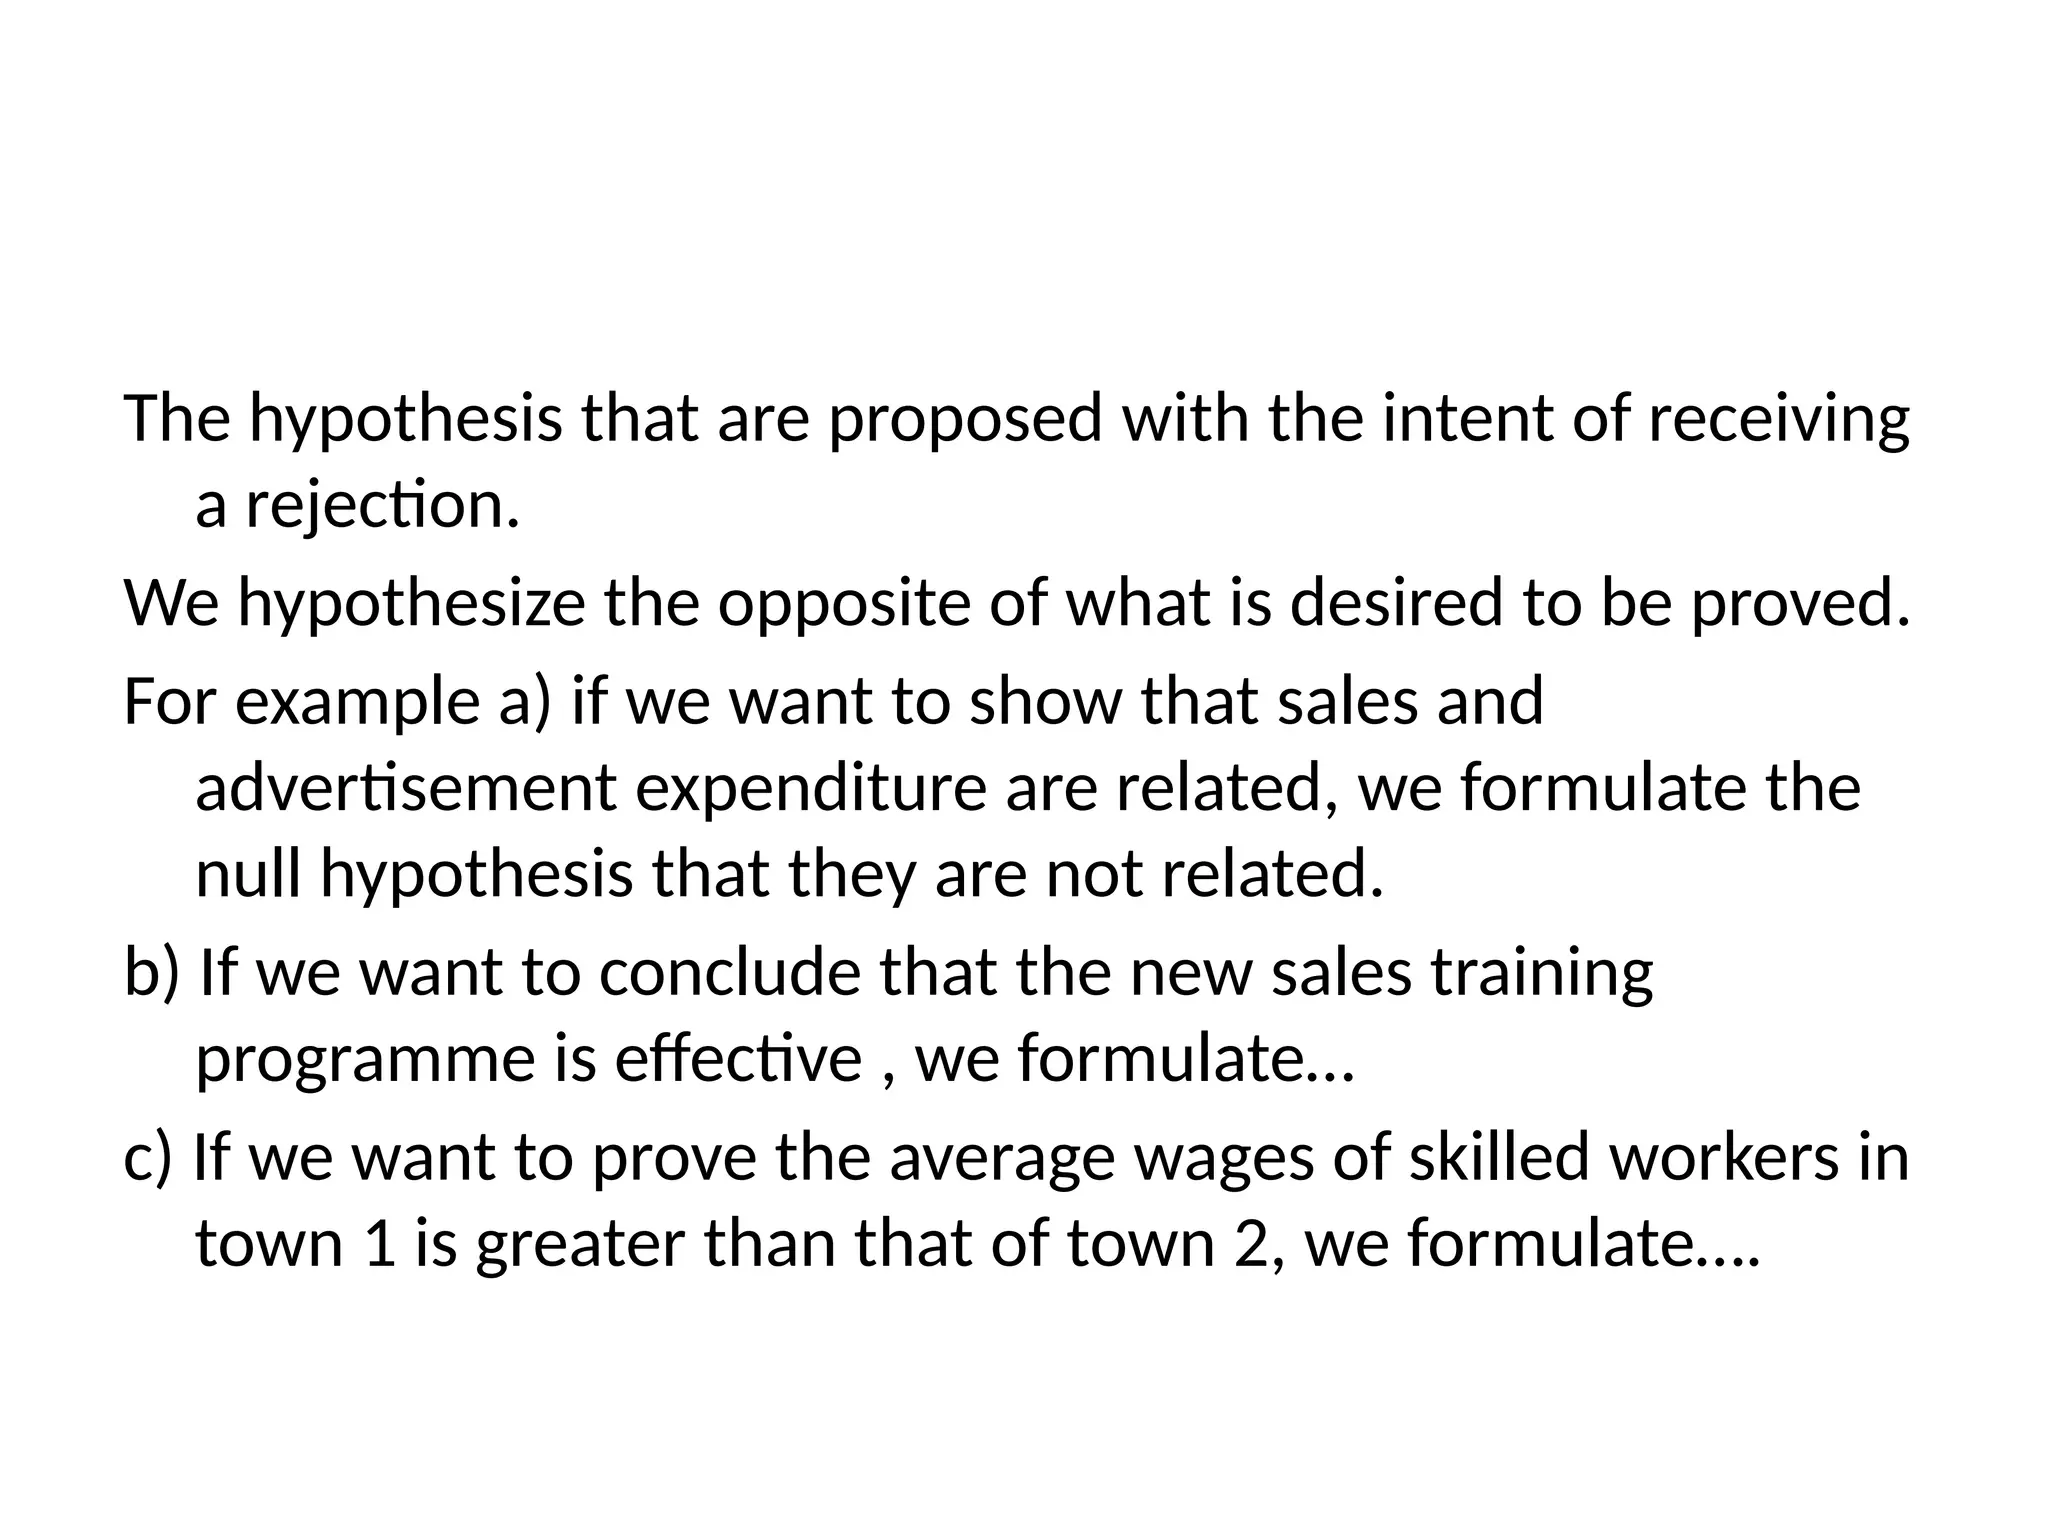
The hypothesis thatare proposed with the intent of receiving
a rejection.
We hypothesize the opposite of what is desired to be proved.
For example a) if we want to show that sales and
advertisement expenditure are related, we formulate the
null hypothesis that they are not related.
b) If we want to conclude that the new sales training
programme is effective , we formulate…
c) If we want to prove the average wages of skilled workers in
town 1 is greater than that of town 2, we formulate….
9.
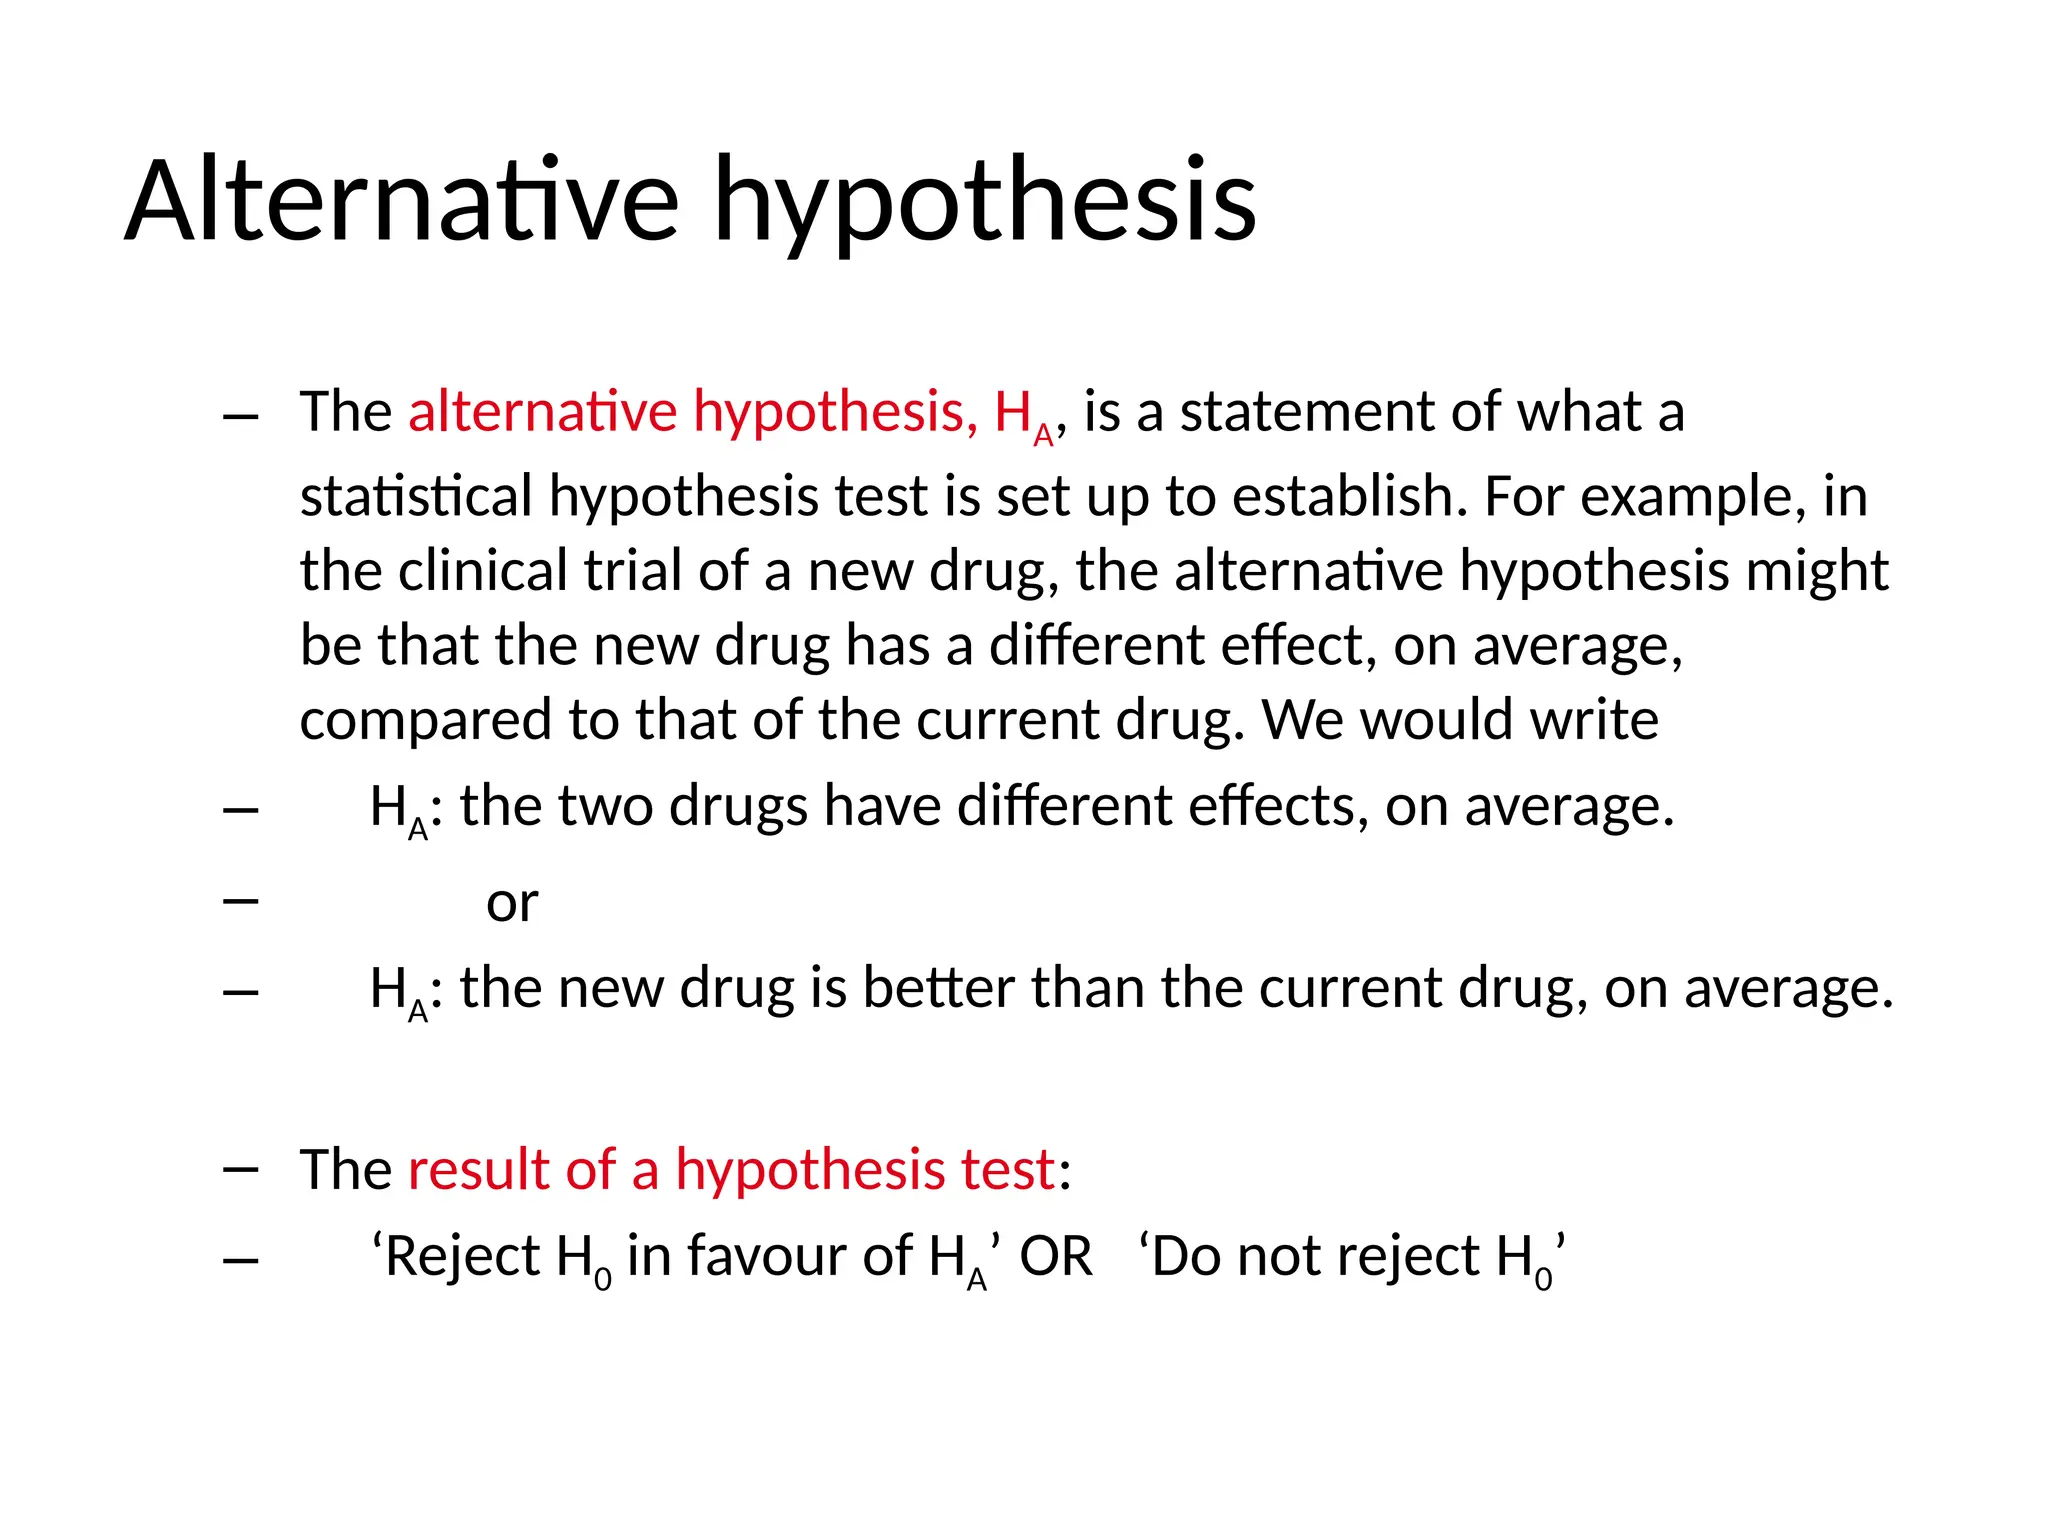
Alternative hypothesis
– Thealternative hypothesis, HA, is a statement of what a
statistical hypothesis test is set up to establish. For example, in
the clinical trial of a new drug, the alternative hypothesis might
be that the new drug has a different effect, on average,
compared to that of the current drug. We would write
– HA: the two drugs have different effects, on average.
– or
– HA: the new drug is better than the current drug, on average.
– The result of a hypothesis test:
– ‘Reject H0 in favour of HA’ OR ‘Do not reject H0’
10.
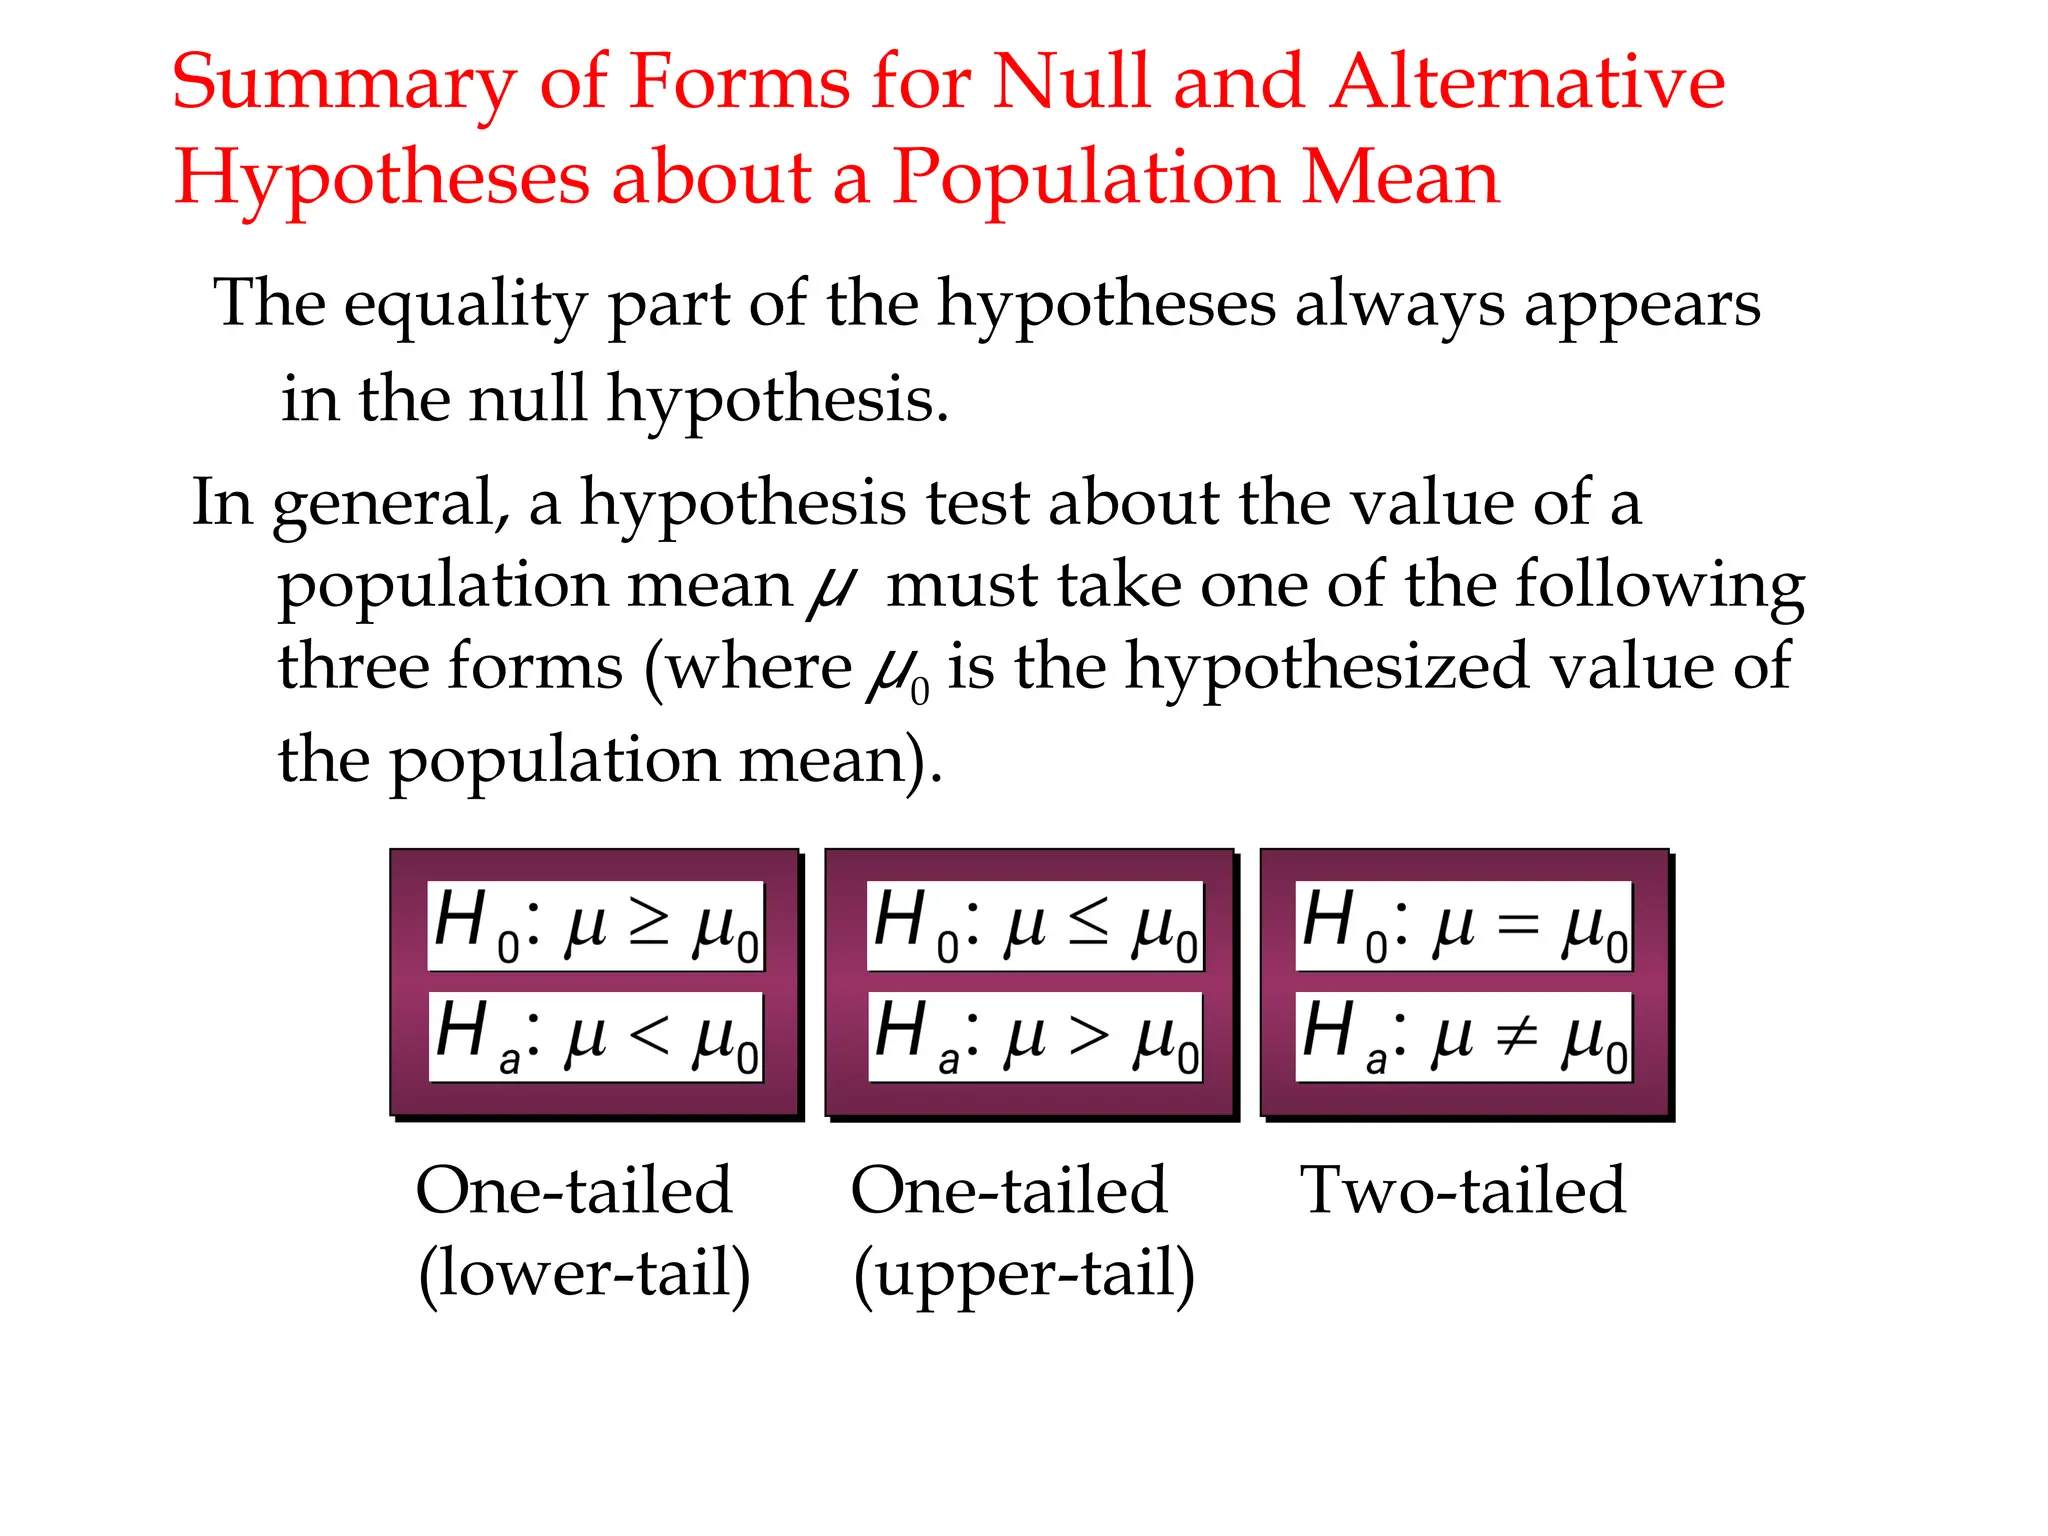
One-tailed
(lower-tail)
One-tailed
(upper-tail)
Two-tailed
Summary of Formsfor Null and Alternative
Hypotheses about a Population Mean
The equality part of the hypotheses always appears
in the null hypothesis.
In general, a hypothesis test about the value of a
population mean μ must take one of the following
three forms (where μ0 is the hypothesized value of
the population mean).
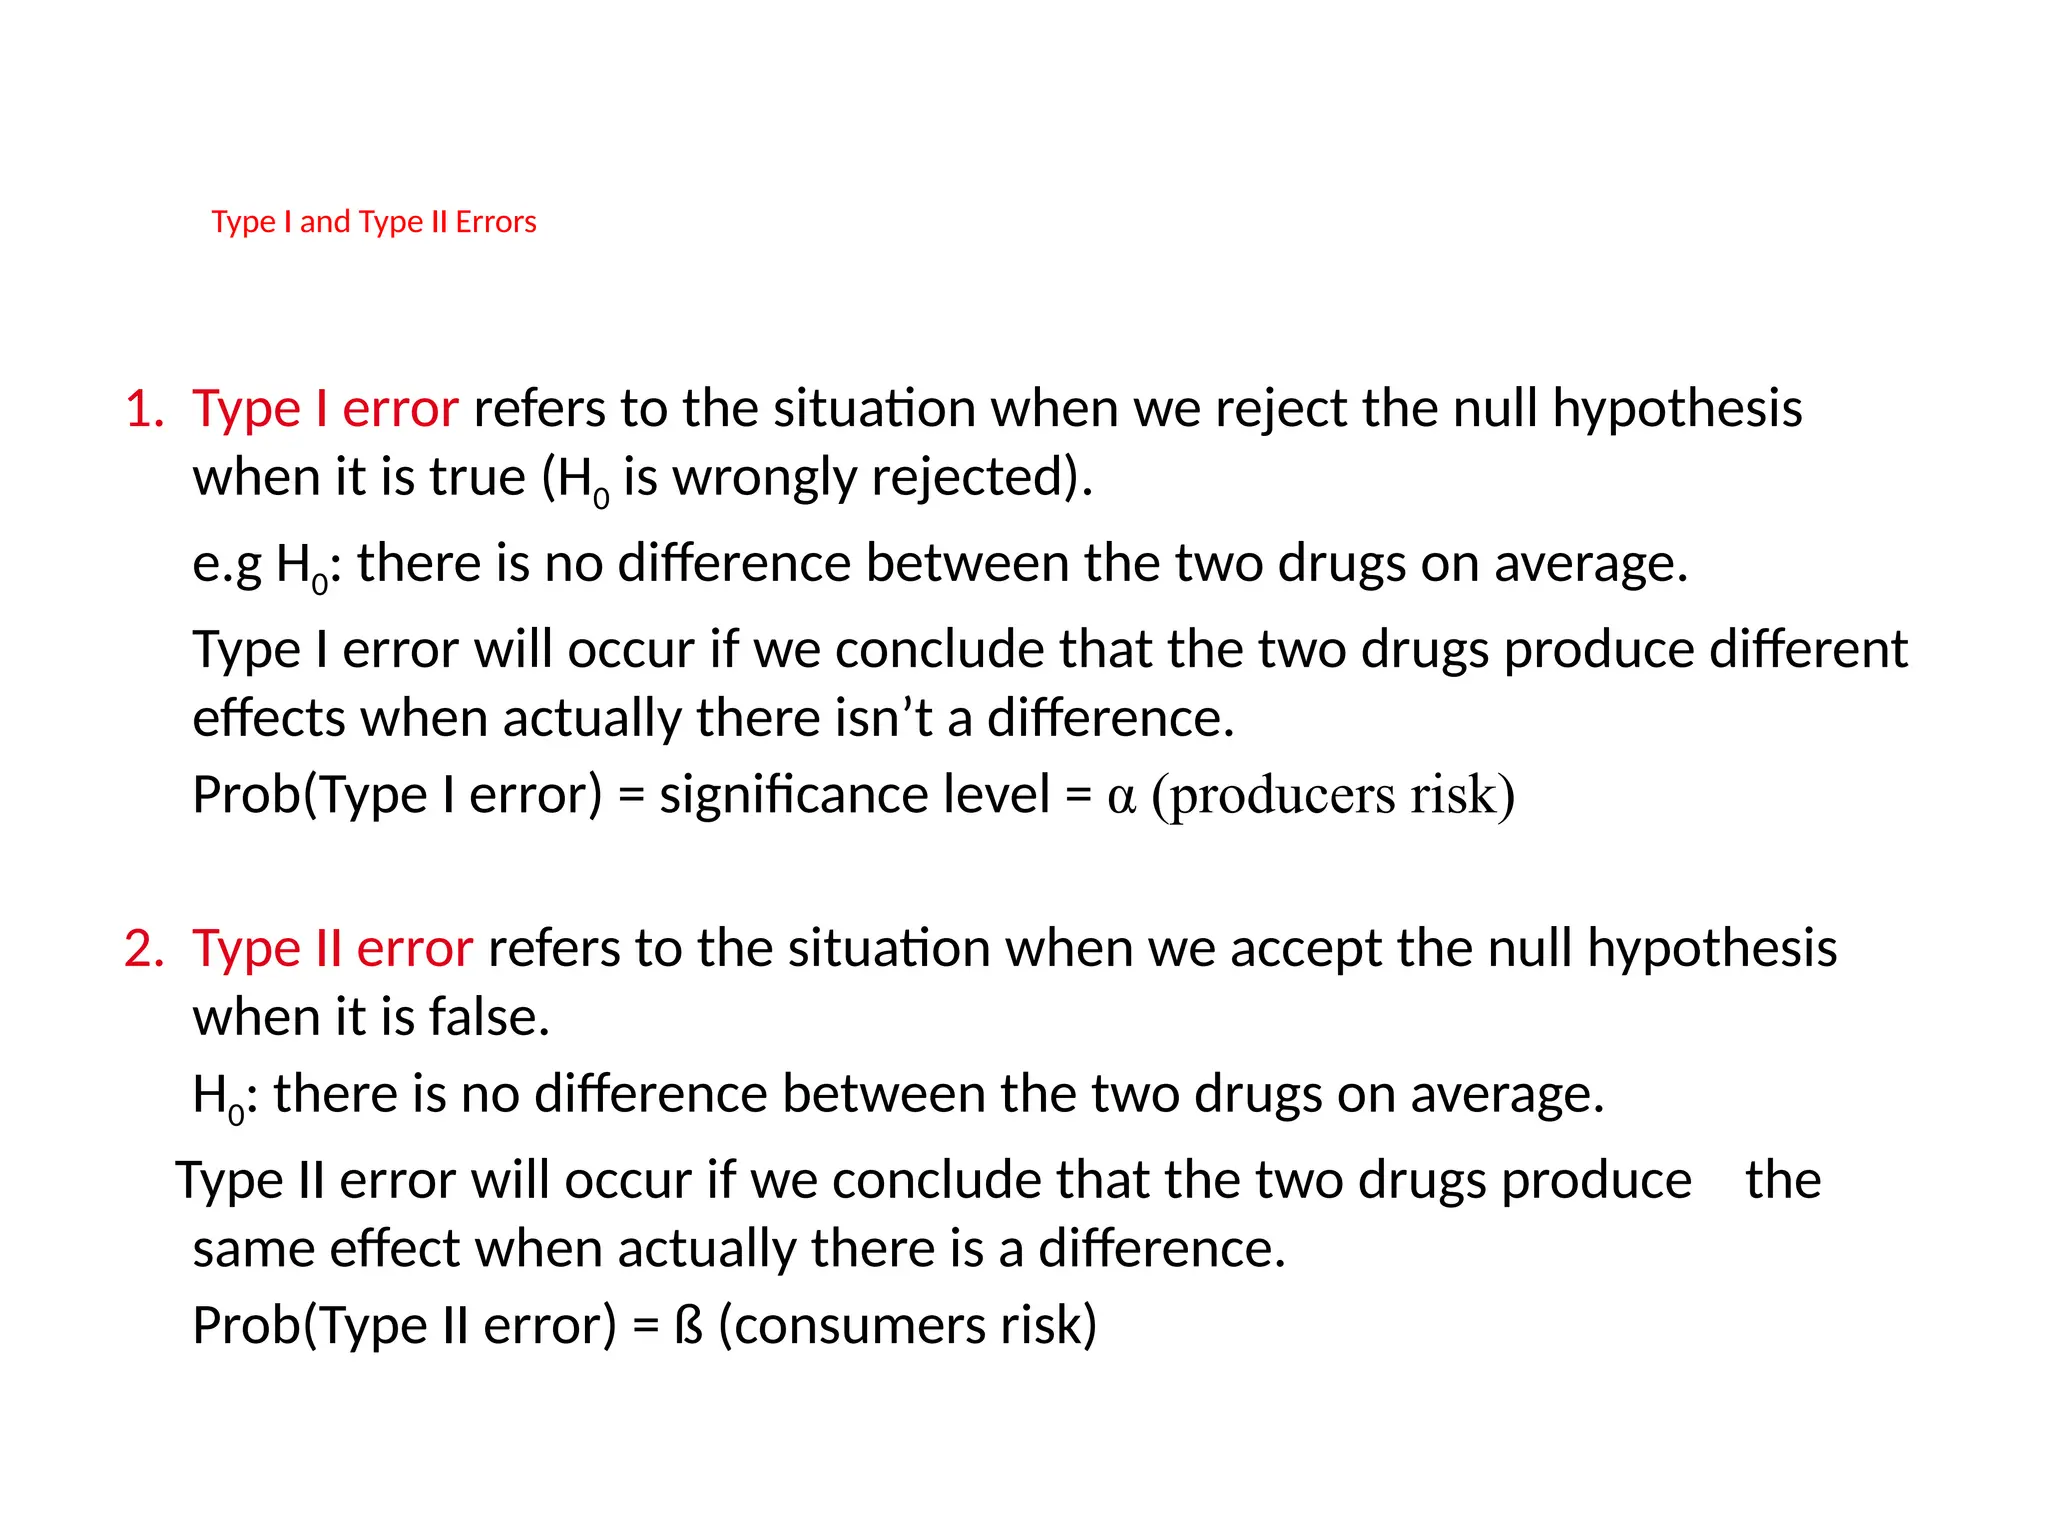
Type I TypeI and Type II ErrorsErrors
1. Type I error refers to the situation when we reject the null hypothesis
when it is true (H0 is wrongly rejected).
e.g H0: there is no difference between the two drugs on average.
Type I error will occur if we conclude that the two drugs produce different
effects when actually there isn’t a difference.
Prob(Type I error) = significance level = α (producers risk)
2. Type II error refers to the situation when we accept the null hypothesis
when it is false.
H0: there is no difference between the two drugs on average.
Type II error will occur if we conclude that the two drugs produce the
same effect when actually there is a difference.
Prob(Type II error) = ß (consumers risk)
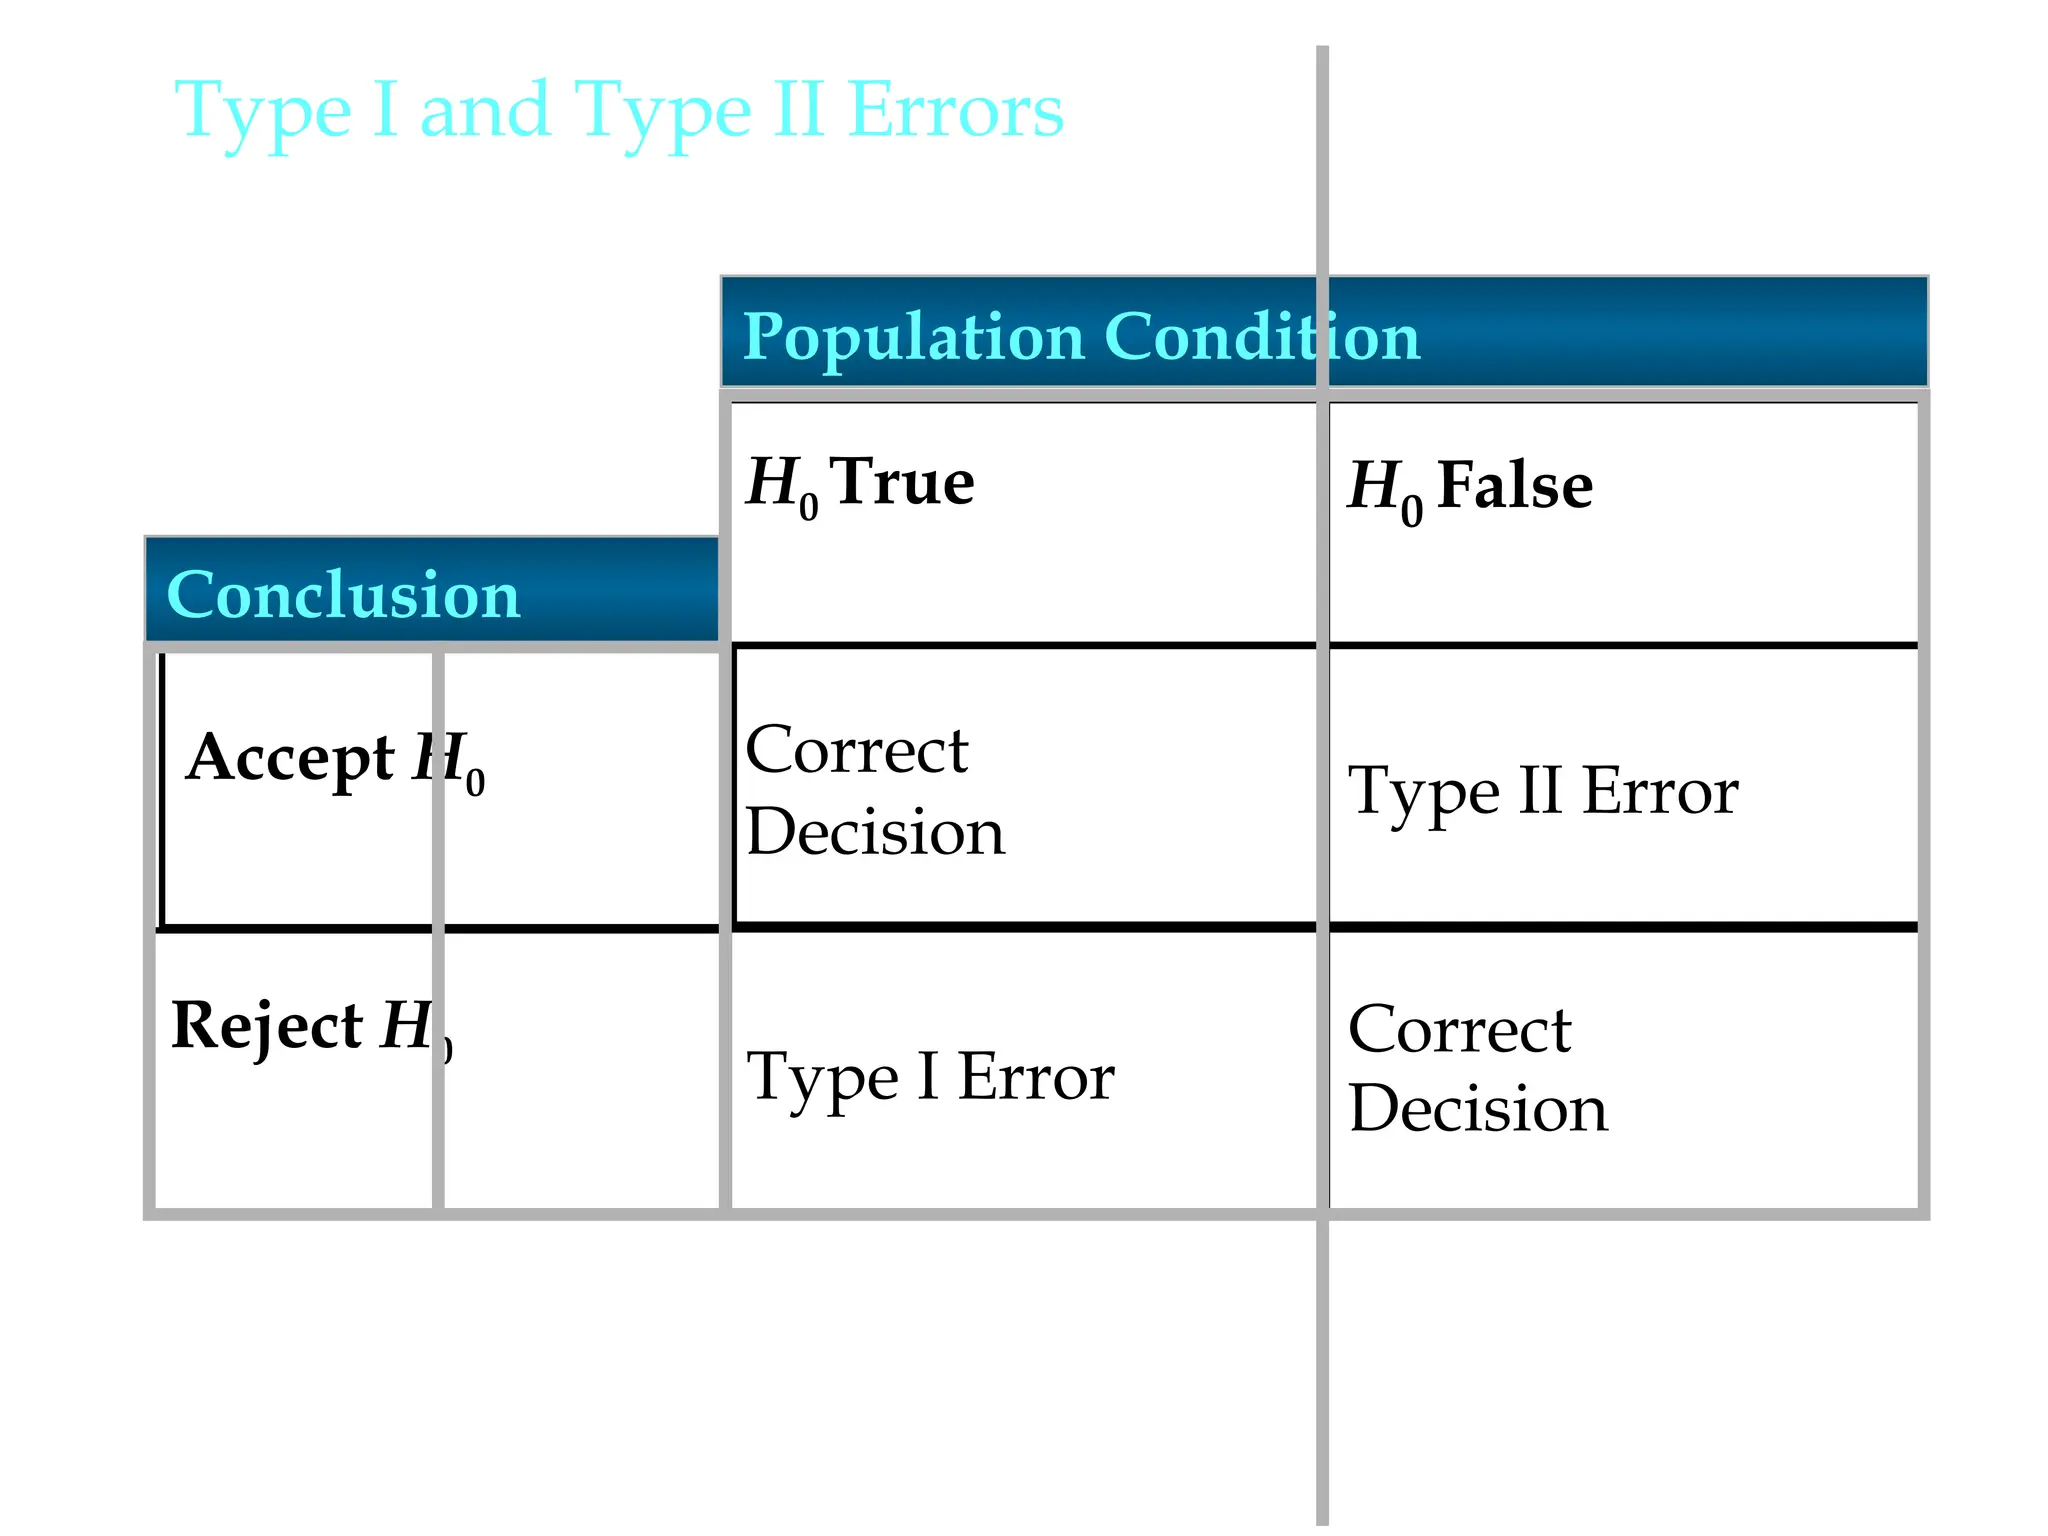
13.
Type I andType II Errors
Correct
Decision
Type II Error
Correct
Decision
Type I Error
Reject H0
Accept H0
H0 True H0 False
Conclusion
Population Condition
14.
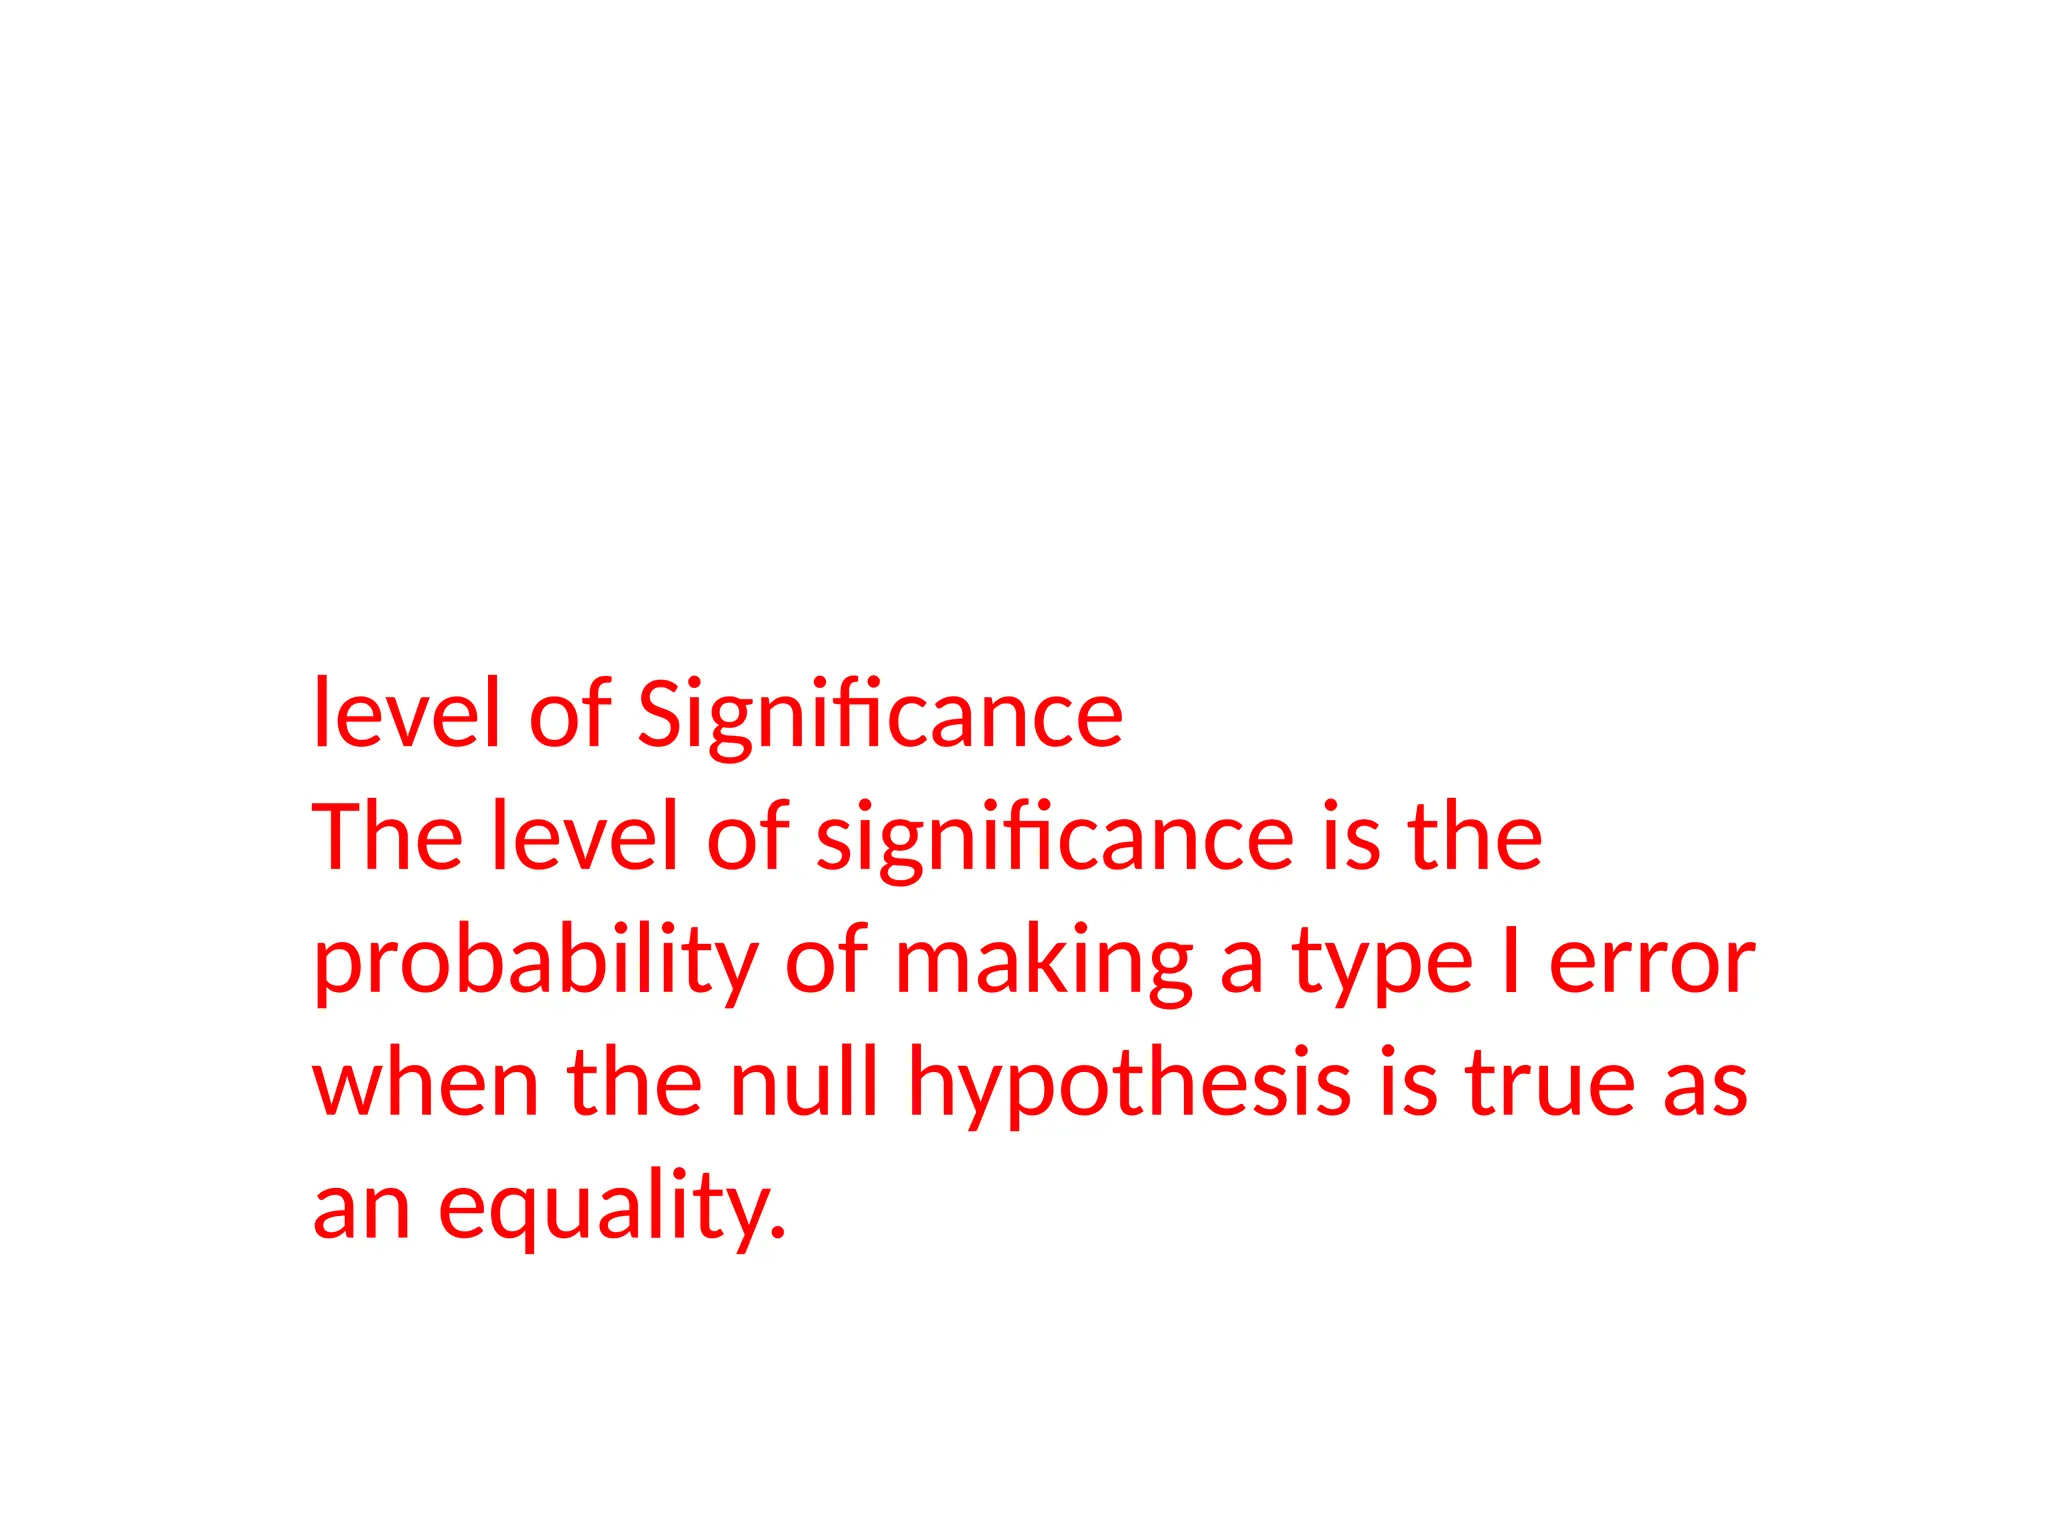
level of Significance
Thelevel of significance is the
probability of making a type I error
when the null hypothesis is true as
an equality.
15.
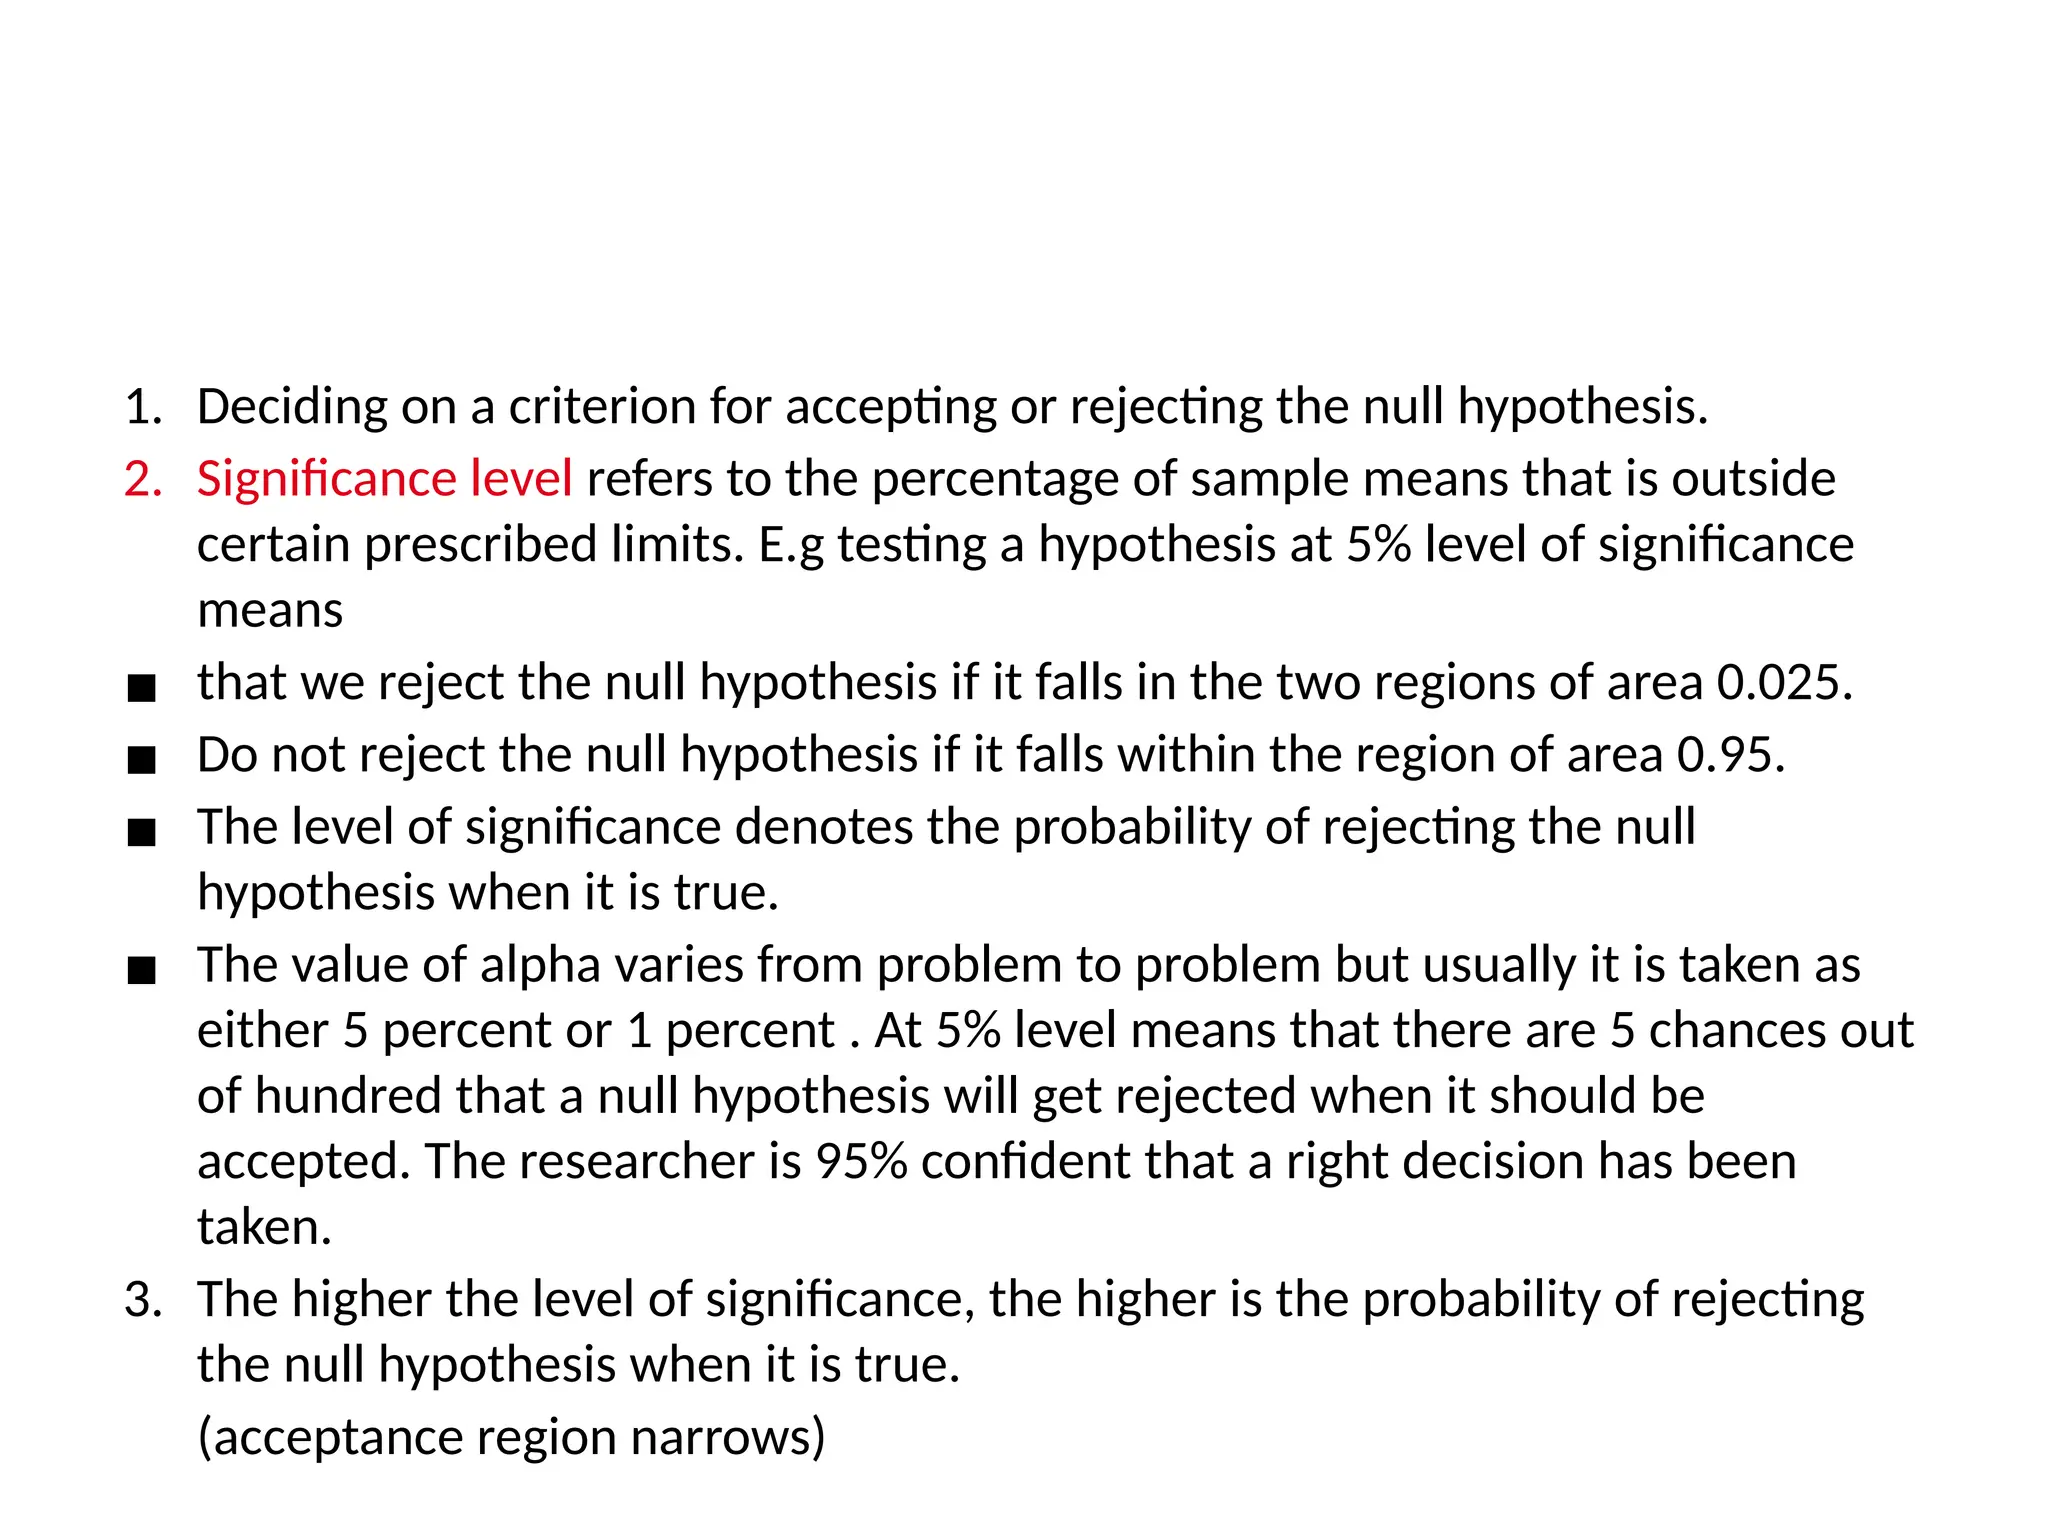
level Selecting andinterpreting significance level
1. Deciding on a criterion for accepting or rejecting the null hypothesis.
2. Significance level refers to the percentage of sample means that is outside
certain prescribed limits. E.g testing a hypothesis at 5% level of significance
means
▪ that we reject the null hypothesis if it falls in the two regions of area 0.025.
▪ Do not reject the null hypothesis if it falls within the region of area 0.95.
▪ The level of significance denotes the probability of rejecting the null
hypothesis when it is true.
▪ The value of alpha varies from problem to problem but usually it is taken as
either 5 percent or 1 percent . At 5% level means that there are 5 chances out
of hundred that a null hypothesis will get rejected when it should be
accepted. The researcher is 95% confident that a right decision has been
taken.
3. The higher the level of significance, the higher is the probability of rejecting
the null hypothesis when it is true.
(acceptance region narrows)
16.
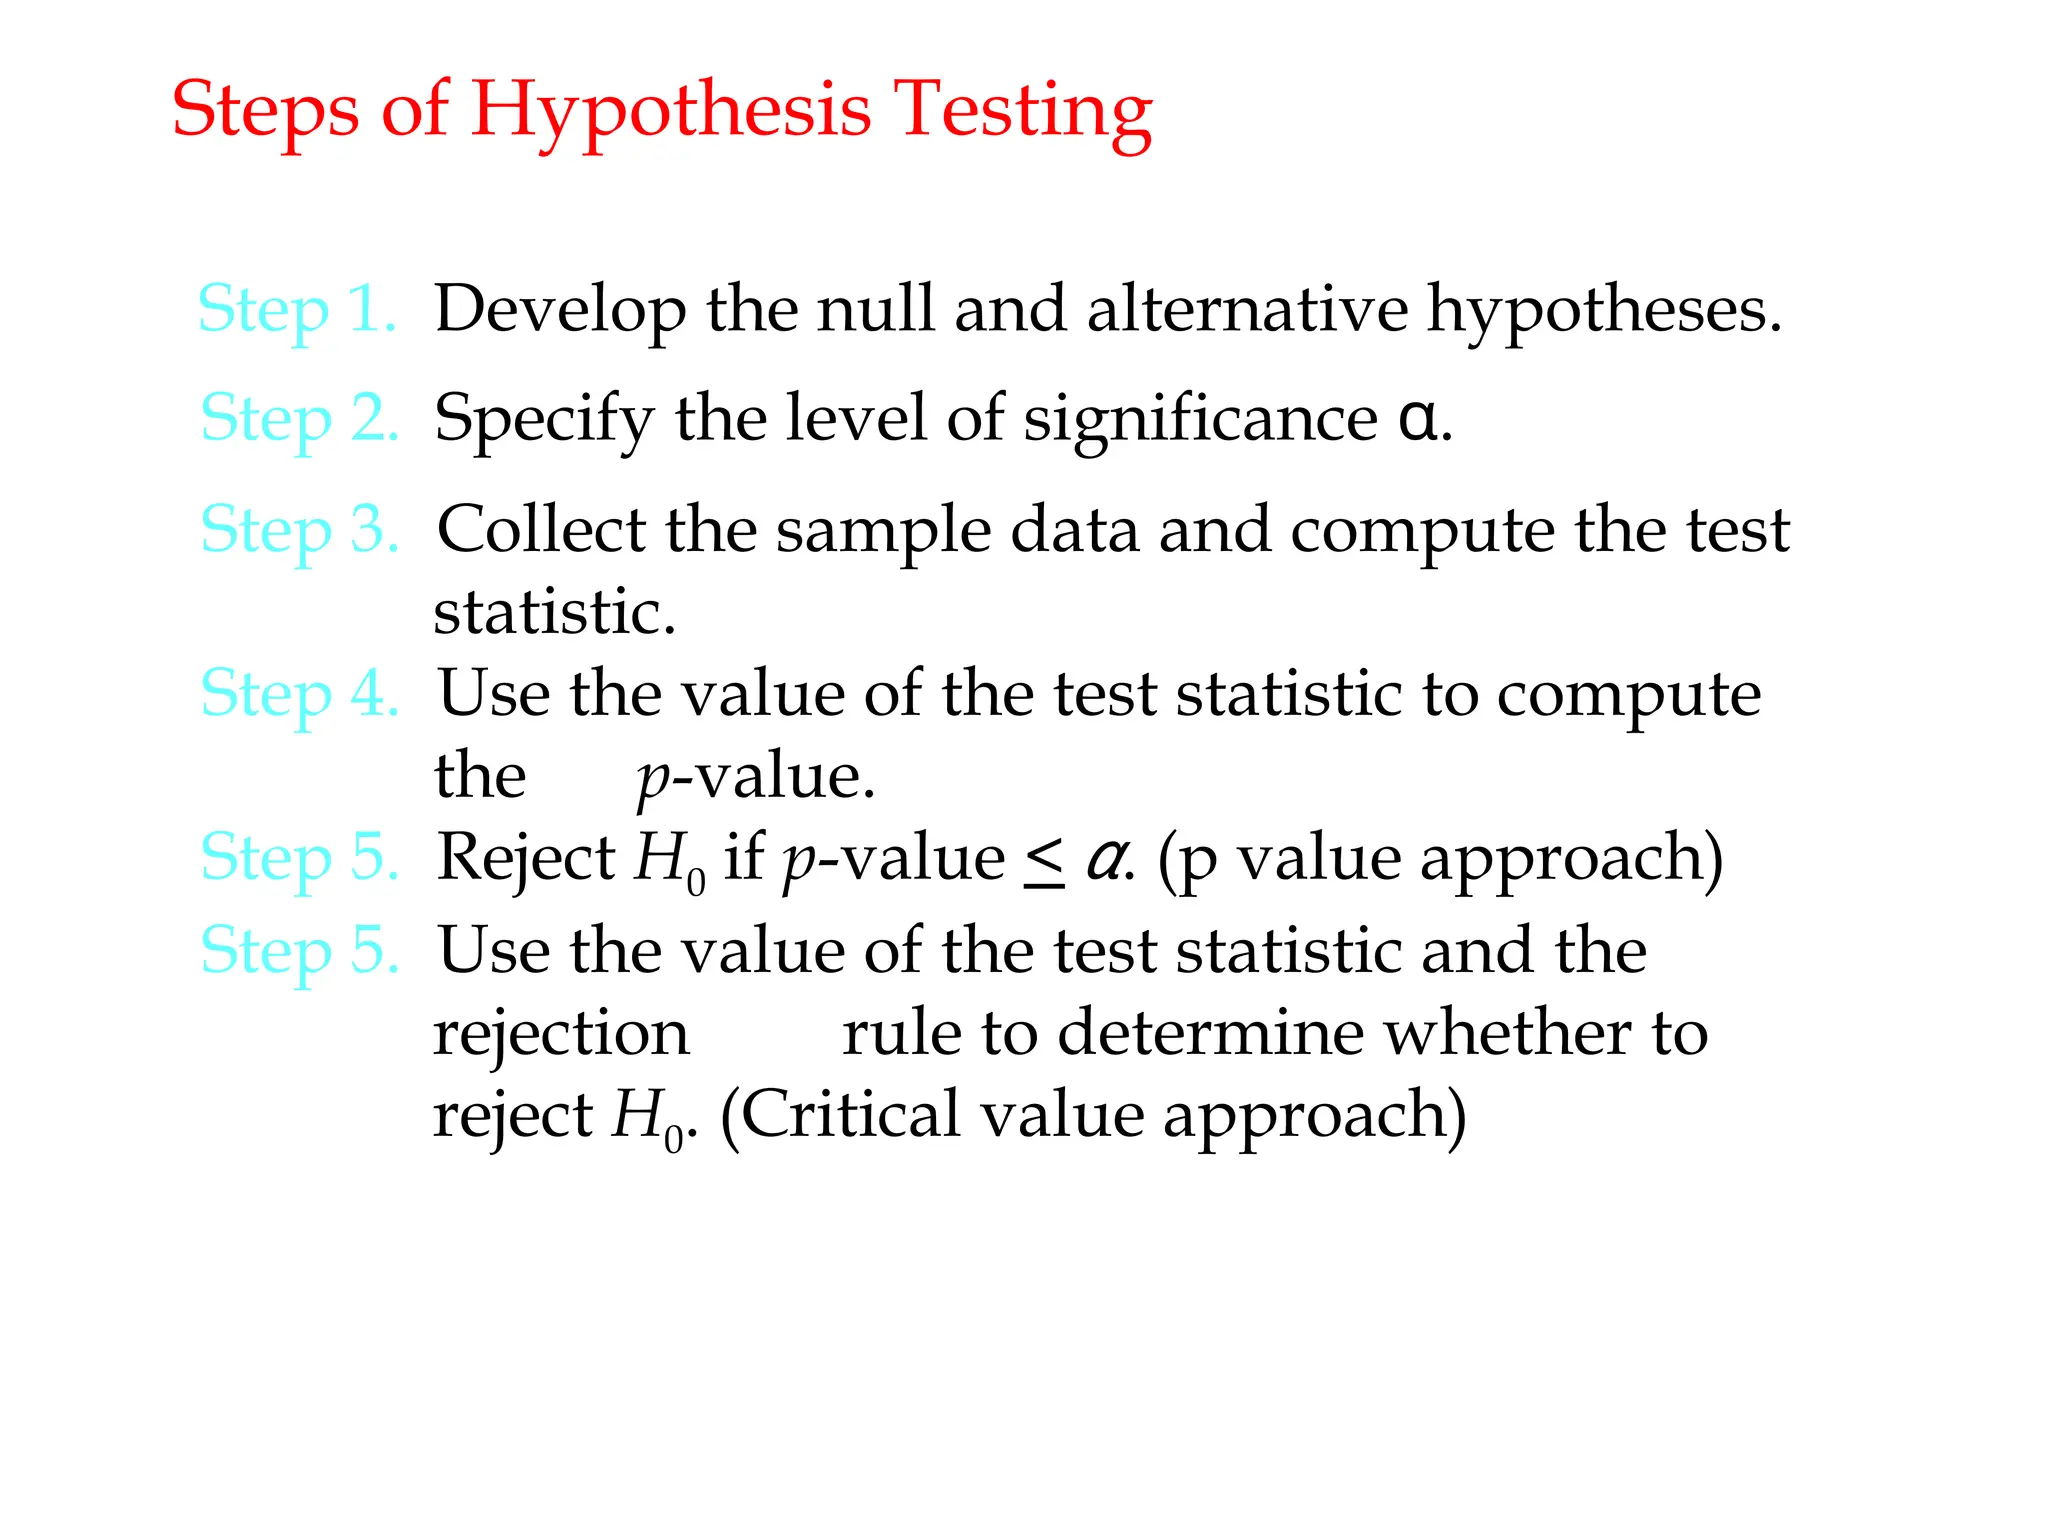
Steps of HypothesisTesting
Step 1. Develop the null and alternative hypotheses.
Step 2. Specify the level of significance α.
Step 3. Collect the sample data and compute the test
statistic.
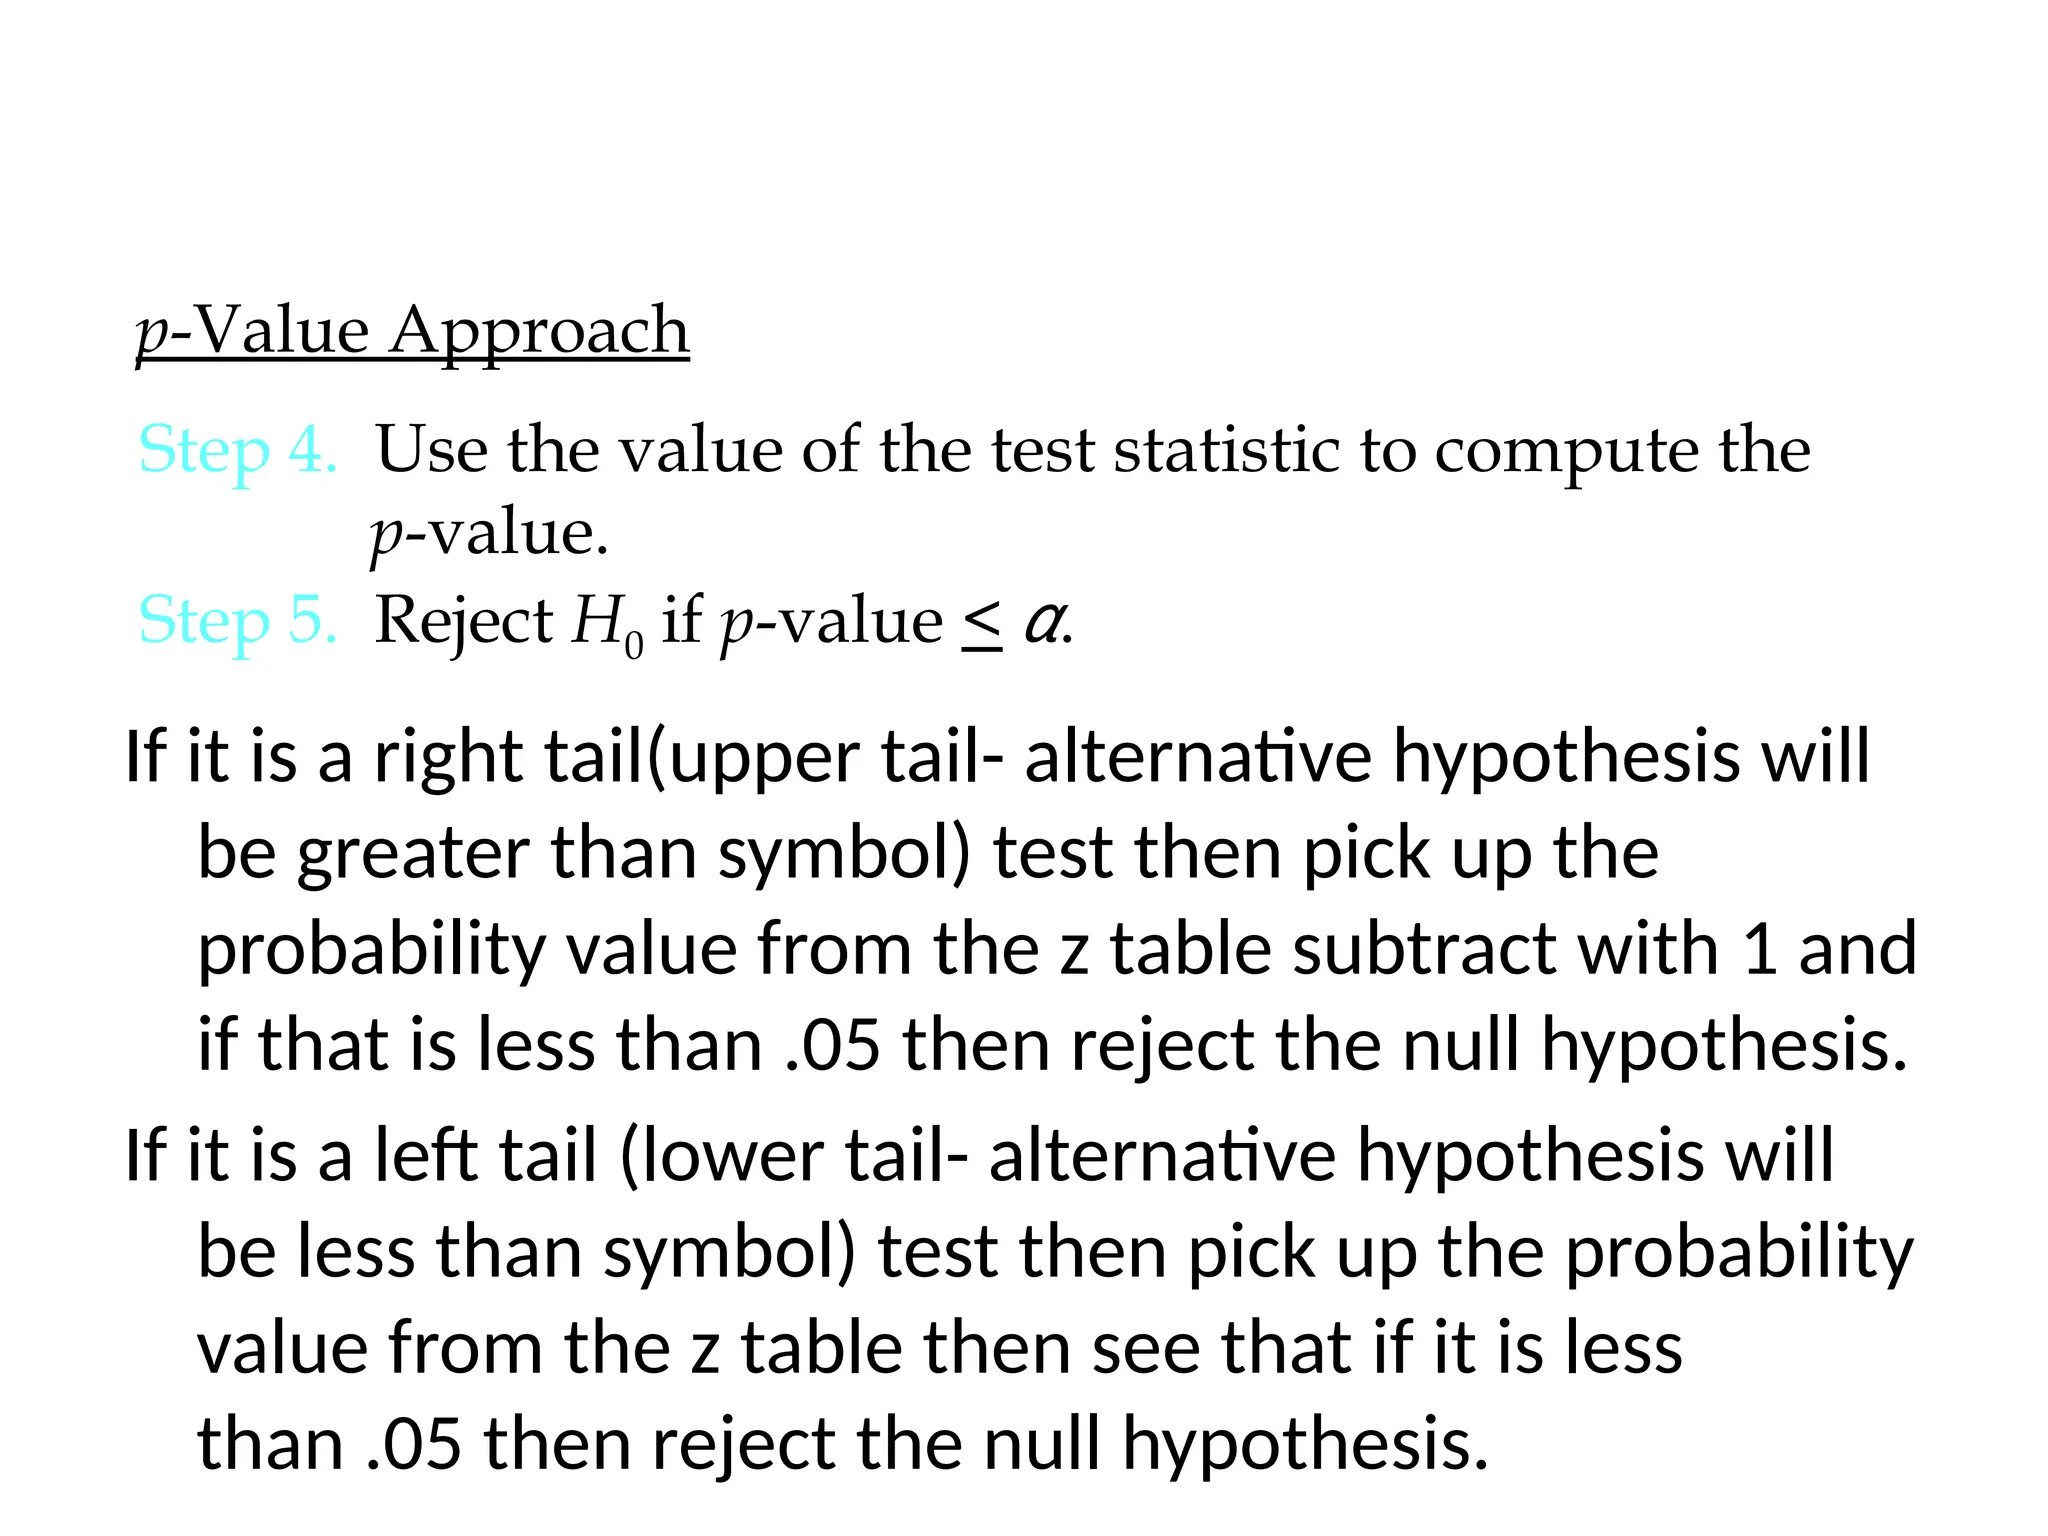
Step 4. Use the value of the test statistic to compute
the p-value.
Step 5. Reject H0 if p-value < α. (p value approach)
Step 5. Use the value of the test statistic and the
rejection rule to determine whether to
reject H0. (Critical value approach)
17.
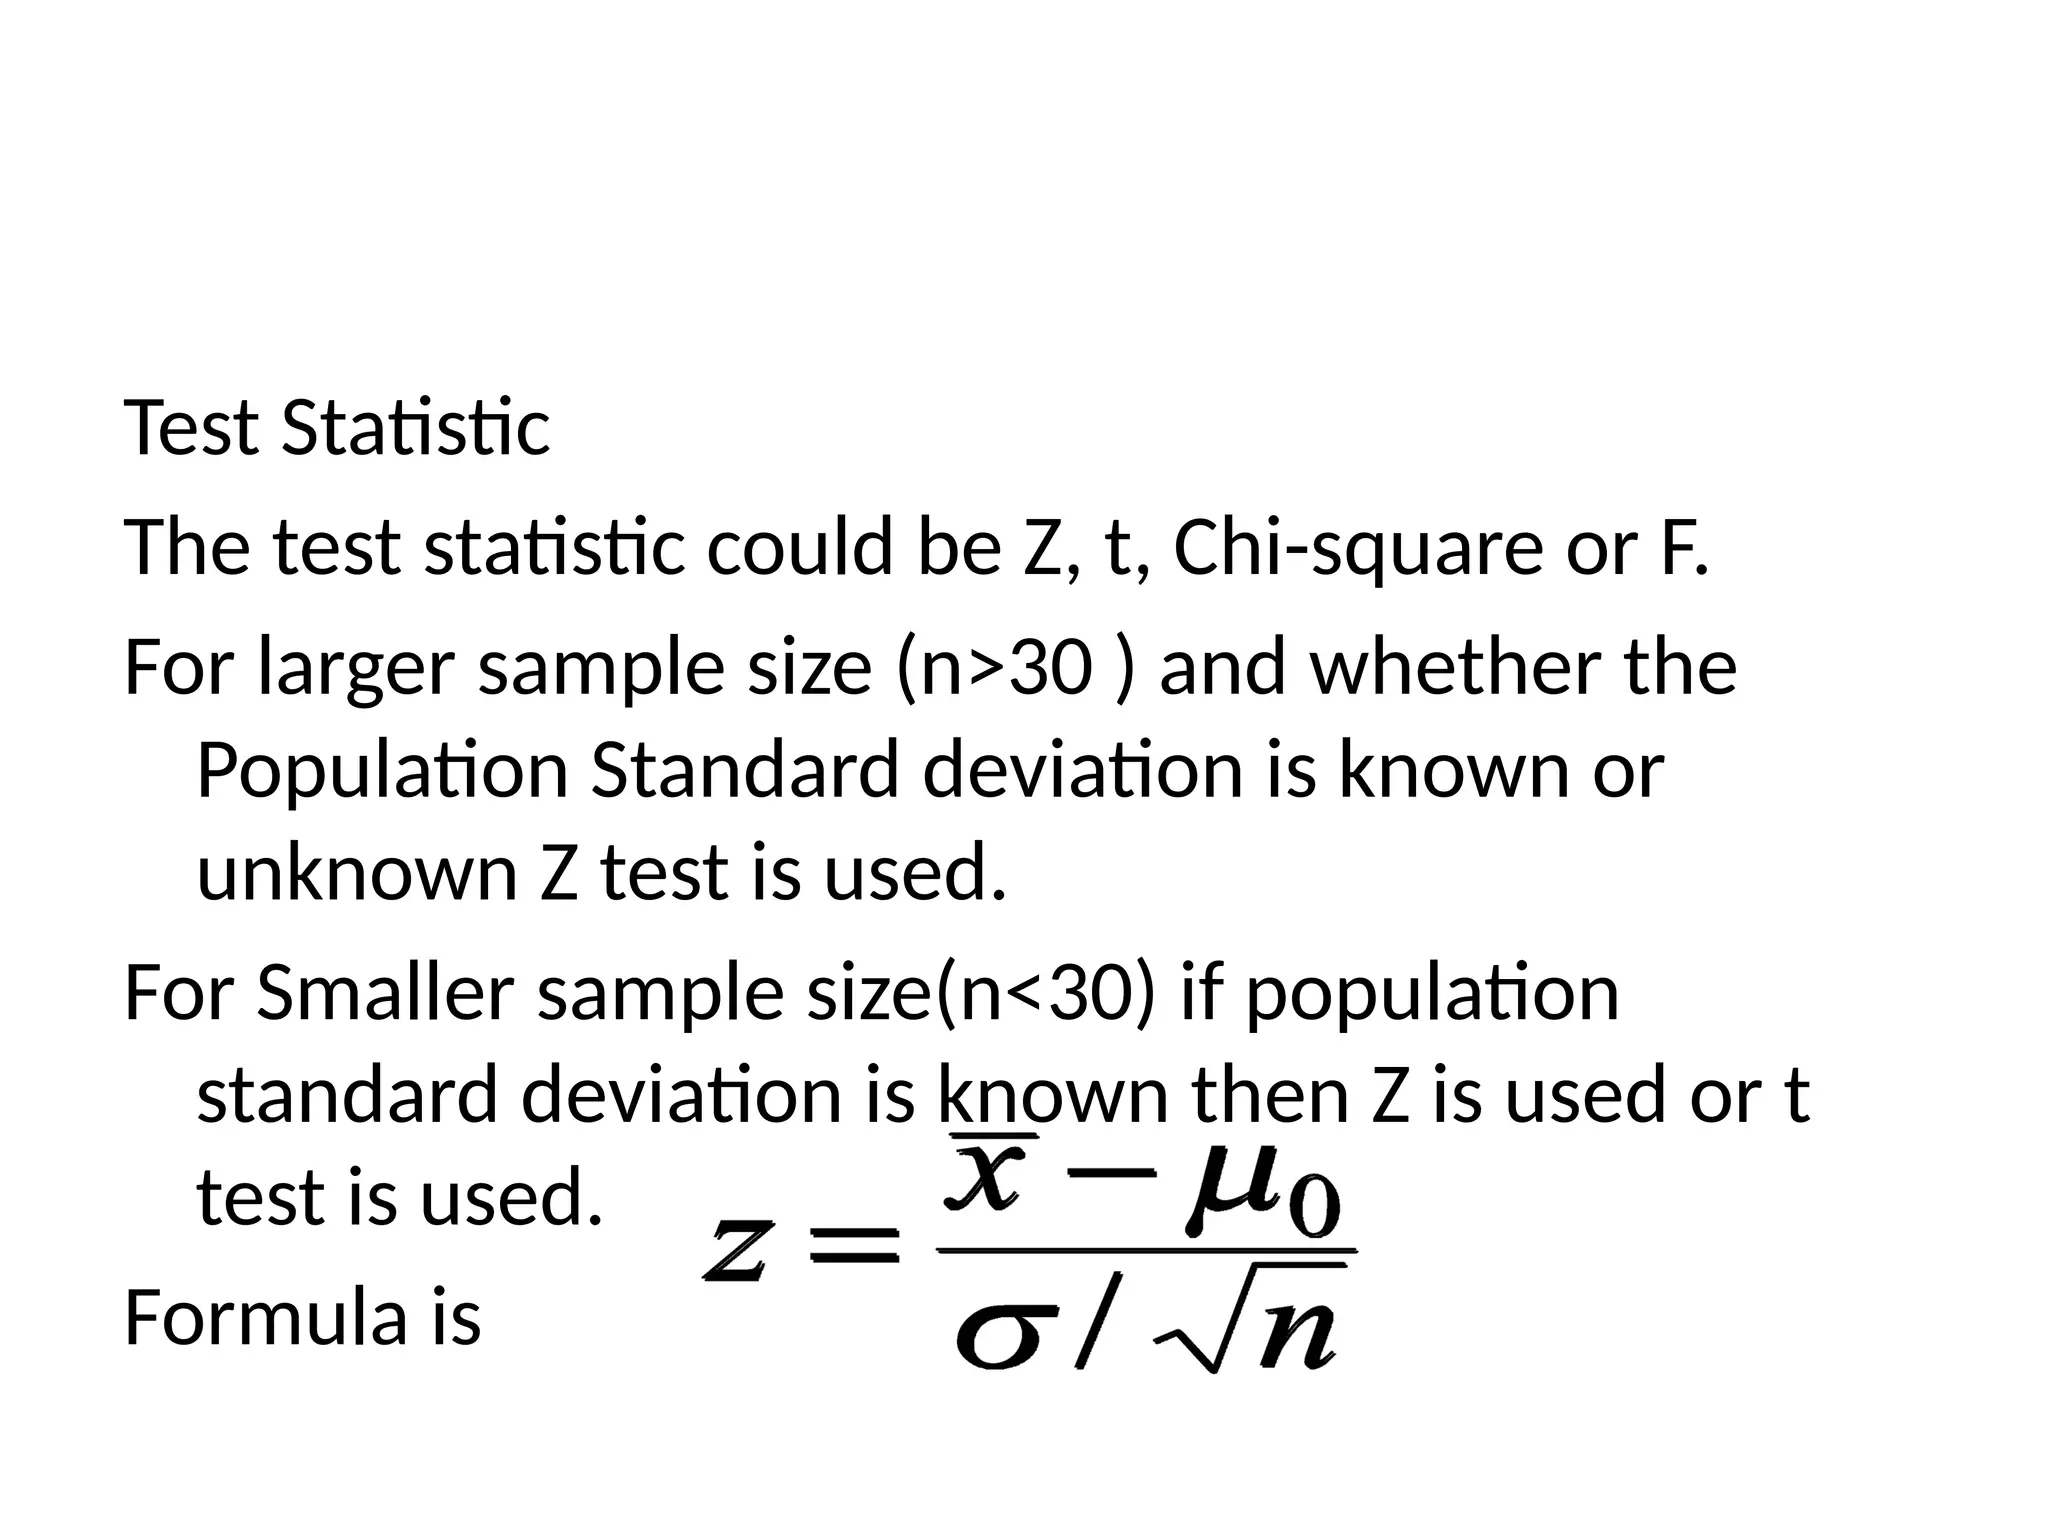
Test Statistic
The teststatistic could be Z, t, Chi-square or F.
For larger sample size (n>30 ) and whether the
Population Standard deviation is known or
unknown Z test is used.
For Smaller sample size(n<30) if population
standard deviation is known then Z is used or t
test is used.
Formula is
18.
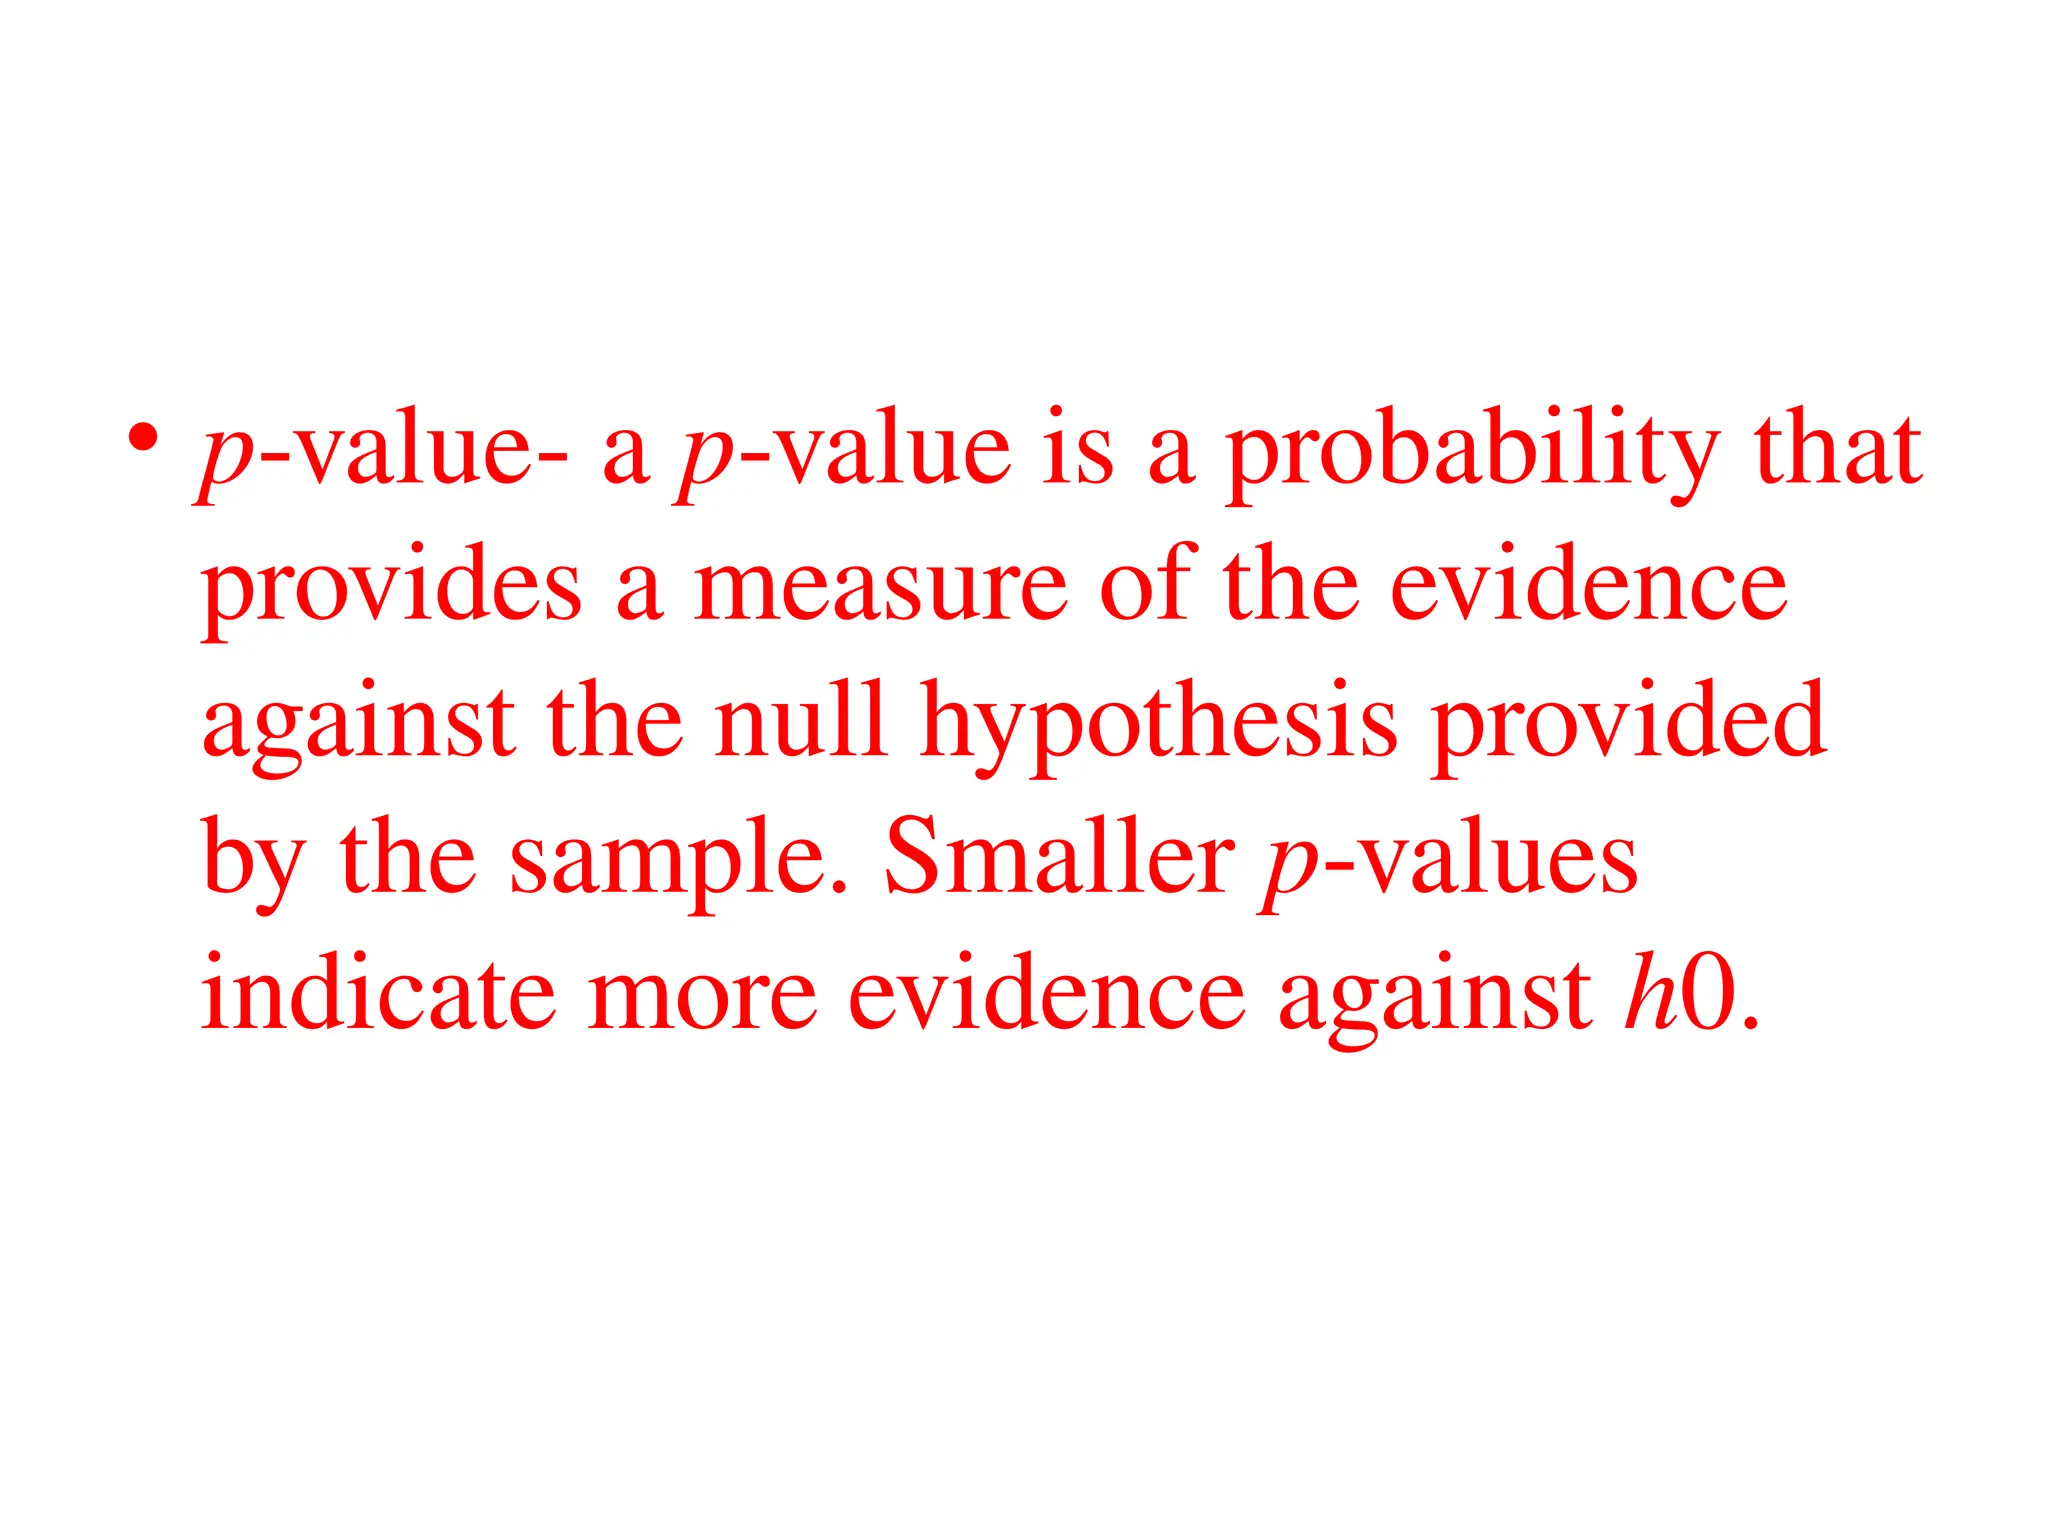
• p-value- ap-value is a probability that
provides a measure of the evidence
against the null hypothesis provided
by the sample. Smaller p-values
indicate more evidence against h0.
19.
If it isa right tail(upper tail- alternative hypothesis will
be greater than symbol) test then pick up the
probability value from the z table subtract with 1 and
if that is less than .05 then reject the null hypothesis.
If it is a left tail (lower tail- alternative hypothesis will
be less than symbol) test then pick up the probability
value from the z table then see that if it is less
than .05 then reject the null hypothesis.
p-Value Approach
Step 4. Use the value of the test statistic to compute the
p-value.
Step 5. Reject H0 if p-value < α.
20.
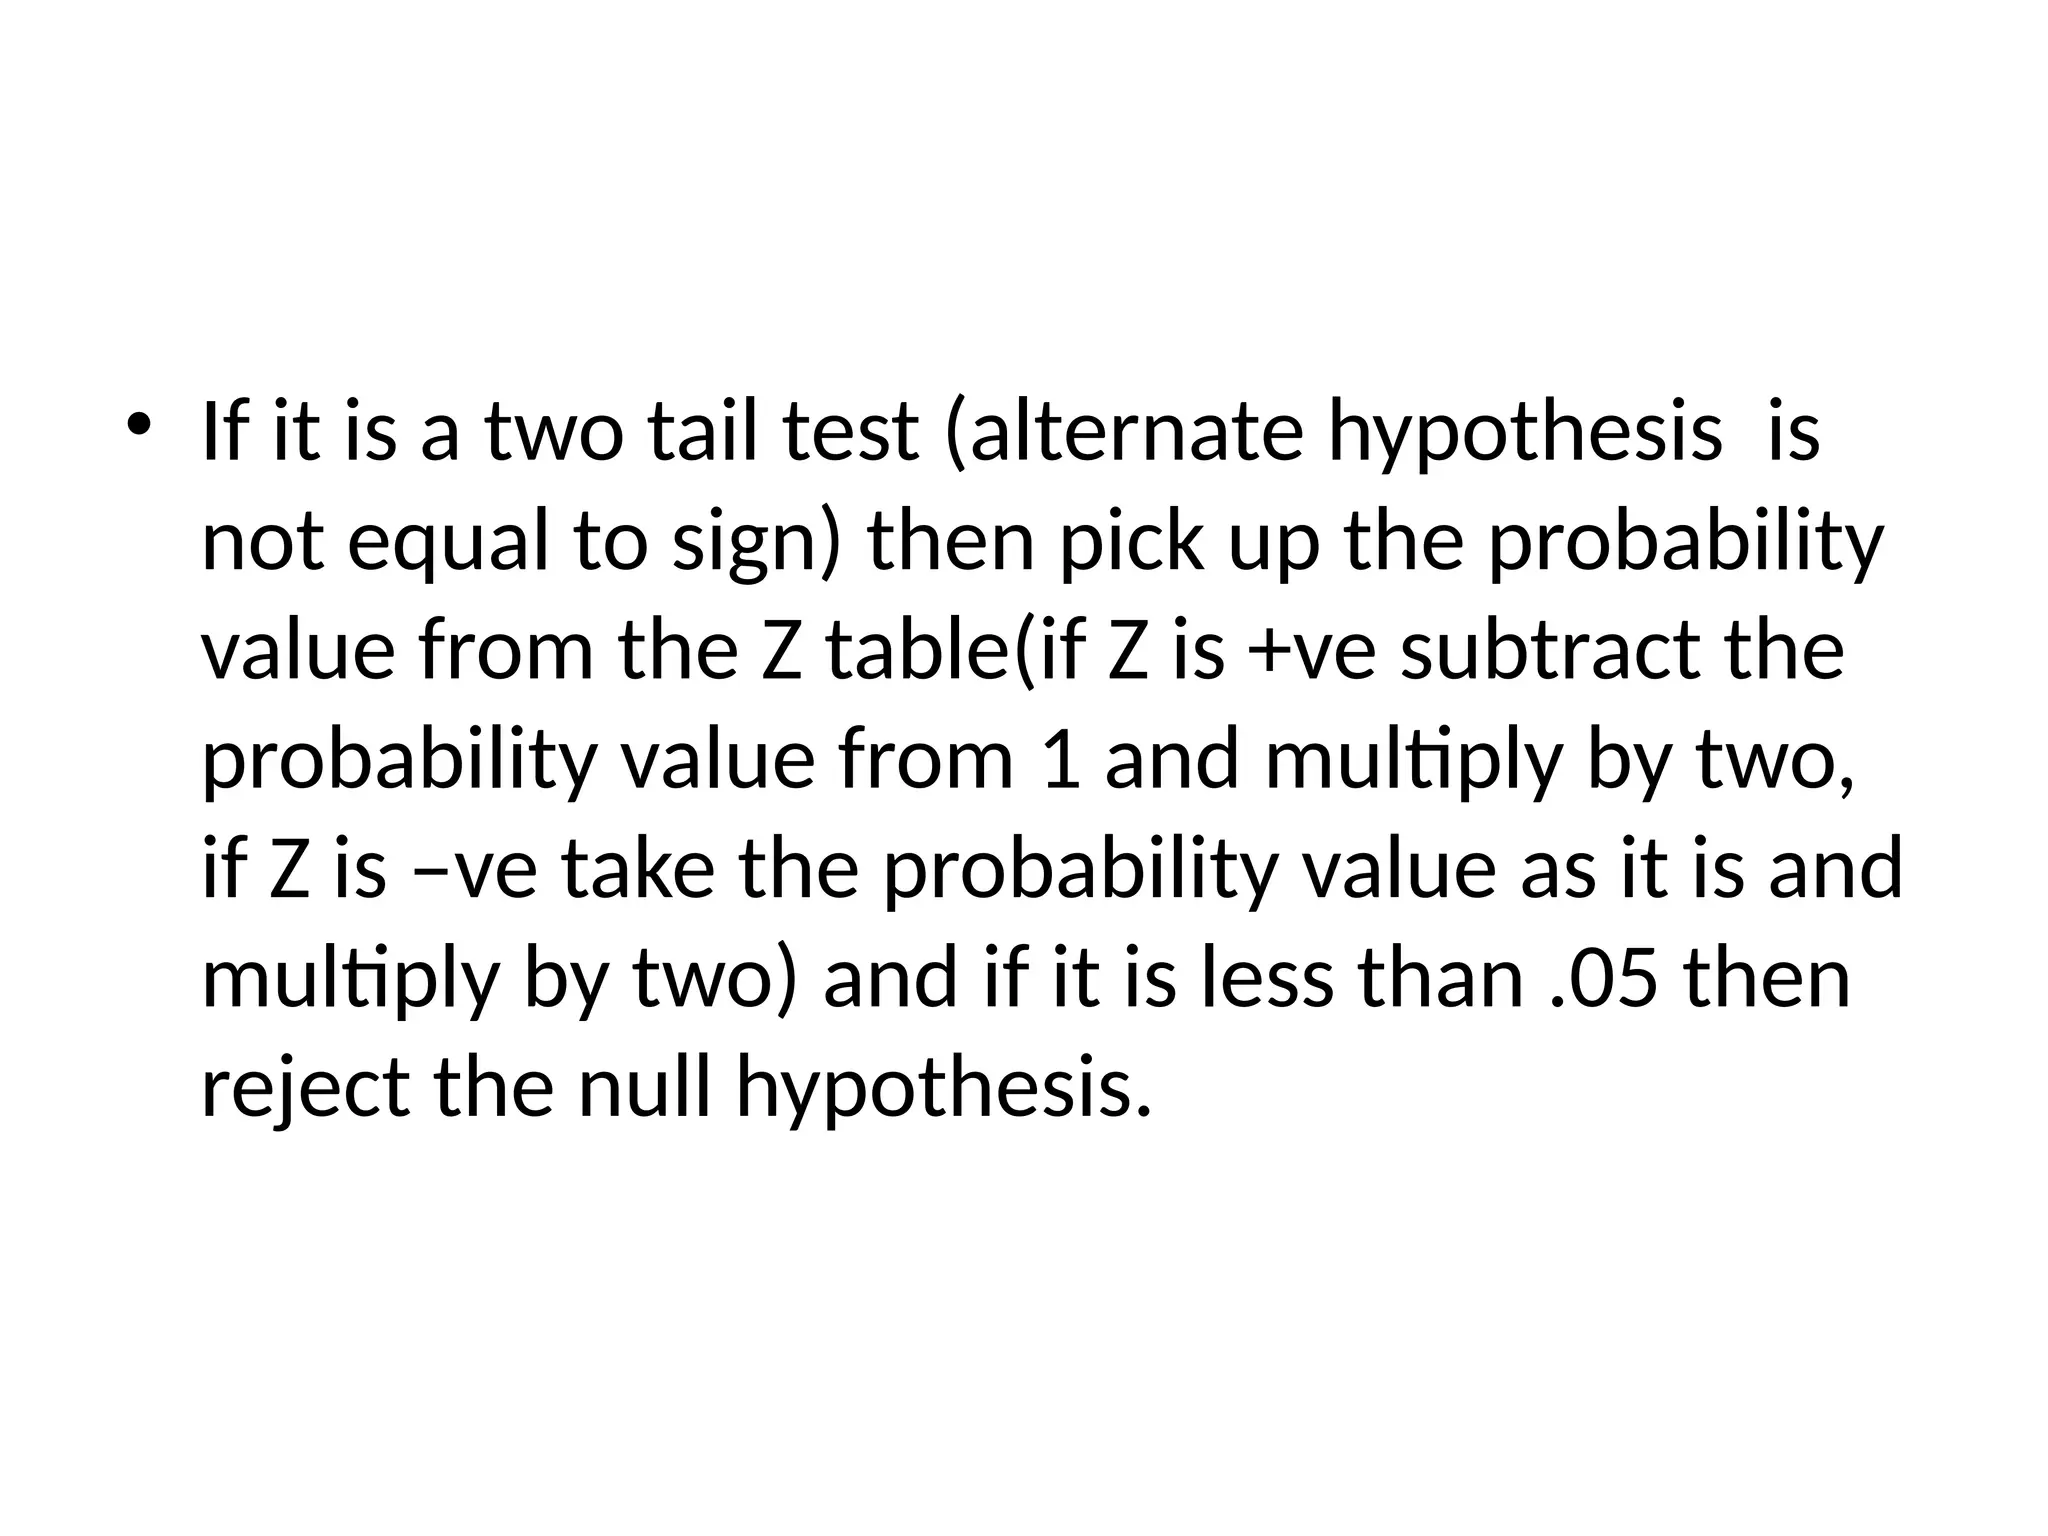
• If itis a two tail test (alternate hypothesis is
not equal to sign) then pick up the probability
value from the Z table(if Z is +ve subtract the
probability value from 1 and multiply by two,
if Z is –ve take the probability value as it is and
multiply by two) and if it is less than .05 then
reject the null hypothesis.
21.
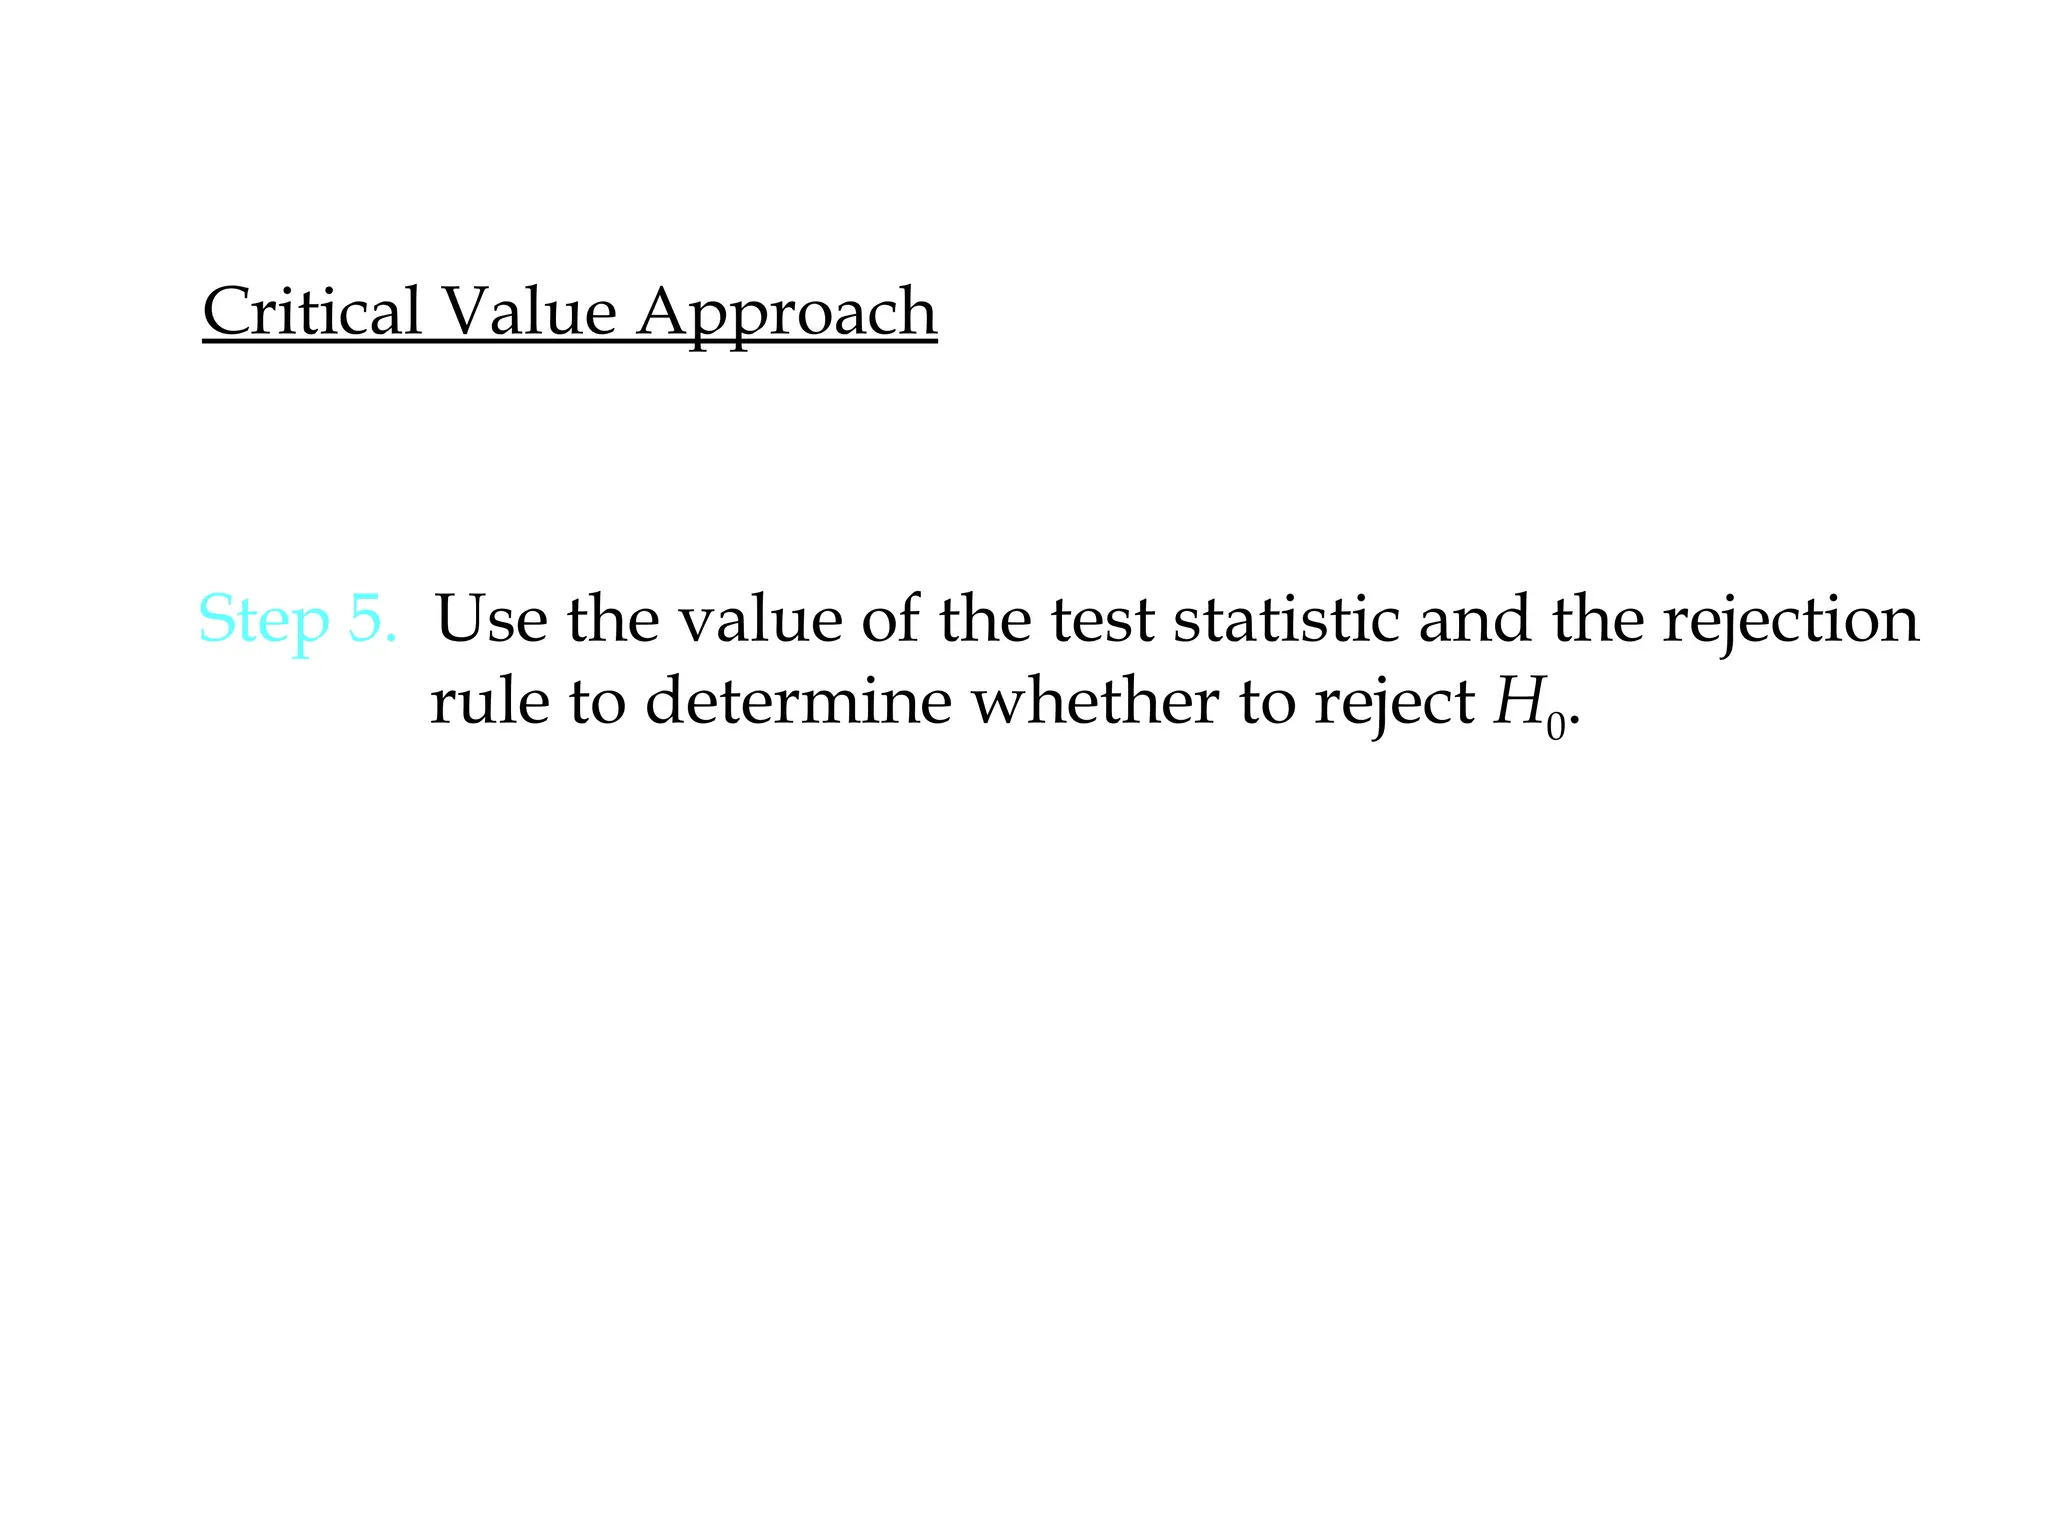
Critical Value Approach
Step5. Use the value of the test statistic and the rejection
rule to determine whether to reject H0.
22.
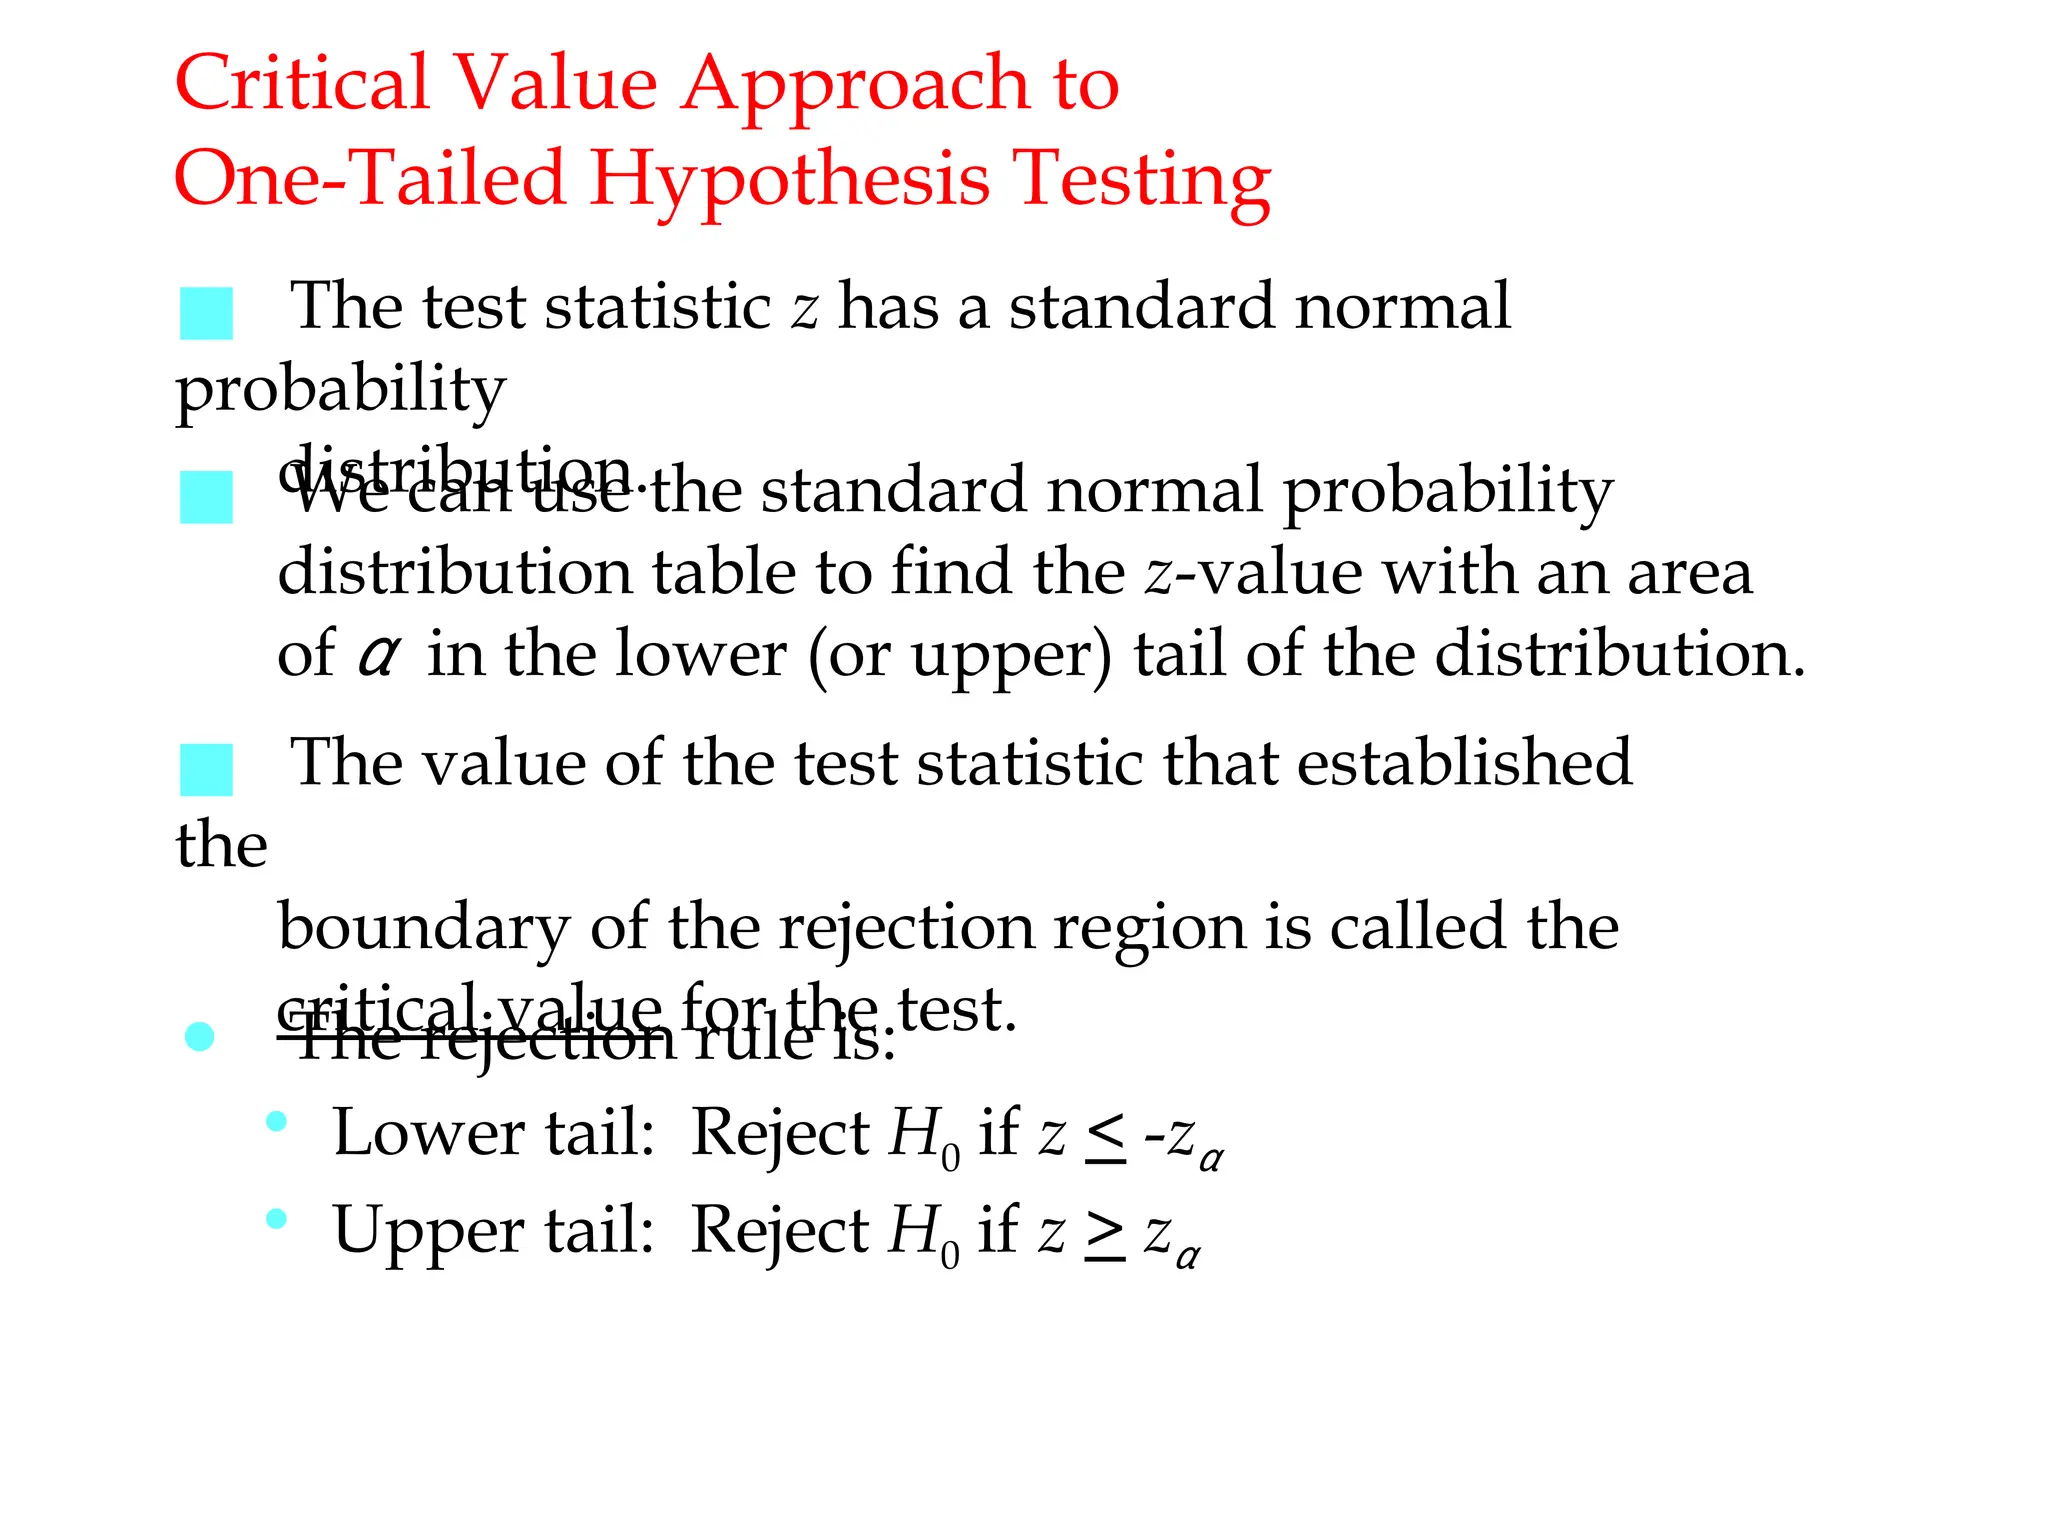
Critical Value Approachto
One-Tailed Hypothesis Testing
■ The test statistic z has a standard normal
probability
distribution.
■ We can use the standard normal probability
distribution table to find the z-value with an area
of α in the lower (or upper) tail of the distribution.
■ The value of the test statistic that established
the
boundary of the rejection region is called the
critical value for the test.
● The rejection rule is:
• Lower tail: Reject H0 if z < -zα
• Upper tail: Reject H0 if z > zα
23.
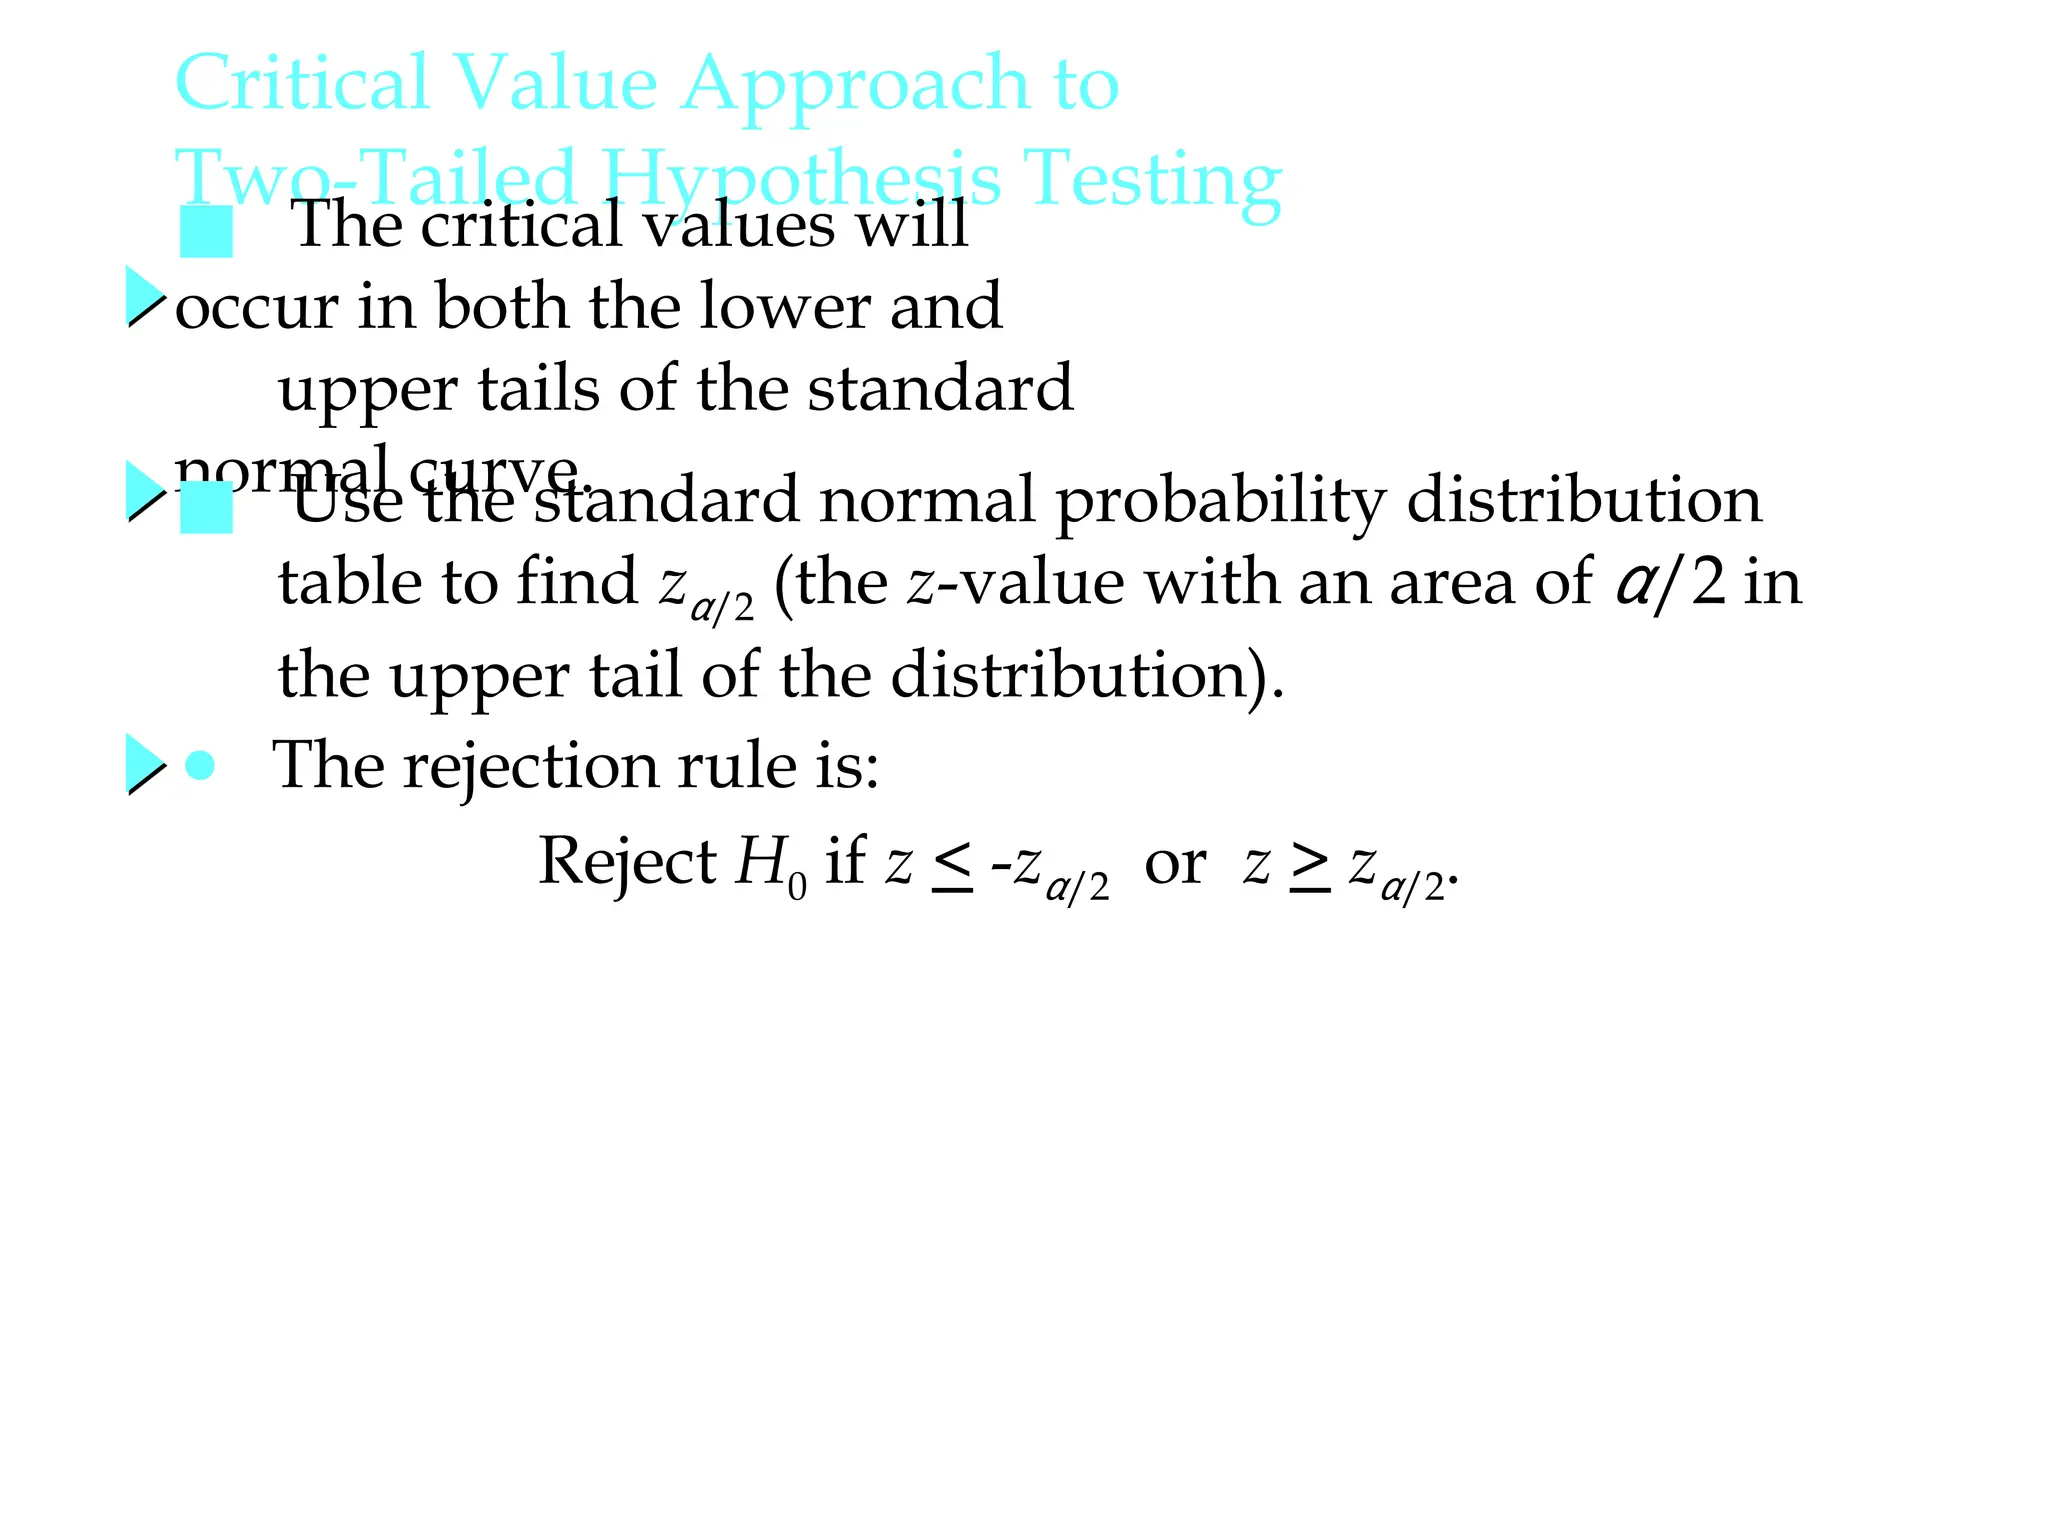
Critical Value Approachto
Two-Tailed Hypothesis Testing
■ The critical values will
occur in both the lower and
upper tails of the standard
normal curve.
● The rejection rule is:
Reject H0 if z < -zα/2 or z > zα/2.
■ Use the standard normal probability distribution
table to find zα/2 (the z-value with an area of α/2 in
the upper tail of the distribution).
24.
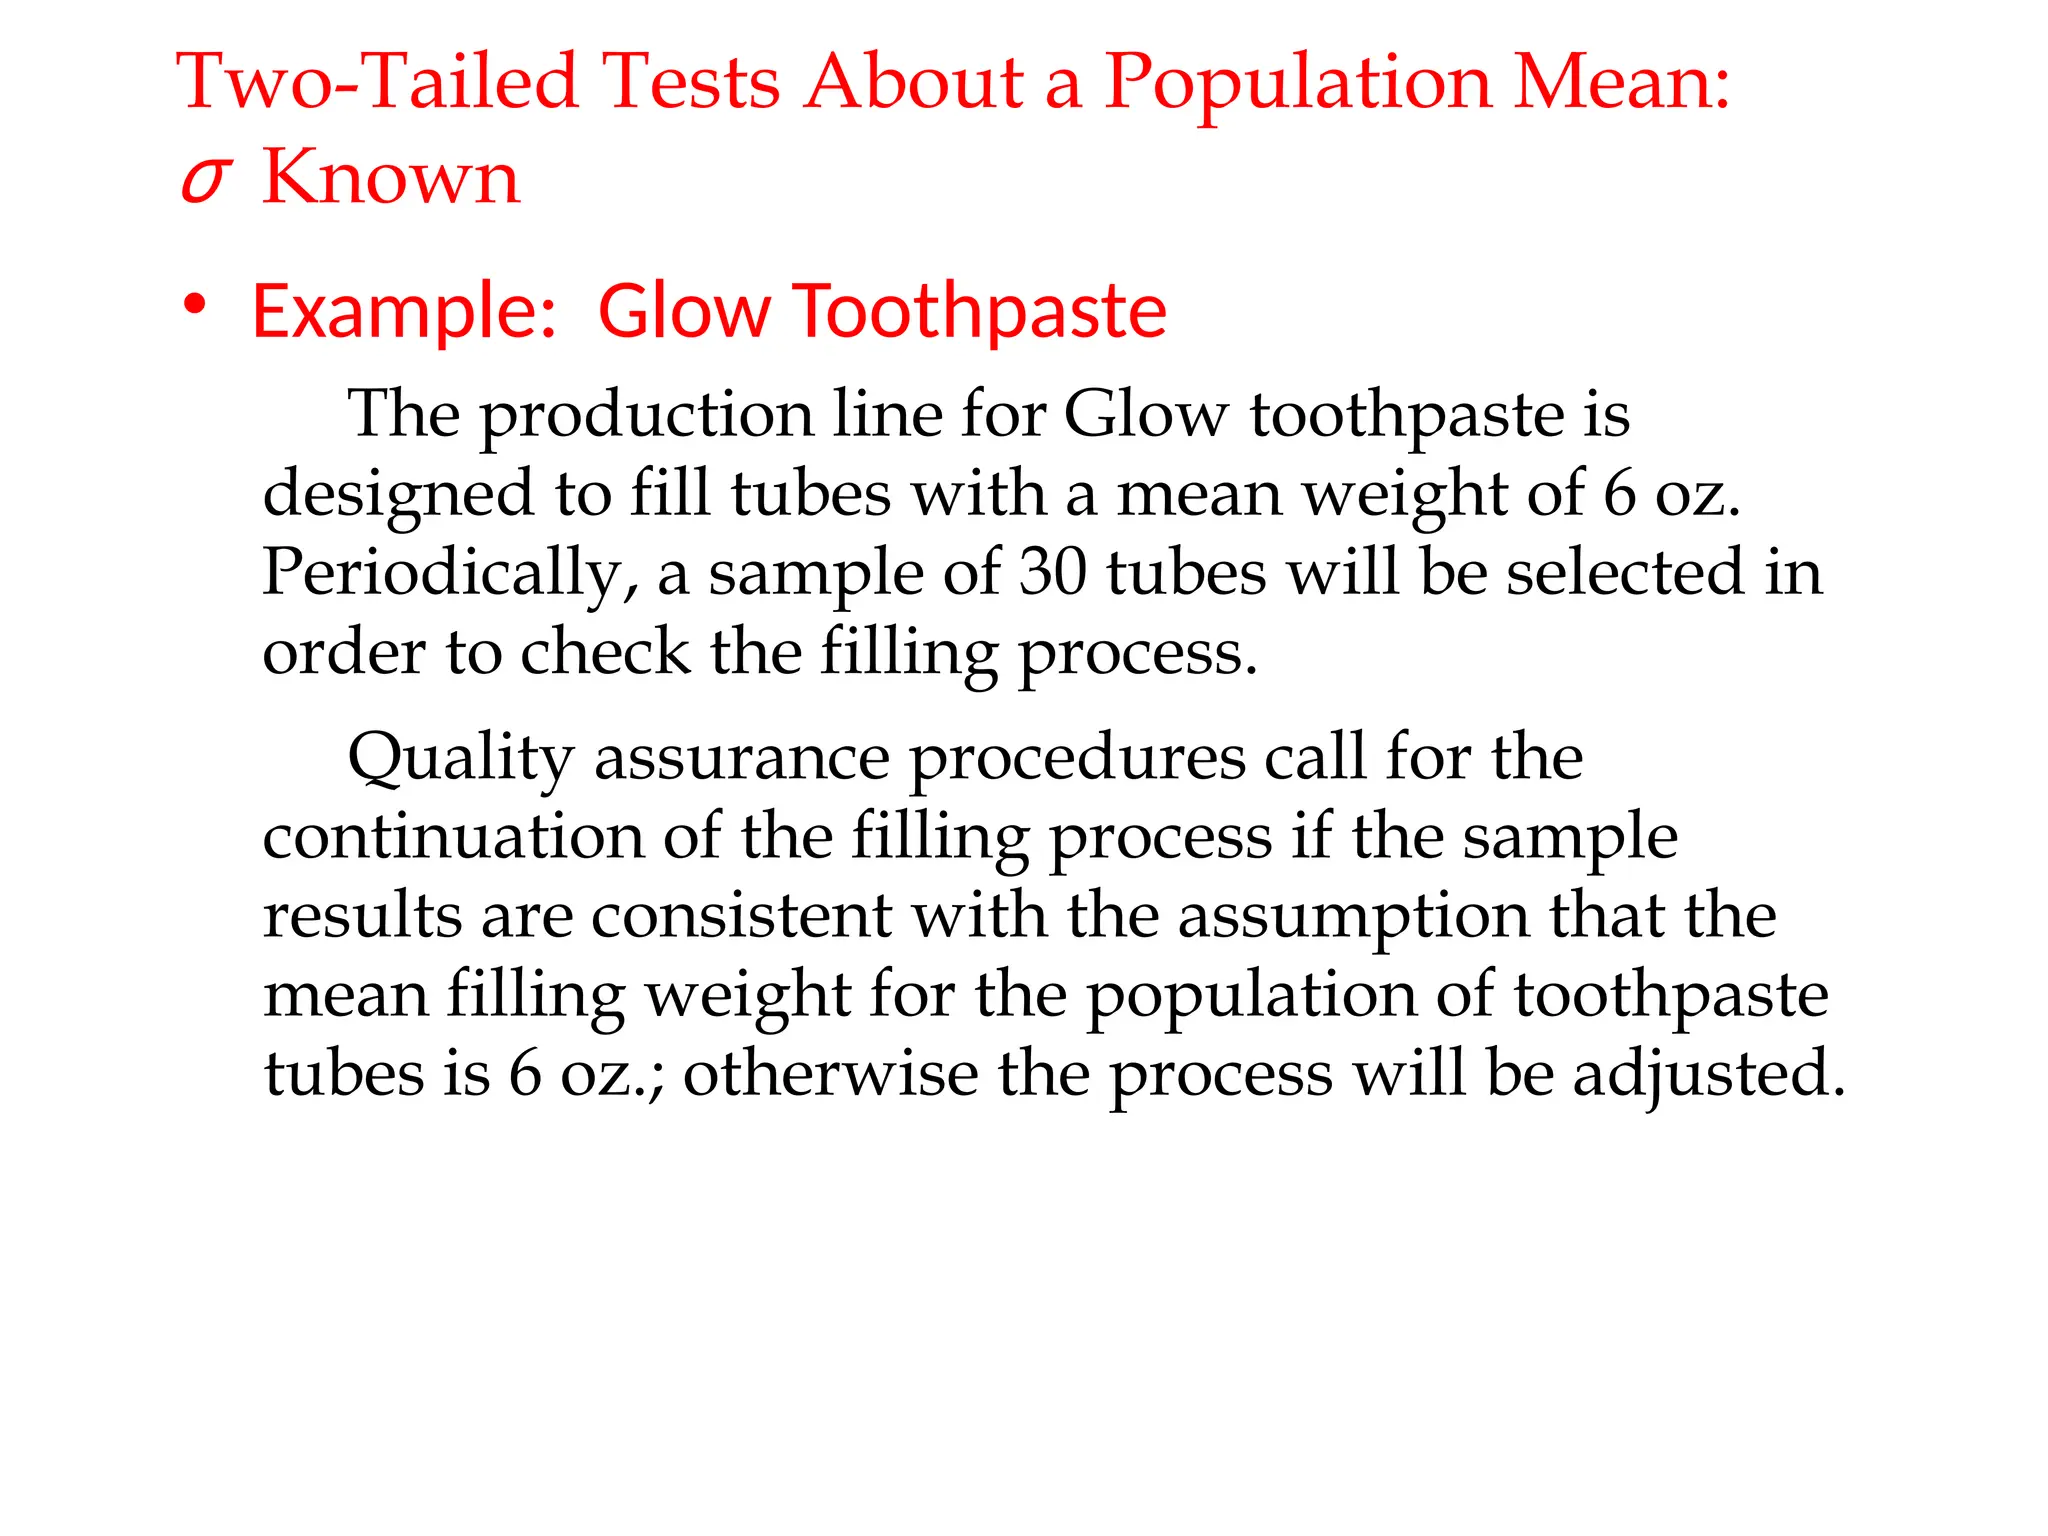
• Example: GlowToothpaste
Quality assurance procedures call for the
continuation of the filling process if the sample
results are consistent with the assumption that the
mean filling weight for the population of toothpaste
tubes is 6 oz.; otherwise the process will be adjusted.
The production line for Glow toothpaste is
designed to fill tubes with a mean weight of 6 oz.
Periodically, a sample of 30 tubes will be selected in
order to check the filling process.
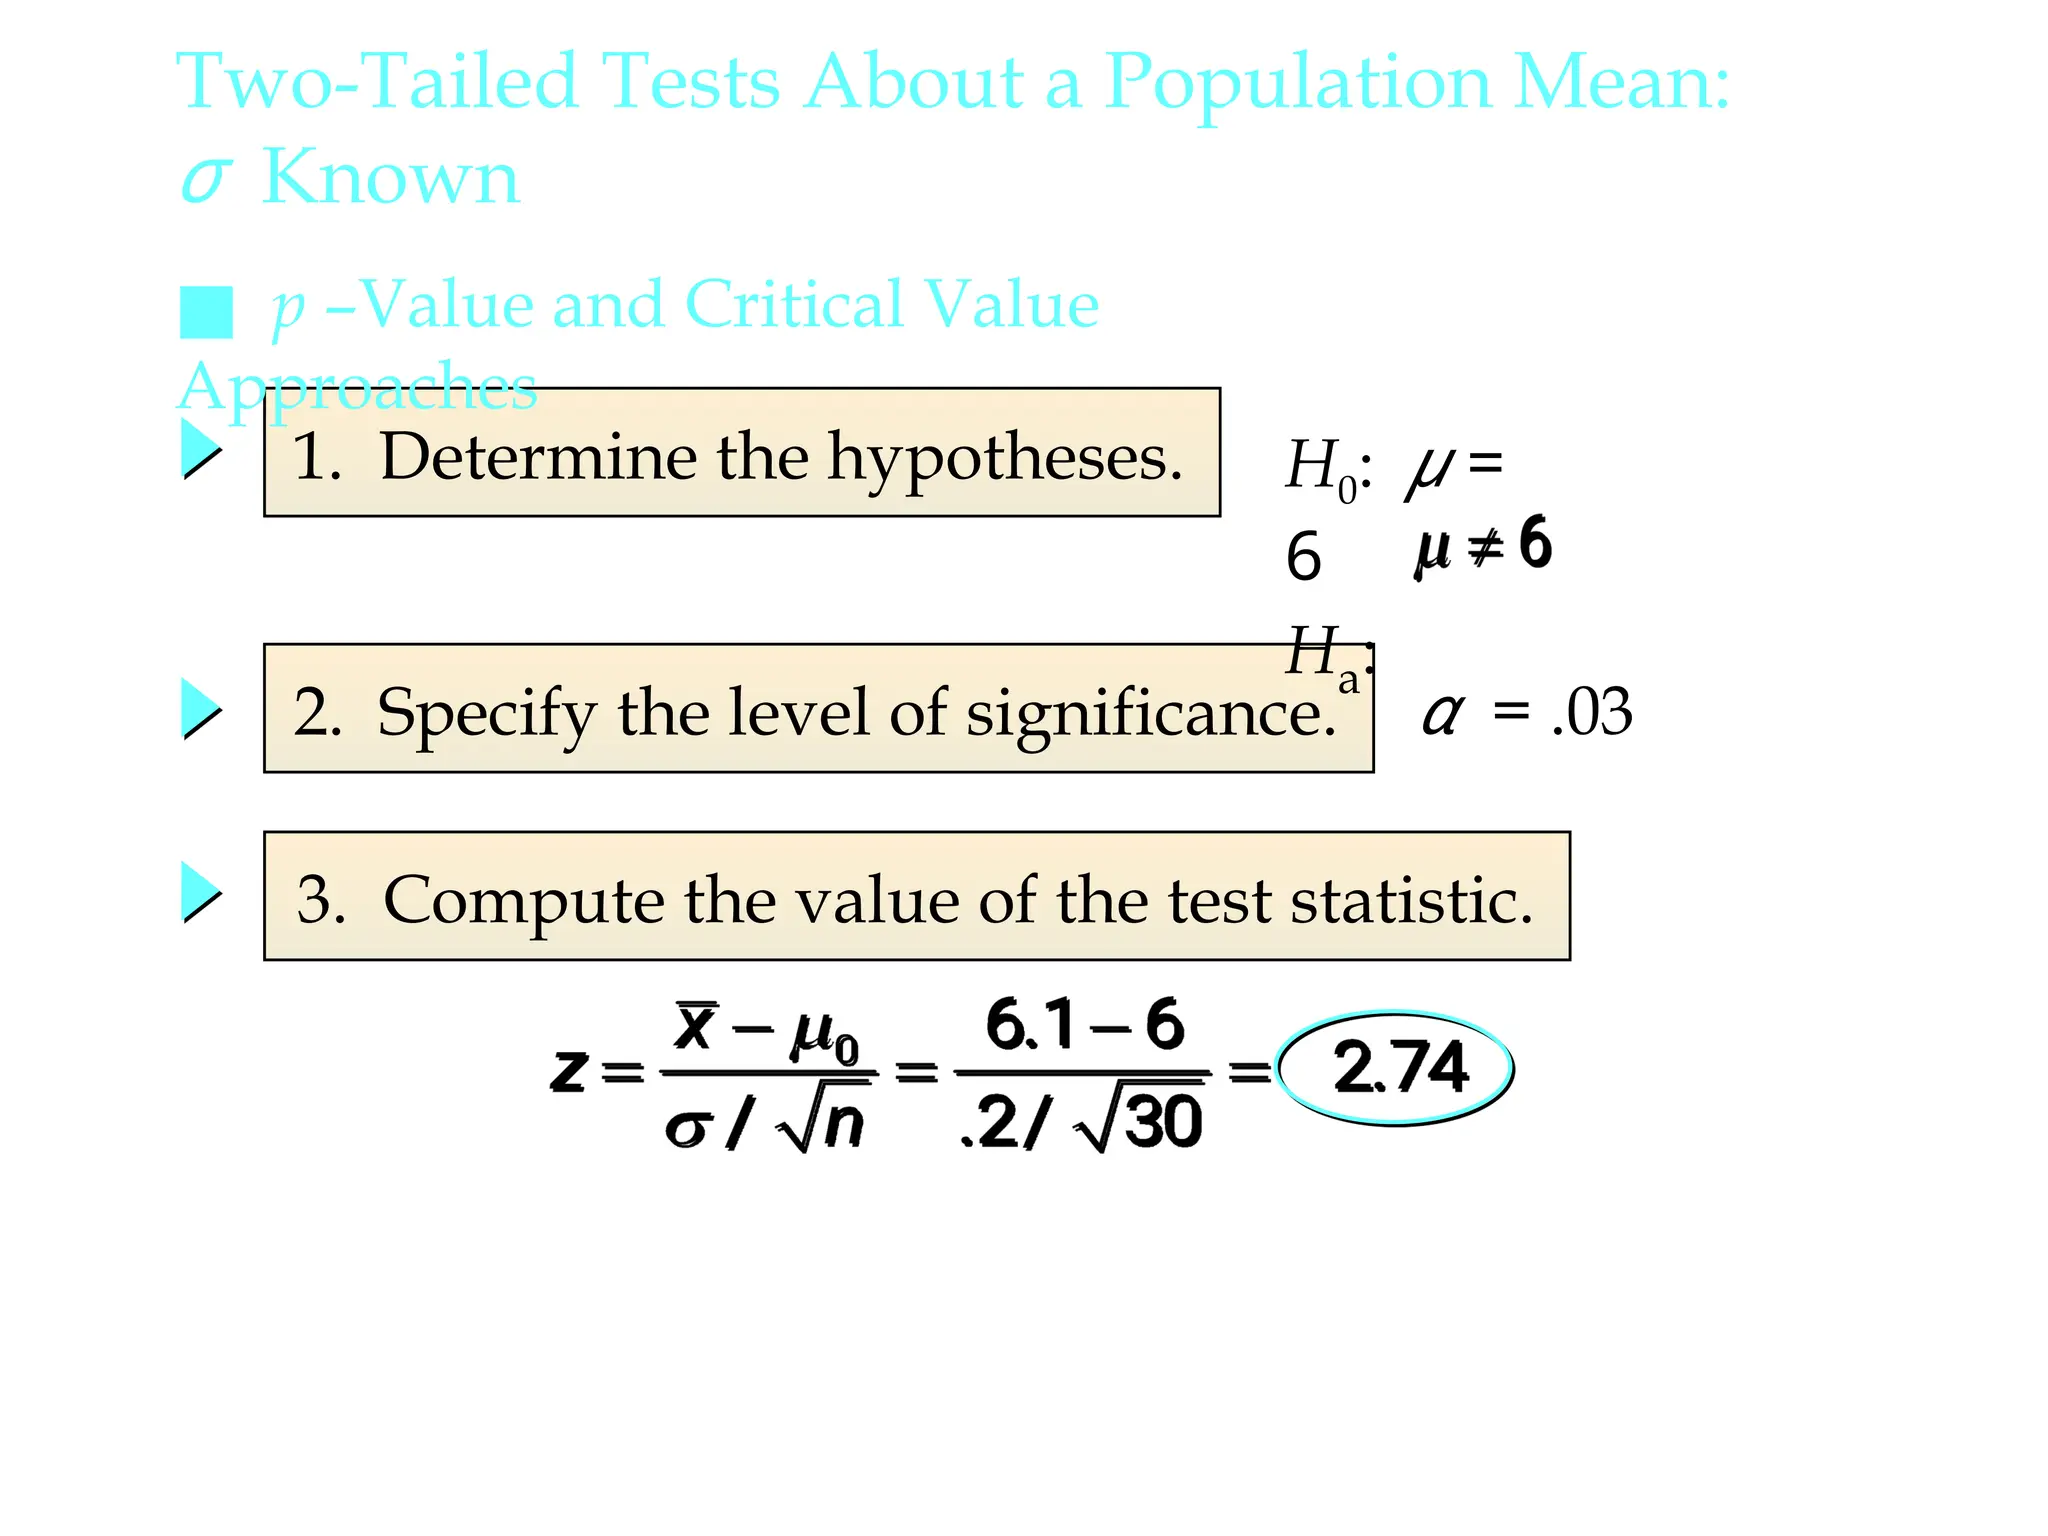
Two-Tailed Tests About a Population Mean:
σ Known
25.
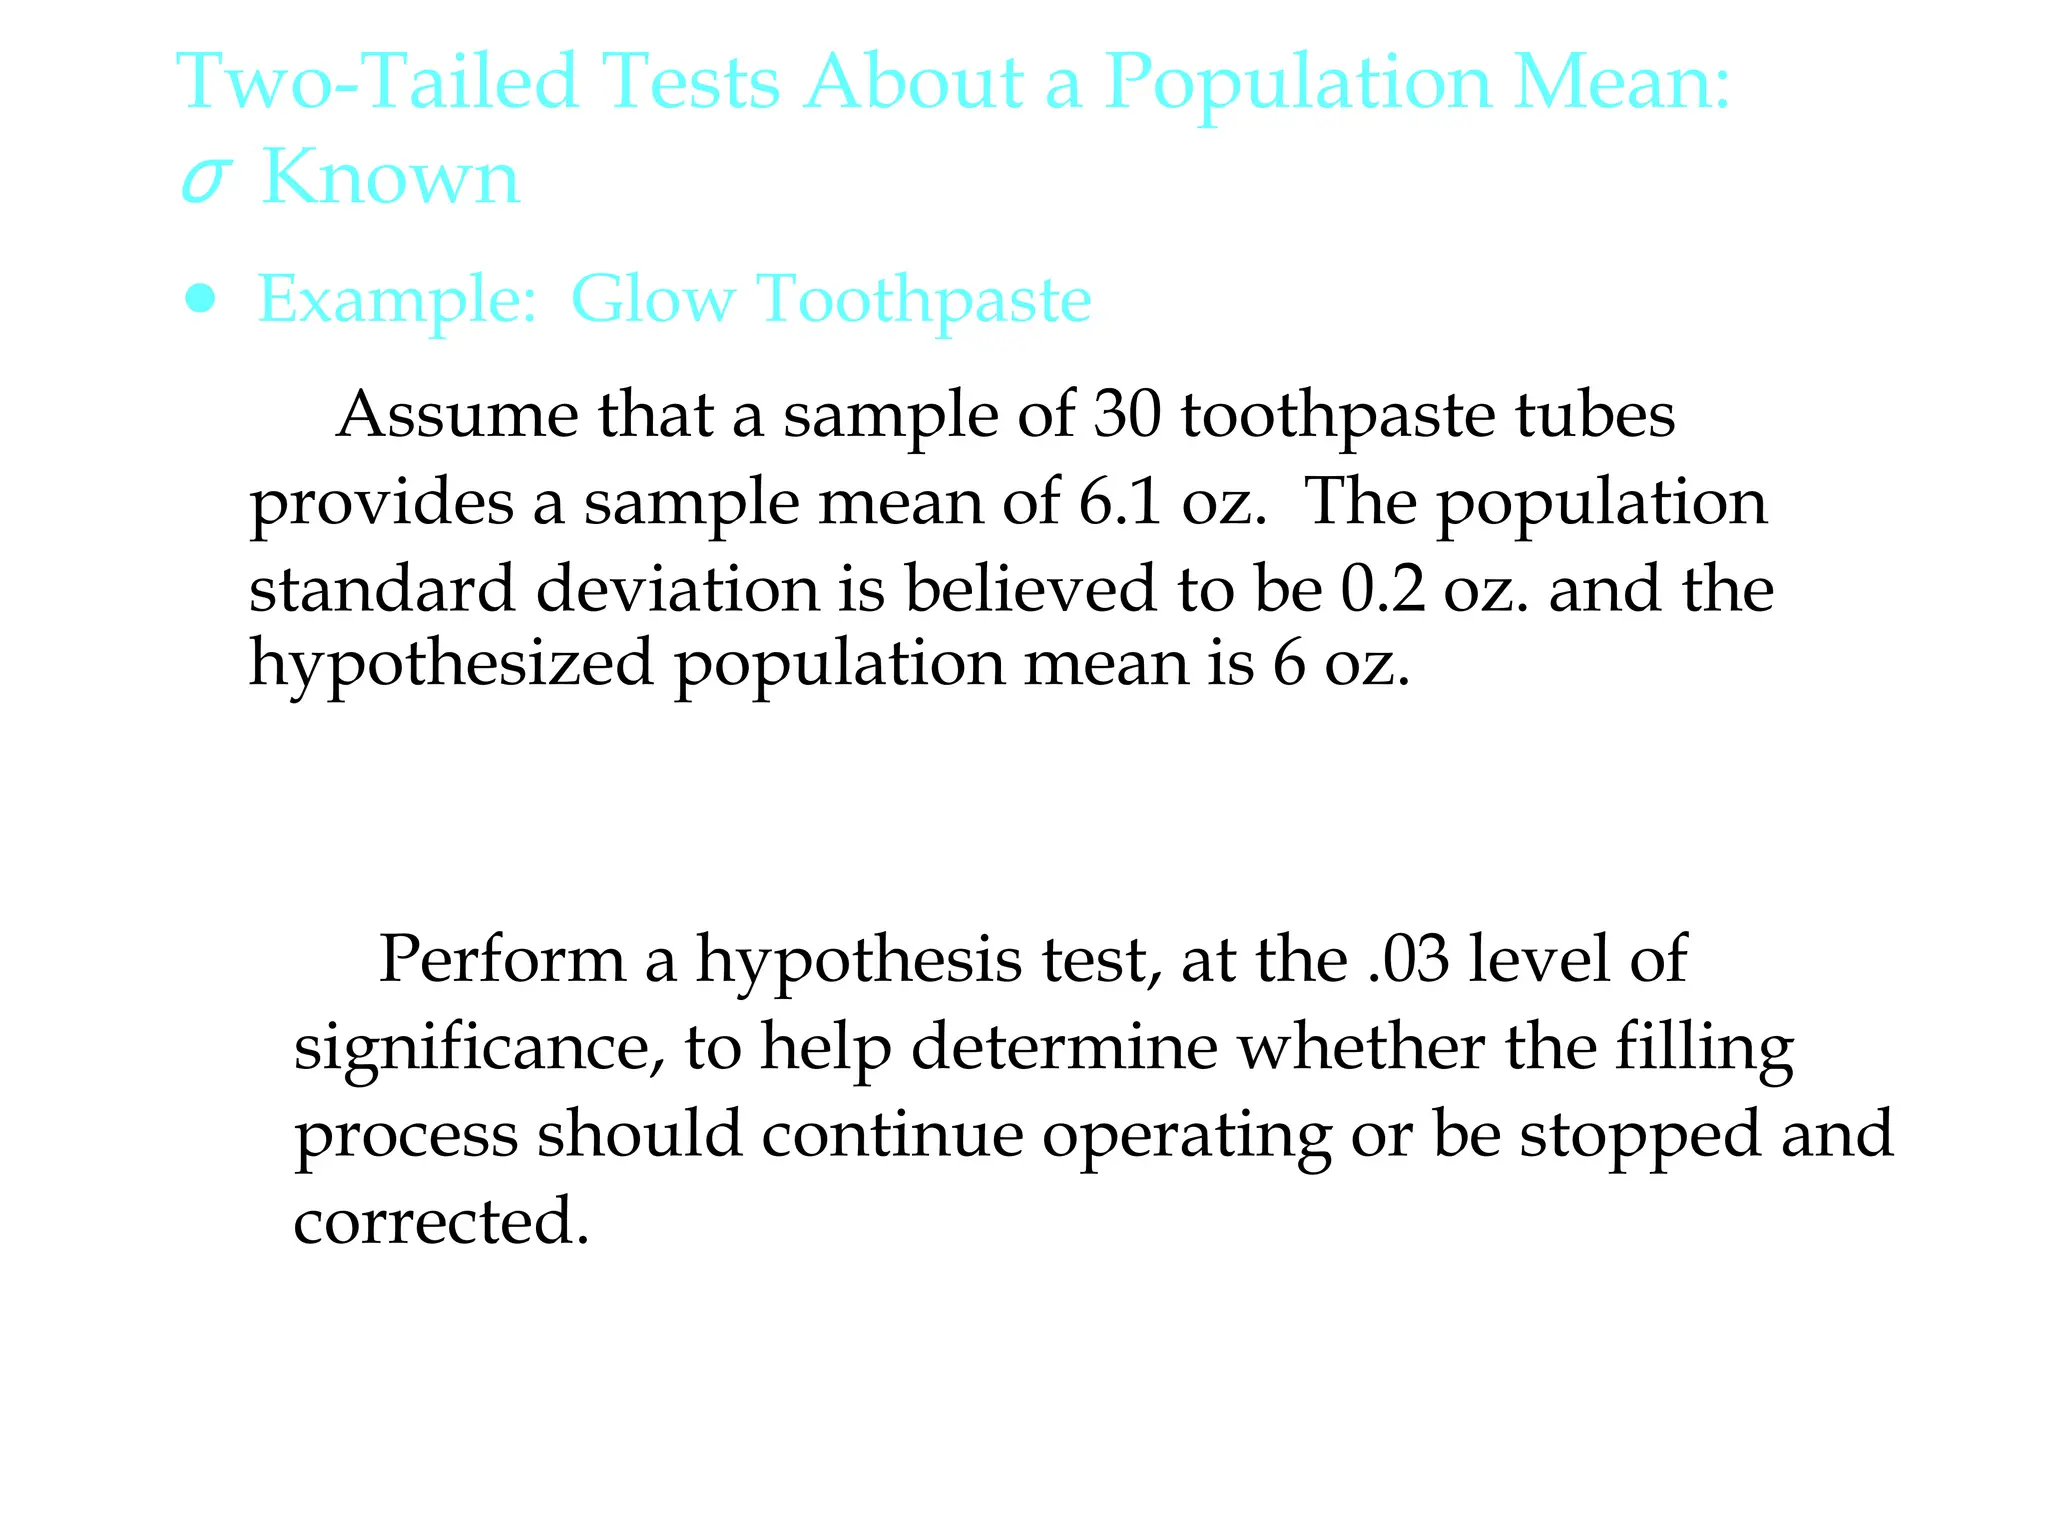
Perform a hypothesistest, at the .03 level of
significance, to help determine whether the filling
process should continue operating or be stopped and
corrected.
Assume that a sample of 30 toothpaste tubes
provides a sample mean of 6.1 oz. The population
standard deviation is believed to be 0.2 oz. and the
hypothesized population mean is 6 oz.
Two-Tailed Tests About a Population Mean:
σ Known
● Example: Glow Toothpaste
26.
1. Determine thehypotheses.
2. Specify the level of significance.
3. Compute the value of the test statistic.
α = .03
■ p –Value and Critical Value
Approaches
H0: μ =
6
Ha:
Two-Tailed Tests About a Population Mean:
σ Known
27.
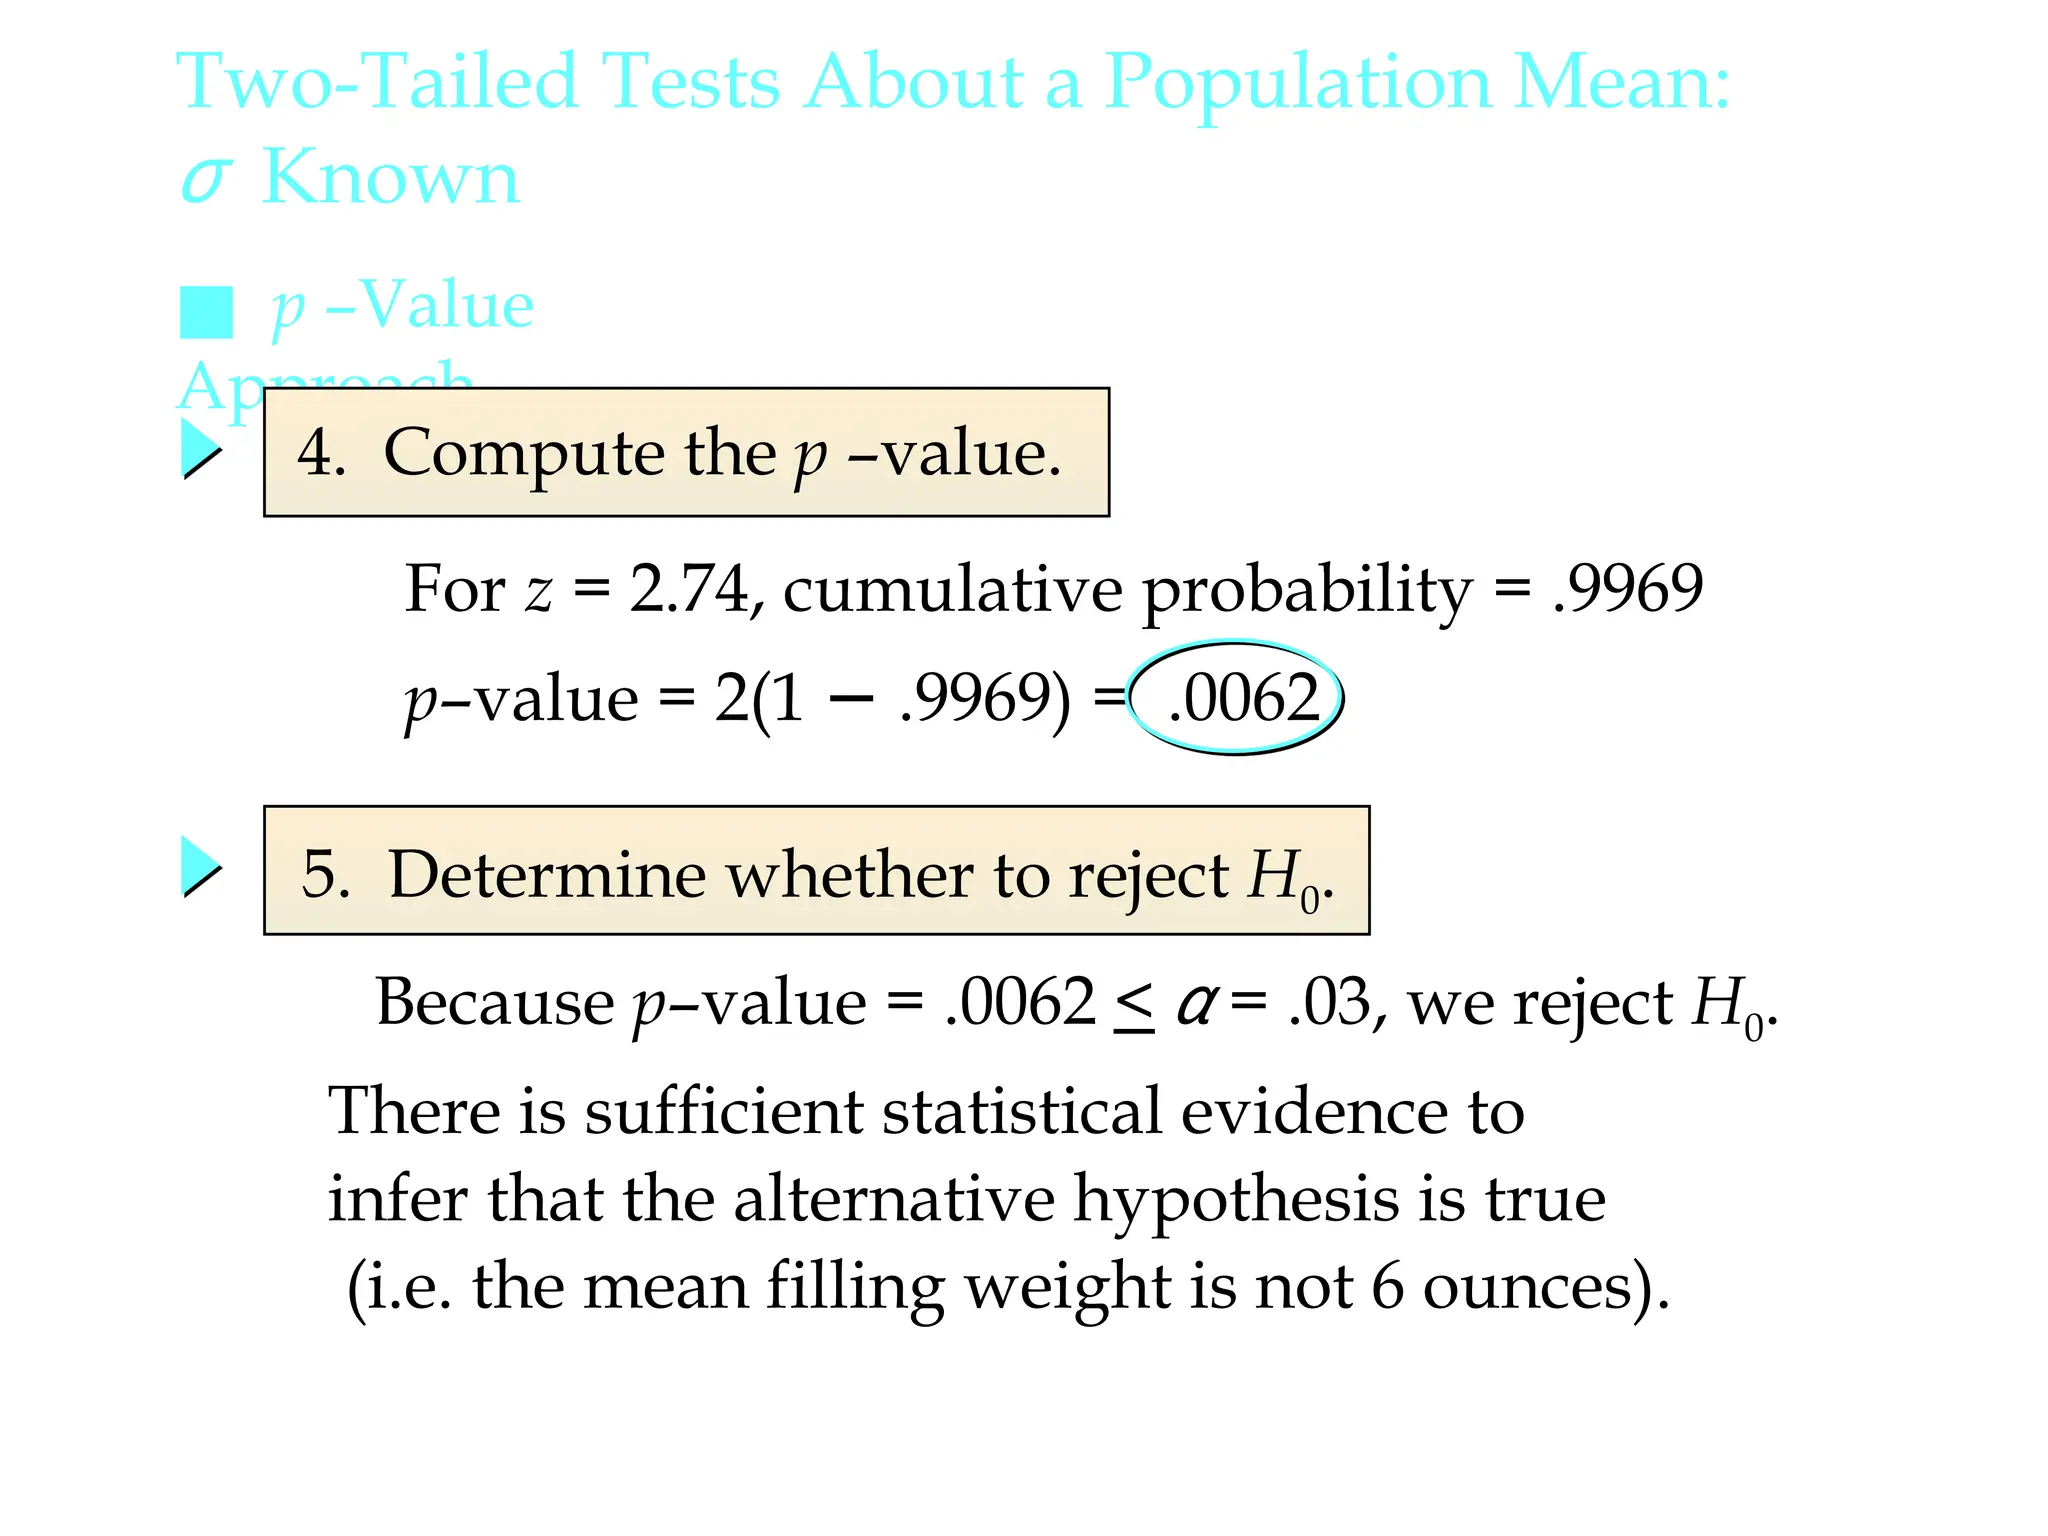
Two-Tailed Tests Abouta Population Mean:
σ Known
5. Determine whether to reject H0.
■ p –Value
Approach
4. Compute the p –value.
For z = 2.74, cumulative probability = .9969
p–value = 2(1 − .9969) = .0062
Because p–value = .0062 < α = .03, we reject H0.
There is sufficient statistical evidence to
infer that the alternative hypothesis is true
(i.e. the mean filling weight is not 6 ounces).
28.
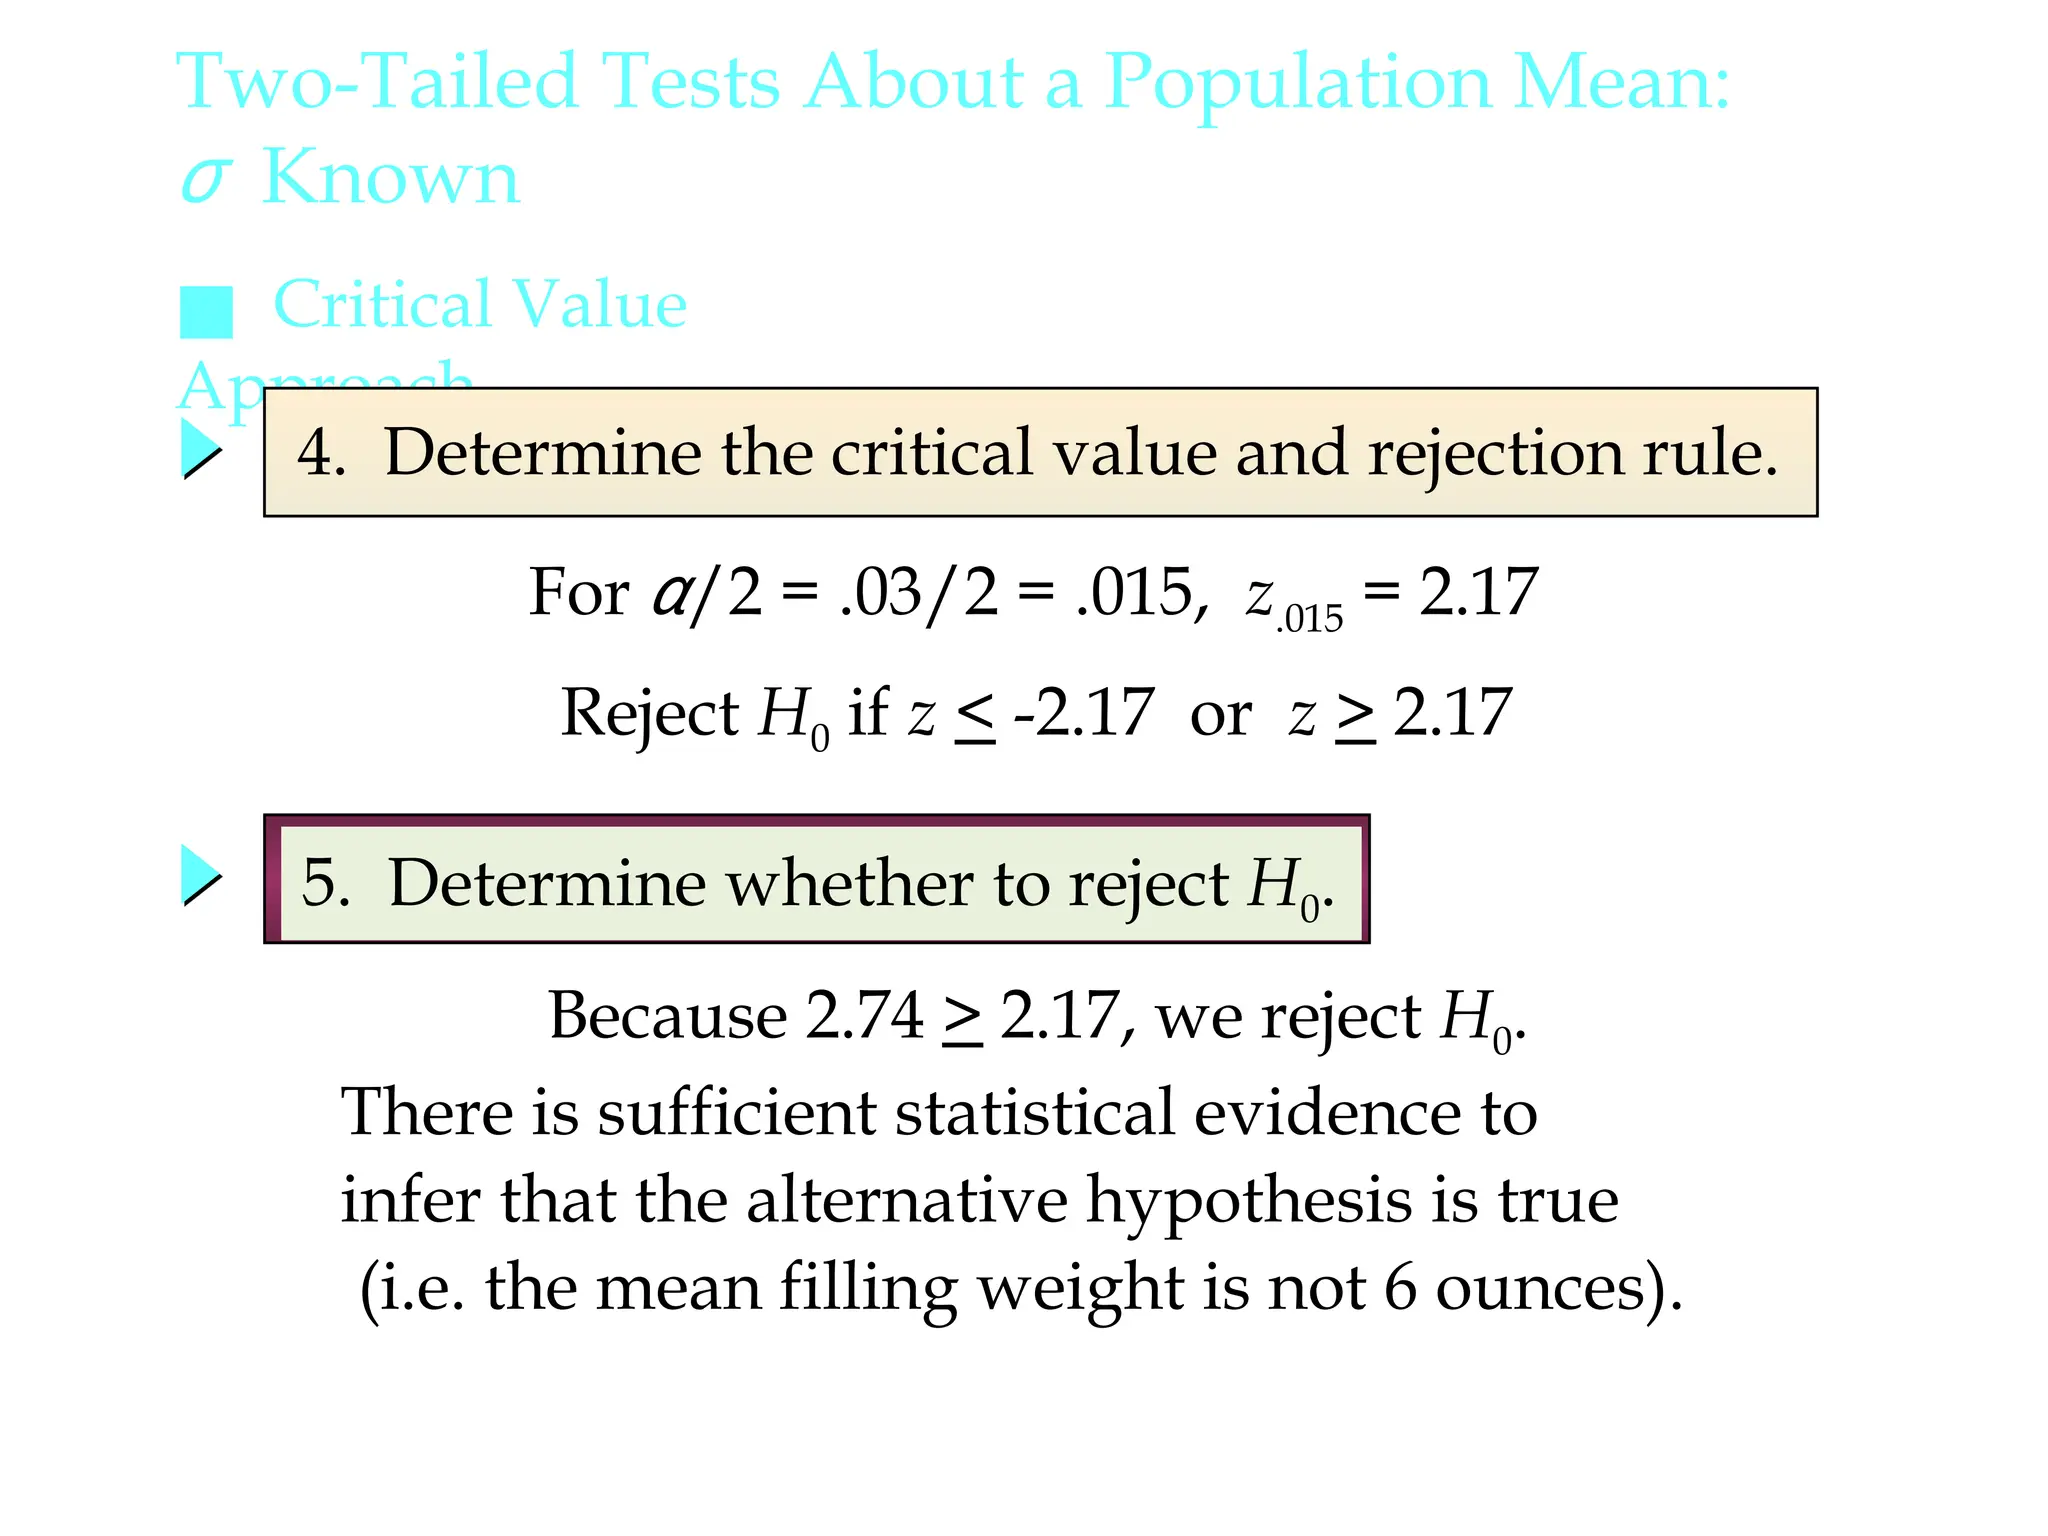
■ Critical Value
Approach
Two-TailedTests About a Population Mean:
σ Known
5. Determine whether to reject H0.
There is sufficient statistical evidence to
infer that the alternative hypothesis is true
(i.e. the mean filling weight is not 6 ounces).
Because 2.74 > 2.17, we reject H0.
For α/2 = .03/2 = .015, z.015 = 2.17
4. Determine the critical value and rejection rule.
Reject H0 if z < -2.17 or z > 2.17
29.
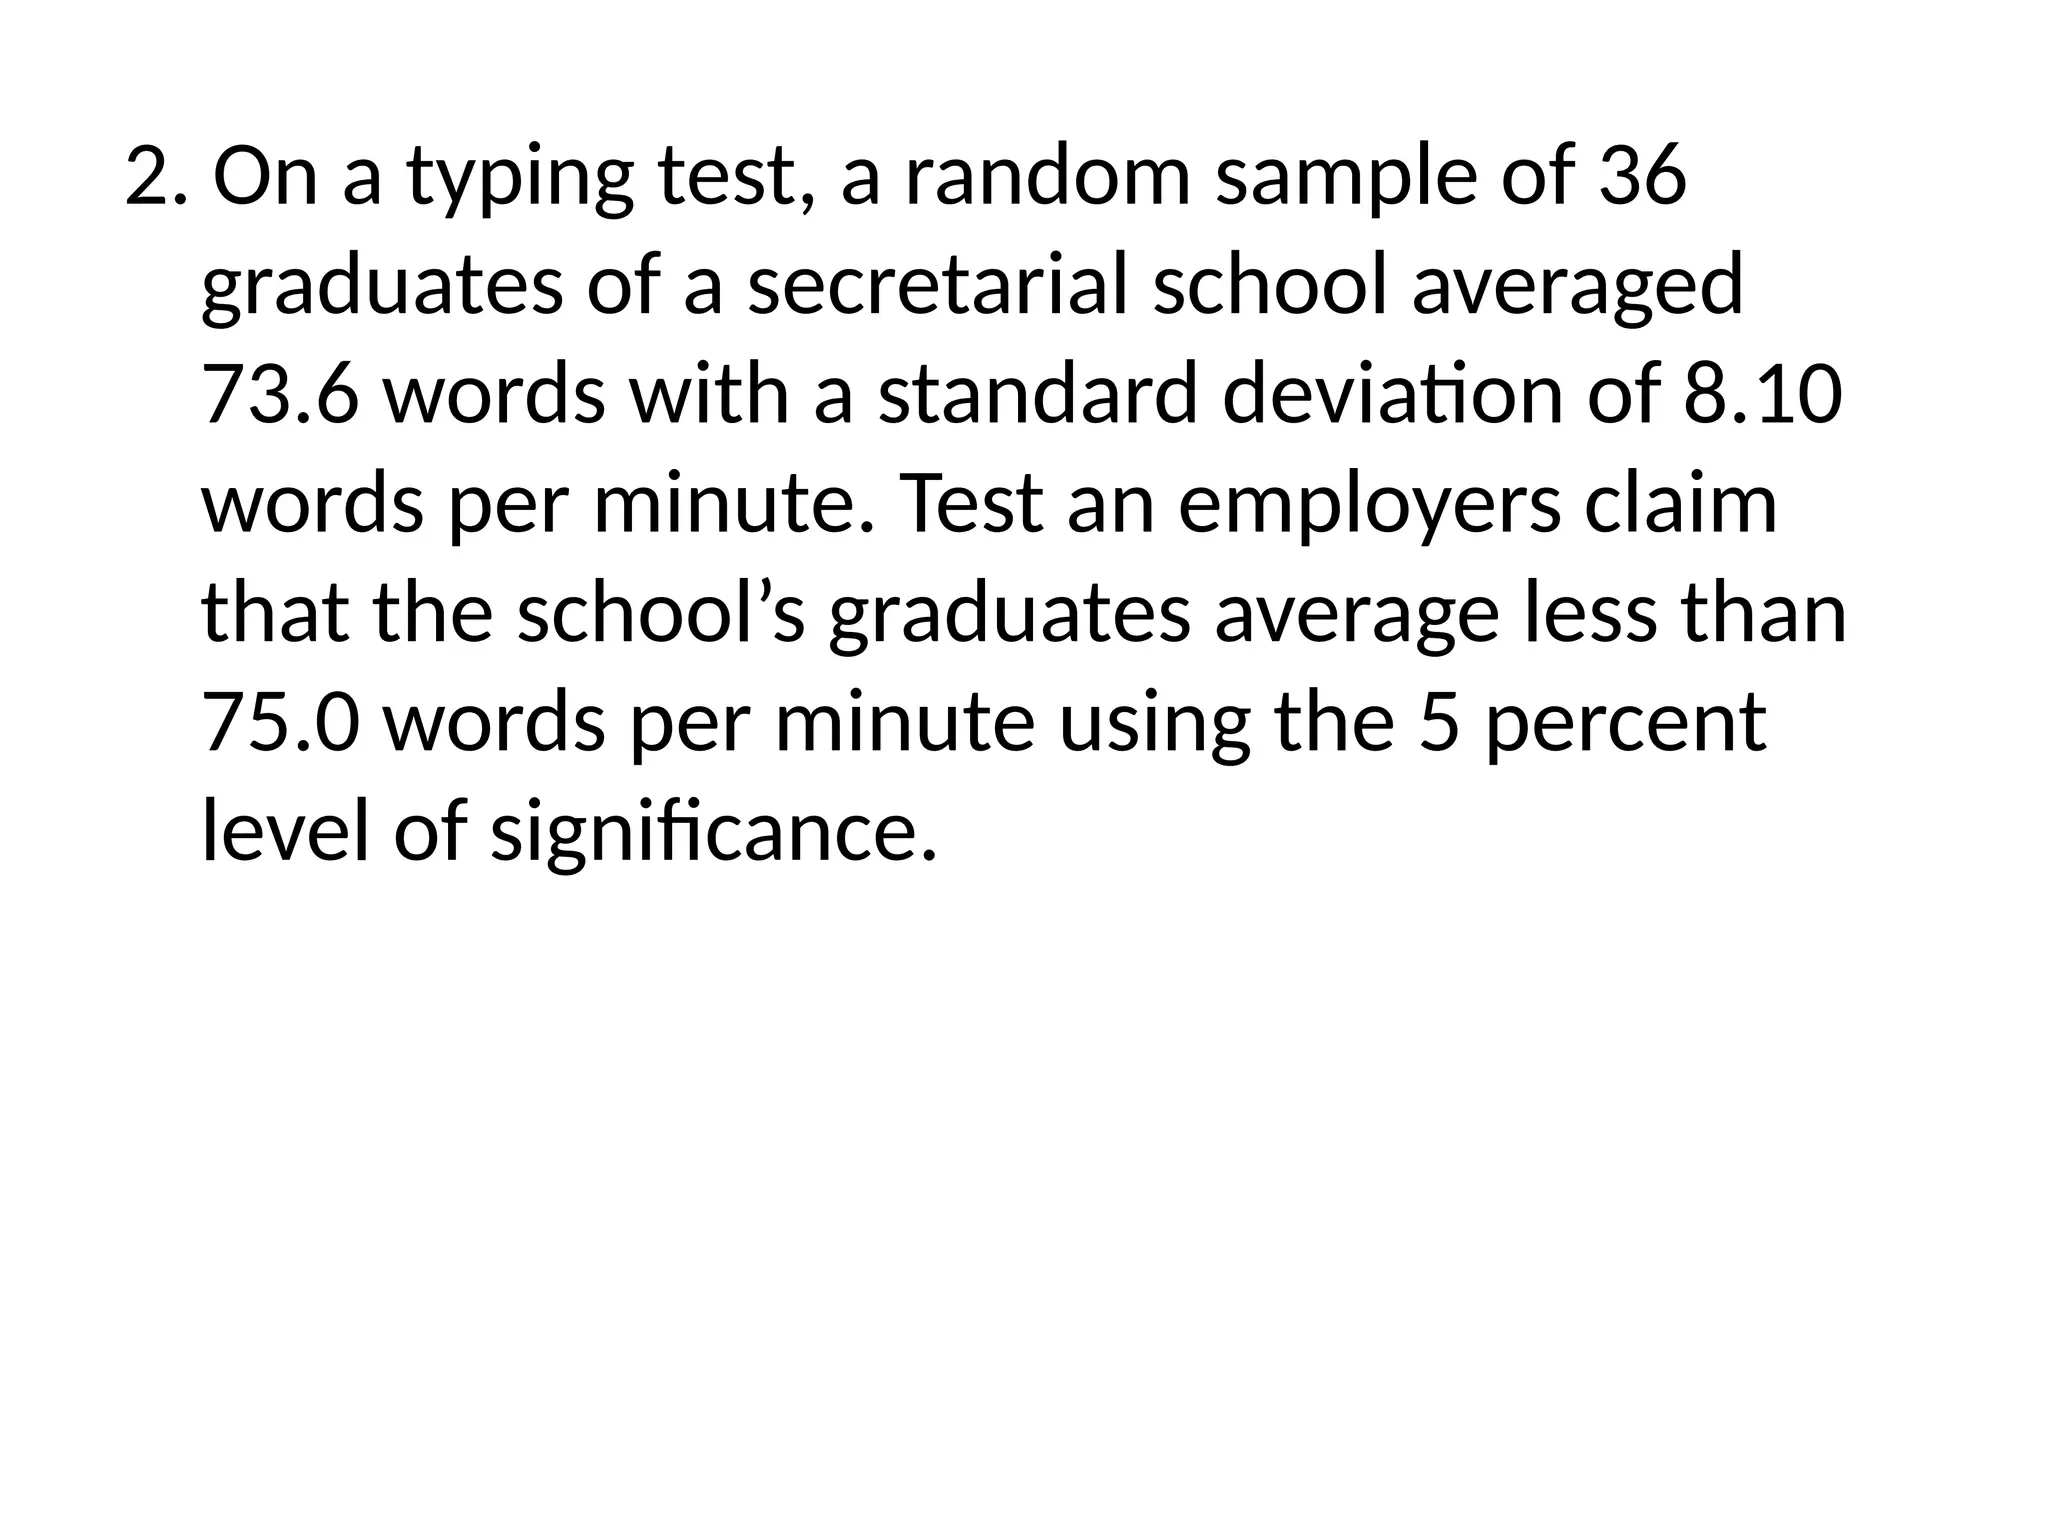
2. On atyping test, a random sample of 36
graduates of a secretarial school averaged
73.6 words with a standard deviation of 8.10
words per minute. Test an employers claim
that the school’s graduates average less than
75.0 words per minute using the 5 percent
level of significance.
30.
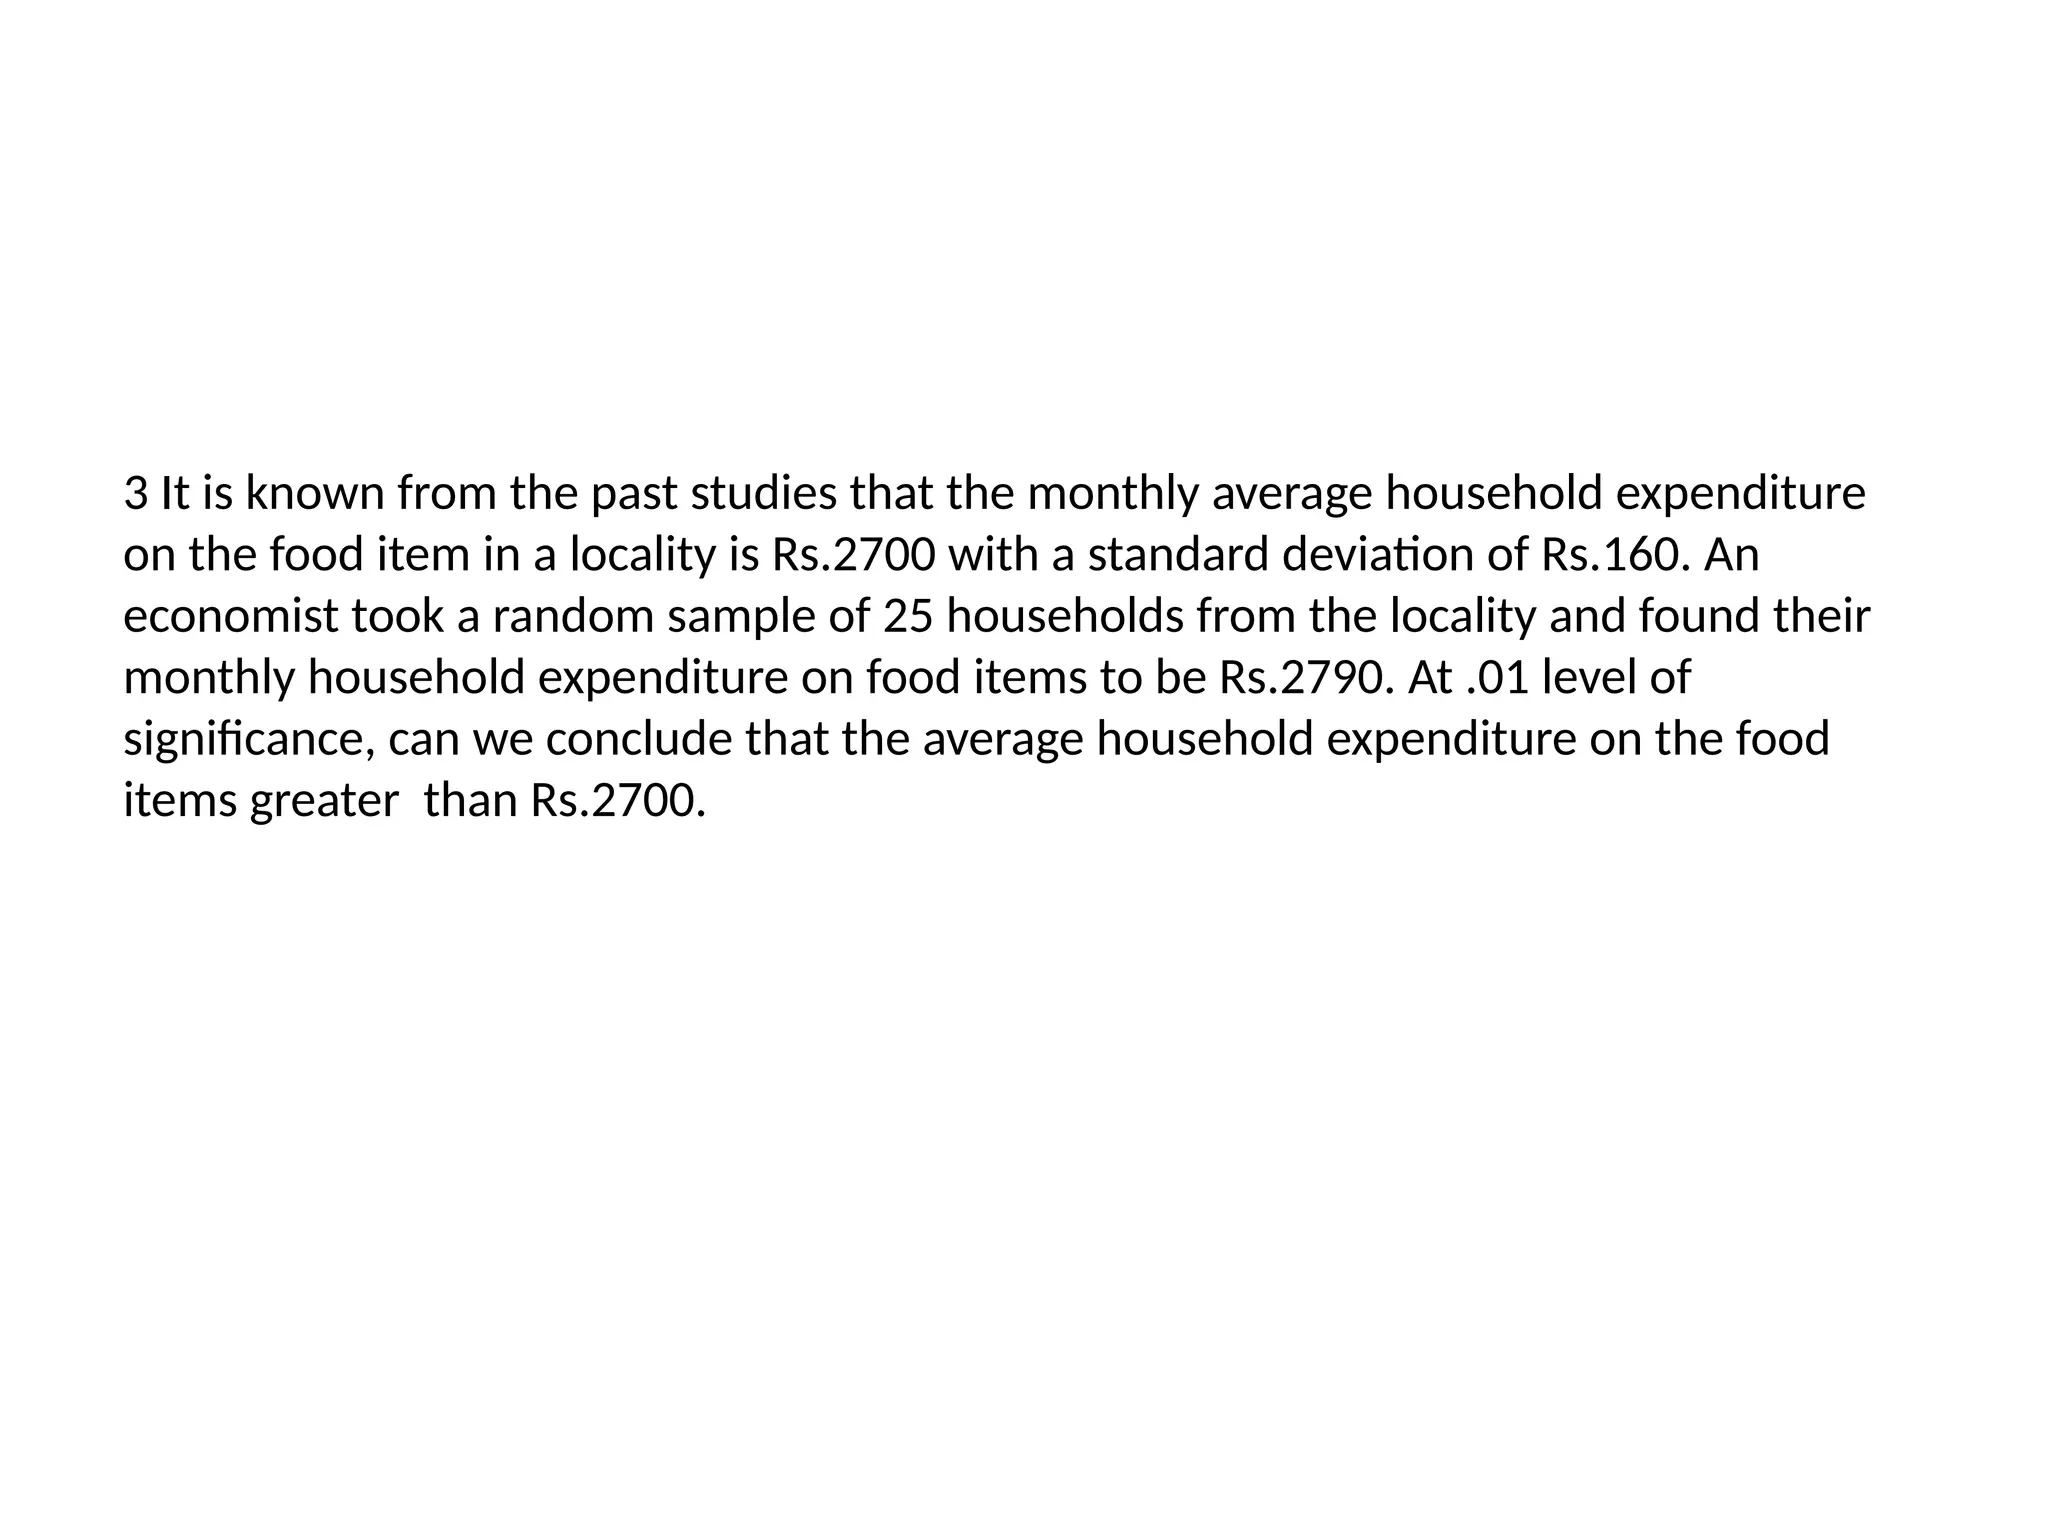
3 It isknown from the past studies that the monthly average household expenditure
on the food item in a locality is Rs.2700 with a standard deviation of Rs.160. An
economist took a random sample of 25 households from the locality and found their
monthly household expenditure on food items to be Rs.2790. At .01 level of
significance, can we conclude that the average household expenditure on the food
items greater than Rs.2700.
31.
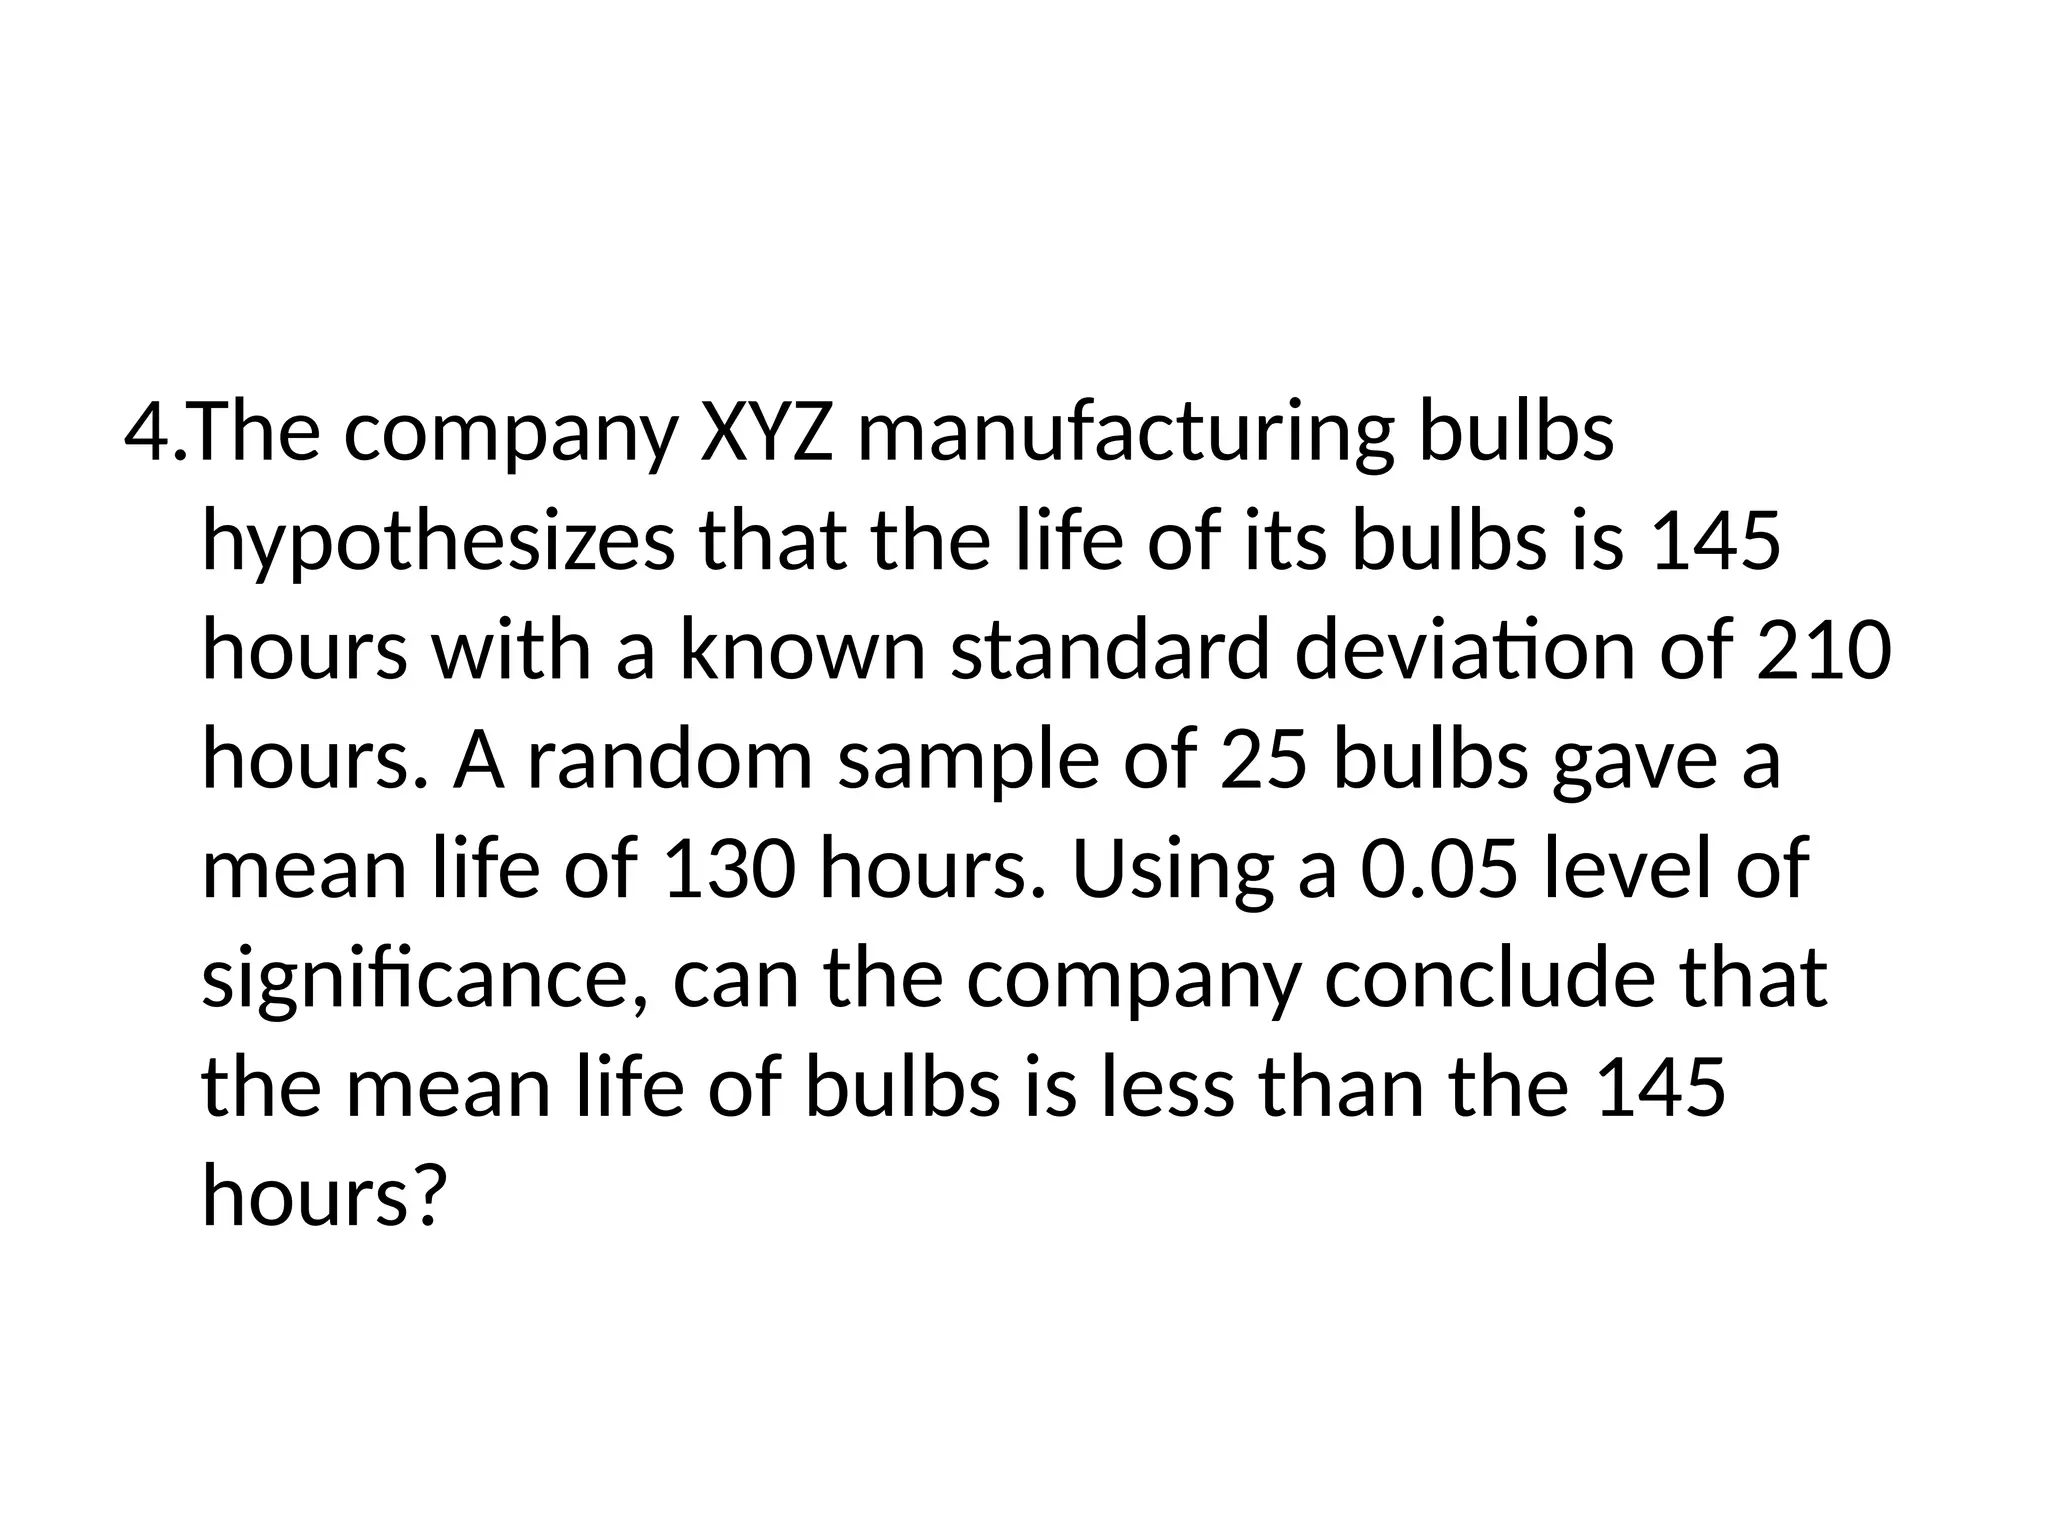
4.The company XYZmanufacturing bulbs
hypothesizes that the life of its bulbs is 145
hours with a known standard deviation of 210
hours. A random sample of 25 bulbs gave a
mean life of 130 hours. Using a 0.05 level of
significance, can the company conclude that
the mean life of bulbs is less than the 145
hours?
32.
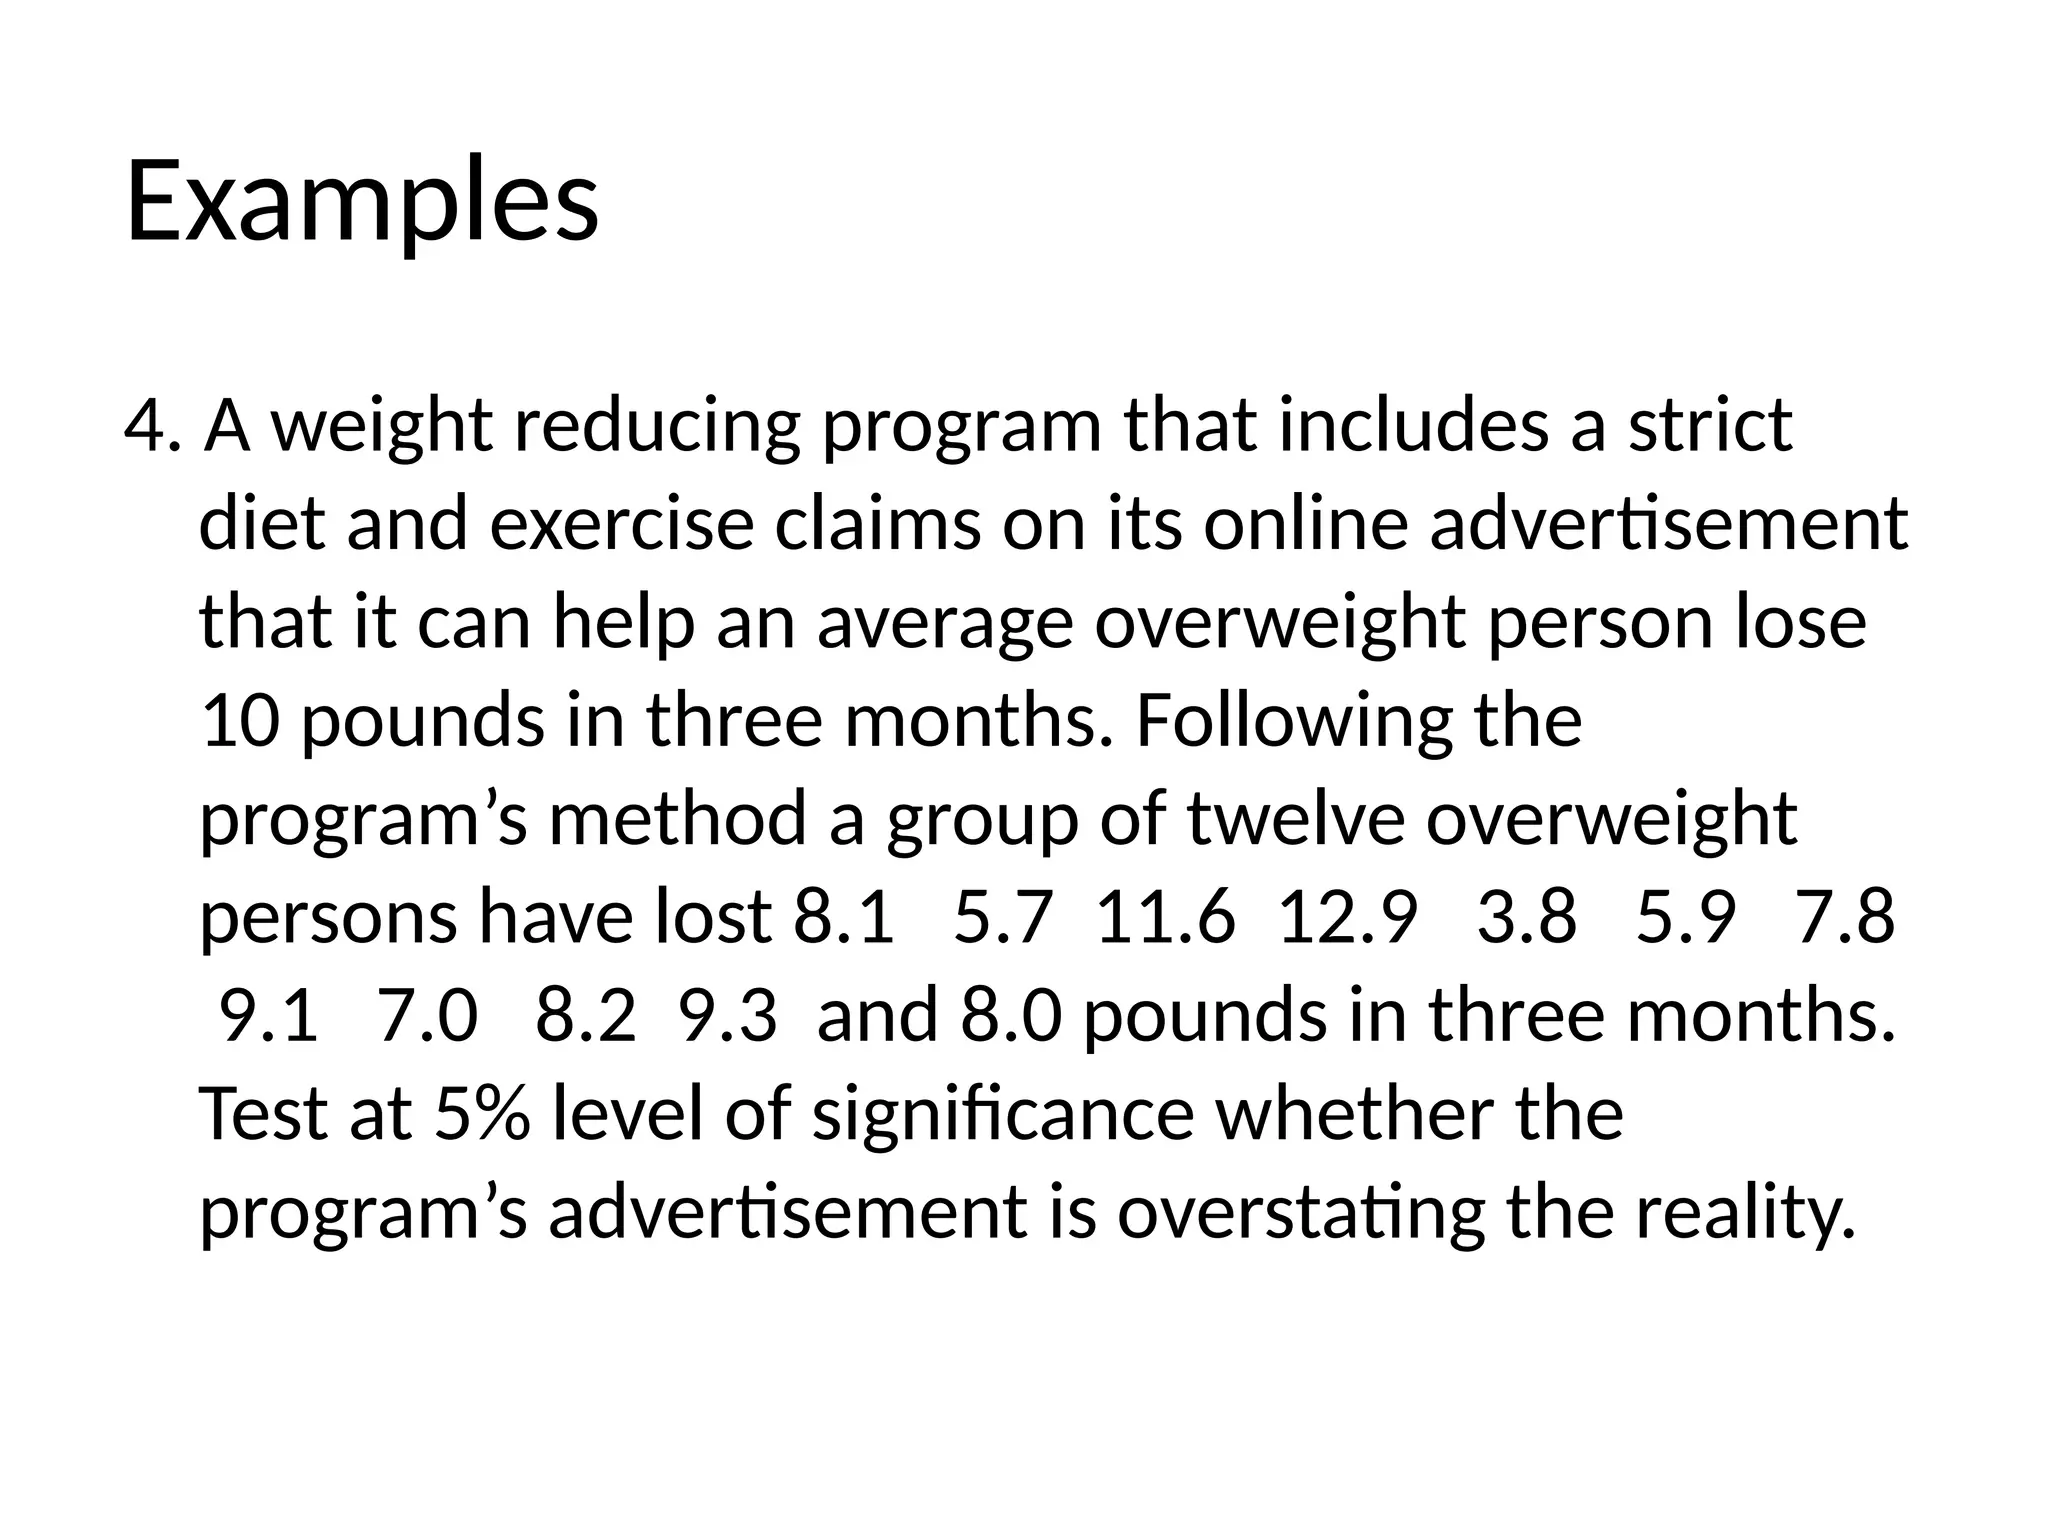
Examples
4. A weightreducing program that includes a strict
diet and exercise claims on its online advertisement
that it can help an average overweight person lose
10 pounds in three months. Following the
program’s method a group of twelve overweight
persons have lost 8.1 5.7 11.6 12.9 3.8 5.9 7.8
9.1 7.0 8.2 9.3 and 8.0 pounds in three months.
Test at 5% level of significance whether the
program’s advertisement is overstating the reality.
33.
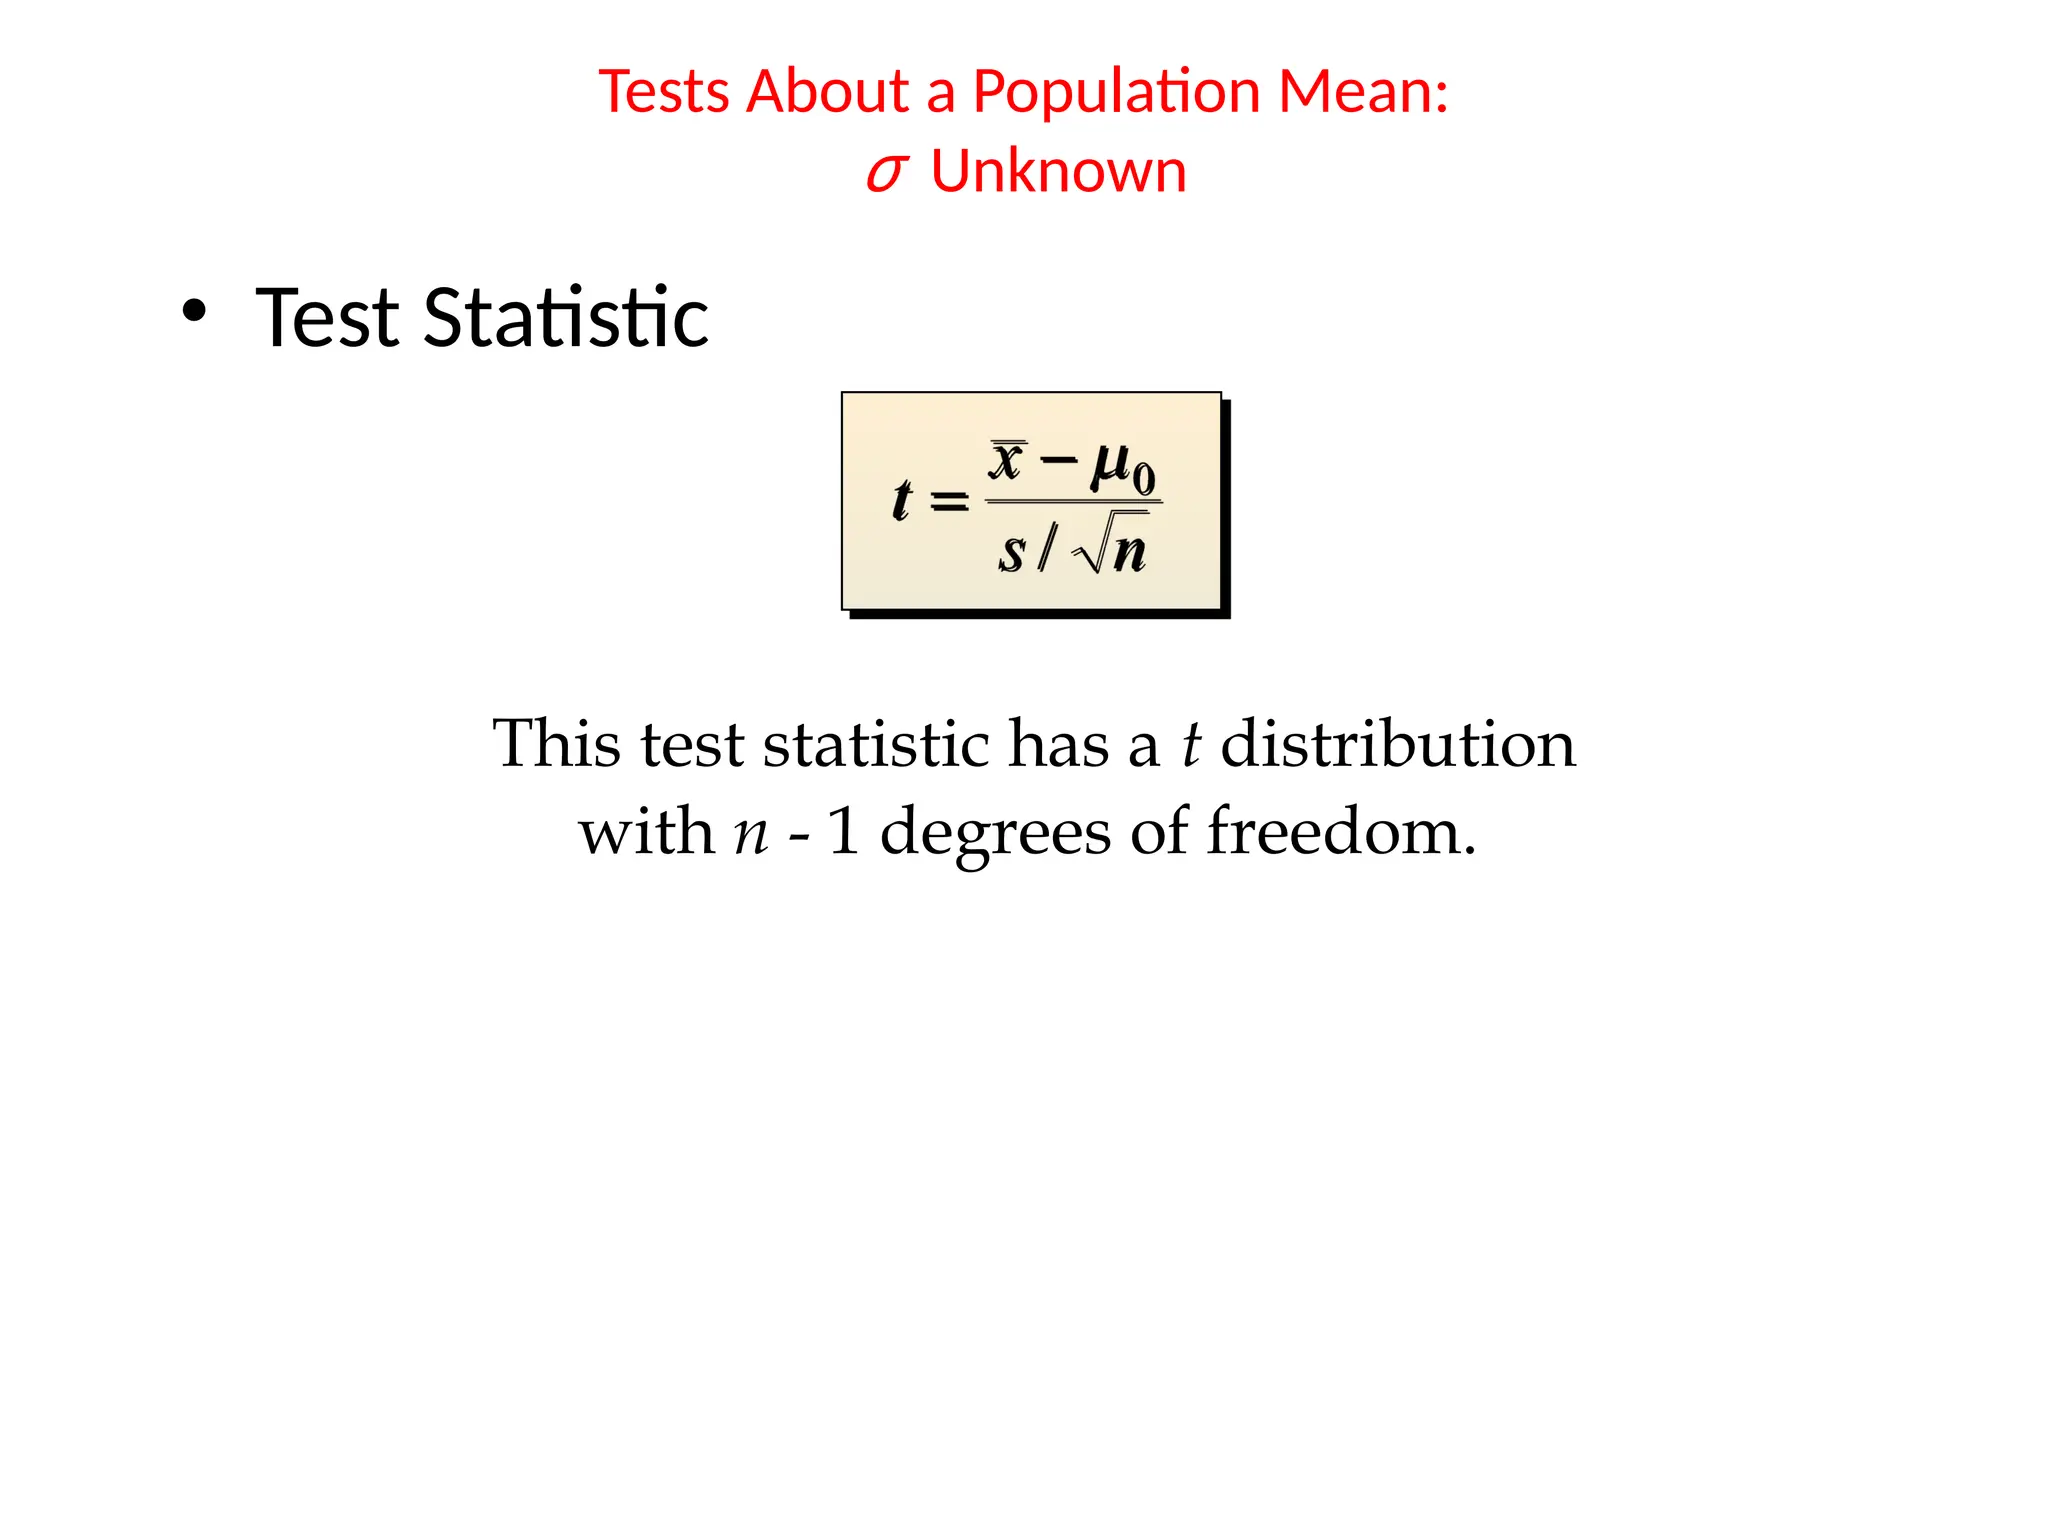
• Test Statistic
TestsAbout a Population Mean:
σ Unknown
This test statistic has a t distribution
with n - 1 degrees of freedom.
34.
H0: μ <
μ0
RejectH0 if t > tα
Reject H0 if t < -tα
Reject H0 if t < - t 2
α/ or t > t 2
α/
H0: μ >
μ0
H0: μ =
μ0
Tests About a Population Mean:
σ Unknown
● Rejection Rule: Critical Value Approach
35.
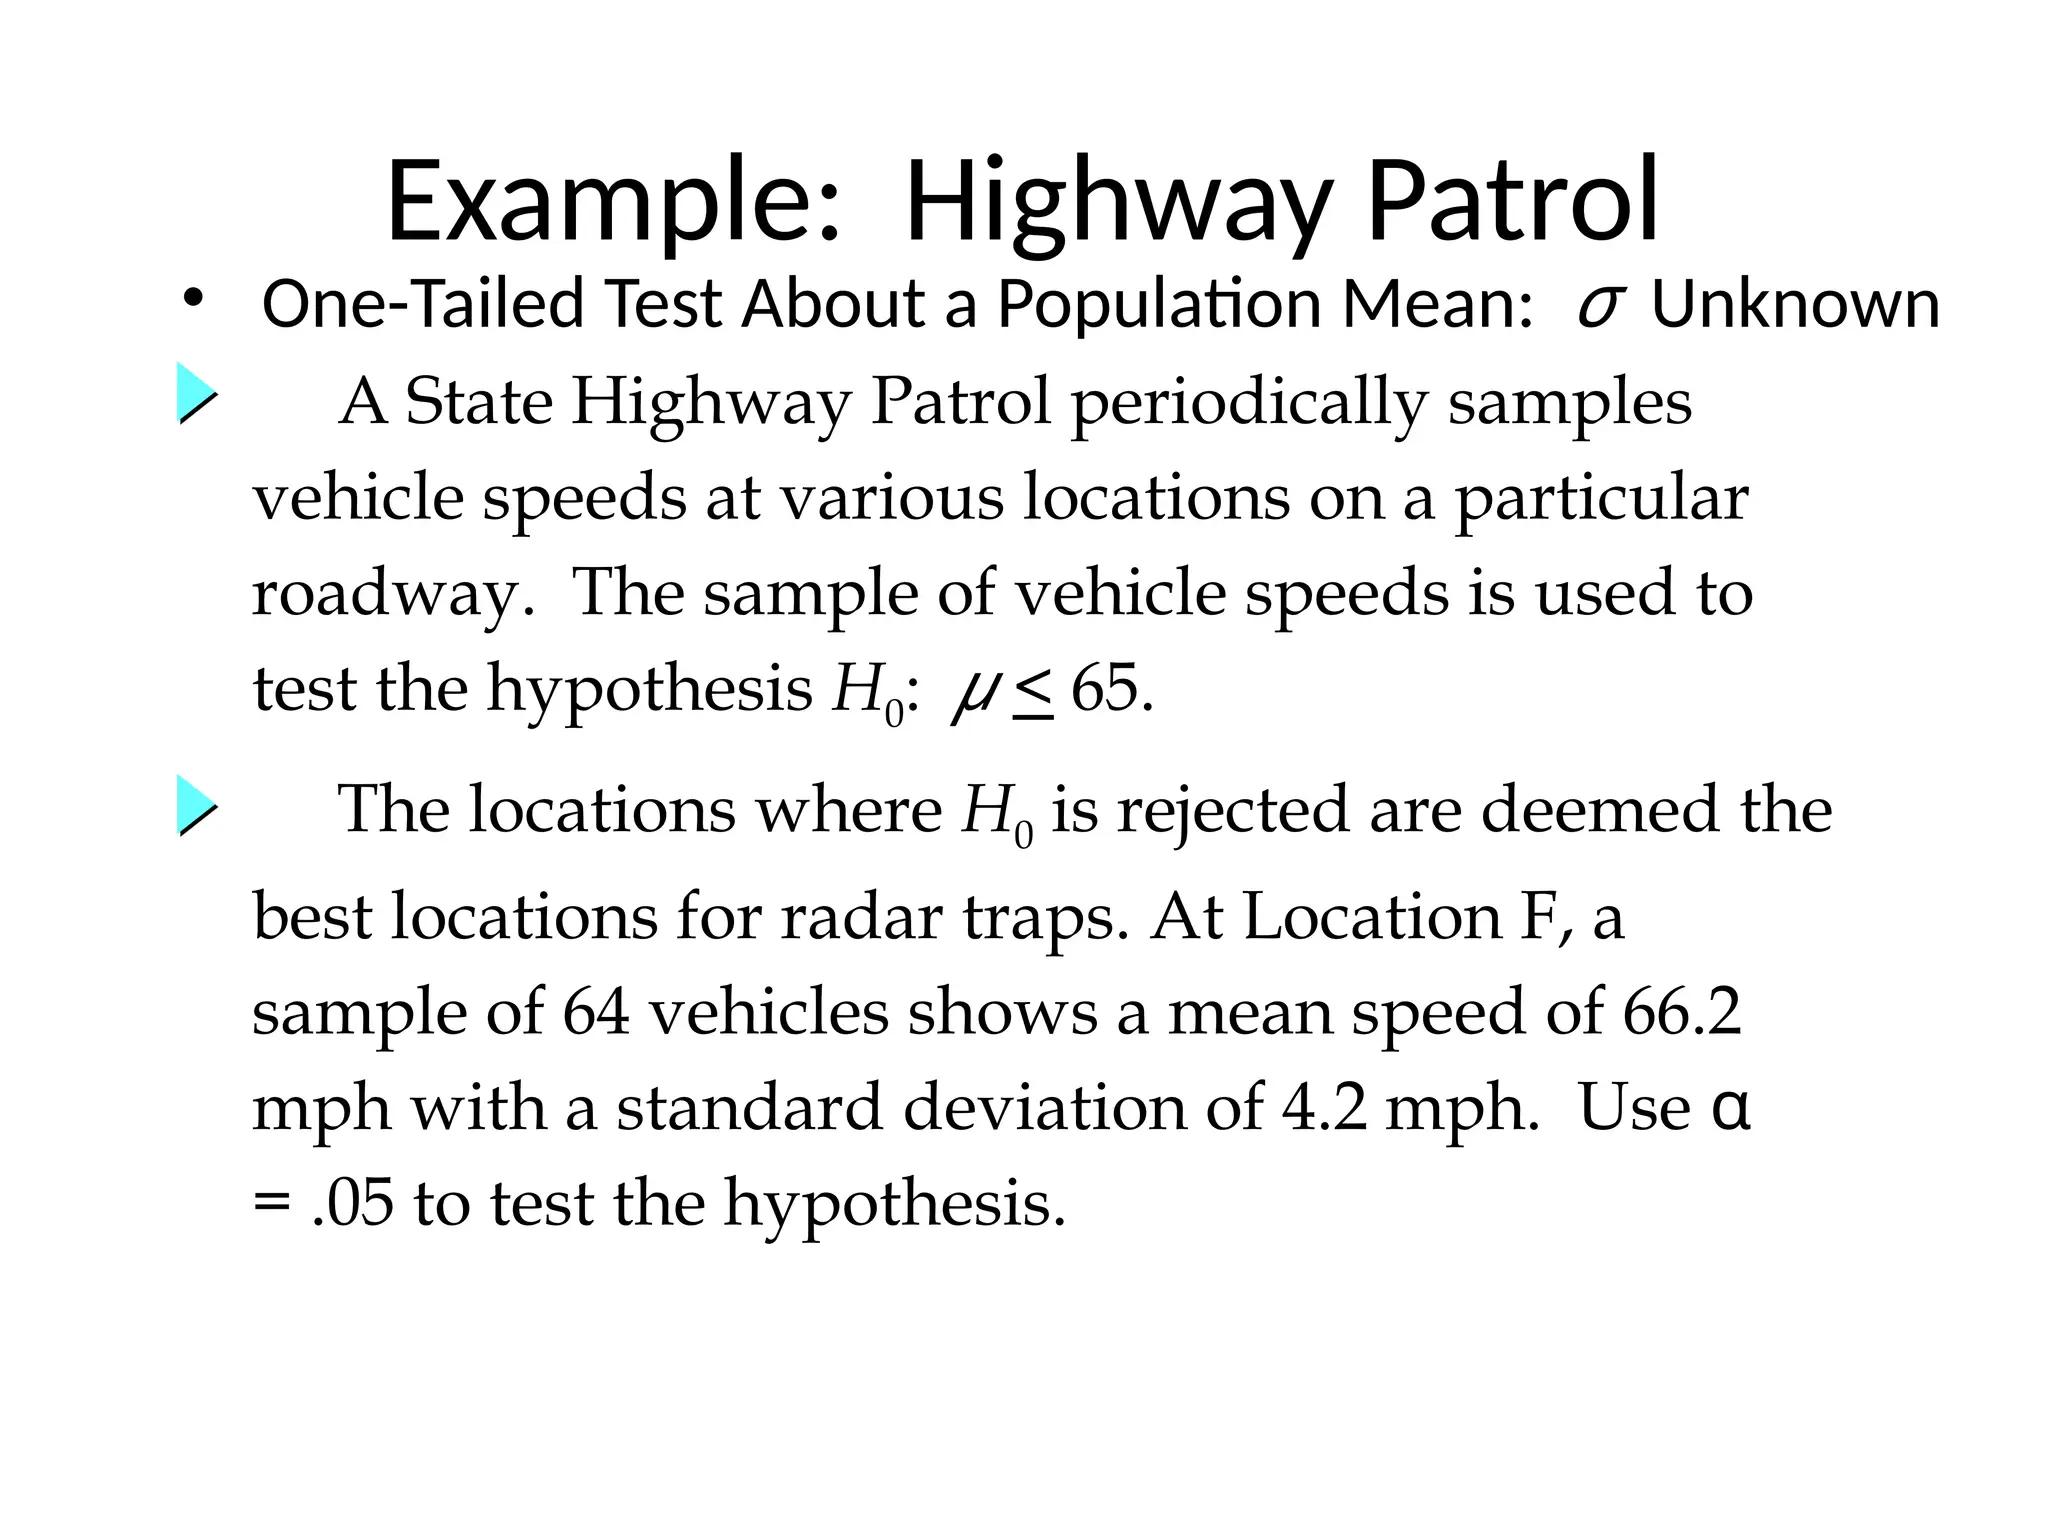
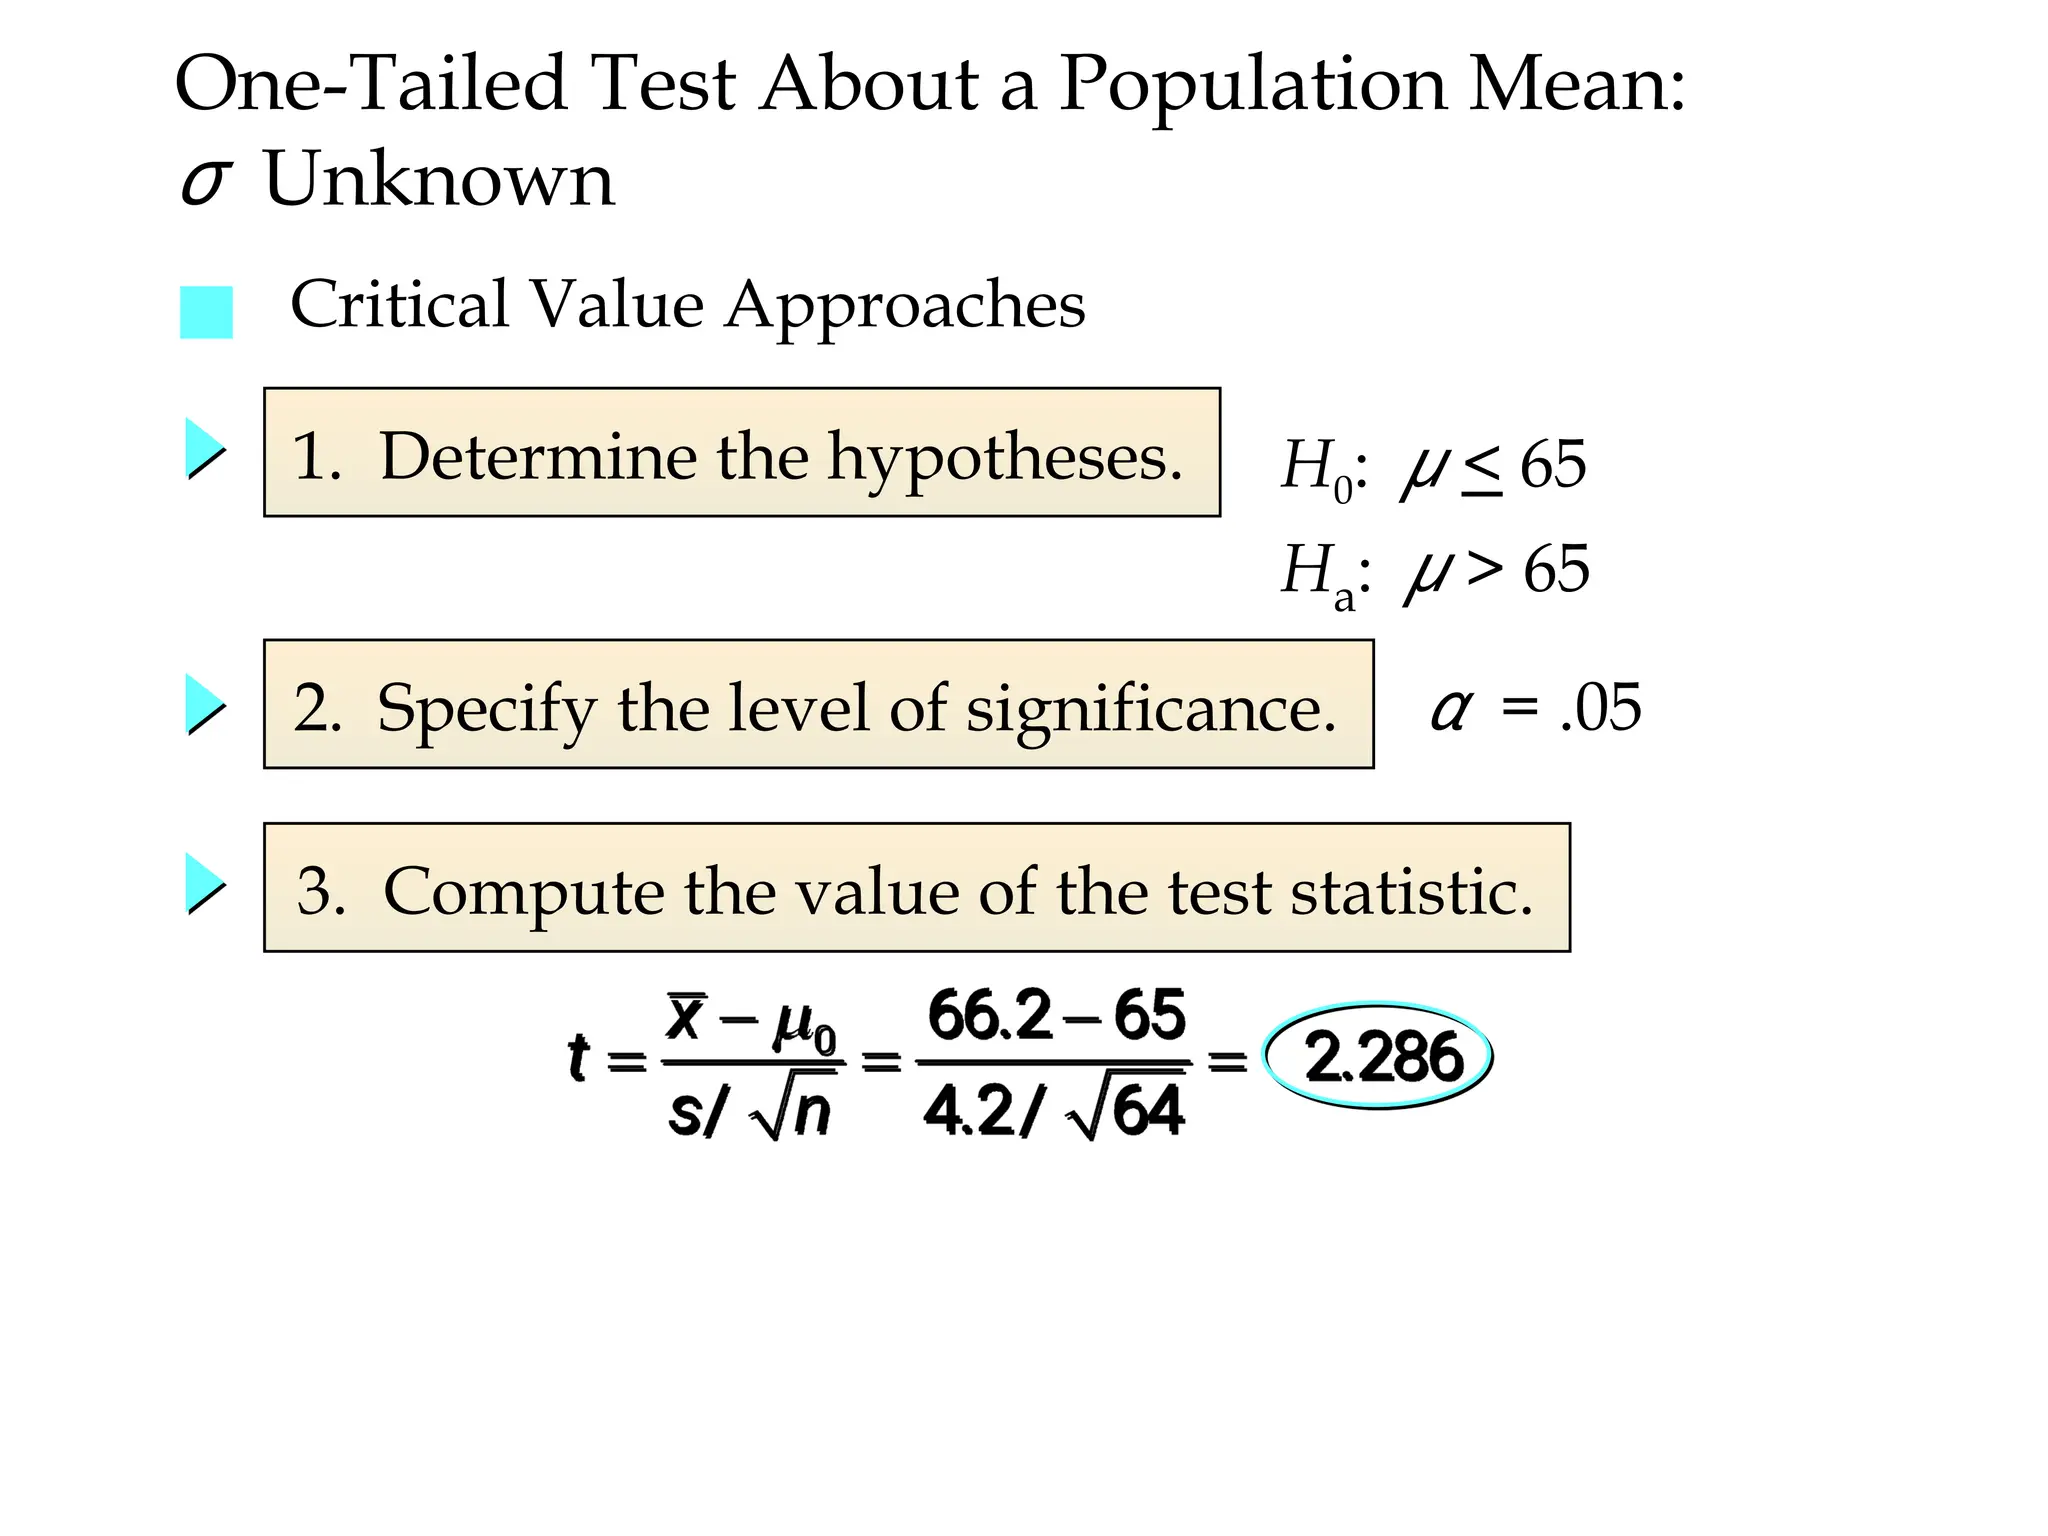
A State HighwayPatrol periodically samples
vehicle speeds at various locations on a particular
roadway. The sample of vehicle speeds is used to
test the hypothesis H0: μ < 65.
Example: Highway Patrol
• One-Tailed Test About a Population Mean: σ Unknown
The locations where H0 is rejected are deemed the
best locations for radar traps. At Location F, a
sample of 64 vehicles shows a mean speed of 66.2
mph with a standard deviation of 4.2 mph. Use α
= .05 to test the hypothesis.
36.
One-Tailed Test Abouta Population Mean:
σ Unknown
1. Determine the hypotheses.
2. Specify the level of significance.
3. Compute the value of the test statistic.
α = .05
■ Critical Value Approaches
H0: μ < 65
Ha: μ > 65
37.
■ Critical Value
Approach
5.Determine whether to reject H0.
We are at least 95% confident that the mean speed
of vehicles at Location F is greater than 65 mph.
Location F is a good candidate for a radar trap.
Because 2.286 > 1.669, we reject H0.
One-Tailed Test About a Population Mean:
σ Unknown
For α = .05 and d.f. = 64 – 1 = 63, t.05 = 1.669
4. Determine the critical value and rejection rule.
Reject H0 if t > 1.669
38.
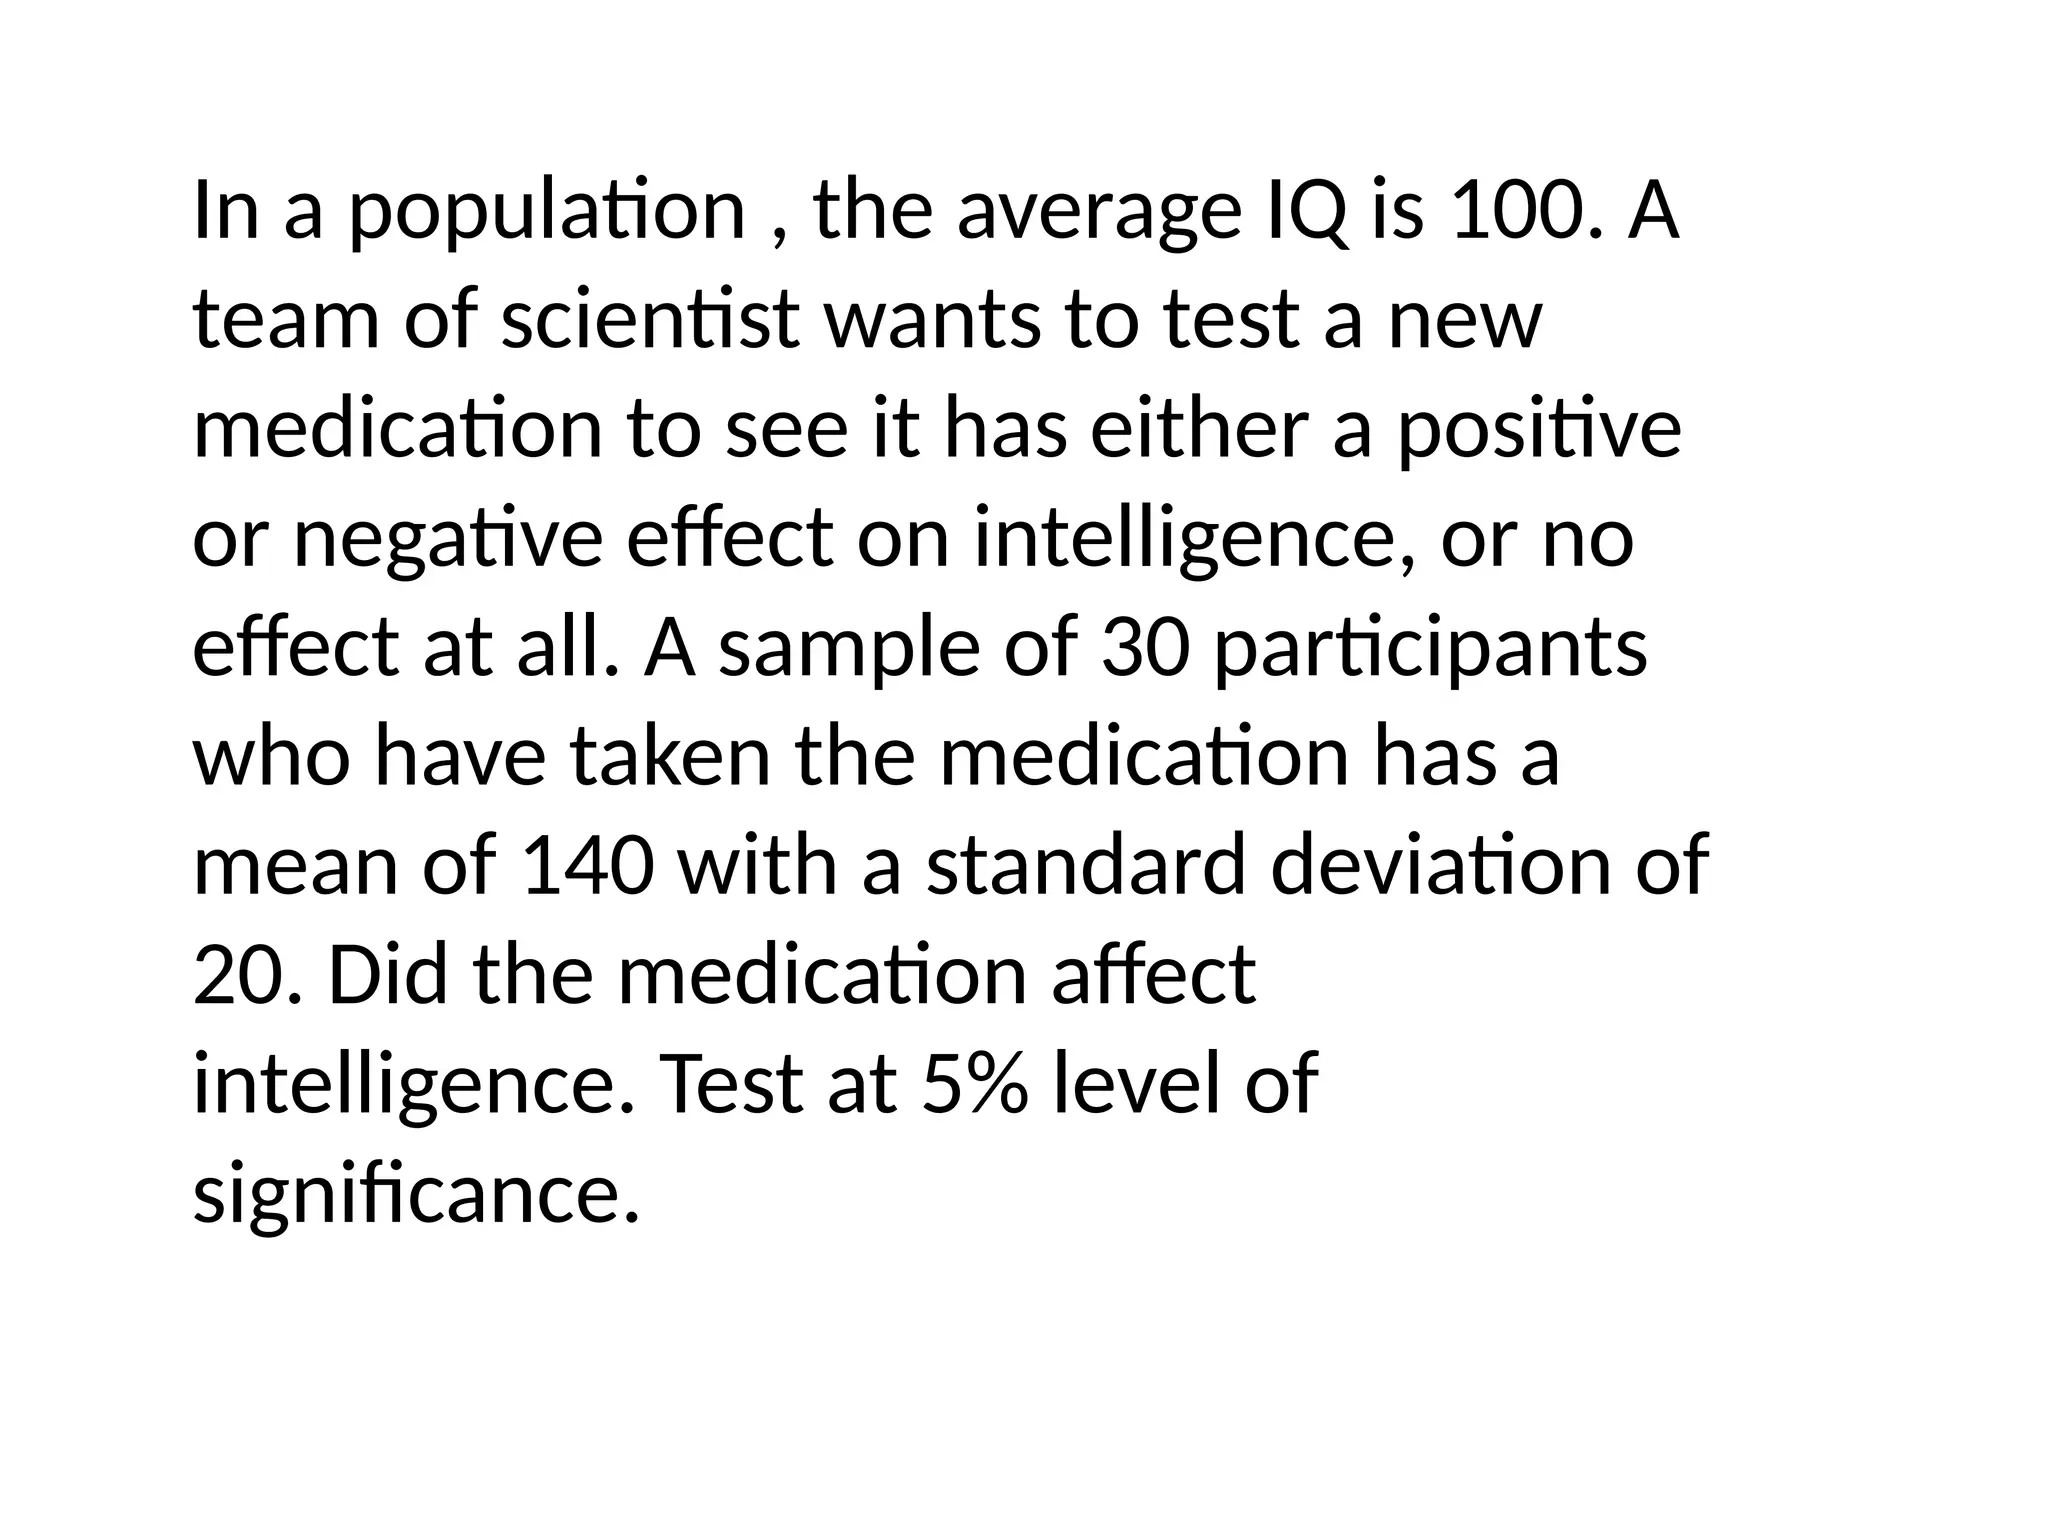
In a population, the average IQ is 100. A
team of scientist wants to test a new
medication to see it has either a positive
or negative effect on intelligence, or no
effect at all. A sample of 30 participants
who have taken the medication has a
mean of 140 with a standard deviation of
20. Did the medication affect
intelligence. Test at 5% level of
significance.
39.
2. Which ischeaper: eating out or dining in? the mean cost of
a flank steak, broccoli, and rice bought at the grocery store is
$13.04 (Money.msn website, november 7, 2012). a sample of
100 neighborhood restaurants showed a mean price of
$12.75 and a standard deviation of $2 for a comparable
restaurant meal.
a. develop appropriate hypotheses for a test to determine
whether the sample data support the conclusion that the
mean cost of a restaurant meal is less than fixing a
comparable meal at home.
b. At alpha = .05, what is your conclusion?
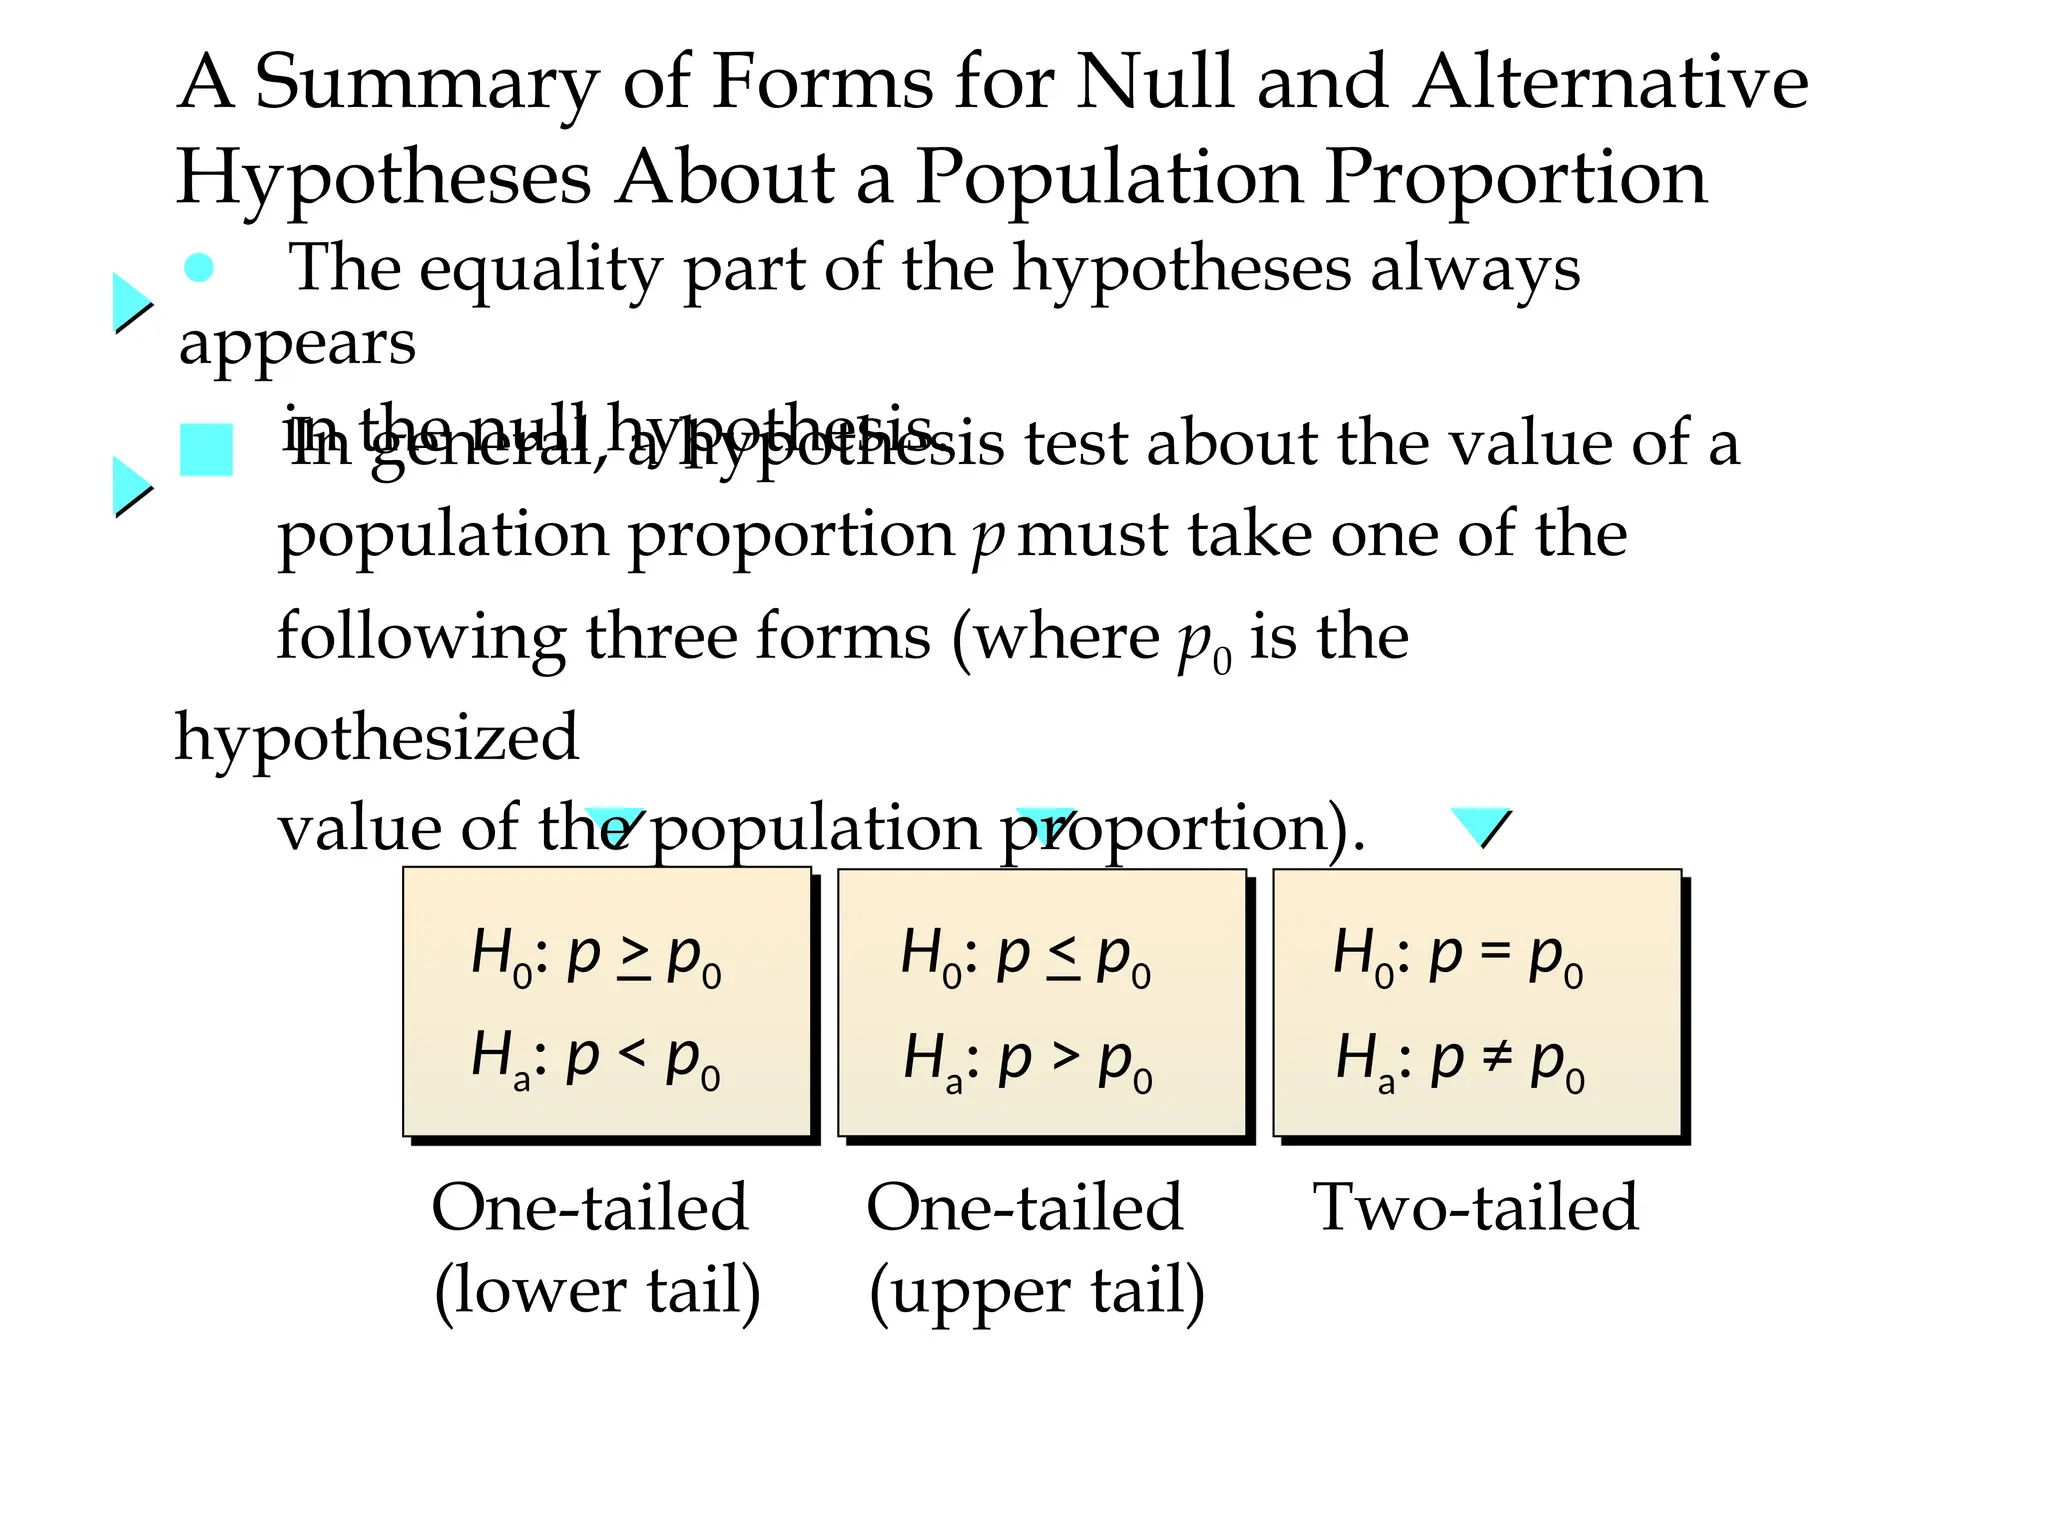
● The equalitypart of the hypotheses always
appears
in the null hypothesis.
■ In general, a hypothesis test about the value of a
population proportion pmust take one of the
following three forms (where p0 is the
hypothesized
value of the population proportion).
A Summary of Forms for Null and Alternative
Hypotheses About a Population Proportion
One-tailed
(lower tail)
One-tailed
(upper tail)
Two-tailed
H0: p > p0
Ha: p < p0
H0: p < p0
Ha: p > p0
H0: p = p0
Ha: p ≠ p0
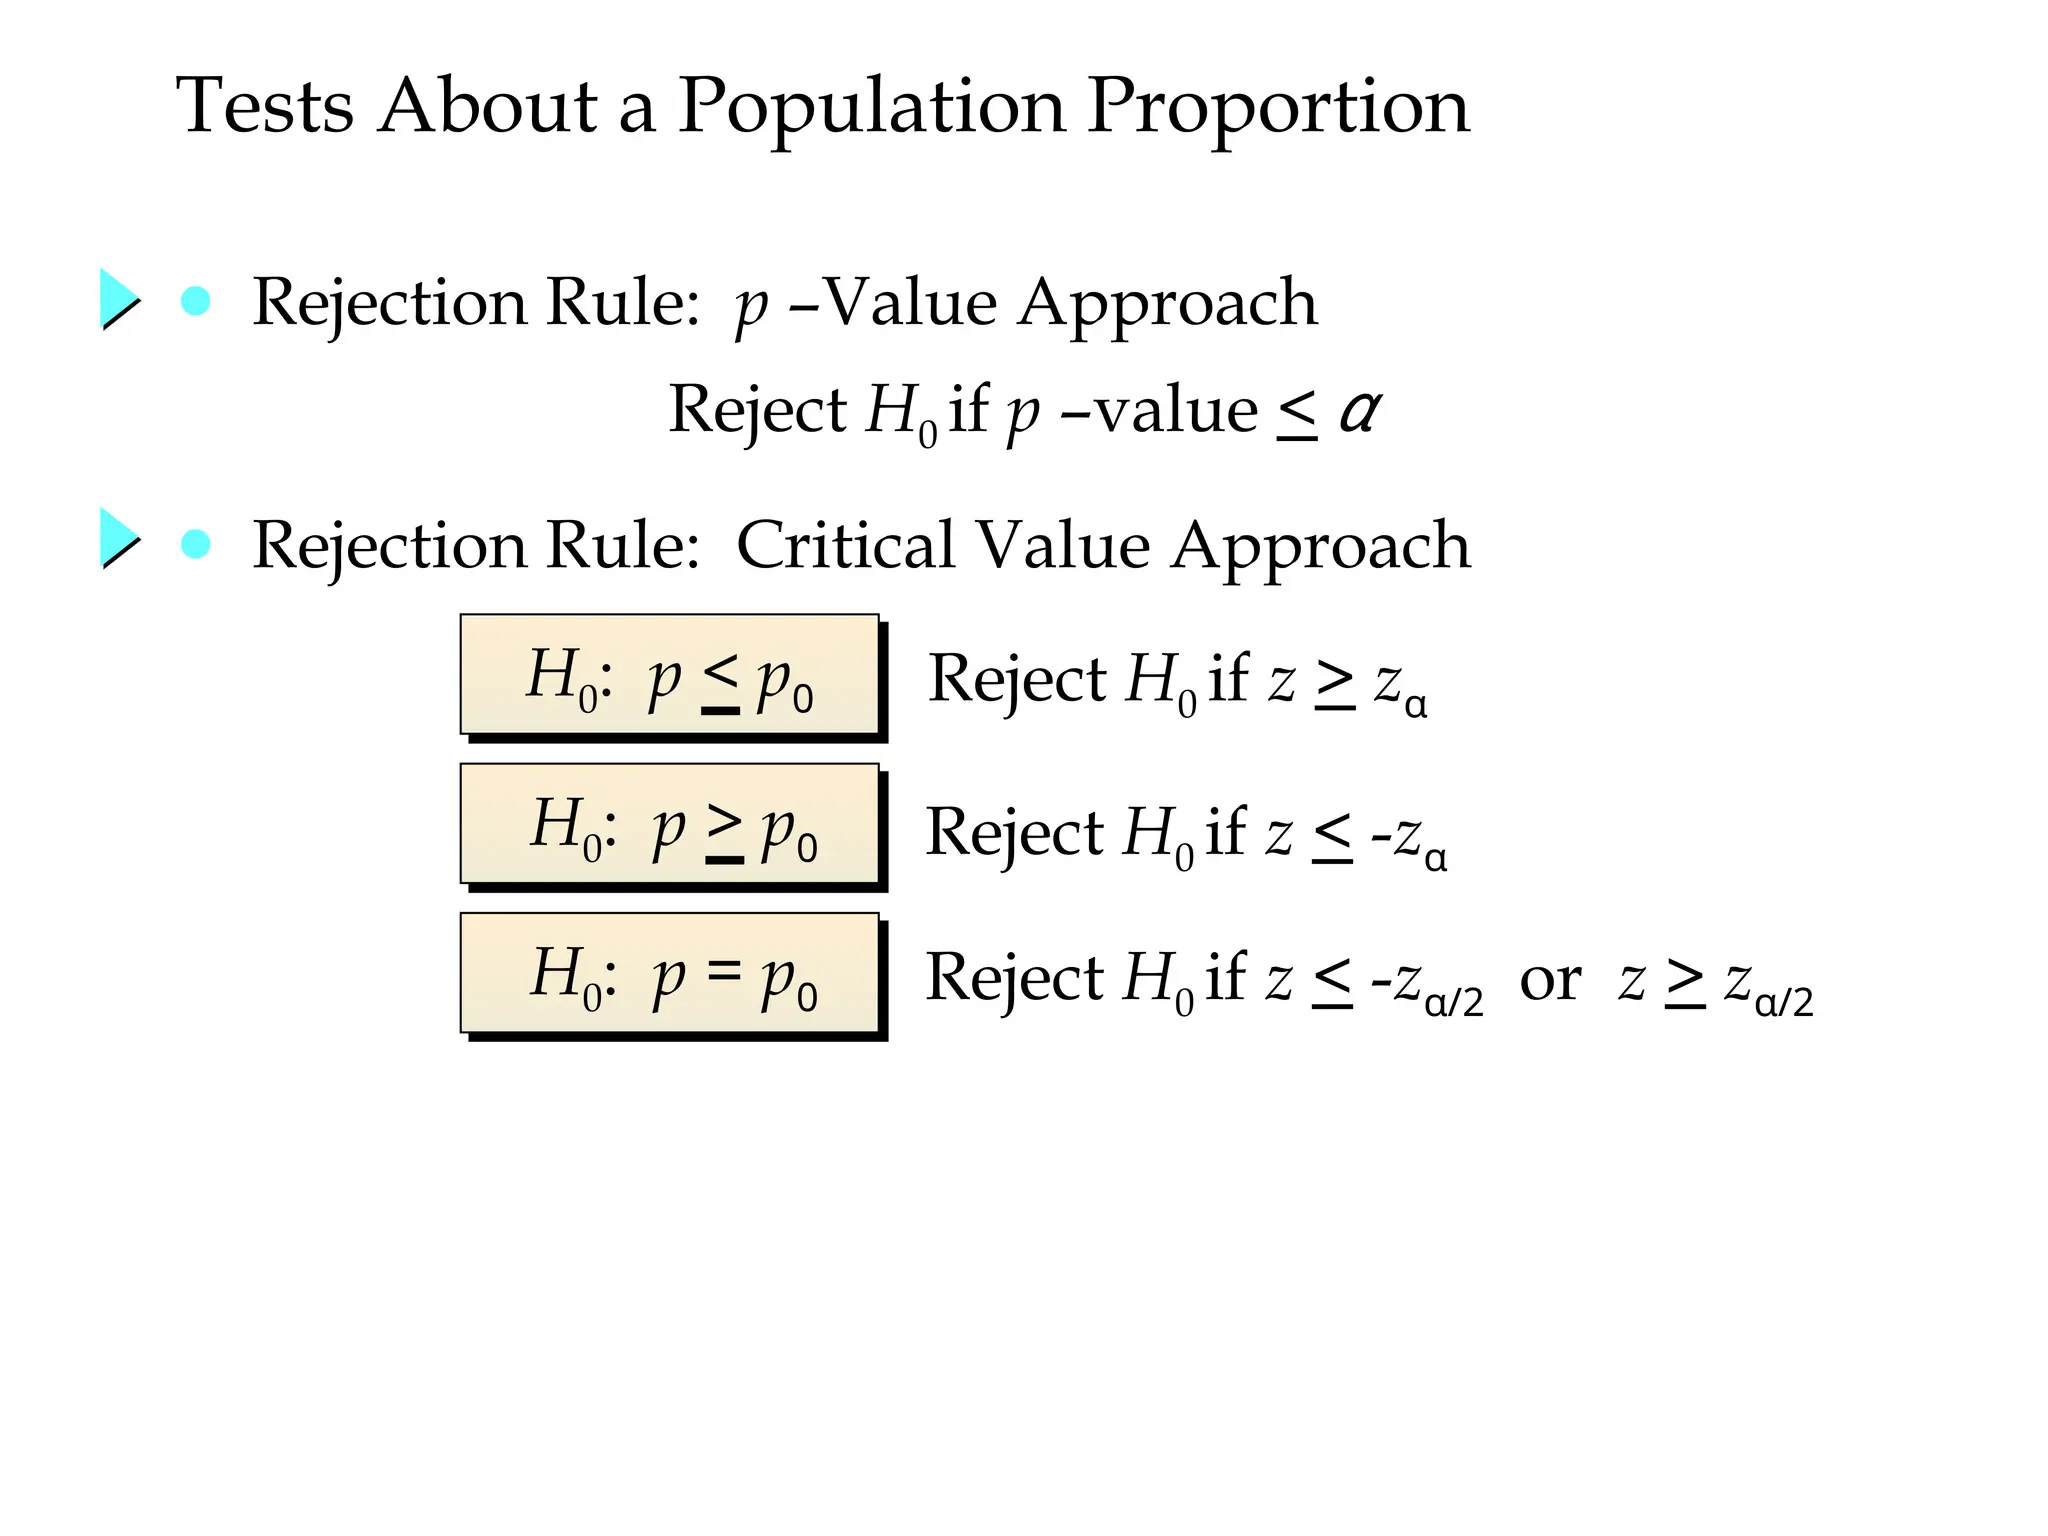
43.
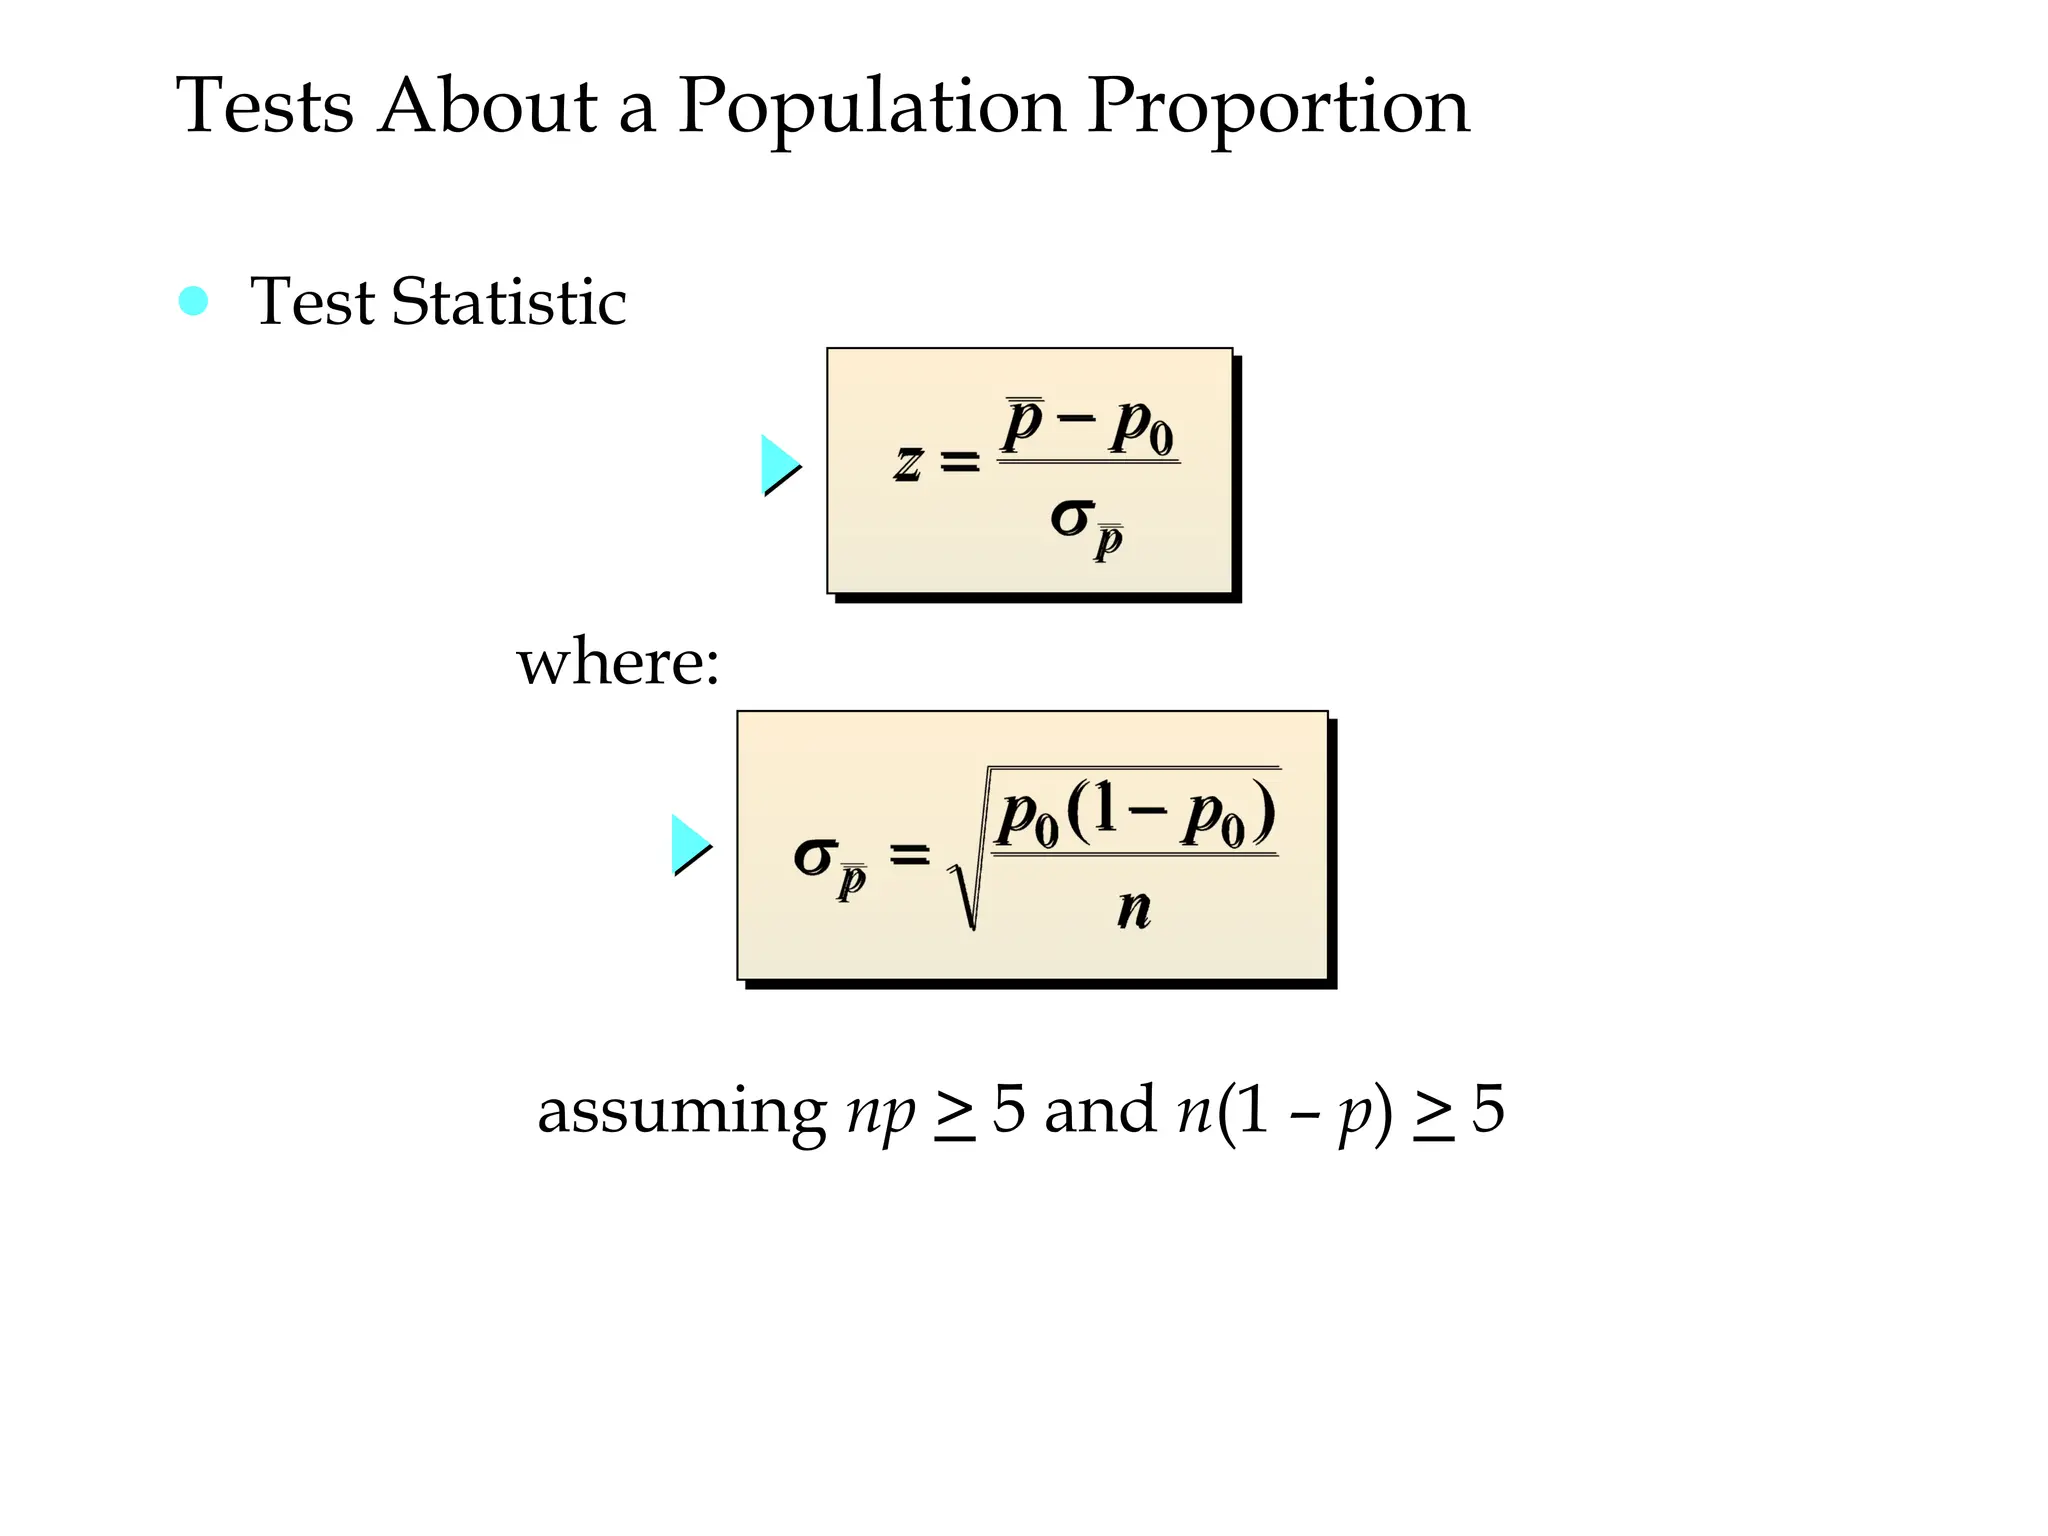
● Test Statistic
TestsAbout a Population Proportion
where:
assuming np > 5 and n(1 – p) > 5
44.
● Rejection Rule:p –Value Approach
H0: p < p0 Reject H0 if z > zα
Reject H0 if z < -zα
Reject H0 if z < -z 2
α/ or z > z 2
α/
H0: p > p0
H0: p = p0
Tests About a Population Proportion
Reject H0 if p –value < α
● Rejection Rule: Critical Value Approach
45.
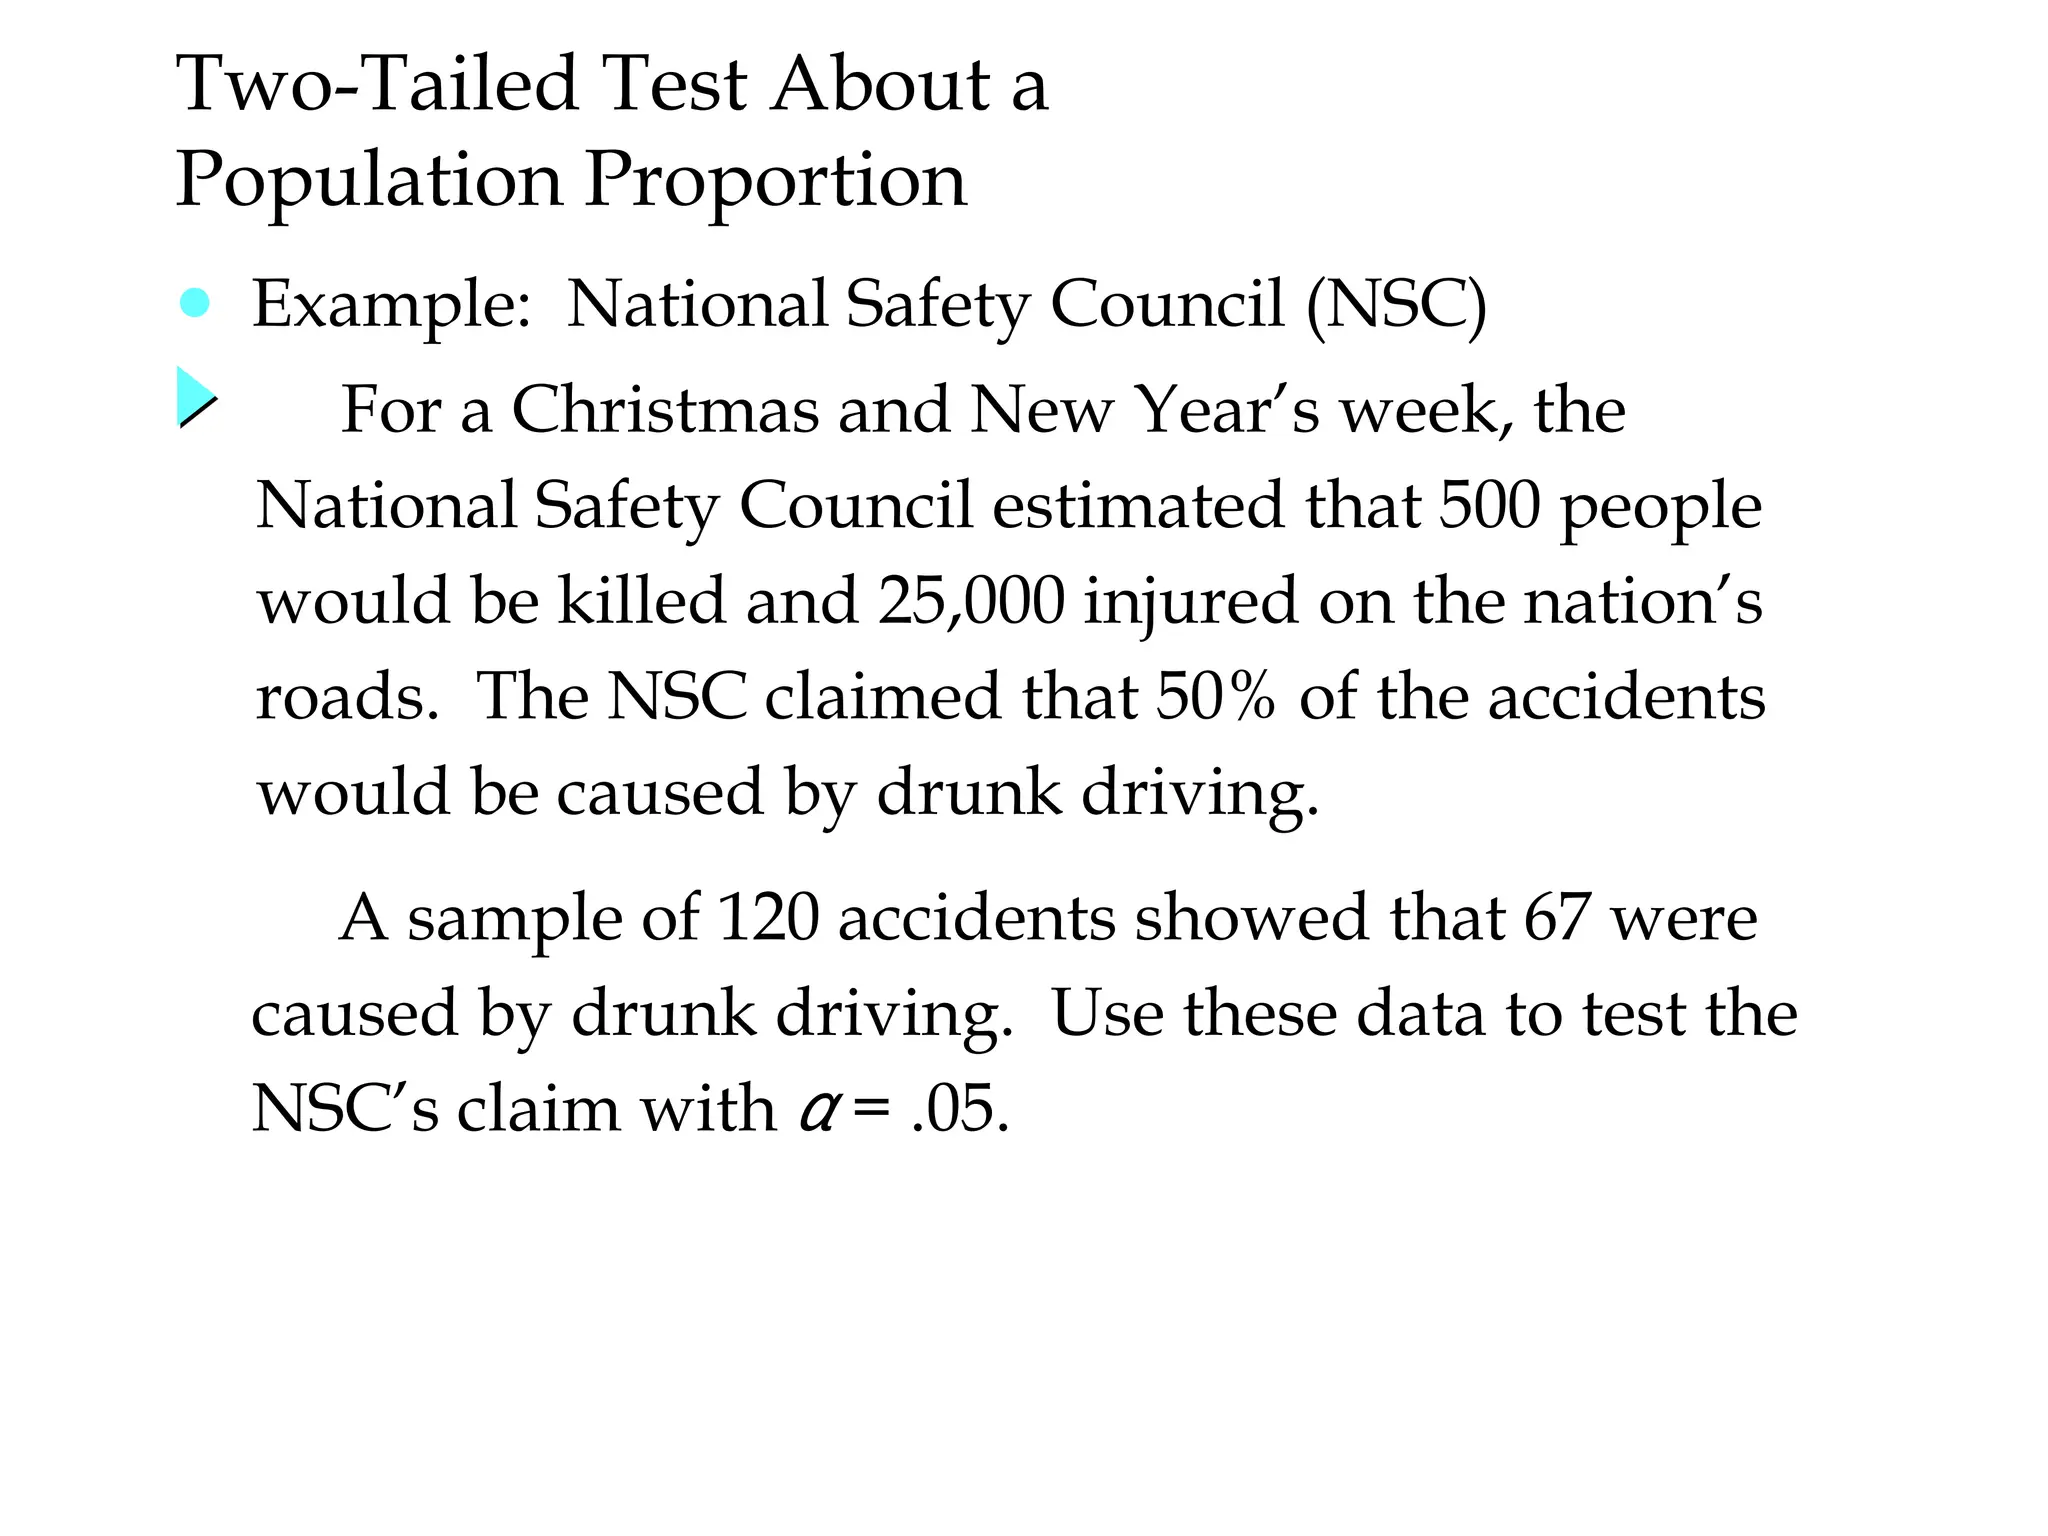
● Example: NationalSafety Council (NSC)
For a Christmas and New Year’s week, the
National Safety Council estimated that 500 people
would be killed and 25,000 injured on the nation’s
roads. The NSC claimed that 50% of the accidents
would be caused by drunk driving.
Two-Tailed Test About a
Population Proportion
A sample of 120 accidents showed that 67 were
caused by drunk driving. Use these data to test the
NSC’s claim with α = .05.
46.
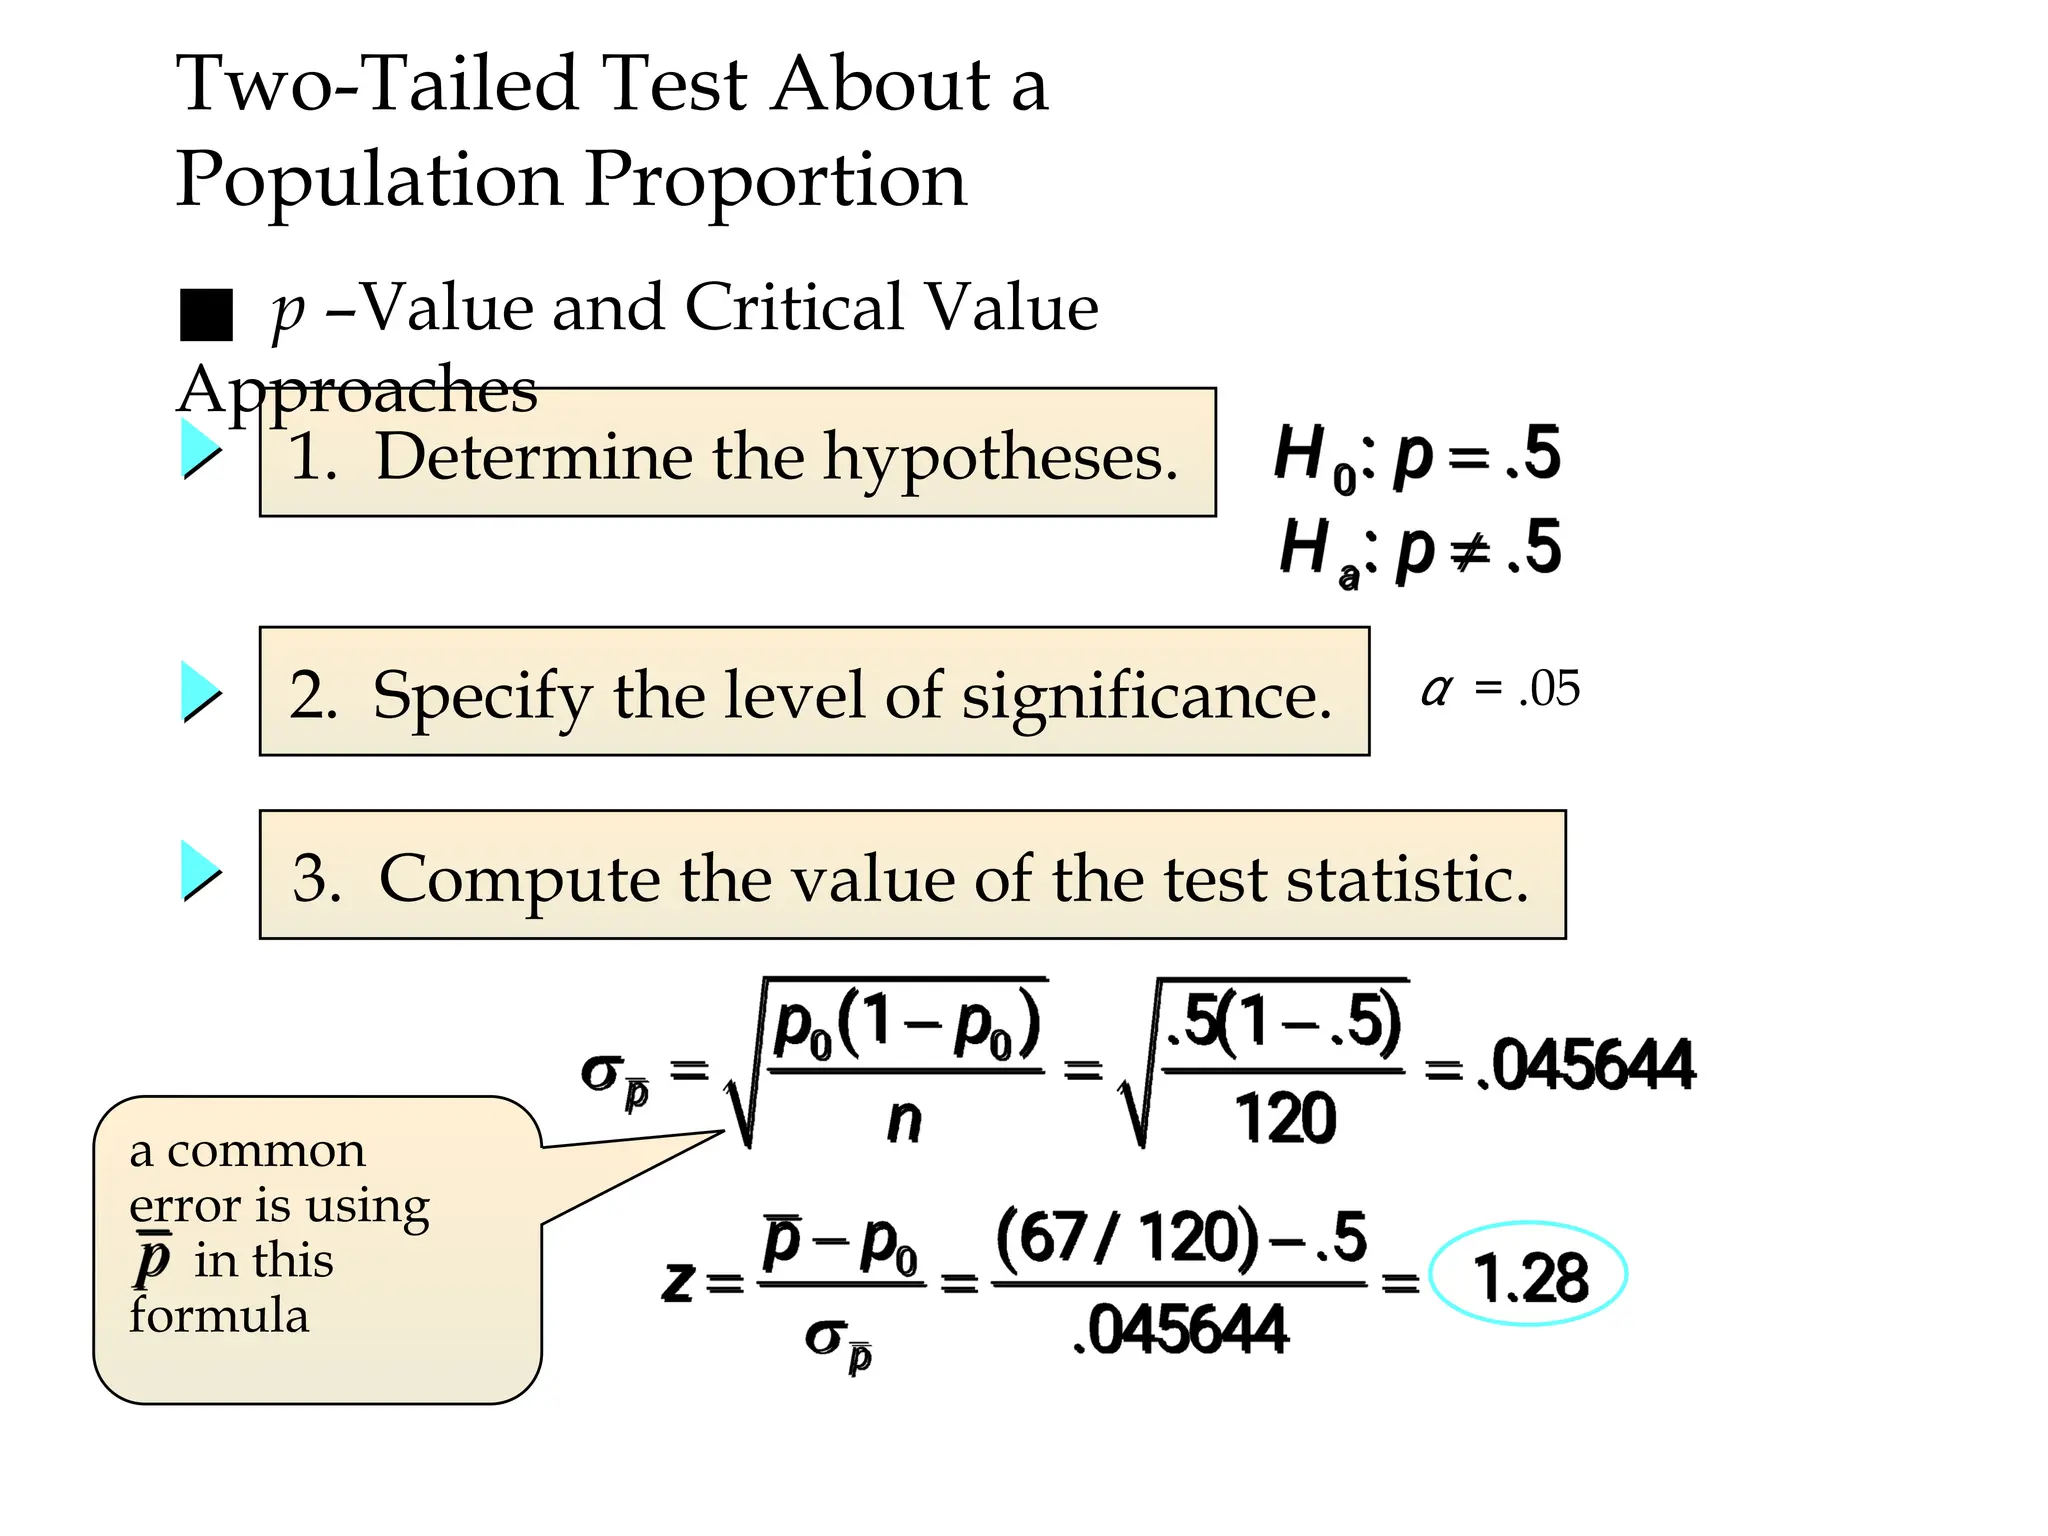
Two-Tailed Test Abouta
Population Proportion
1. Determine the hypotheses.
2. Specify the level of significance.
3. Compute the value of the test statistic.
α = .05
■ p –Value and Critical Value
Approaches
a common
error is using
in this
formula
47.
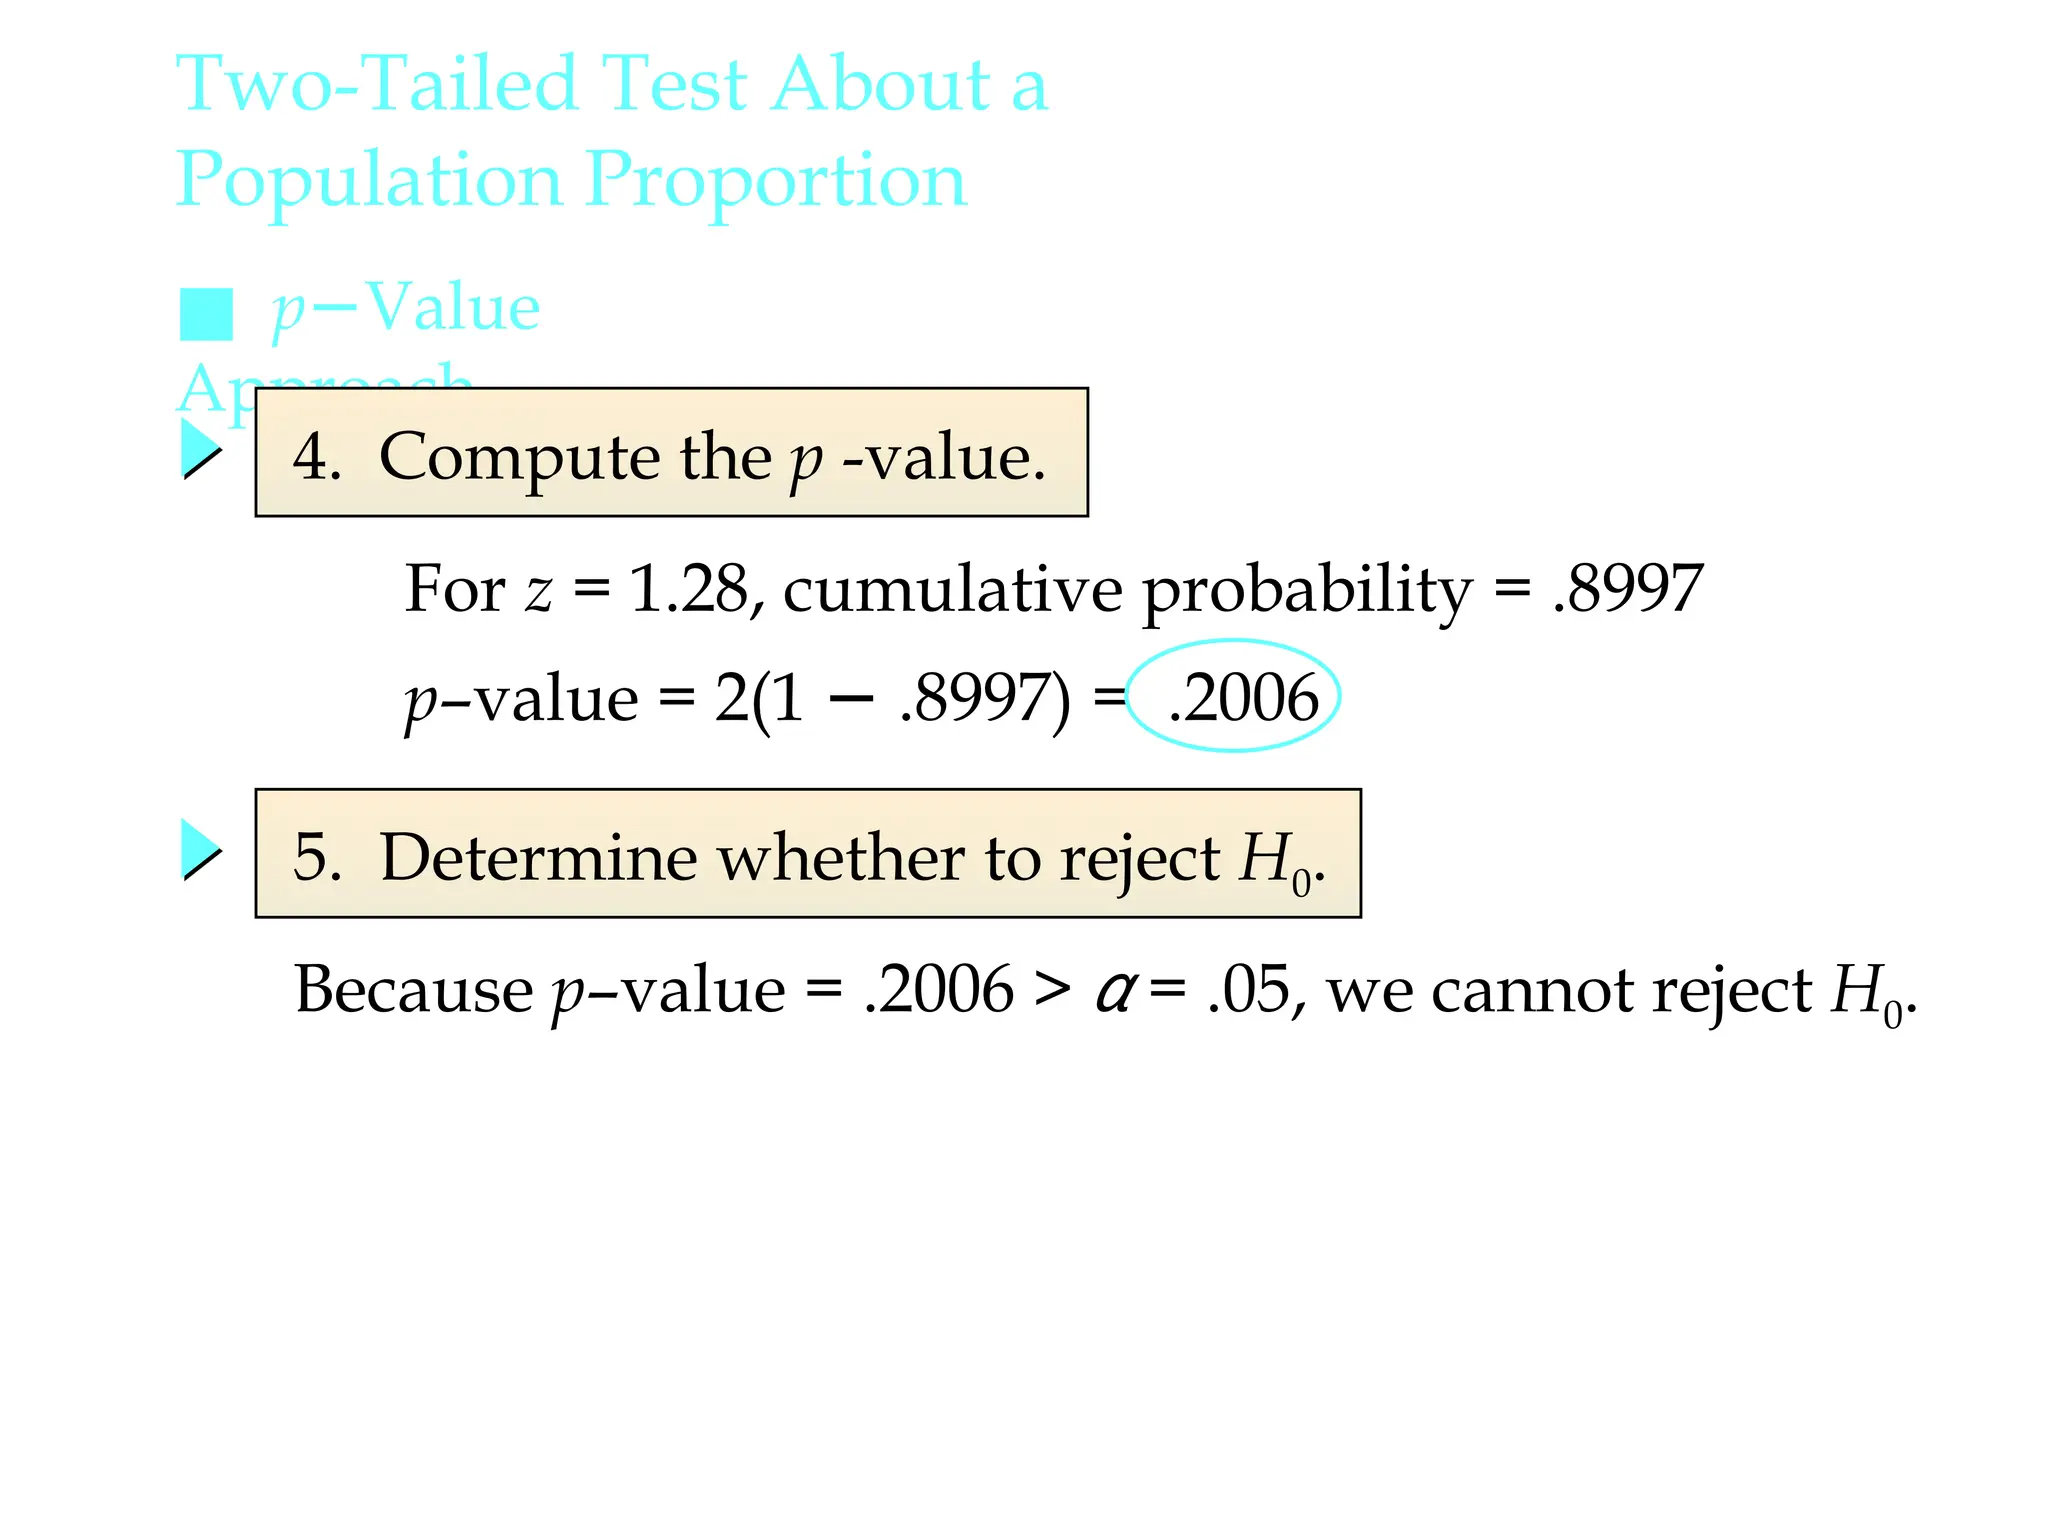
■ p−Value
Approach
4. Computethe p -value.
5. Determine whether to reject H0.
Because p–value = .2006 > α = .05, we cannot reject H0.
Two-Tailed Test About a
Population Proportion
For z = 1.28, cumulative probability = .8997
p–value = 2(1 − .8997) = .2006
48.
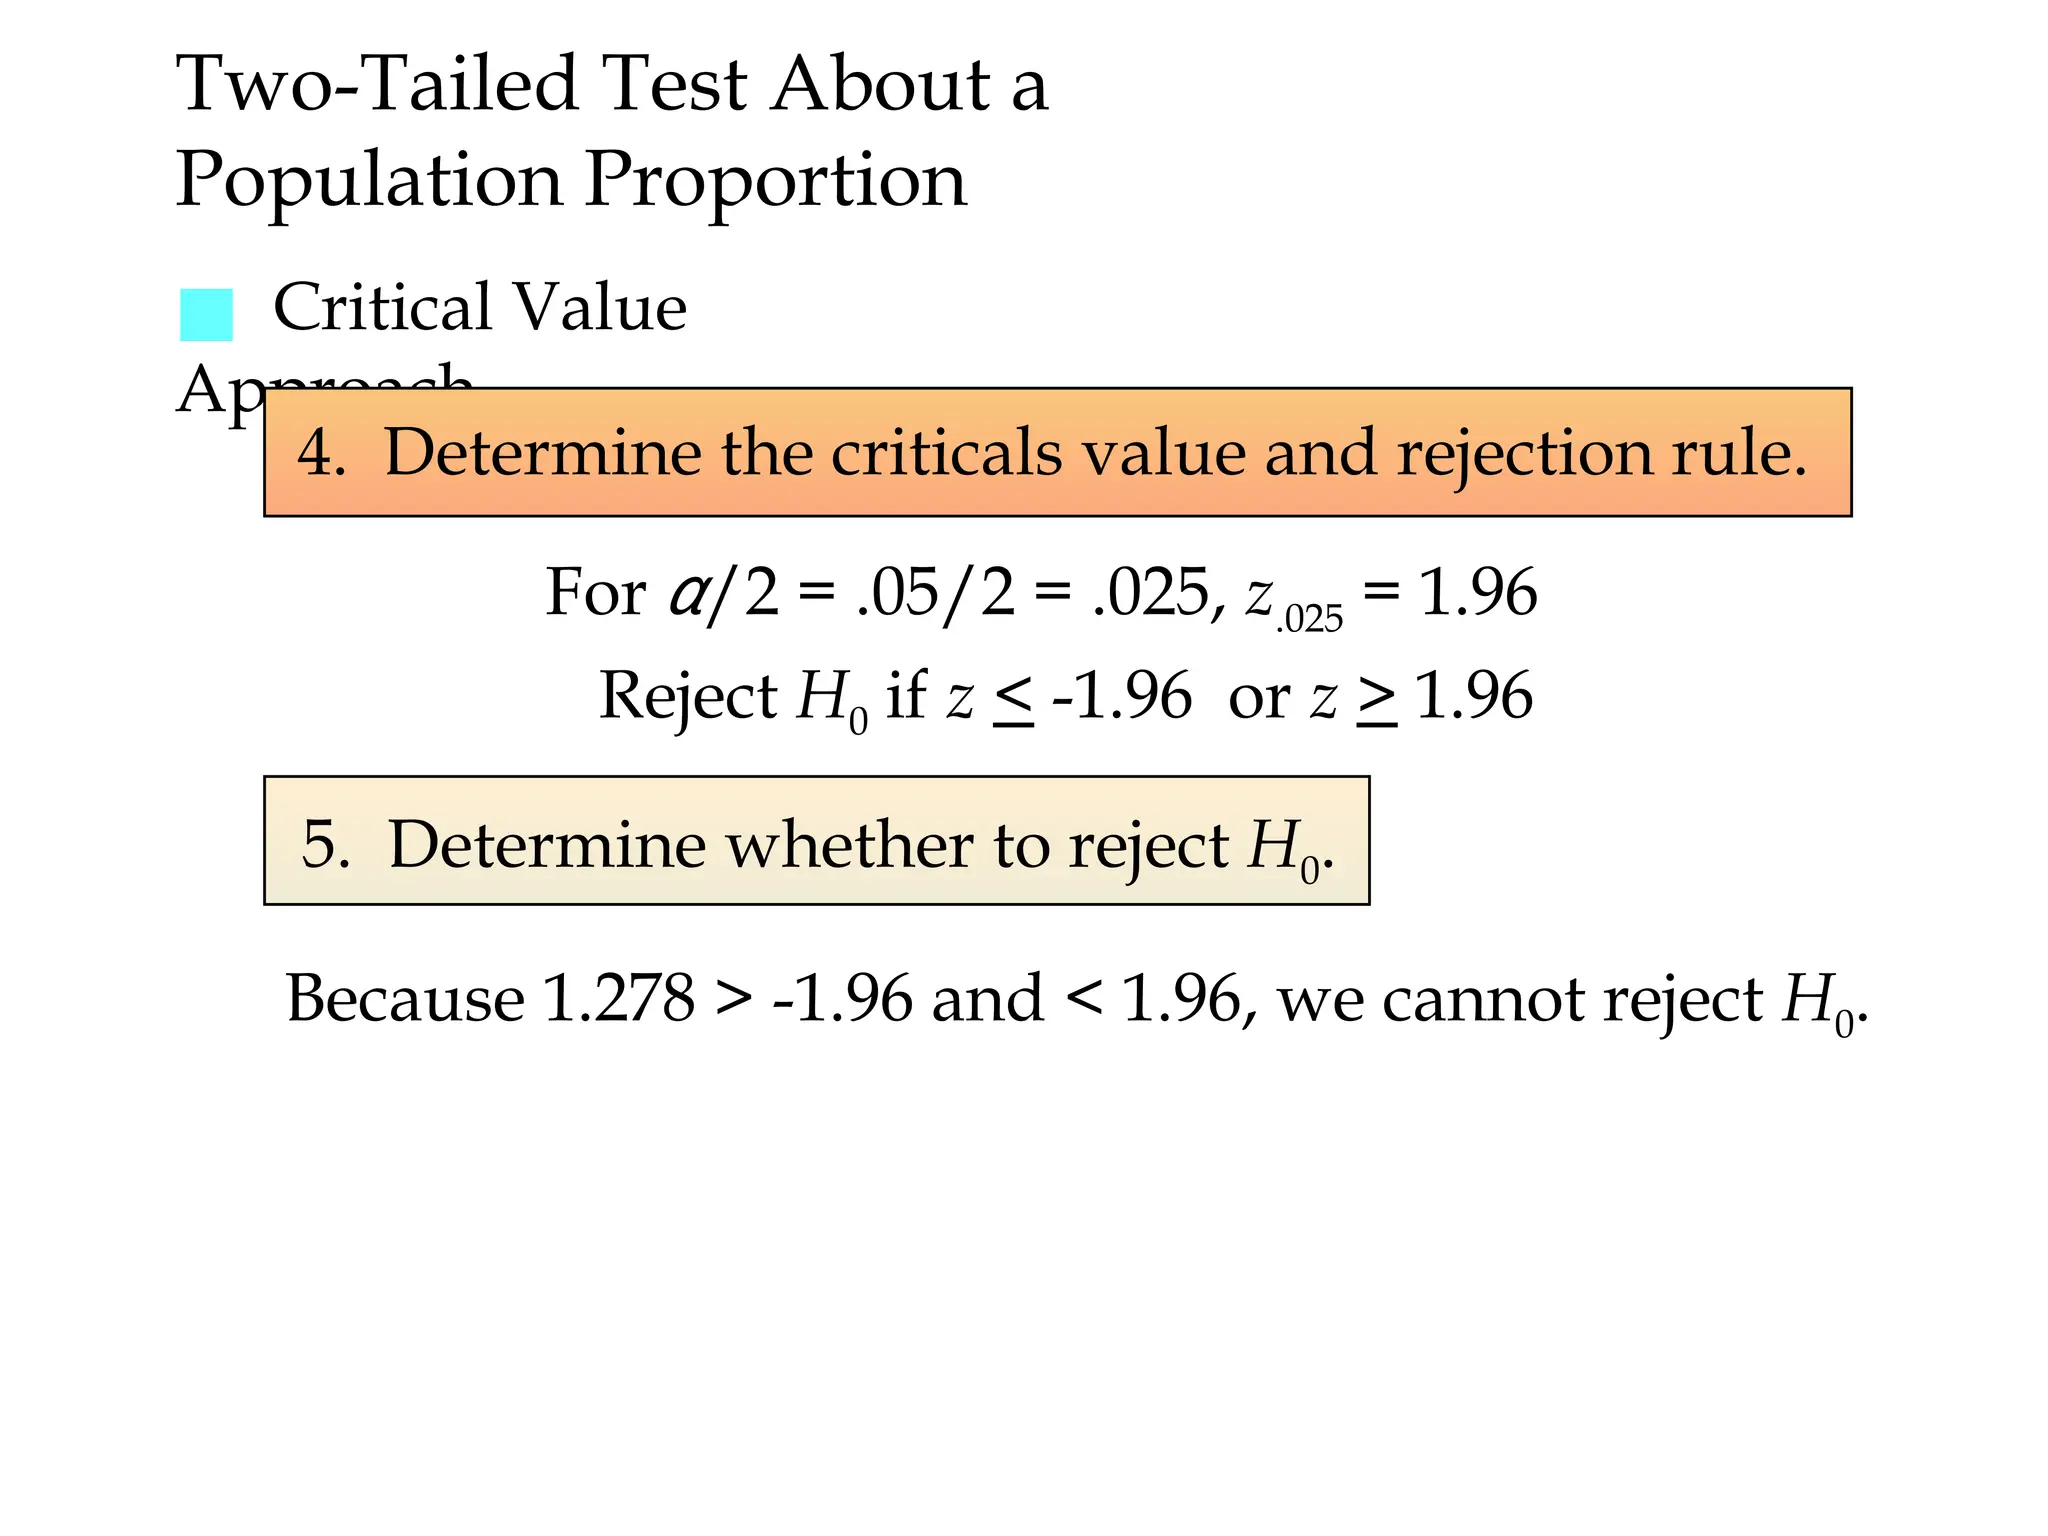
Two-Tailed Test Abouta
Population Proportion
■ Critical Value
Approach
5. Determine whether to reject H0.
For α/2 = .05/2 = .025, z.025 = 1.96
4. Determine the criticals value and rejection rule.
Reject H0 if z < -1.96 or z > 1.96
Because 1.278 > -1.96 and < 1.96, we cannot reject H0.
49.
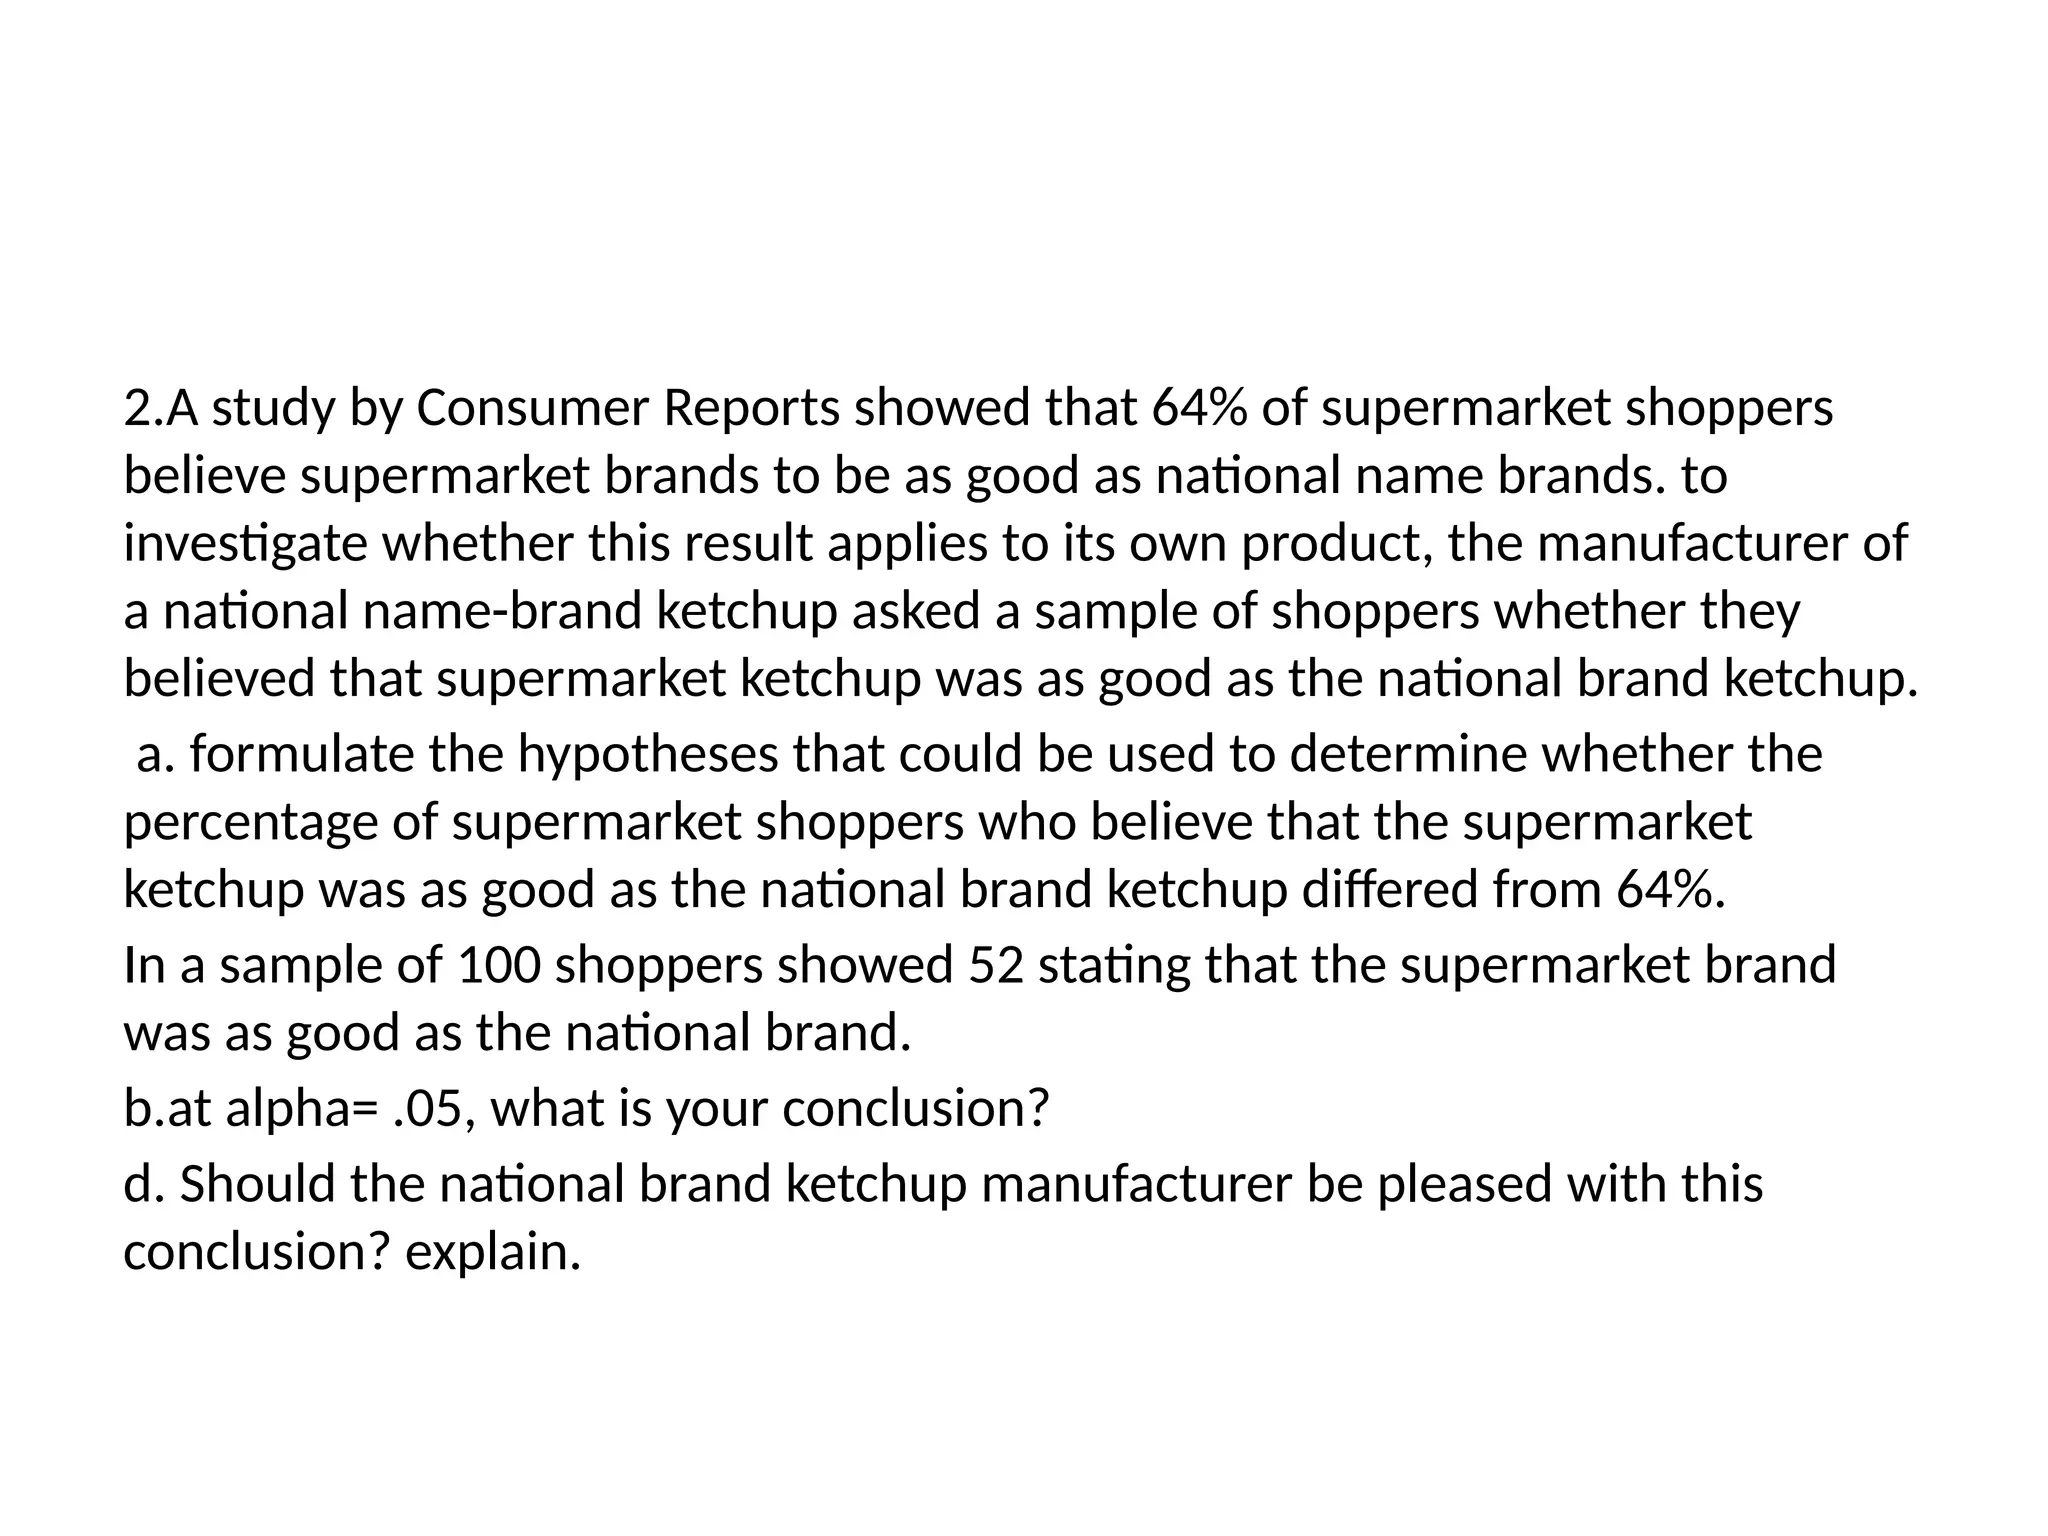
2.A study byConsumer Reports showed that 64% of supermarket shoppers
believe supermarket brands to be as good as national name brands. to
investigate whether this result applies to its own product, the manufacturer of
a national name-brand ketchup asked a sample of shoppers whether they
believed that supermarket ketchup was as good as the national brand ketchup.
a. formulate the hypotheses that could be used to determine whether the
percentage of supermarket shoppers who believe that the supermarket
ketchup was as good as the national brand ketchup differed from 64%.
In a sample of 100 shoppers showed 52 stating that the supermarket brand
was as good as the national brand.
b.at alpha= .05, what is your conclusion?
d. Should the national brand ketchup manufacturer be pleased with this
conclusion? explain.
50.
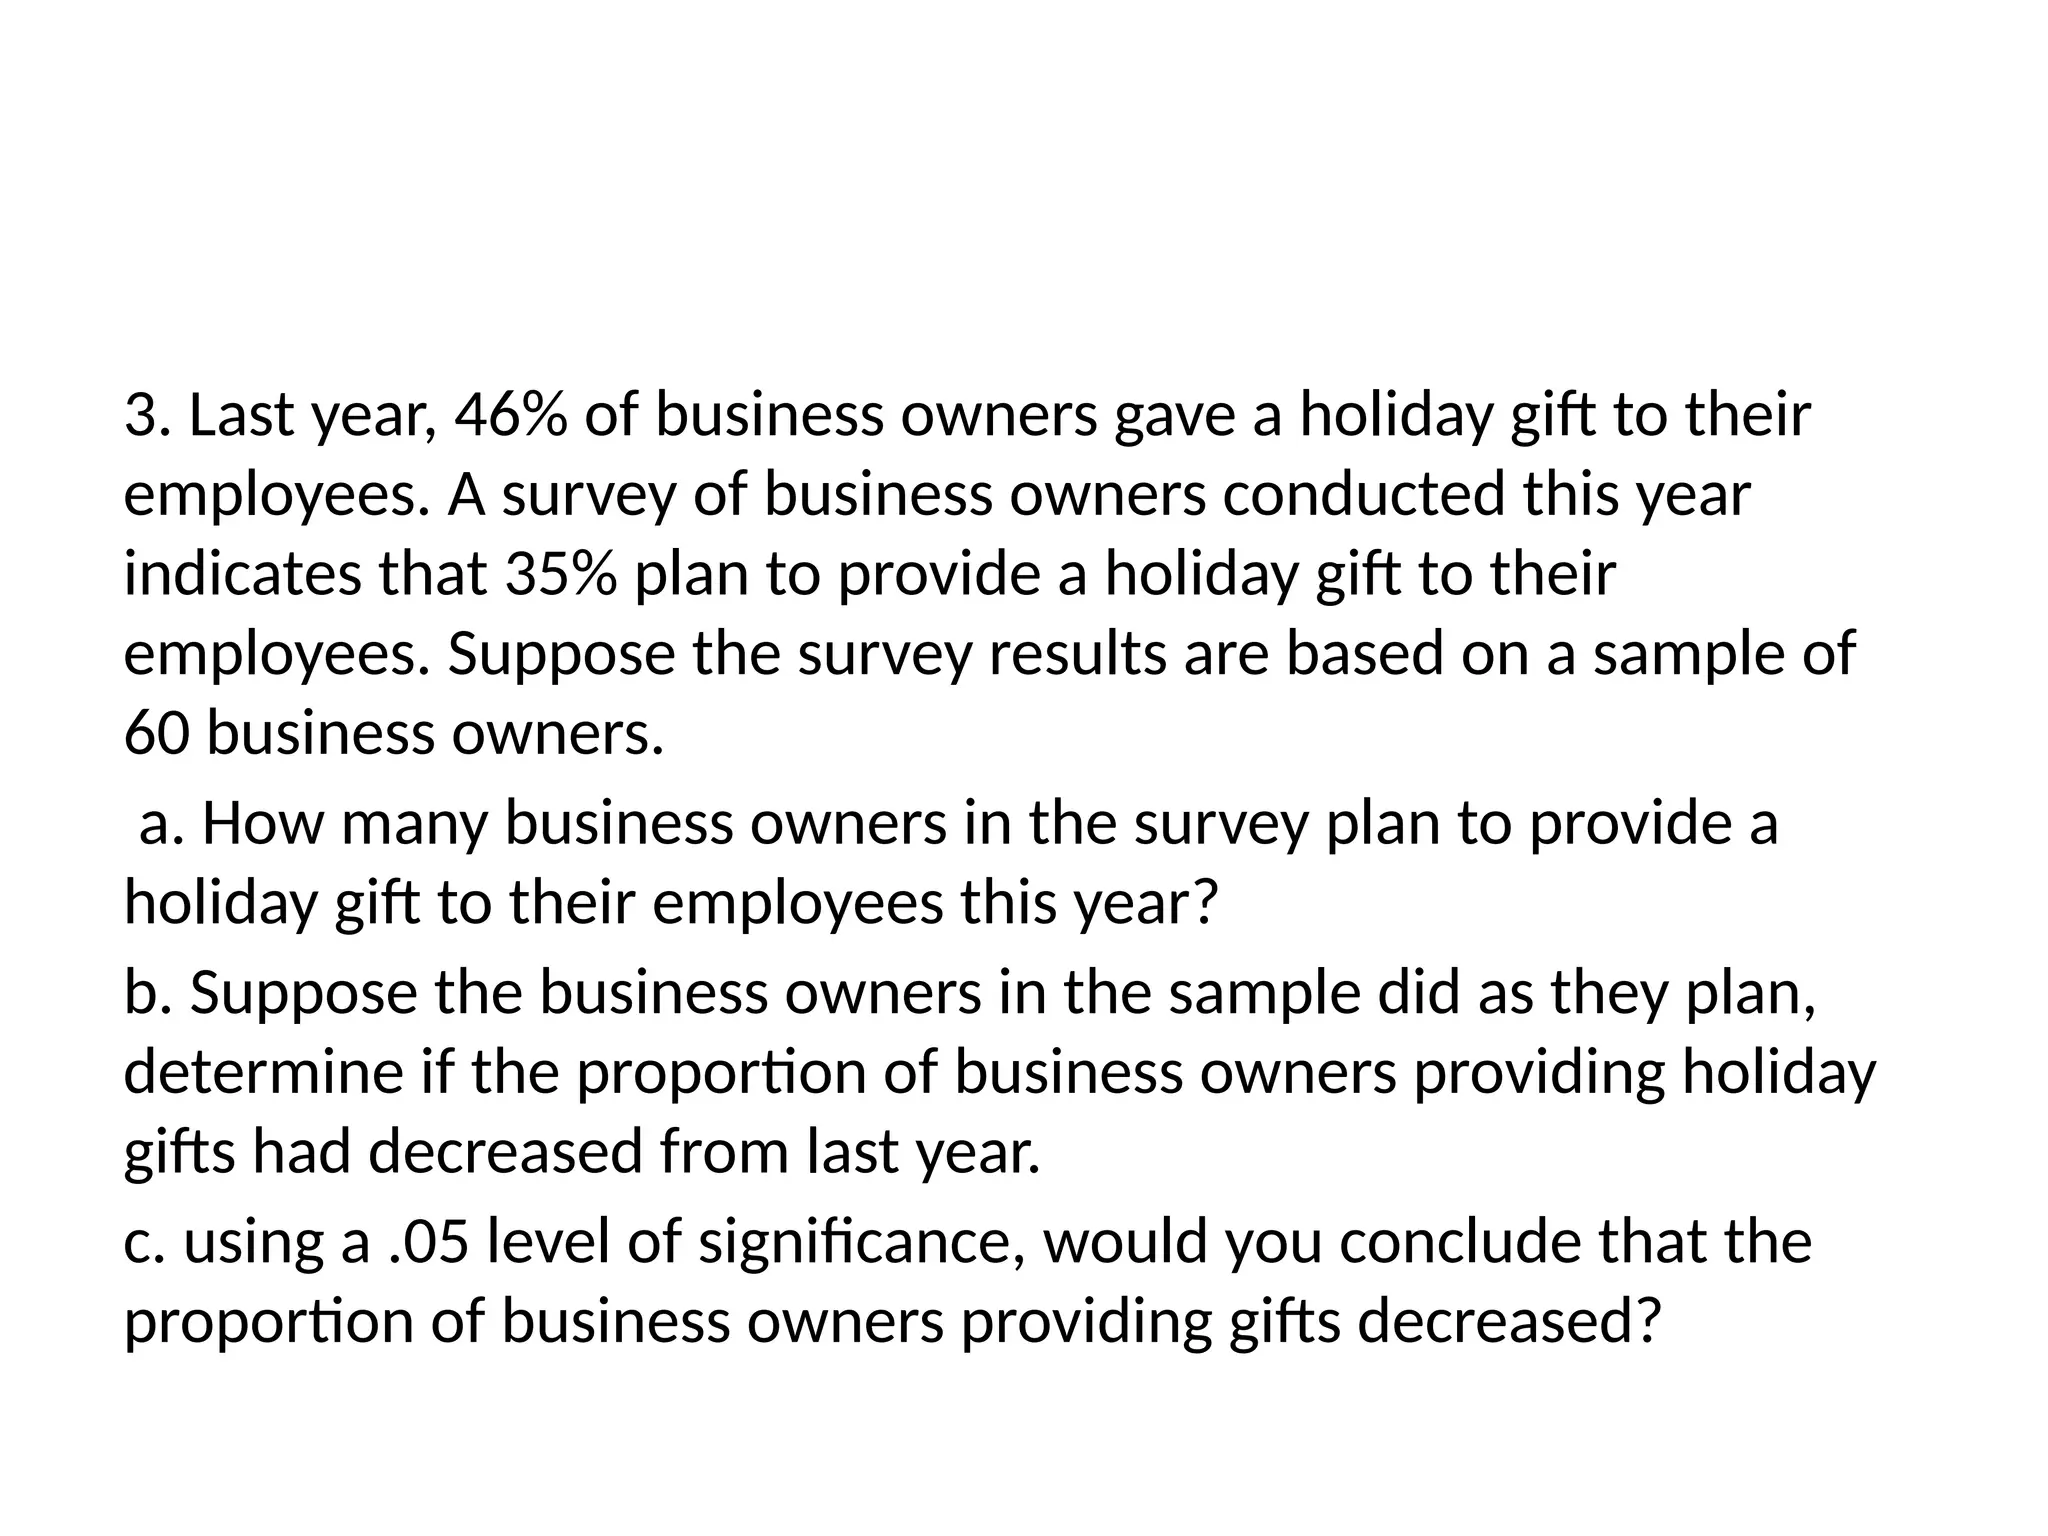
3. Last year,46% of business owners gave a holiday gift to their
employees. A survey of business owners conducted this year
indicates that 35% plan to provide a holiday gift to their
employees. Suppose the survey results are based on a sample of
60 business owners.
a. How many business owners in the survey plan to provide a
holiday gift to their employees this year?
b. Suppose the business owners in the sample did as they plan,
determine if the proportion of business owners providing holiday
gifts had decreased from last year.
c. using a .05 level of significance, would you conclude that the
proportion of business owners providing gifts decreased?


![[DSC Europe 25] Miodrag Pesovic & Vladislav Radonjic - Federated Data Archite...](https://cdn.slidesharecdn.com/ss_thumbnails/gsbe3y5it5uhndi4e08e-1-251212103249-f1008e0c-thumbnail.jpg?width=640&height=640&fit=bounds)
![[DSC Europe 25] Dusan Nesic - Securing Tomorrow’s Infrastructure: Why Cyber-P...](https://cdn.slidesharecdn.com/ss_thumbnails/qikbszfftyowjm2q6duw-1-251211083848-8f2ead6b-thumbnail.jpg?width=640&height=640&fit=bounds)

![[DSC Europe 25] Jovan Bogicevic - Legacy to AI-Driven Defense: Transforming D...](https://cdn.slidesharecdn.com/ss_thumbnails/rsarluadt563hntyfc8q-3-251211083849-3e7bc4c0-thumbnail.jpg?width=640&height=640&fit=bounds)
![[DSC Europe 25] Dunja Adzic Jovanovic - AI and Cybersecurity: Defending Data ...](https://cdn.slidesharecdn.com/ss_thumbnails/o1zylpbhrtwnixxq2xj8-7-251211083048-185086f6-thumbnail.jpg?width=640&height=640&fit=bounds)
![[DSC Europe 25] Behzad Hosseini - AI Agents in the Wild: Deploying Models tha...](https://cdn.slidesharecdn.com/ss_thumbnails/3qtejajvsjqrzwfept2c-10-251212103250-7f2b1068-thumbnail.jpg?width=640&height=640&fit=bounds)


![[DSC Europe 25] Kaja Kandare - LLM as a judge.pptx](https://cdn.slidesharecdn.com/ss_thumbnails/arxyccaxsdsd1ba99wjw-7-251212104007-2b4e3f64-thumbnail.jpg?width=640&height=640&fit=bounds)
![[DSC Europe 25] Katherine Forrest - AI NOW: Understanding the Velocity of Cha...](https://cdn.slidesharecdn.com/ss_thumbnails/wvvbruqfrci0sfq9xwgb-4-251212104007-e5ad1987-thumbnail.jpg?width=640&height=640&fit=bounds)
![[DSC Europe 25] Debmalya Biswas - Agentification: the art of transforming man...](https://cdn.slidesharecdn.com/ss_thumbnails/r5azlggvtqiaiiusrqdr-4-251212103249-5a12c89b-thumbnail.jpg?width=640&height=640&fit=bounds)
![[DSC Europe 25] Bassam Maharmeh - Artificial Intelligence: Opportunities and ...](https://cdn.slidesharecdn.com/ss_thumbnails/thhfmr2fqpawzj7hsjpg-5-251211083048-2c23204f-thumbnail.jpg?width=640&height=640&fit=bounds)

![[DSC Europe 25] Jon Dajci - Bridging TradFi and DeFi: Building the Future of ...](https://cdn.slidesharecdn.com/ss_thumbnails/fqmhfvlbqhkihjvqvhmu-7-251211083849-6af7e325-thumbnail.jpg?width=640&height=640&fit=bounds)