Object-Centric
                            Reflection
                                Jorge Ressia
                           Software Composition Group


Thursday, August 30, 12
Profiling


Thursday, August 30, 12
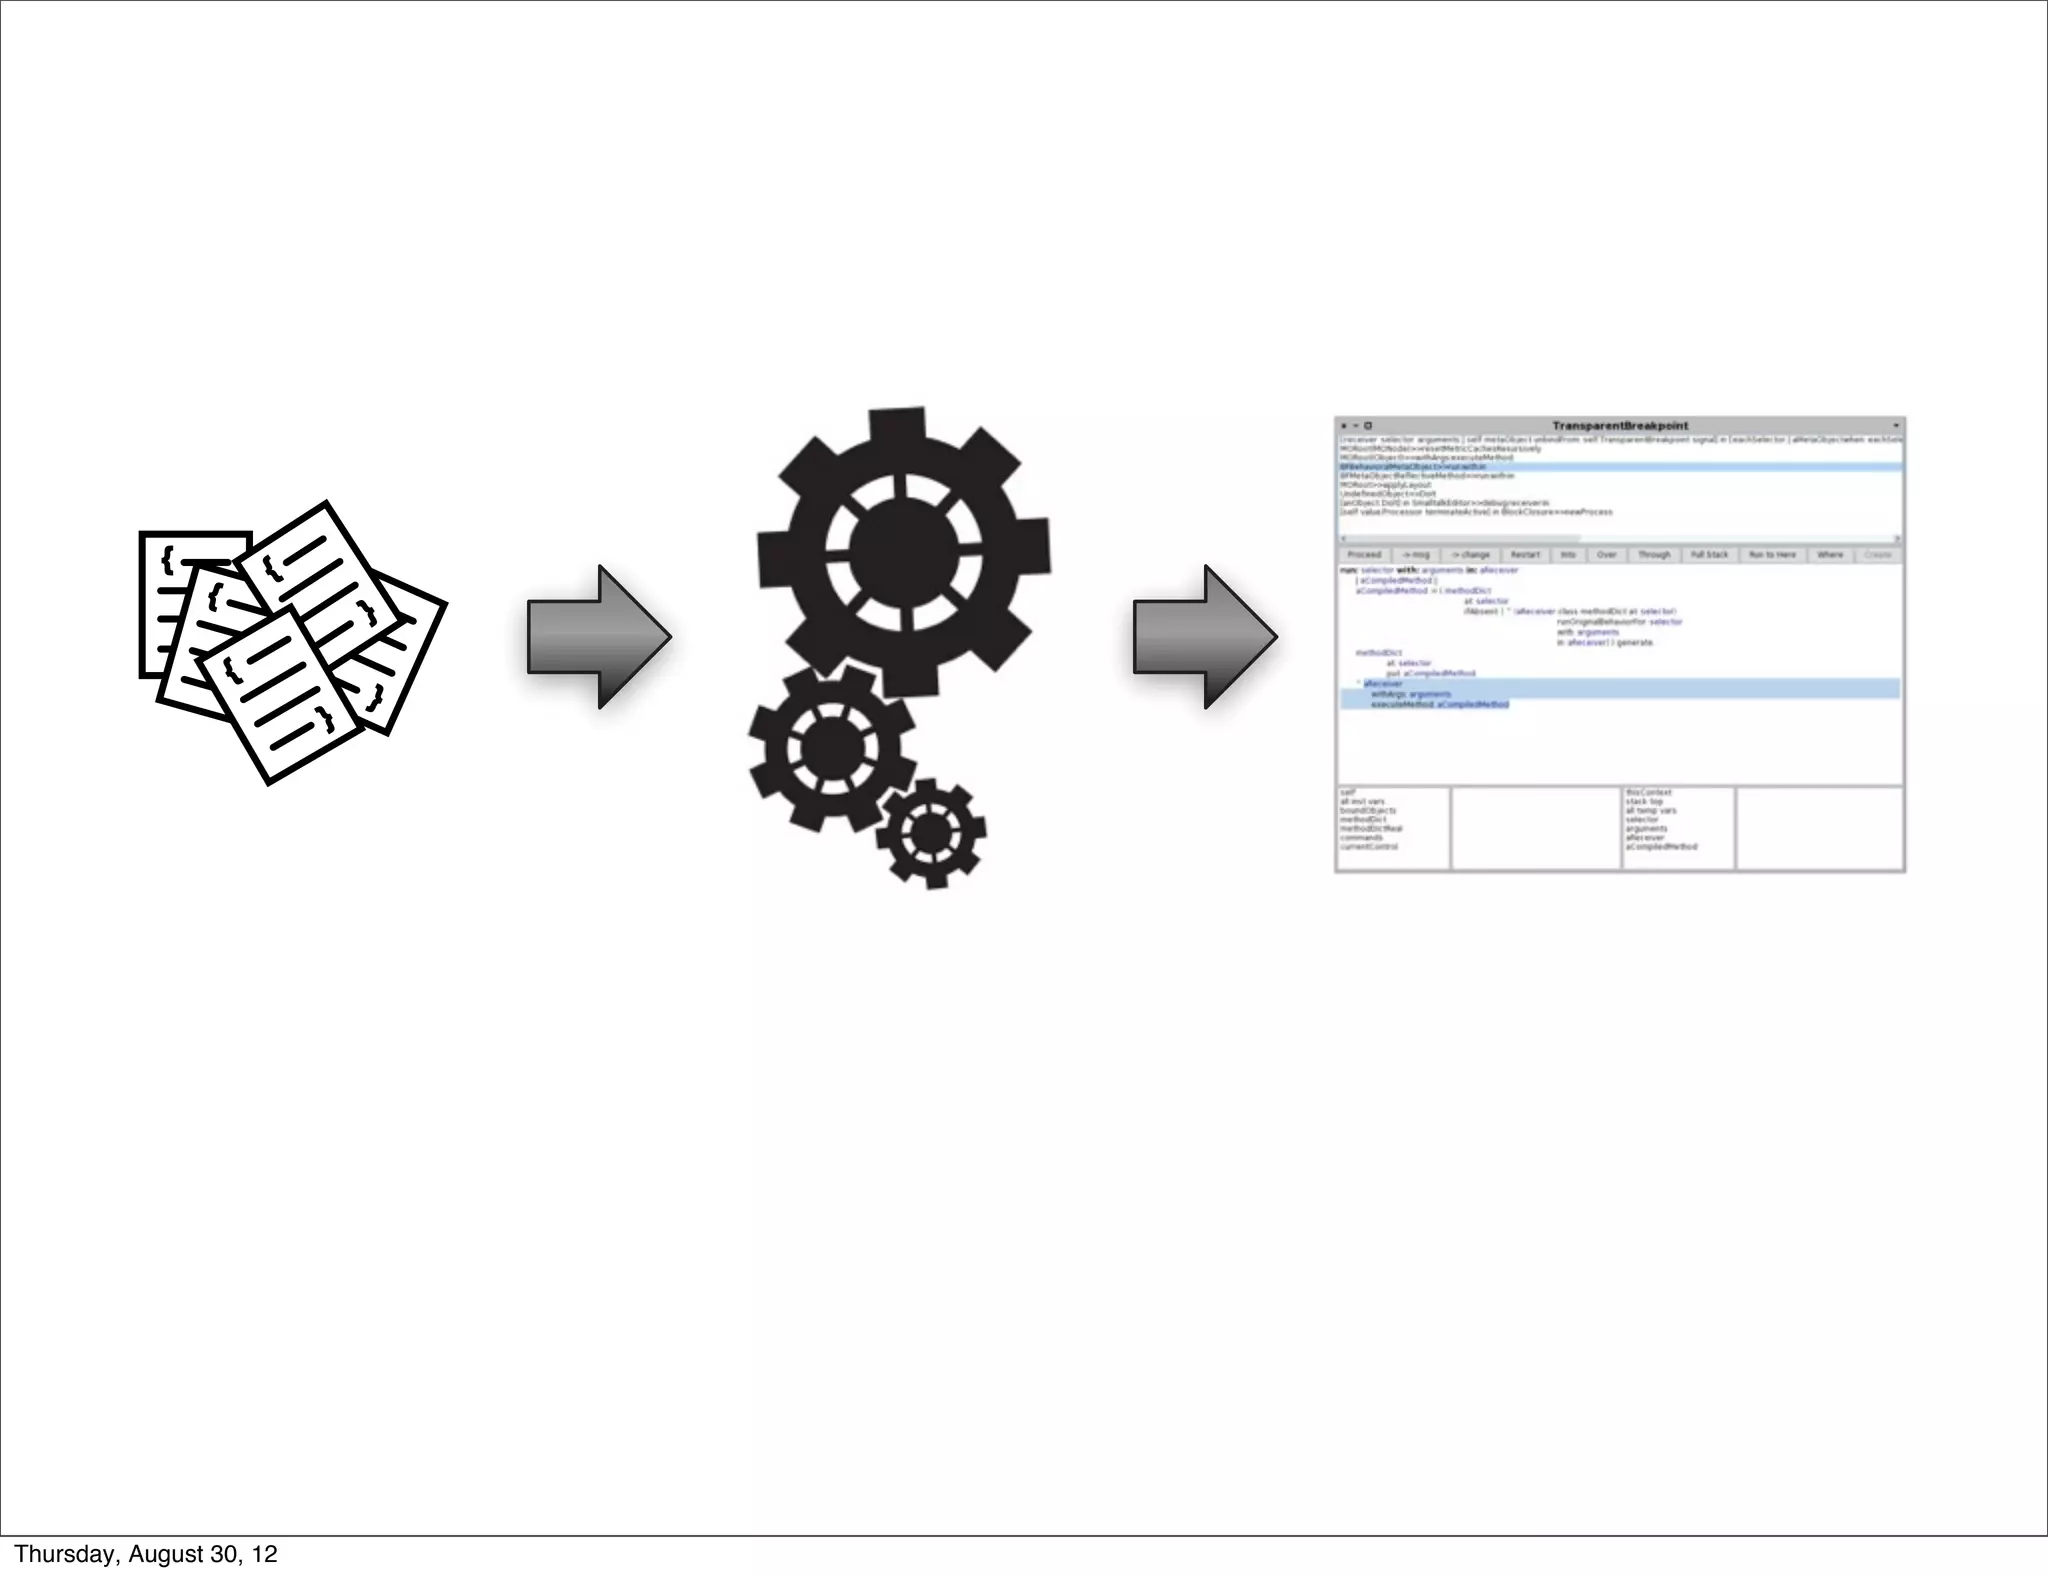
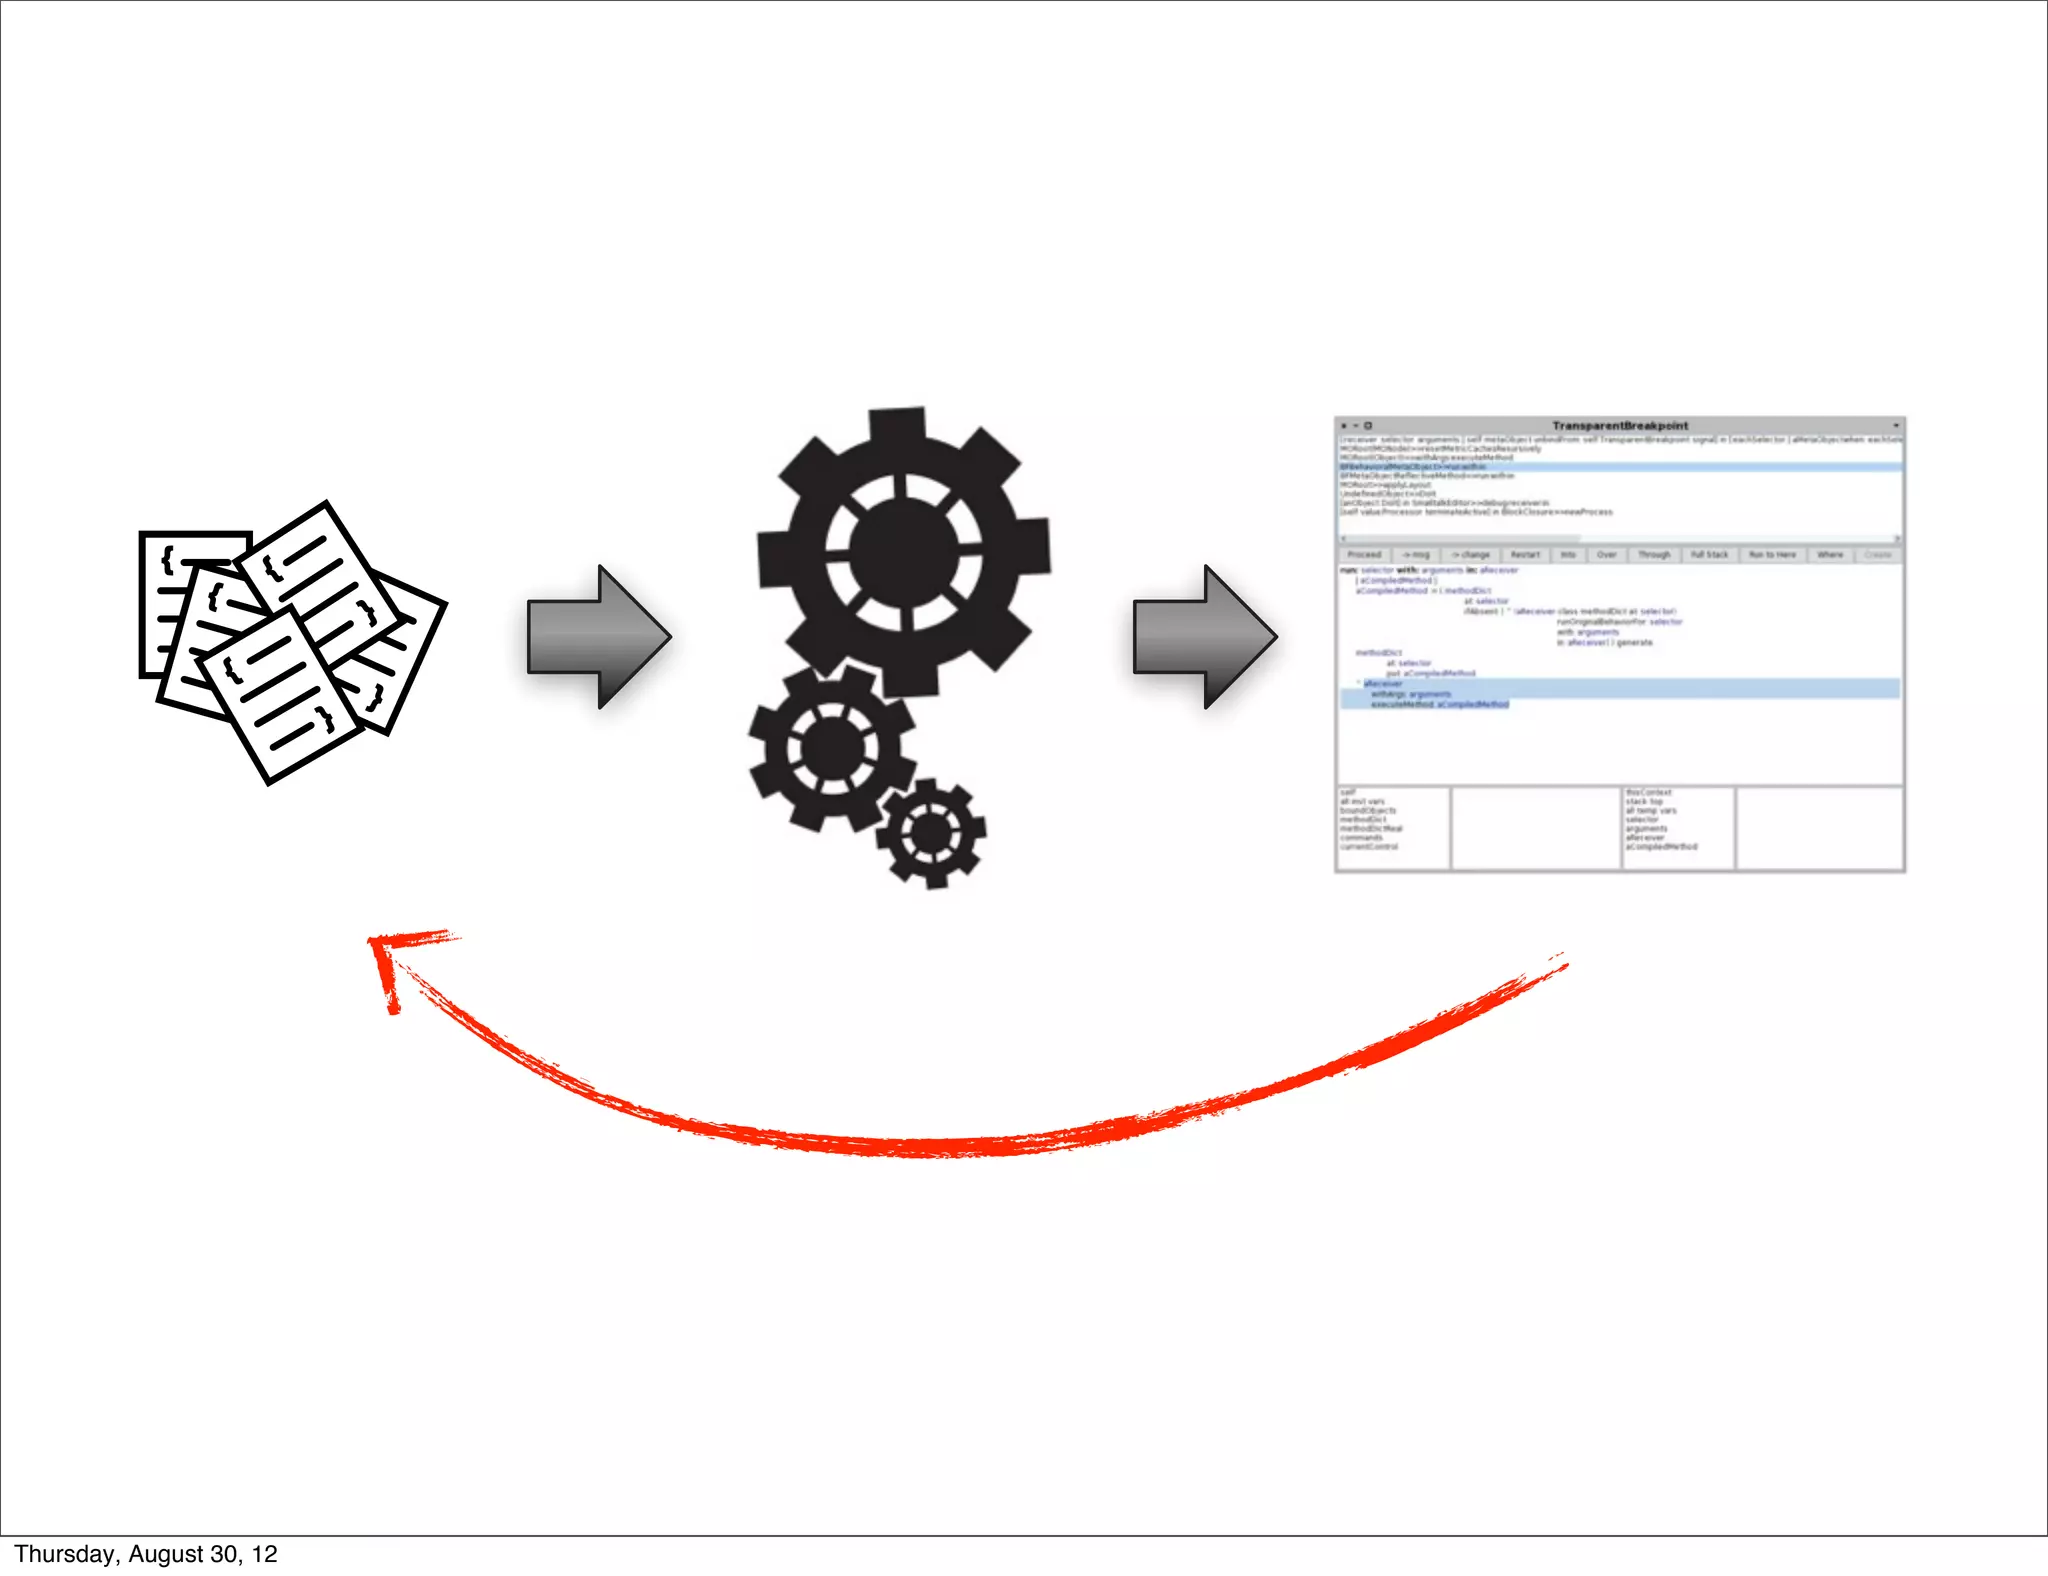
Profiling:
           Is the activity of analyzing a program
           execution.


Thursday, August 30, 12
Domain-Sp

                                                           CPU time profiling
                                                           Mondrian [9] is an open and agile visualization engine.
                                                           visualization using a graph of (possibly nested) nodes an


                                                  Profile
                                                           a serious performance issue was raised1 . Tracking down
                                                           performance was not trivial. We first used a standard sam
                                                                Execution sampling approximates the time spent in an
                                                           by periodically stopping a program and recording the cu
                                                           under executions. Such a profiling technique is relatively
                                                           little impact on the overall execution. This sampling techn
                                                           all mainstream profilers, such as JProfiler, YourKit, xprof
                                                                MessageTally, the standard sampling-based profiler in P
                                                           tually describes the execution in terms of CPU consumpt
                                                           each method of Mondrian:
                                                           54.8% {11501ms} MOCanvas>>drawOn:
                                                            54.8% {11501ms} MORoot(MONode)>>displayOn:
                                                             30.9% {6485ms} MONode>>displayOn:
                  {               {                            | 18.1% {3799ms} MOEdge>>displayOn:
                      {                   {                       ...
                                              }                | 8.4% {1763ms} MOEdge>>displayOn:
                          }
                          }
                                                               | | 8.0% {1679ms} MOStraightLineShape>>display:on:
                                                               | | 2.6% {546ms} FormCanvas>>line:to:width:color:
                              }       {       }                  ...
                                                             23.4% {4911ms} MOEdge>>displayOn:
                                                                 ...

                                                              We can observe that the virtual machine spent abou
                                                           the method displayOn: defined in the class MORoot. A ro
                                                           nested node that contains all the nodes of the edges of t
                                                           general profiling information says that rendering nodes a
                                                           great share of the CPU time, but it does not help in pin
                                                           and edges are responsible for the time spent. Not all grap
                                                           consume resources.
                                                              Traditional execution sampling profilers center their r
                                                           the execution stack and completely ignore the identity of th
                                                           the method call and its arguments. As a consequence, it
                                                           which objects cause the slowdown. For the example above,
                                                           says that we spent 30.9% in MONode>>displayOn: withou
                                                           were actually refreshed too often.

                                                           Coverage
                                                           PetitParser is a parsing framework combining ideas from
                                                           parser combinators, parsing expression grammars and pac
                                                           grammars and parsers as objects that can be reconfigured
Thursday, August 30, 12                                    1
                                                               http://forum.world.st/Mondrian-is-slow-next-step-tc
CPU time profiling
                                                          Mondrian [9] is an open and agile visualization engine.


                                                 Profile
                                                          visualization using a graph of (possibly nested) nodes an
                                                          a serious performance issue was raised1 . Tracking down
                                                          performance was not trivial. We first used a standard sam
                                                               Execution sampling approximates the time spent in an
                                                          by periodically stopping a program and recording the cu
                                                          under executions. Such a profiling technique is relatively
                                                          little impact on the overall execution. This sampling techn
                                                          all mainstream profilers, such as JProfiler, YourKit, xprof
                                                               MessageTally, the standard sampling-based profiler in P
                                                          tually describes the execution in terms of CPU consumpt
                                                          each method of Mondrian:
                                                          54.8% {11501ms} MOCanvas>>drawOn:
                                                           54.8% {11501ms} MORoot(MONode)>>displayOn:
                 {               {                          30.9% {6485ms} MONode>>displayOn:
                     {                   {                    | 18.1% {3799ms} MOEdge>>displayOn:
                                             }                   ...
                         }
                         }                                    | 8.4% {1763ms} MOEdge>>displayOn:
                                                              | | 8.0% {1679ms} MOStraightLineShape>>display:on:
                             }       {       }                | | 2.6% {546ms} FormCanvas>>line:to:width:color:
                                                                ...
                                                            23.4% {4911ms} MOEdge>>displayOn:
                                                                ...

                                                             We can observe that the virtual machine spent abou
                                                          the method displayOn: defined in the class MORoot. A ro
                                                          nested node that contains all the nodes of the edges of t
                                                          general profiling information says that rendering nodes a
                                                          great share of the CPU time, but it does not help in pin
                                                          and edges are responsible for the time spent. Not all grap
                                                          consume resources.
                                                             Traditional execution sampling profilers center their r
                                                          the execution stack and completely ignore the identity of th
                                                          the method call and its arguments. As a consequence, it
                                                          which objects cause the slowdown. For the example above,
                                                          says that we spent 30.9% in MONode>>displayOn: withou
                                                          were actually refreshed too often.


                                                 Domain
                                                          Coverage
                                                          PetitParser is a parsing framework combining ideas from
                                                          parser combinators, parsing expression grammars and pac
                                                          grammars and parsers as objects that can be reconfigured
                                                          1
                                                              http://forum.world.st/Mondrian-is-slow-next-step-tc
                                                              a2261116
                                                          2
                                                              http://www.pharo-project.org/


Thursday, August 30, 12
Mondrian


Thursday, August 30, 12
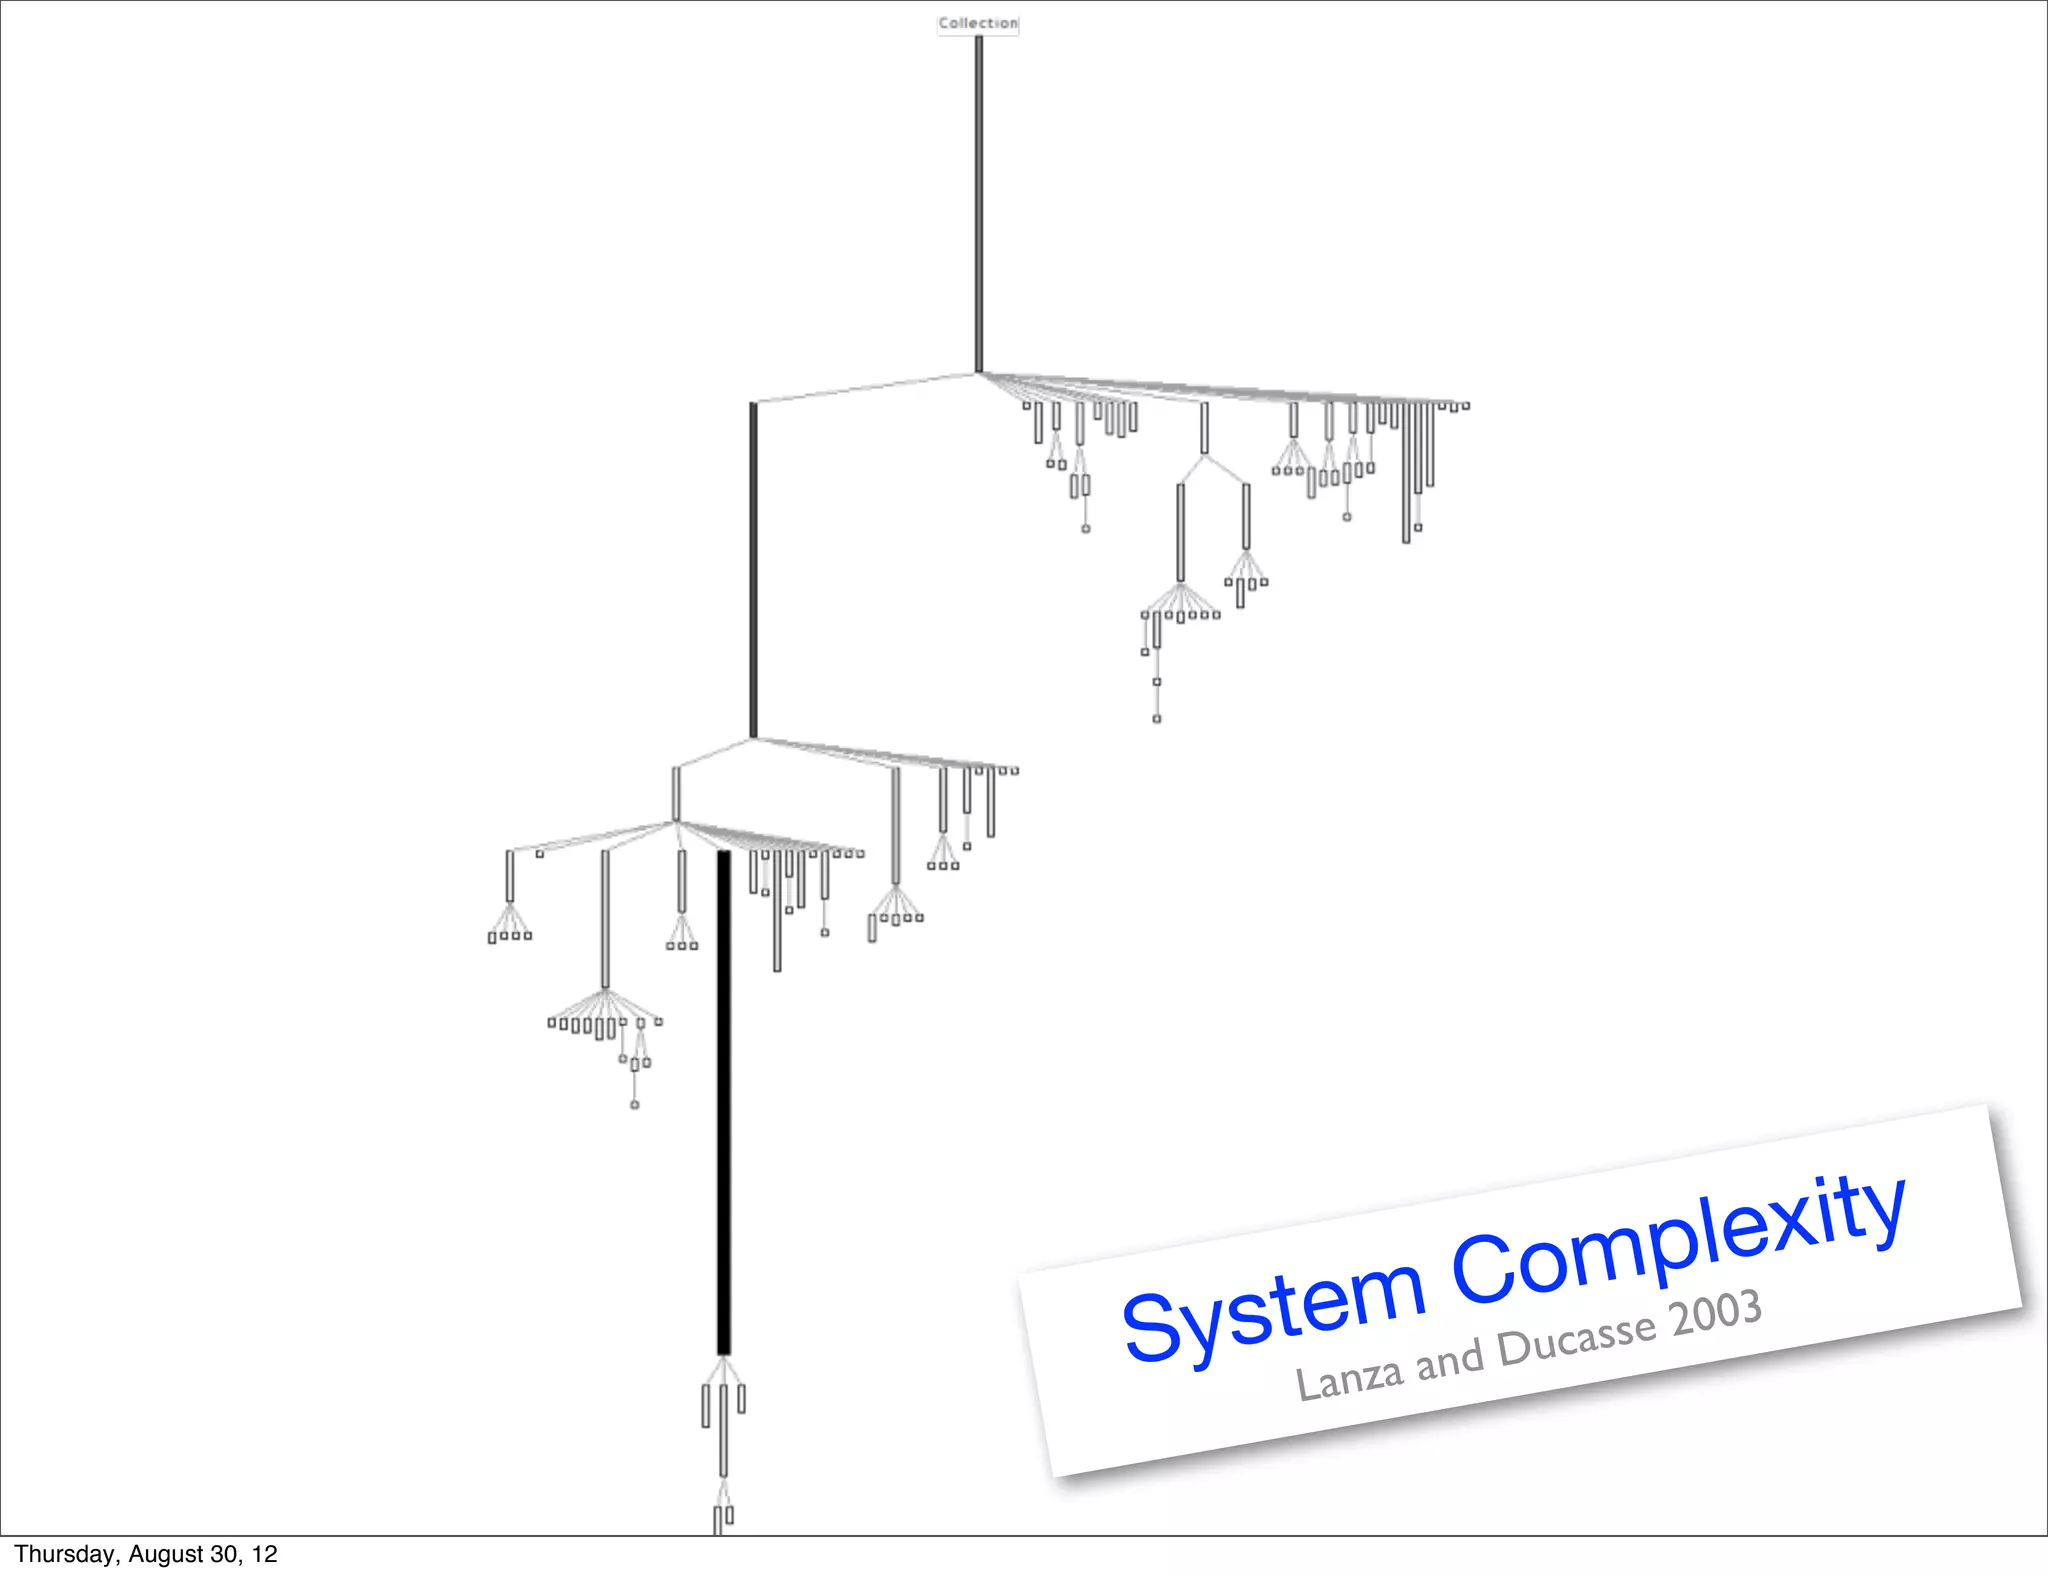
C omp lexity
                            stemand Ducasse 2003
                          Sy zaLan


Thursday, August 30, 12
little impact on the overall execution. This sampling technique is u
                  all mainstream profilers, such as JProfiler, YourKit, xprof [10], an
                       MessageTally, the standard sampling-based profiler in Pharo Sm
                  tually describes the execution in terms of CPU consumption and i
                  each method of Mondrian:
                  54.8% {11501ms} MOCanvas>>drawOn:
                   54.8% {11501ms} MORoot(MONode)>>displayOn:
                    30.9% {6485ms} MONode>>displayOn:
                      | 18.1% {3799ms} MOEdge>>displayOn:
                         ...
                      | 8.4% {1763ms} MOEdge>>displayOn:
                      | | 8.0% {1679ms} MOStraightLineShape>>display:on:
                      | | 2.6% {546ms} FormCanvas>>line:to:width:color:
                        ...
                    23.4% {4911ms} MOEdge>>displayOn:
                        ...

                     We can observe that the virtual machine spent about 54% o
                  the method displayOn: defined in the class MORoot. A root is the
                  nested node that contains all the nodes of the edges of the visua
                  general profiling information says that rendering nodes and edge
                  great share of the CPU time, but it does not help in pinpointing
Thursday, August 30, 12
Domain-Specific Profiling        3

                   CPU time profiling

                                               Which is the relationship?
                   Mondrian [9] is an open and agile visualization engine. Mondrian describes a
                   visualization using a graph of (possibly nested) nodes and edges. In June 2010
                   a serious performance issue was raised1 . Tracking down the cause of the poor
                   performance was not trivial. We first used a standard sample-based profiler.
                        Execution sampling approximates the time spent in an application’s methods
                   by periodically stopping a program and recording the current set of methods
                   under executions. Such a profiling technique is relatively accurate since it has
                   little impact on the overall execution. This sampling technique is used by almost
                   all mainstream profilers, such as JProfiler, YourKit, xprof [10], and hprof.
                        MessageTally, the standard sampling-based profiler in Pharo Smalltalk2 , tex-
                   tually describes the execution in terms of CPU consumption and invocation for
                   each method of Mondrian:
                   54.8% {11501ms} MOCanvas>>drawOn:
                    54.8% {11501ms} MORoot(MONode)>>displayOn:
                     30.9% {6485ms} MONode>>displayOn:


                                                                                       ?
                       | 18.1% {3799ms} MOEdge>>displayOn:
                          ...
                       | 8.4% {1763ms} MOEdge>>displayOn:
                       | | 8.0% {1679ms} MOStraightLineShape>>display:on:
                       | | 2.6% {546ms} FormCanvas>>line:to:width:color:
                         ...
                     23.4% {4911ms} MOEdge>>displayOn:
                         ...

                      We can observe that the virtual machine spent about 54% of its time in
                   the method displayOn: defined in the class MORoot. A root is the unique non-
                   nested node that contains all the nodes of the edges of the visualization. This
                   general profiling information says that rendering nodes and edges consumes a
                   great share of the CPU time, but it does not help in pinpointing which nodes
                   and edges are responsible for the time spent. Not all graphical elements equally
                   consume resources.
                      Traditional execution sampling profilers center their result on the frames of
                   the execution stack and completely ignore the identity of the object that received
                   the method call and its arguments. As a consequence, it is hard to track down
                   which objects cause the slowdown. For the example above, the traditional profiler
                   says that we spent 30.9% in MONode>>displayOn: without saying which nodes
                   were actually refreshed too often.

                   Coverage
                   PetitParser is a parsing framework combining ideas from scannerless parsing,
                   parser combinators, parsing expression grammars and packrat parsers to model
Thursday, August 30, 12
                   grammars and parsers as objects that can be reconfigured dynamically [11].
Debugging


Thursday, August 30, 12
Debugging:
           Is the process of interacting with a
           running software system to test and
           understand its current behavior.


Thursday, August 30, 12
Mondrian


Thursday, August 30, 12
C omp lexity
                            stemand Ducasse 2003
                          Sy zaLan


Thursday, August 30, 12
Rendering


Thursday, August 30, 12
Shape and Nodes


Thursday, August 30, 12
How do we debug
                               this?


Thursday, August 30, 12
Breakpoints


Thursday, August 30, 12
Conditional
                          Breakpoints


Thursday, August 30, 12
{               {
                {                   {
                                        }
                    }
                    }
                        }       {       }


Thursday, August 30, 12
{               {
                {                   {
                                        }
                    }
                    }
                        }       {       }


Thursday, August 30, 12
Developer Questions


Thursday, August 30, 12
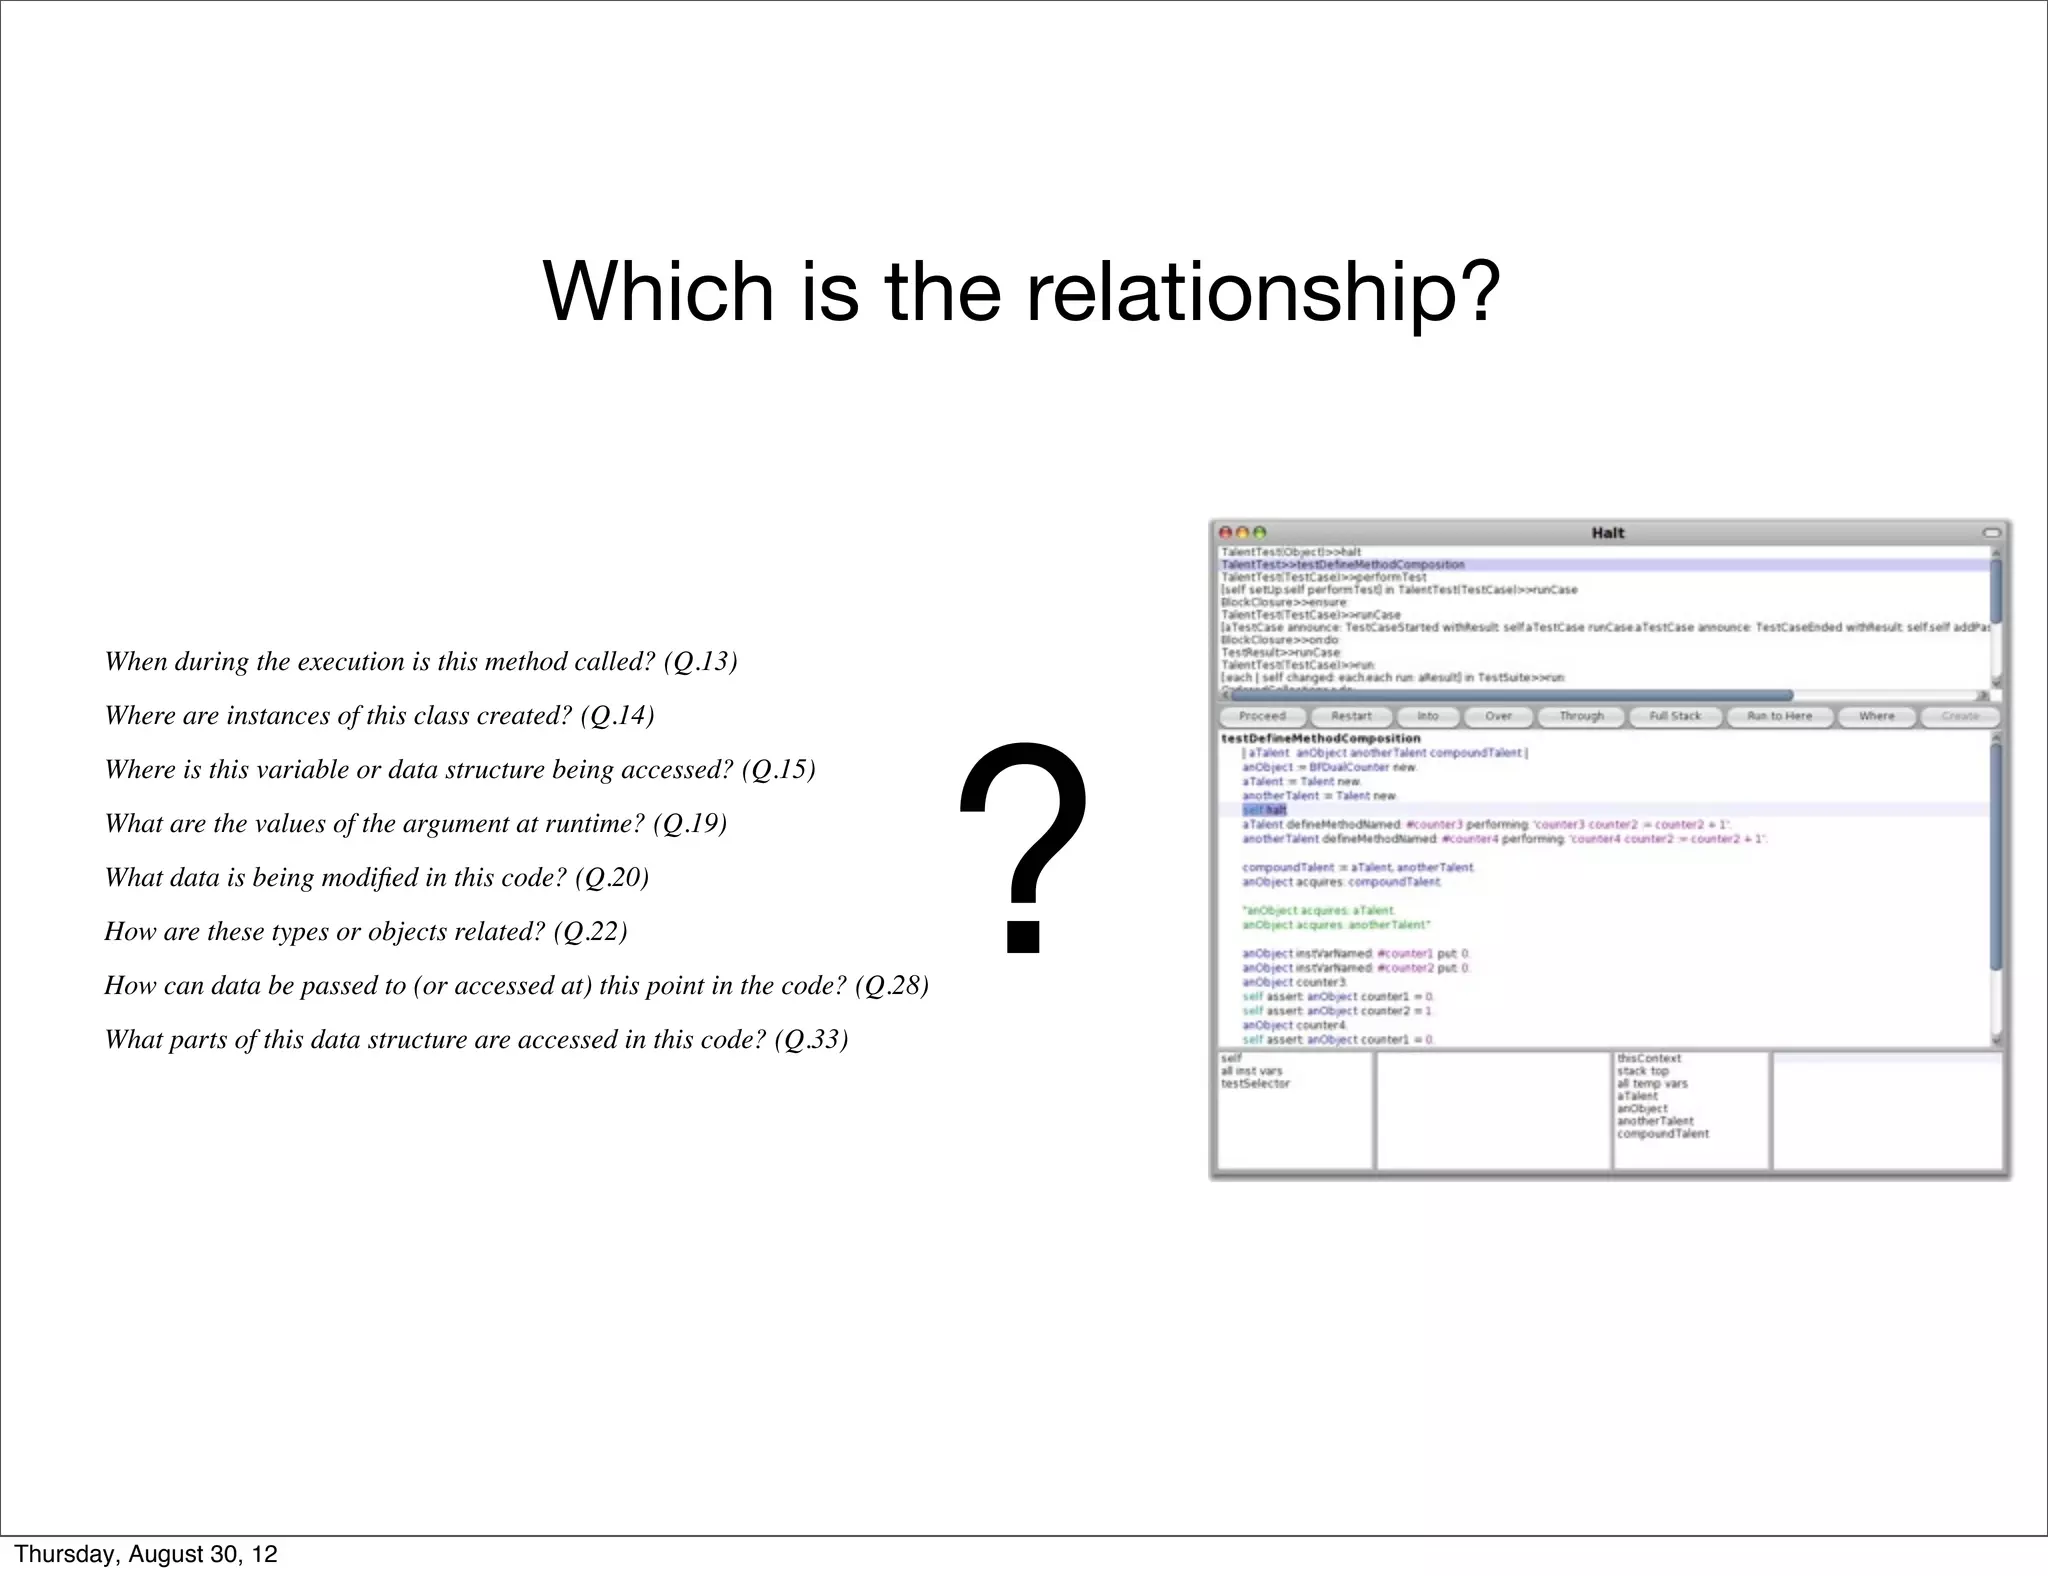
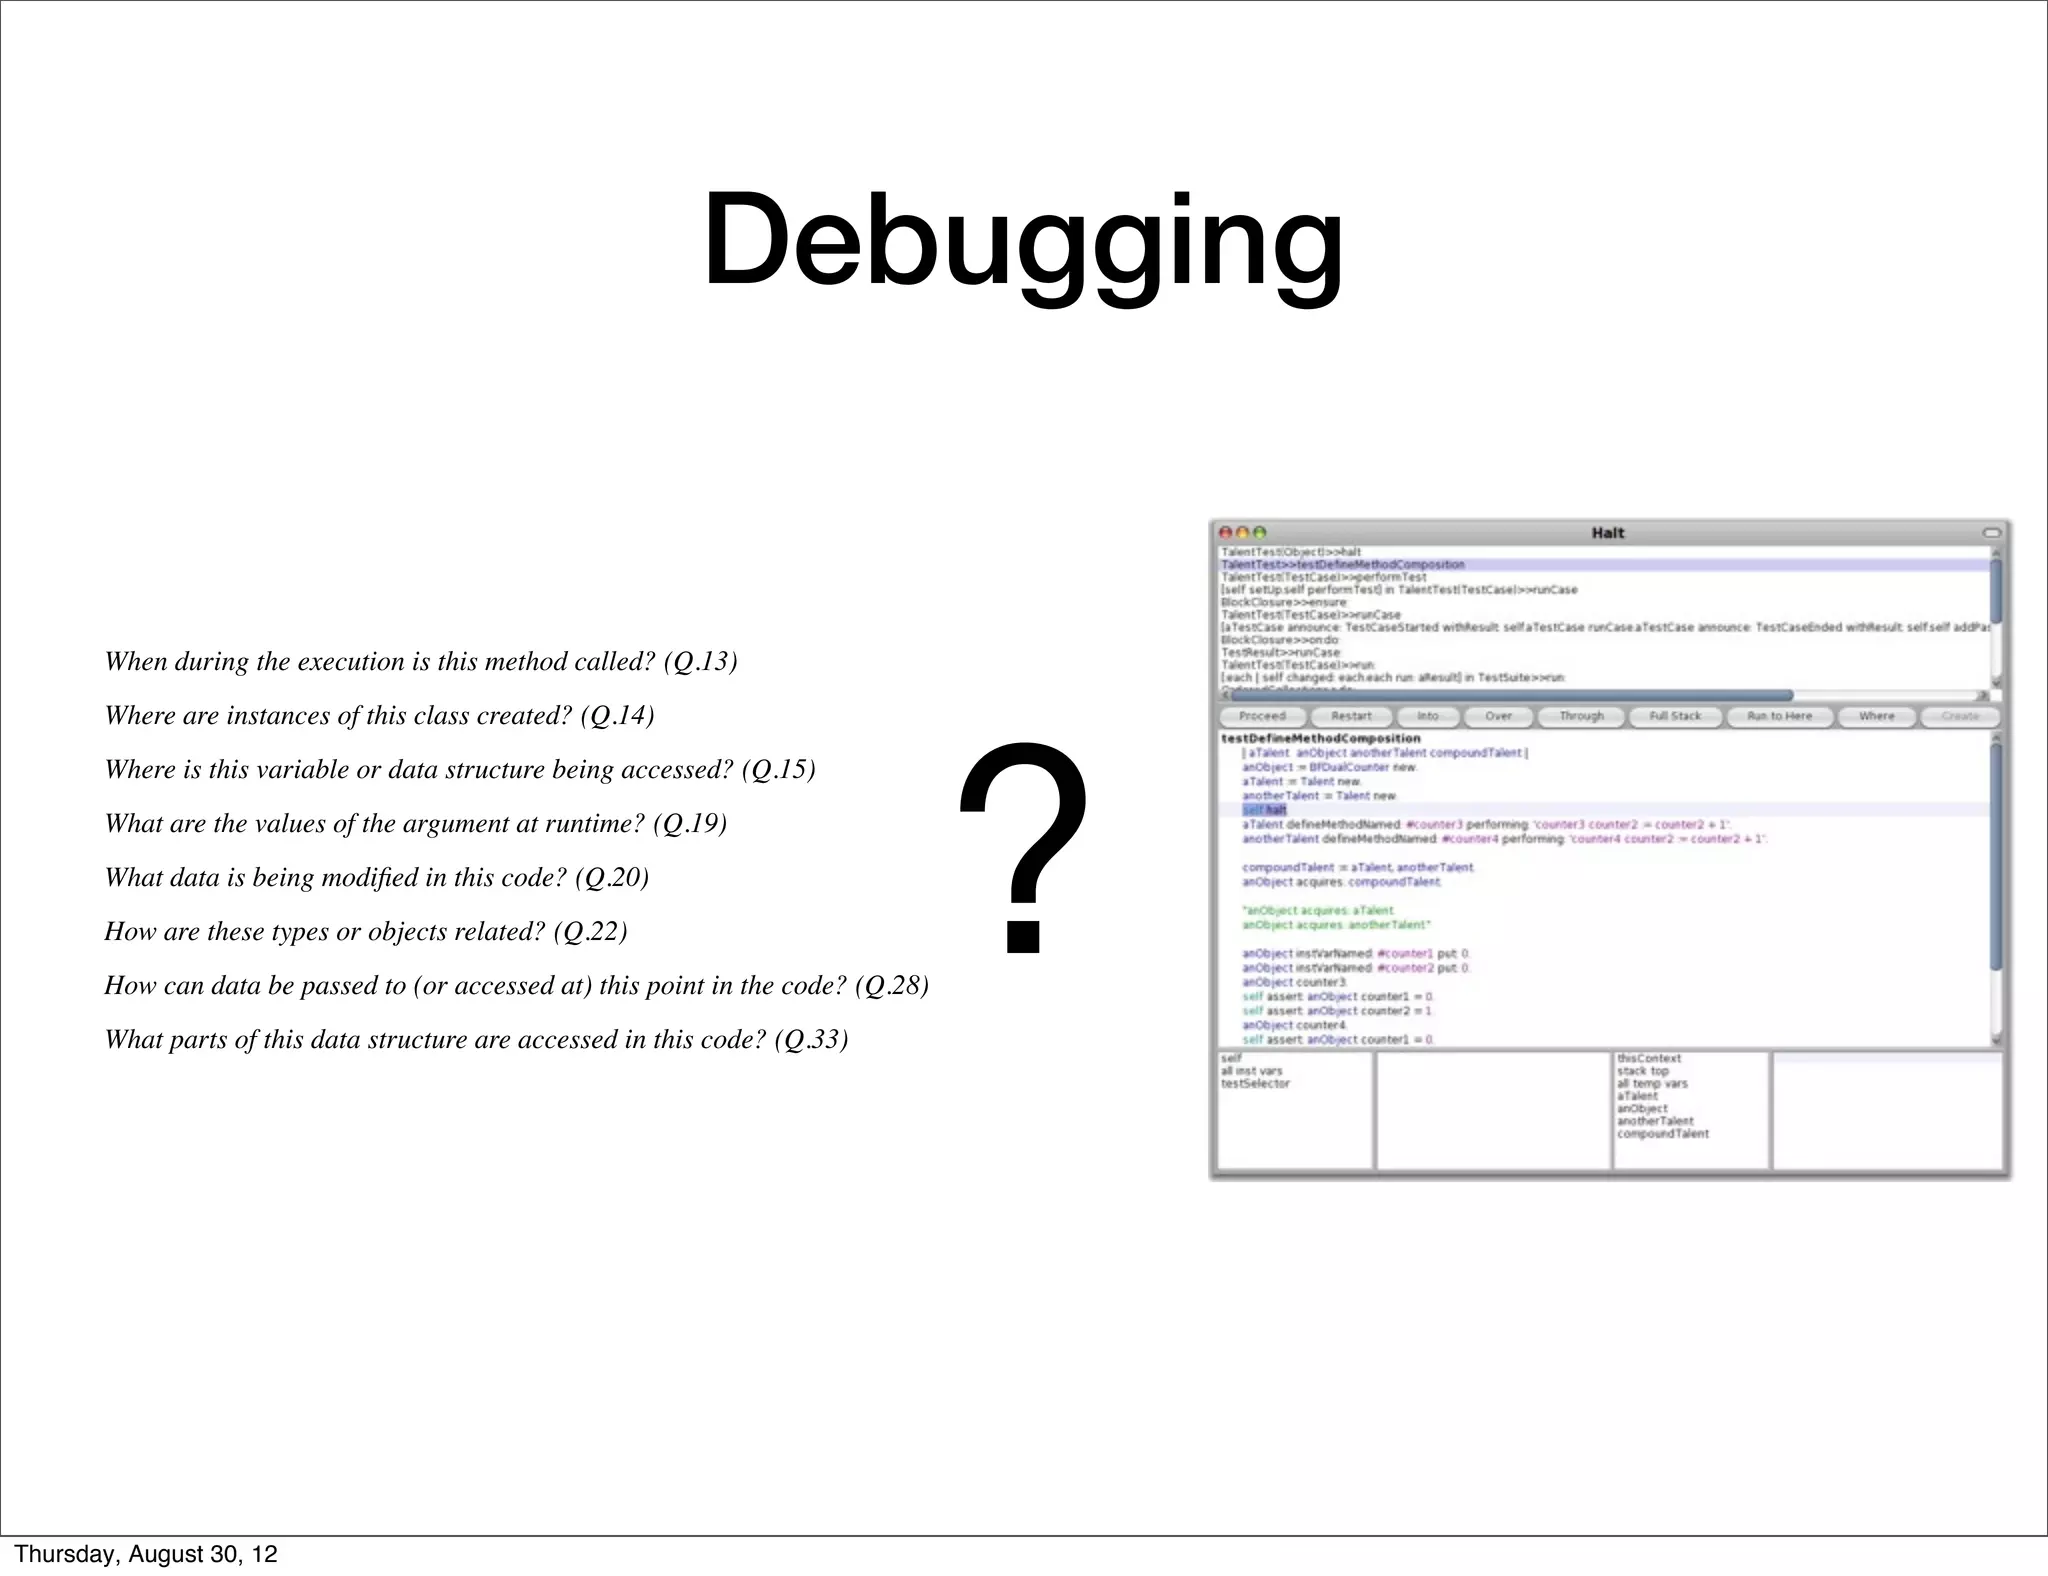
When during the execution is this method called? (Q.13)
      Where are instances of this class created? (Q.14)
      Where is this variable or data structure being accessed?
      (Q.15)
      What are the values of the argument at runtime? (Q.19)
      What data is being modified in this code? (Q.20)
      How are these types or objects related? (Q.22)
      How can data be passed to (or accessed at) this point
    in the code? (Q.28)
      What parts of this data structure are accessed in this
    code? (Q.33)


Thursday, August 30, 12
When during the execution is this method called? (Q.13)
      Where are instances of this class created? (Q.14)
      Where is this variable or data structure being accessed?
      (Q.15)
      What are the values of the argument at runtime? (Q.19)
      What data is being modified in this code? (Q.20)
      How are these types or objects related? (Q.22)
      How can data be passed to (or accessed at) this point
    in the code? (Q.28)
      What parts of this data structure are accessed in this
    code? (Q.33)                                   llito
                                                   Si     etal.           g softwar
                                                                                   e
                                                                 ask durin
                                                       gr ammers s. 2008
                                         Questi ons pro ution task
                                                     evol

Thursday, August 30, 12
Which is the relationship?


       When during the execution is this method called? (Q.13)


                                                                                   ?
       Where are instances of this class created? (Q.14)
       Where is this variable or data structure being accessed? (Q.15)
       What are the values of the argument at runtime? (Q.19)
       What data is being modified in this code? (Q.20)
       How are these types or objects related? (Q.22)
       How can data be passed to (or accessed at) this point in the code? (Q.28)
       What parts of this data structure are accessed in this code? (Q.33)


Thursday, August 30, 12
What is the
                          problem?


Thursday, August 30, 12
Traditional
                          Reflection


Thursday, August 30, 12
visualization using a graph of (possibly nested) nodes and edges. In June 2010
     a serious performance issue was raised1 . Tracking down the cause of the poor
     performance was not trivial. We first used a standard sample-based profiler.
          Execution sampling approximates the time spent in an application’s methods
     by periodically stopping a program and recording the current set of methods


                                                         Profiling
     under executions. Such a profiling technique is relatively accurate since it has
     little impact on the overall execution. This sampling technique is used by almost
     all mainstream profilers, such as JProfiler, YourKit, xprof [10], and hprof.
          MessageTally, the standard sampling-based profiler in Pharo Smalltalk2 , tex-
     tually describes the execution in terms of CPU consumption and invocation for
     each method of Mondrian:
     54.8% {11501ms} MOCanvas>>drawOn:
      54.8% {11501ms} MORoot(MONode)>>displayOn:
       30.9% {6485ms} MONode>>displayOn:


                                                                        ?
         | 18.1% {3799ms} MOEdge>>displayOn:
            ...
         | 8.4% {1763ms} MOEdge>>displayOn:
         | | 8.0% {1679ms} MOStraightLineShape>>display:on:
         | | 2.6% {546ms} FormCanvas>>line:to:width:color:
           ...
       23.4% {4911ms} MOEdge>>displayOn:
           ...

        We can observe that the virtual machine spent about 54% of its time in
     the method displayOn: defined in the class MORoot. A root is the unique non-
     nested node that contains all the nodes of the edges of the visualization. This
     general profiling information says that rendering nodes and edges consumes a
     great share of the CPU time, but it does not help in pinpointing which nodes
     and edges are responsible for the time spent. Not all graphical elements equally
     consume resources.
        Traditional execution sampling profilers center their result on the frames of
     the execution stack and completely ignore the identity of the object that received
     the method call and its arguments. As a consequence, it is hard to track down
     which objects cause the slowdown. For the example above, the traditional profiler
     says that we spent 30.9% in MONode>>displayOn: without saying which nodes
     were actually refreshed too often.

     Coverage
     PetitParser is
Thursday, August 30, 12   a parsing framework combining ideas from scannerless parsing,
Debugging


       When during the execution is this method called? (Q.13)


                                                                                   ?
       Where are instances of this class created? (Q.14)
       Where is this variable or data structure being accessed? (Q.15)
       What are the values of the argument at runtime? (Q.19)
       What data is being modified in this code? (Q.20)
       How are these types or objects related? (Q.22)
       How can data be passed to (or accessed at) this point in the code? (Q.28)
       What parts of this data structure are accessed in this code? (Q.33)


Thursday, August 30, 12
Object Paradox


Thursday, August 30, 12
Object-Centric
                           Reflection


Thursday, August 30, 12
Organize the
                           Meta-level


Thursday, August 30, 12
Explicit
                          Meta-objects


Thursday, August 30, 12
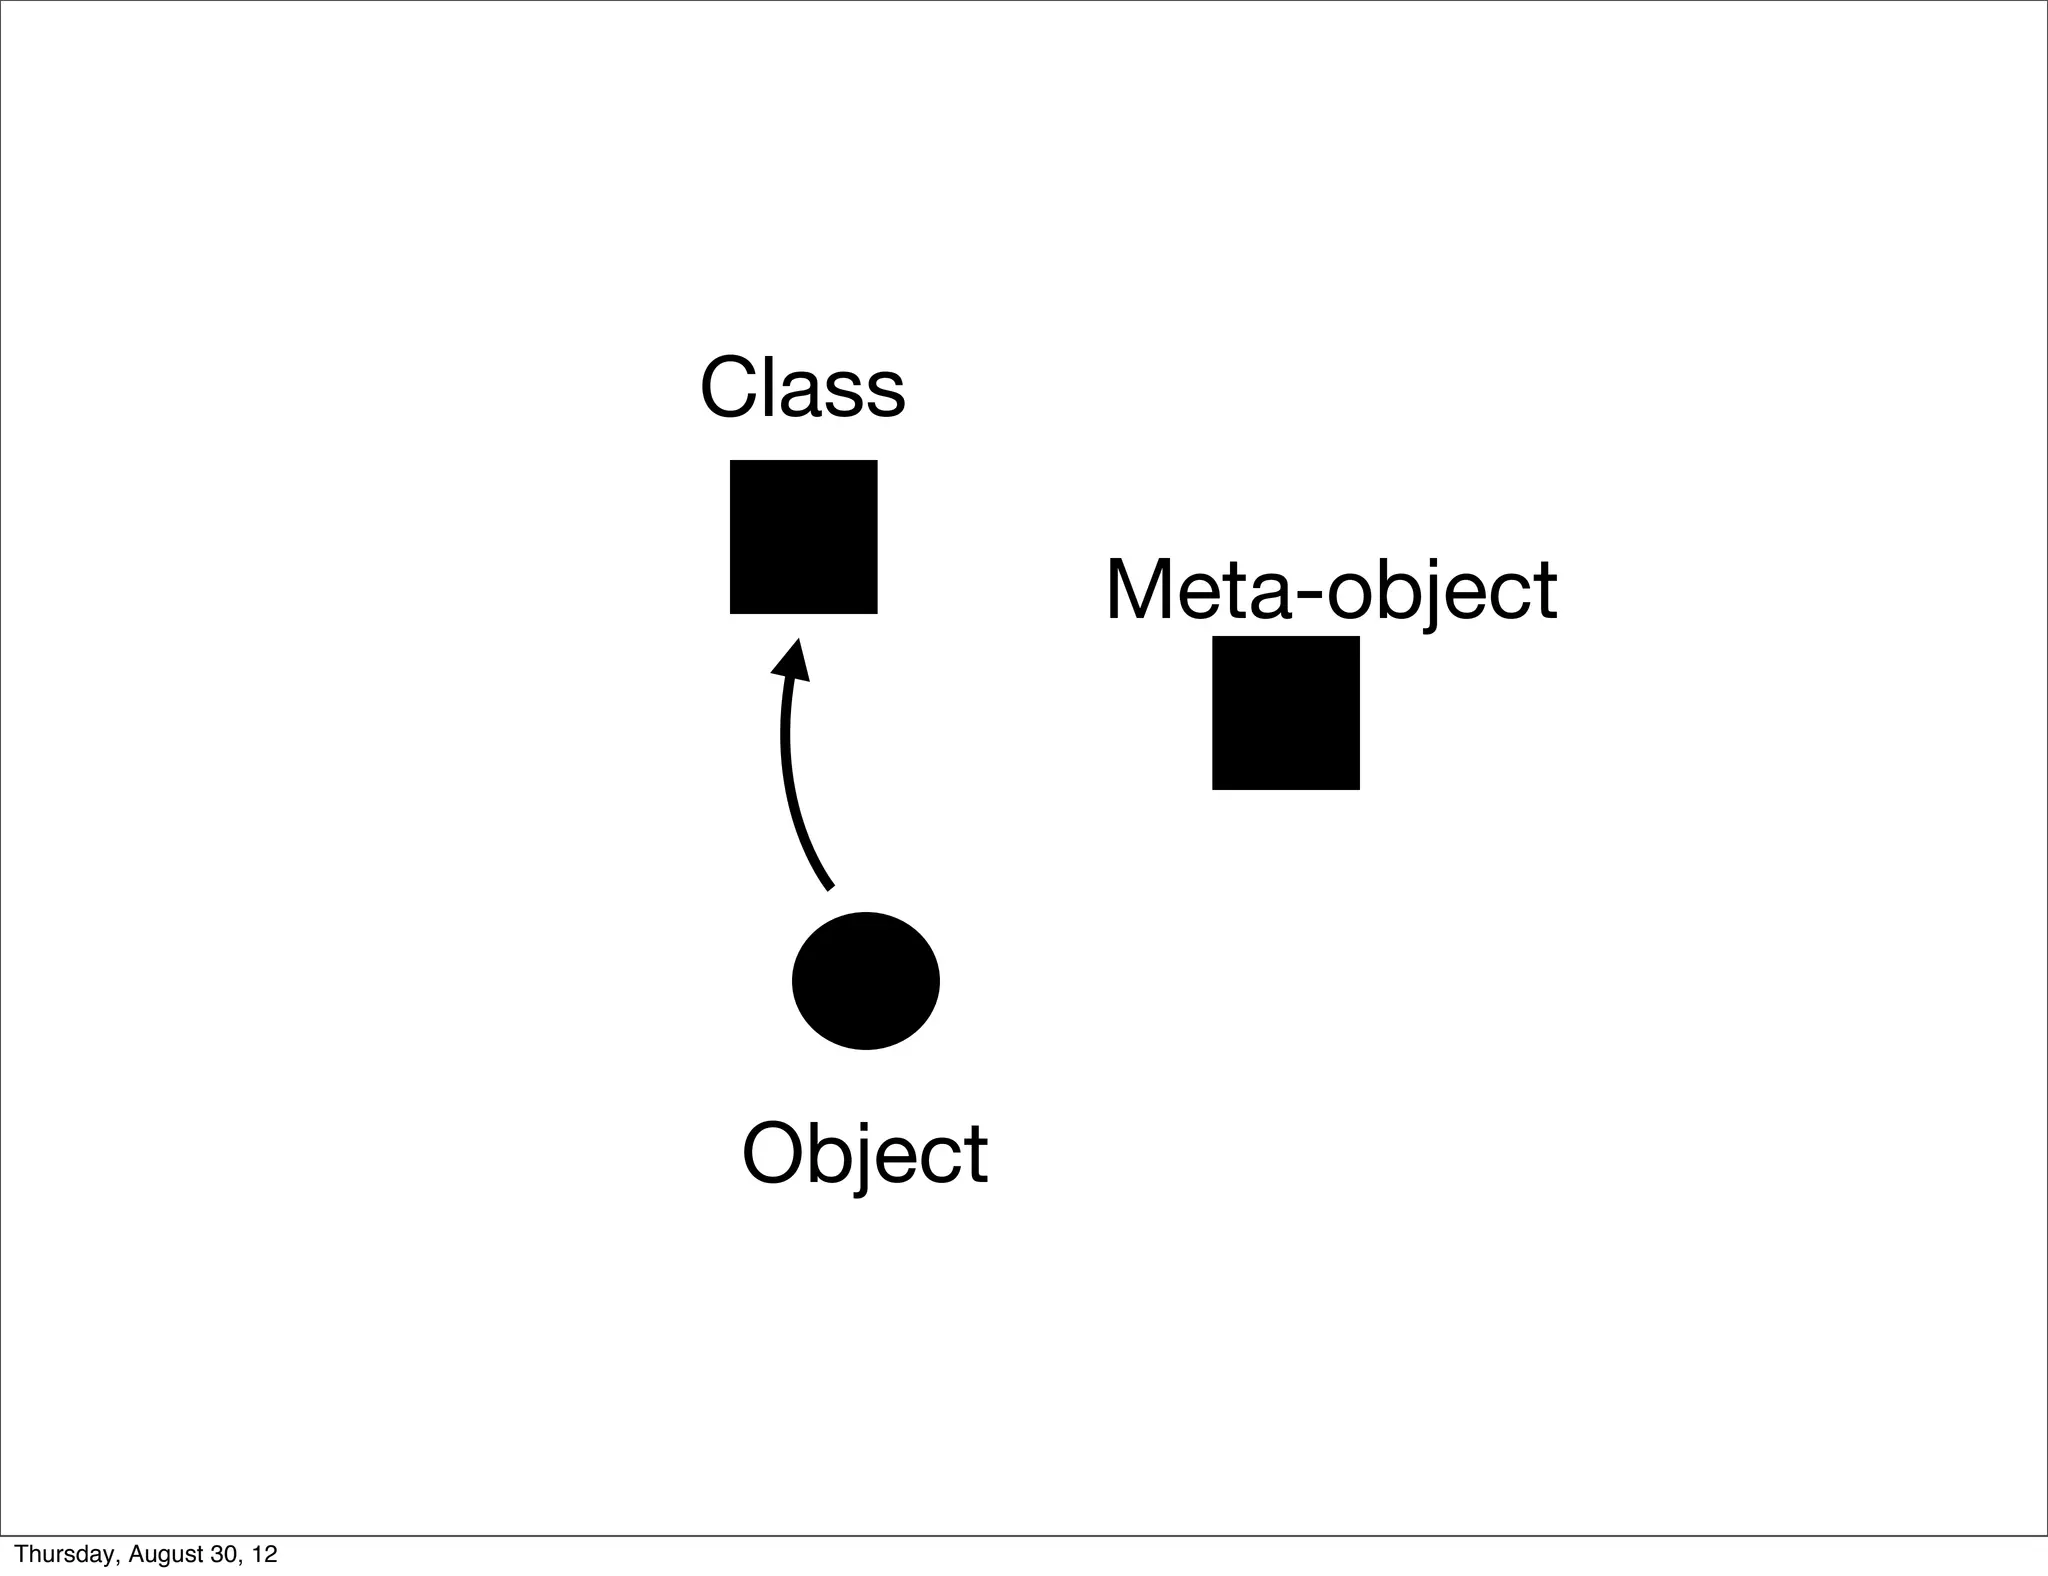
Class

                                    Meta-object


                           Object


Thursday, August 30, 12
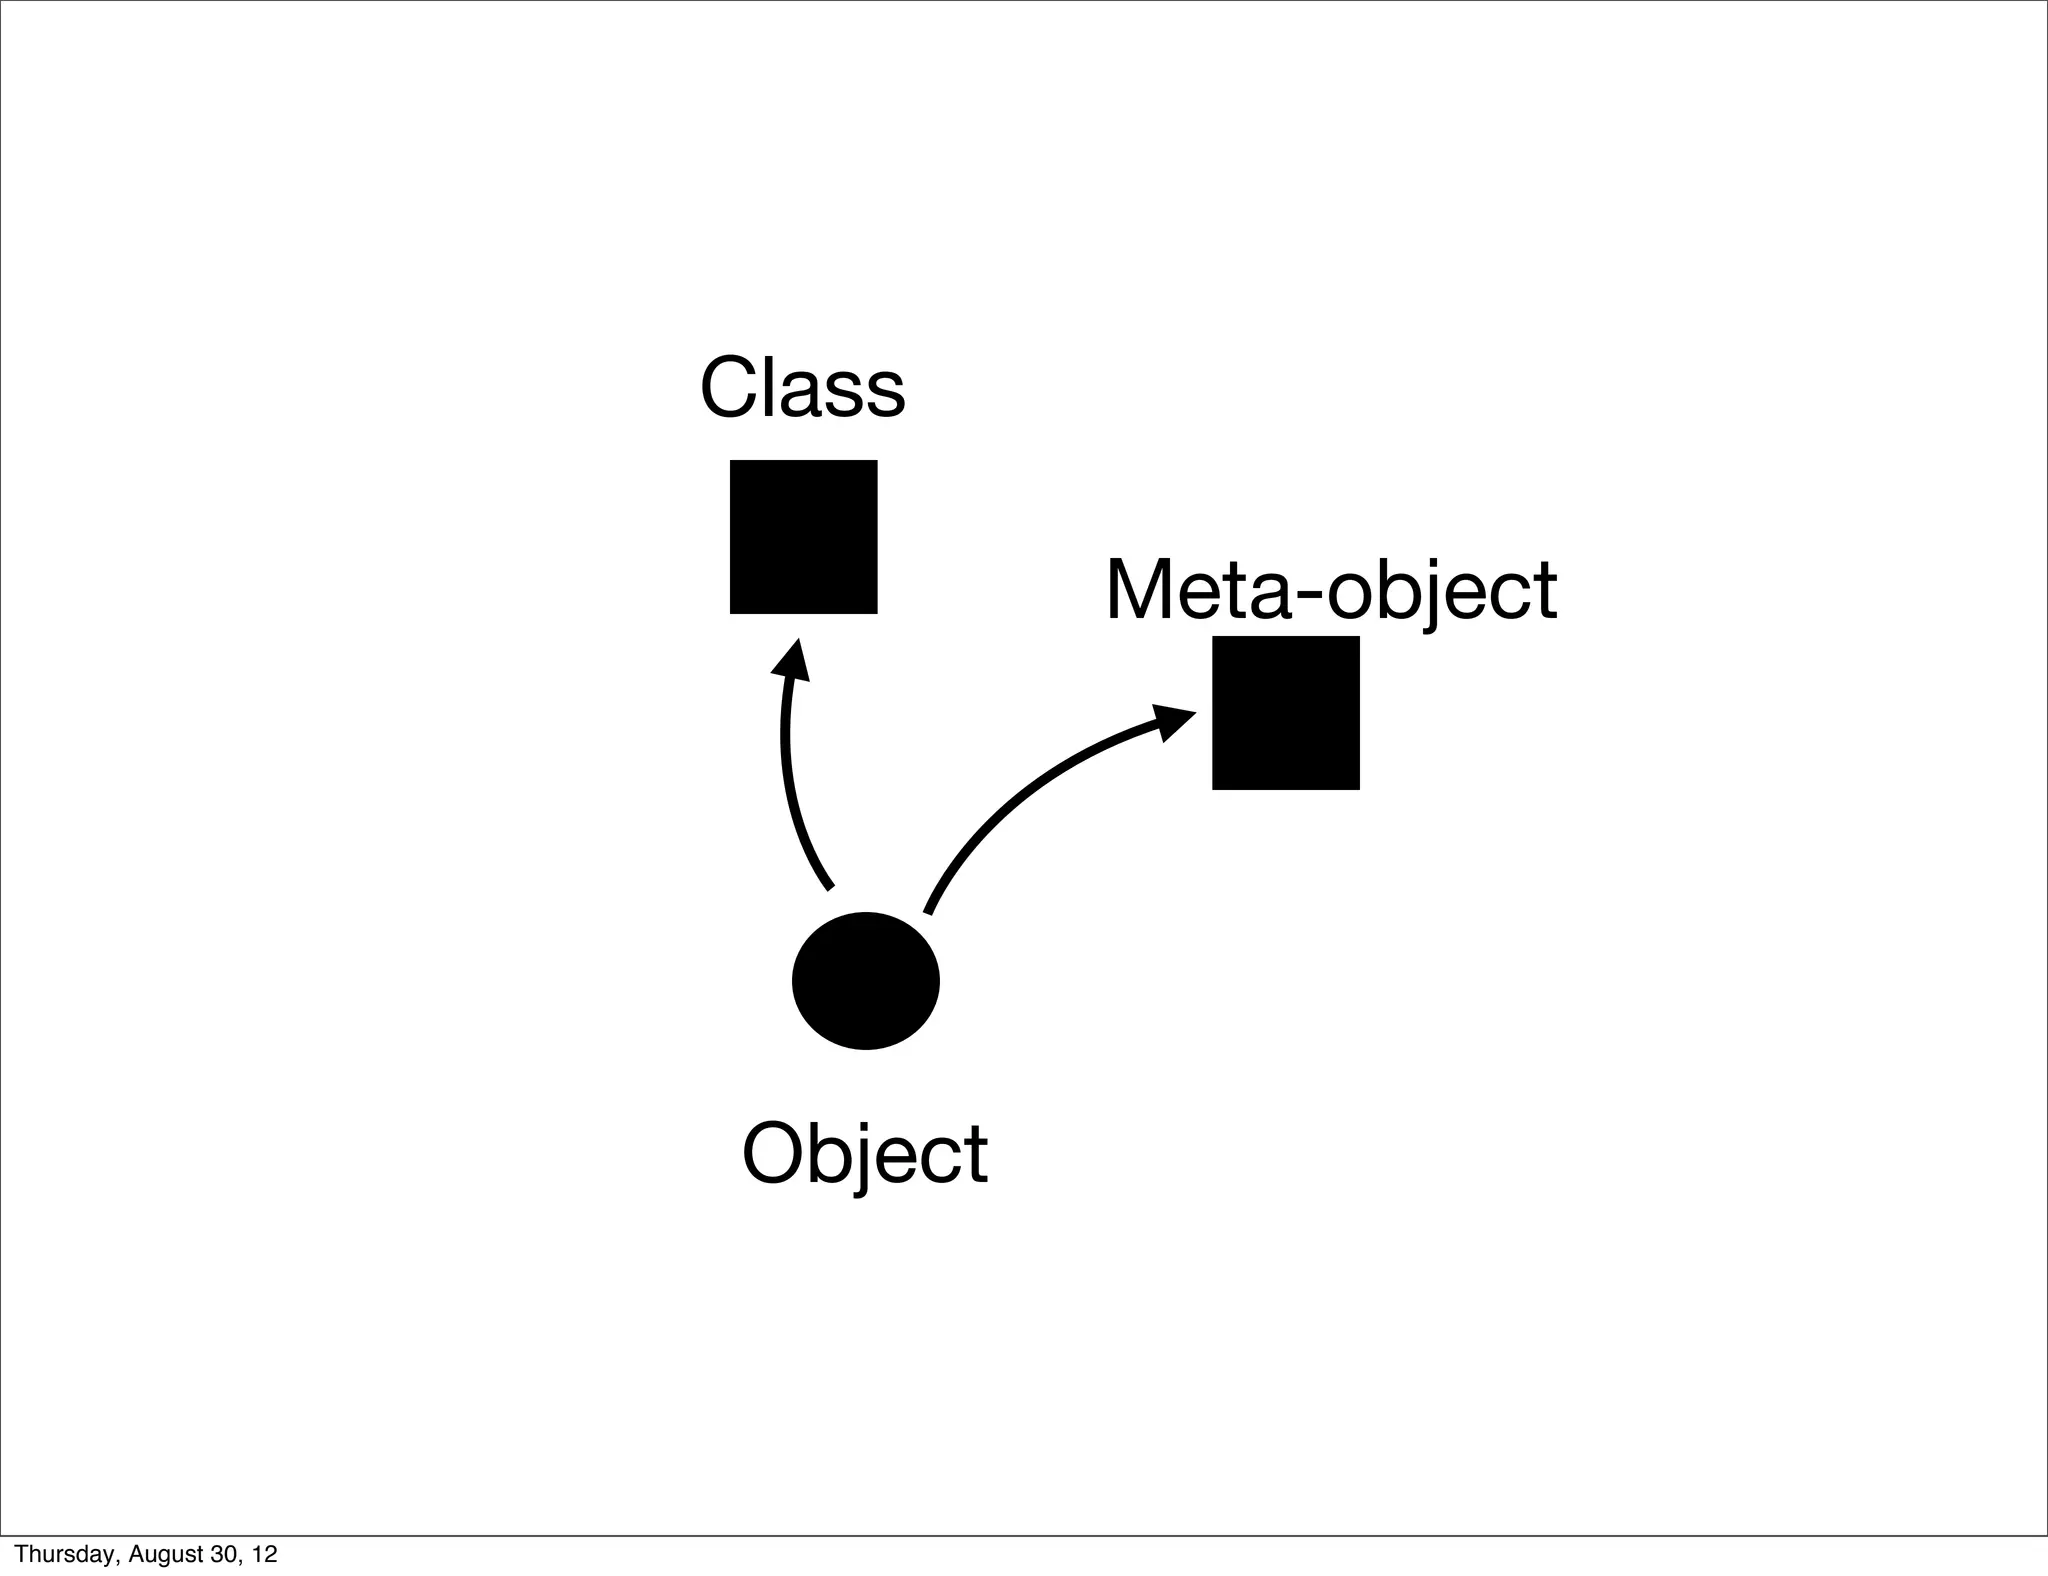
Class

                                    Meta-object


                           Object


Thursday, August 30, 12
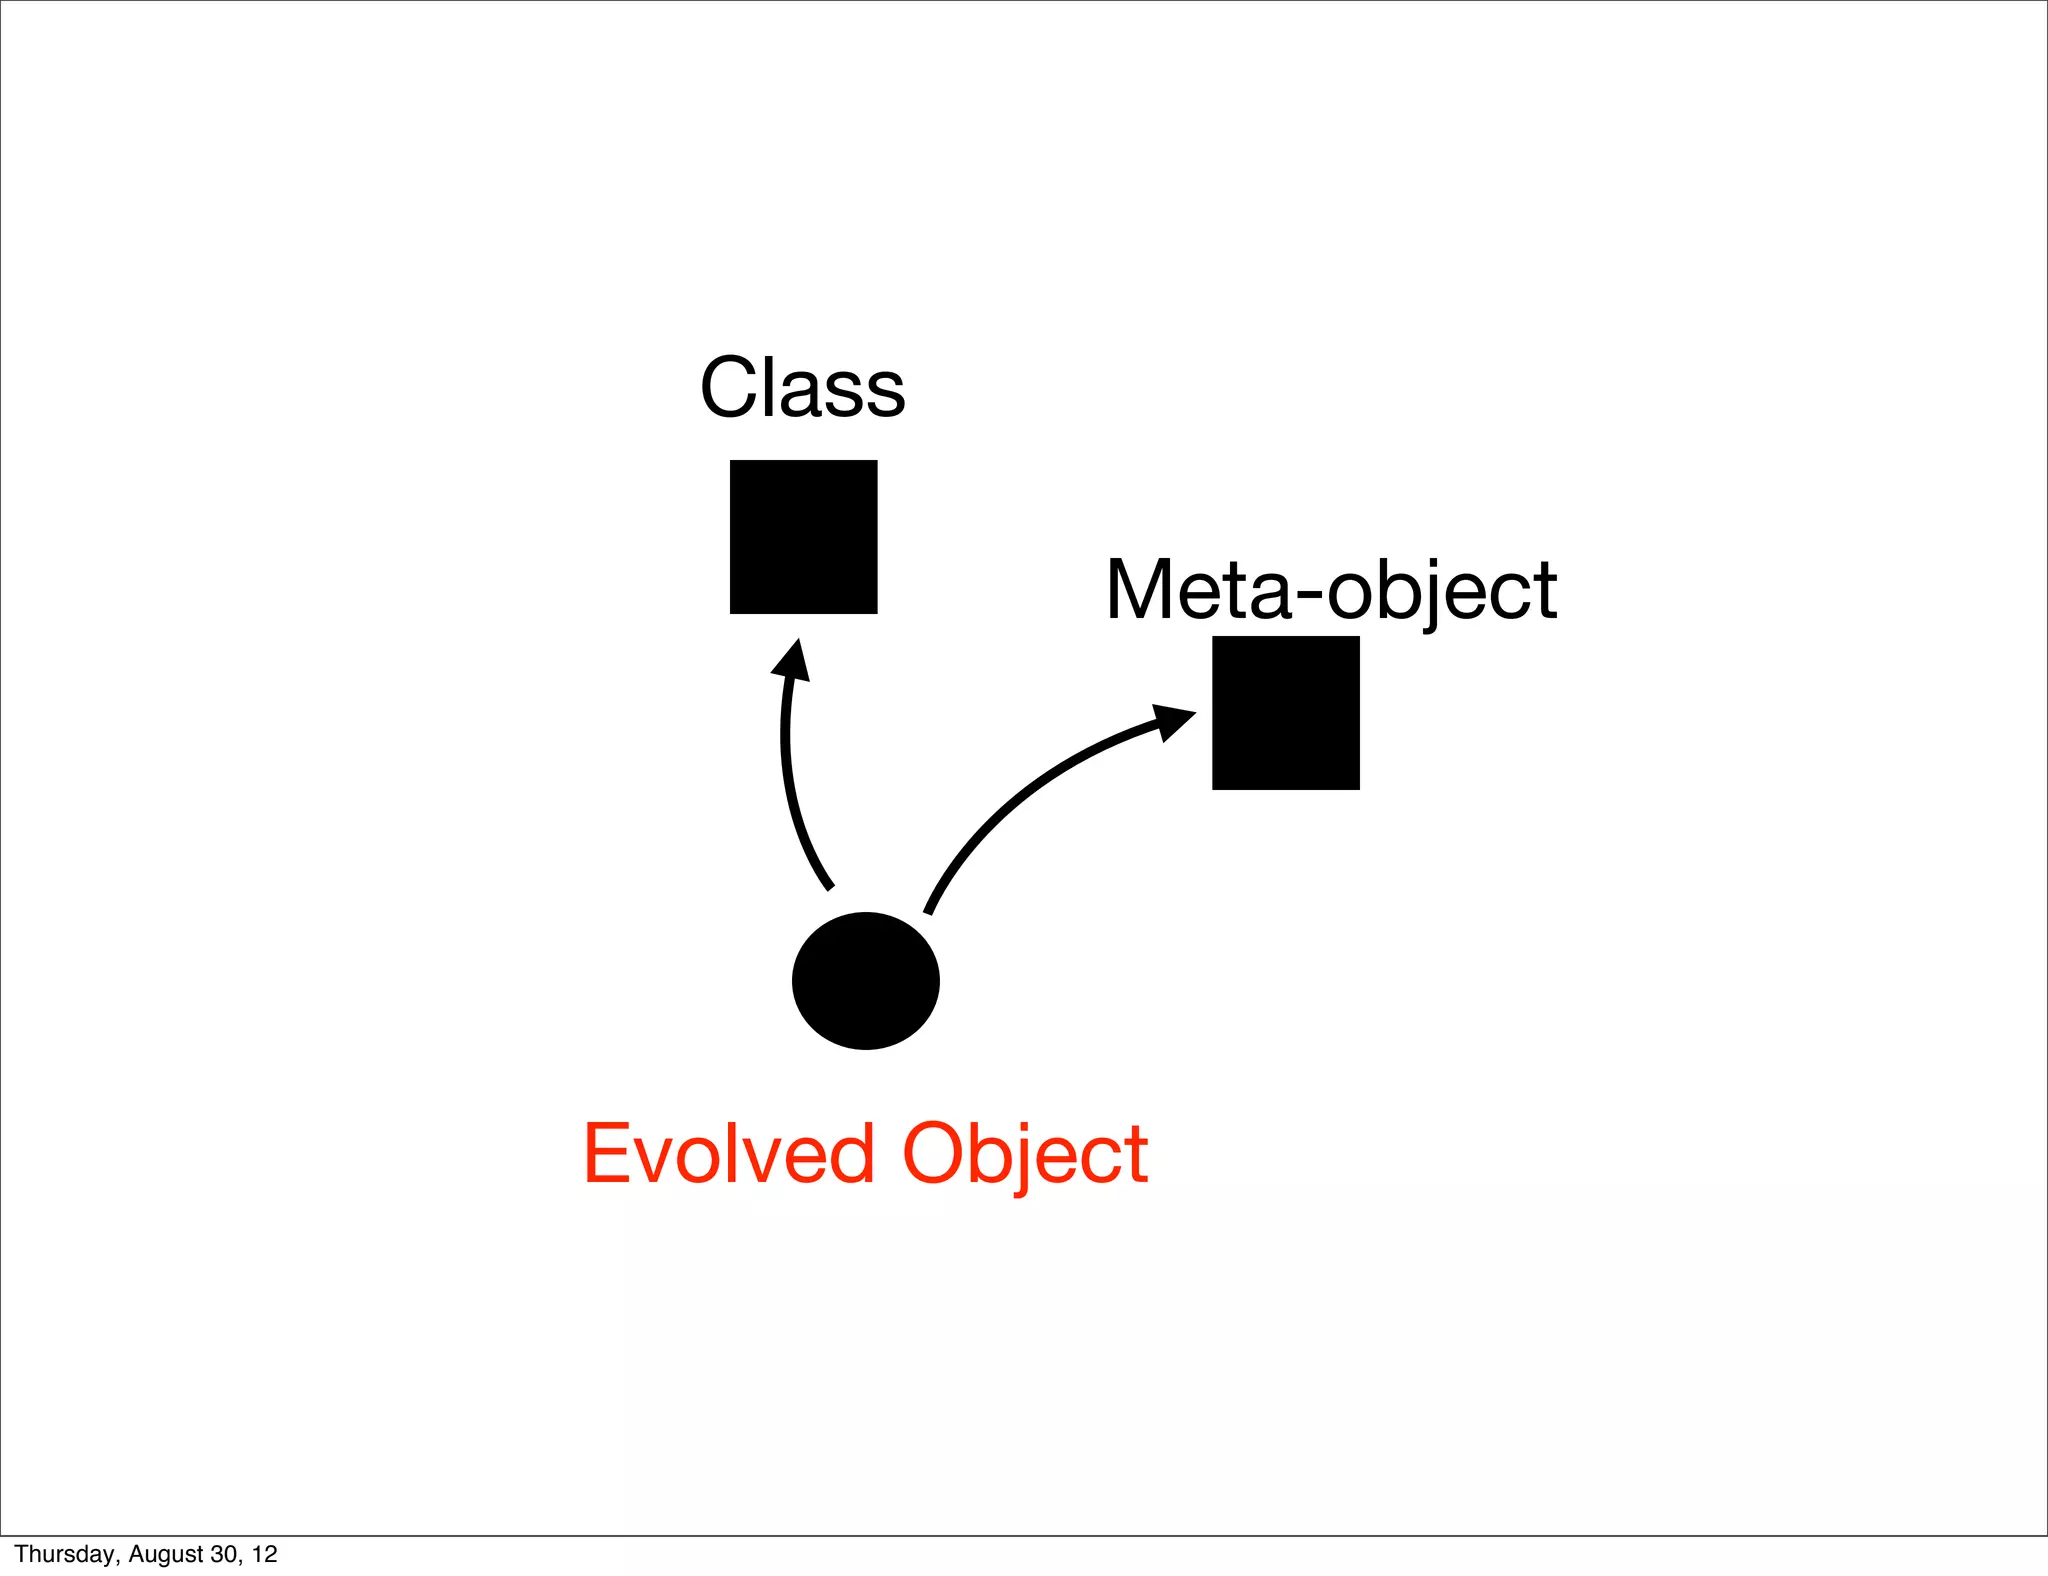
Class

                                      Meta-object


                          Evolved Object


Thursday, August 30, 12
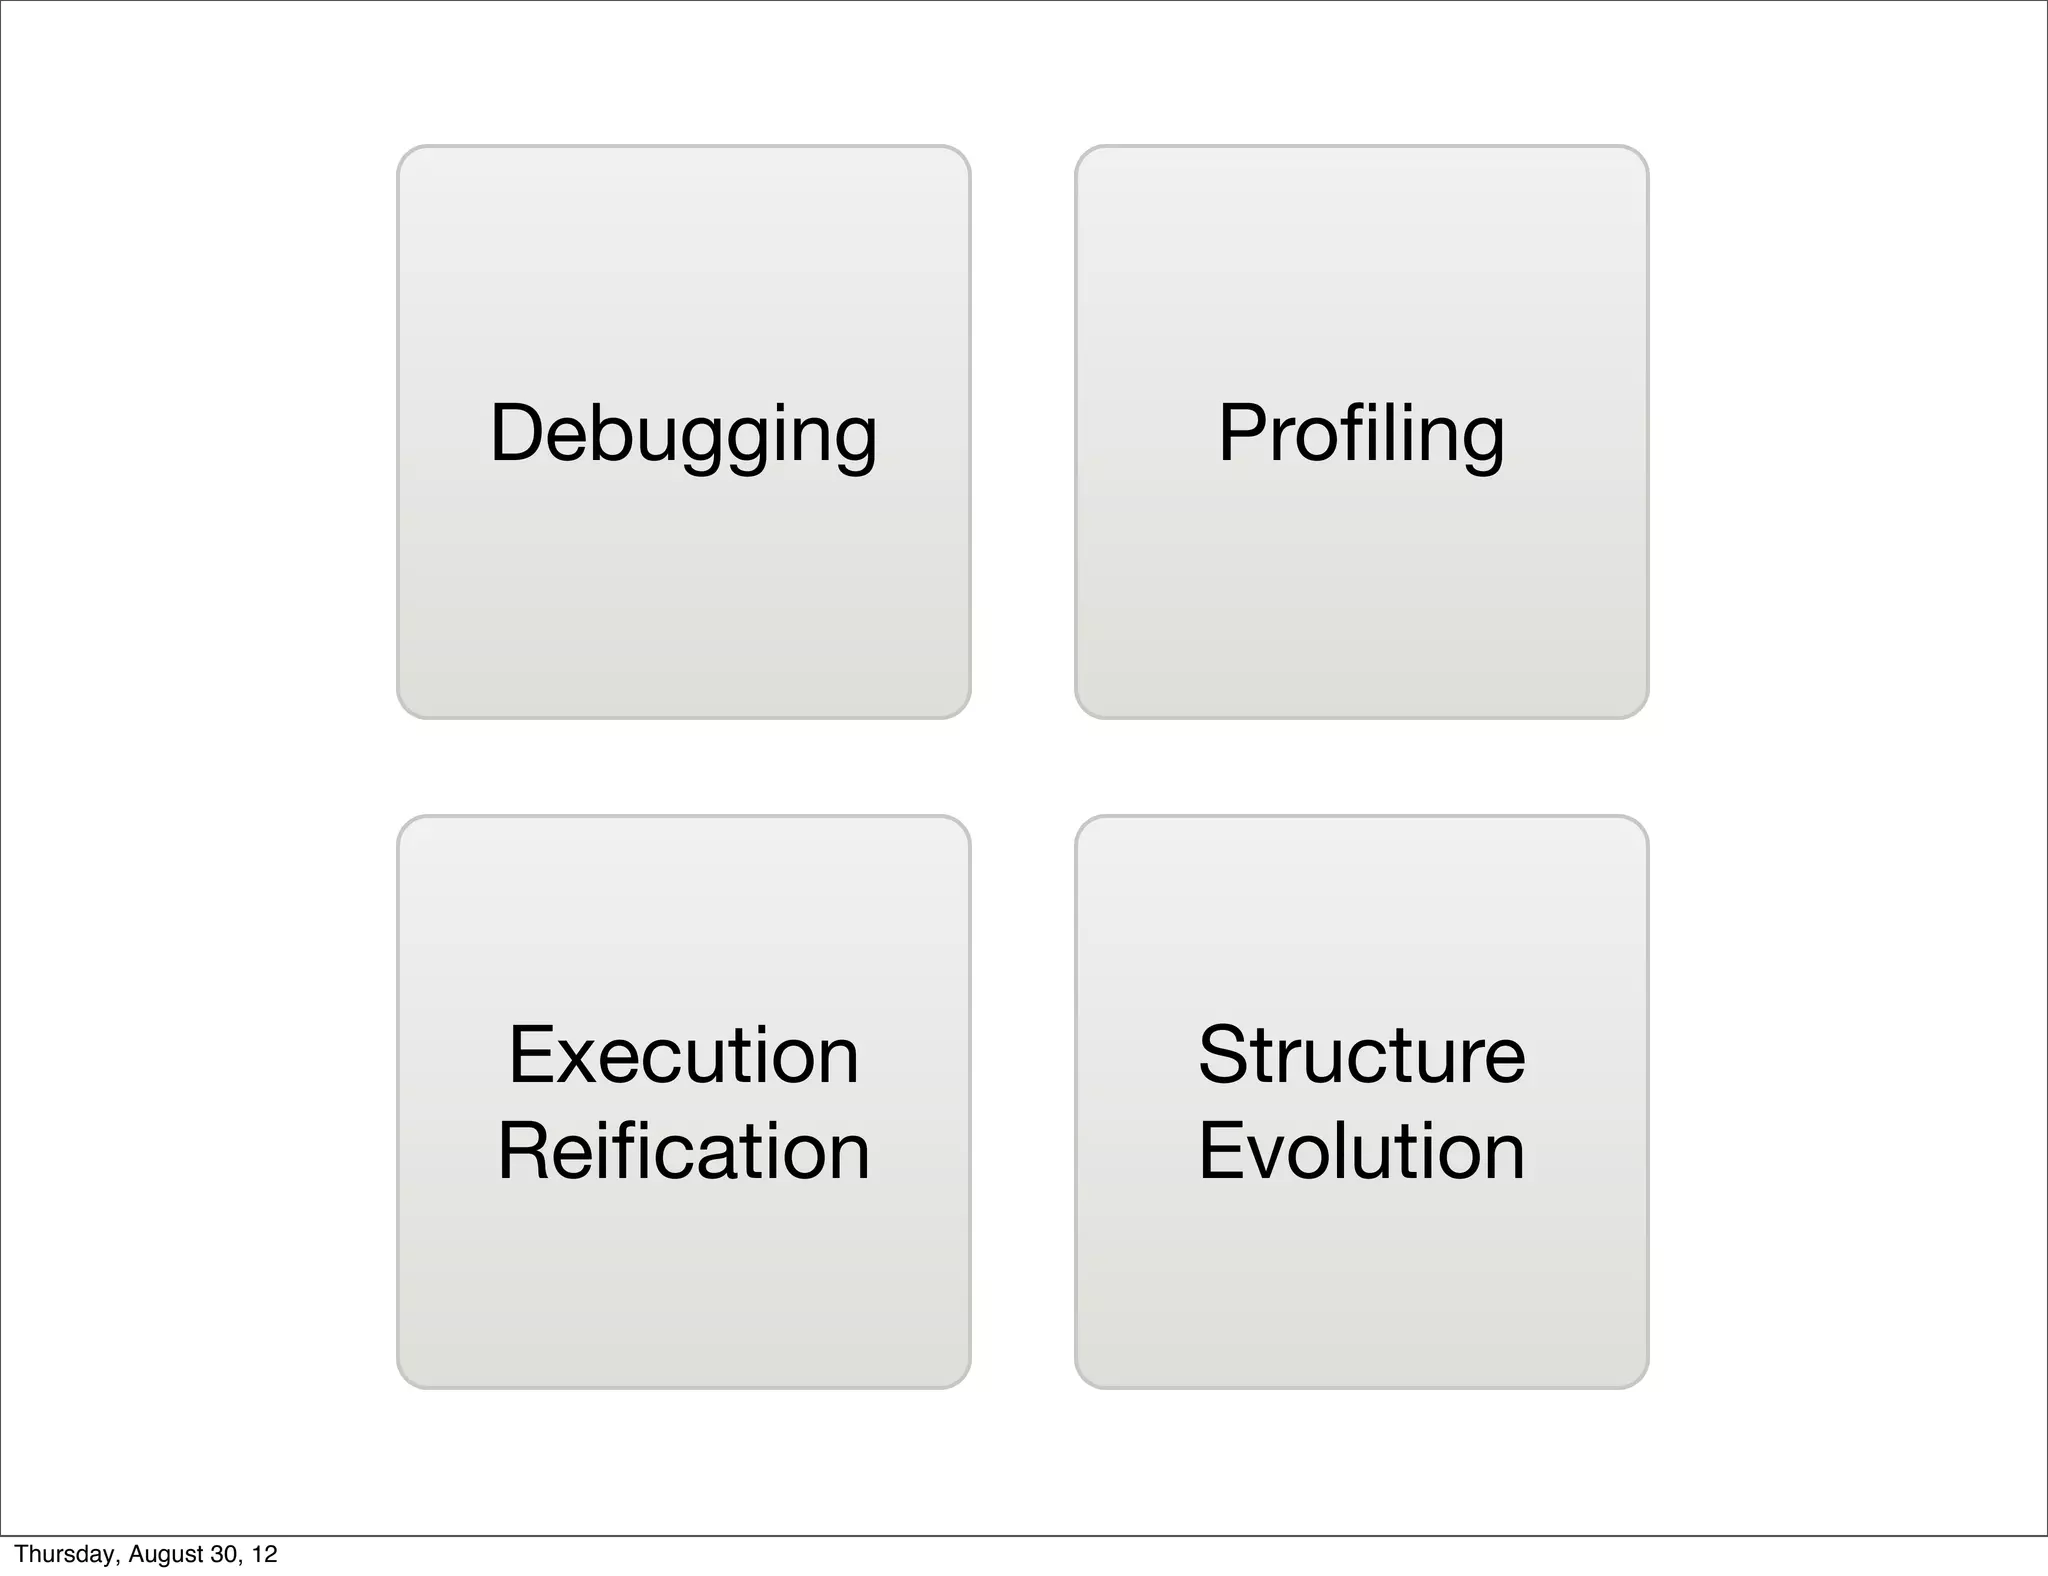
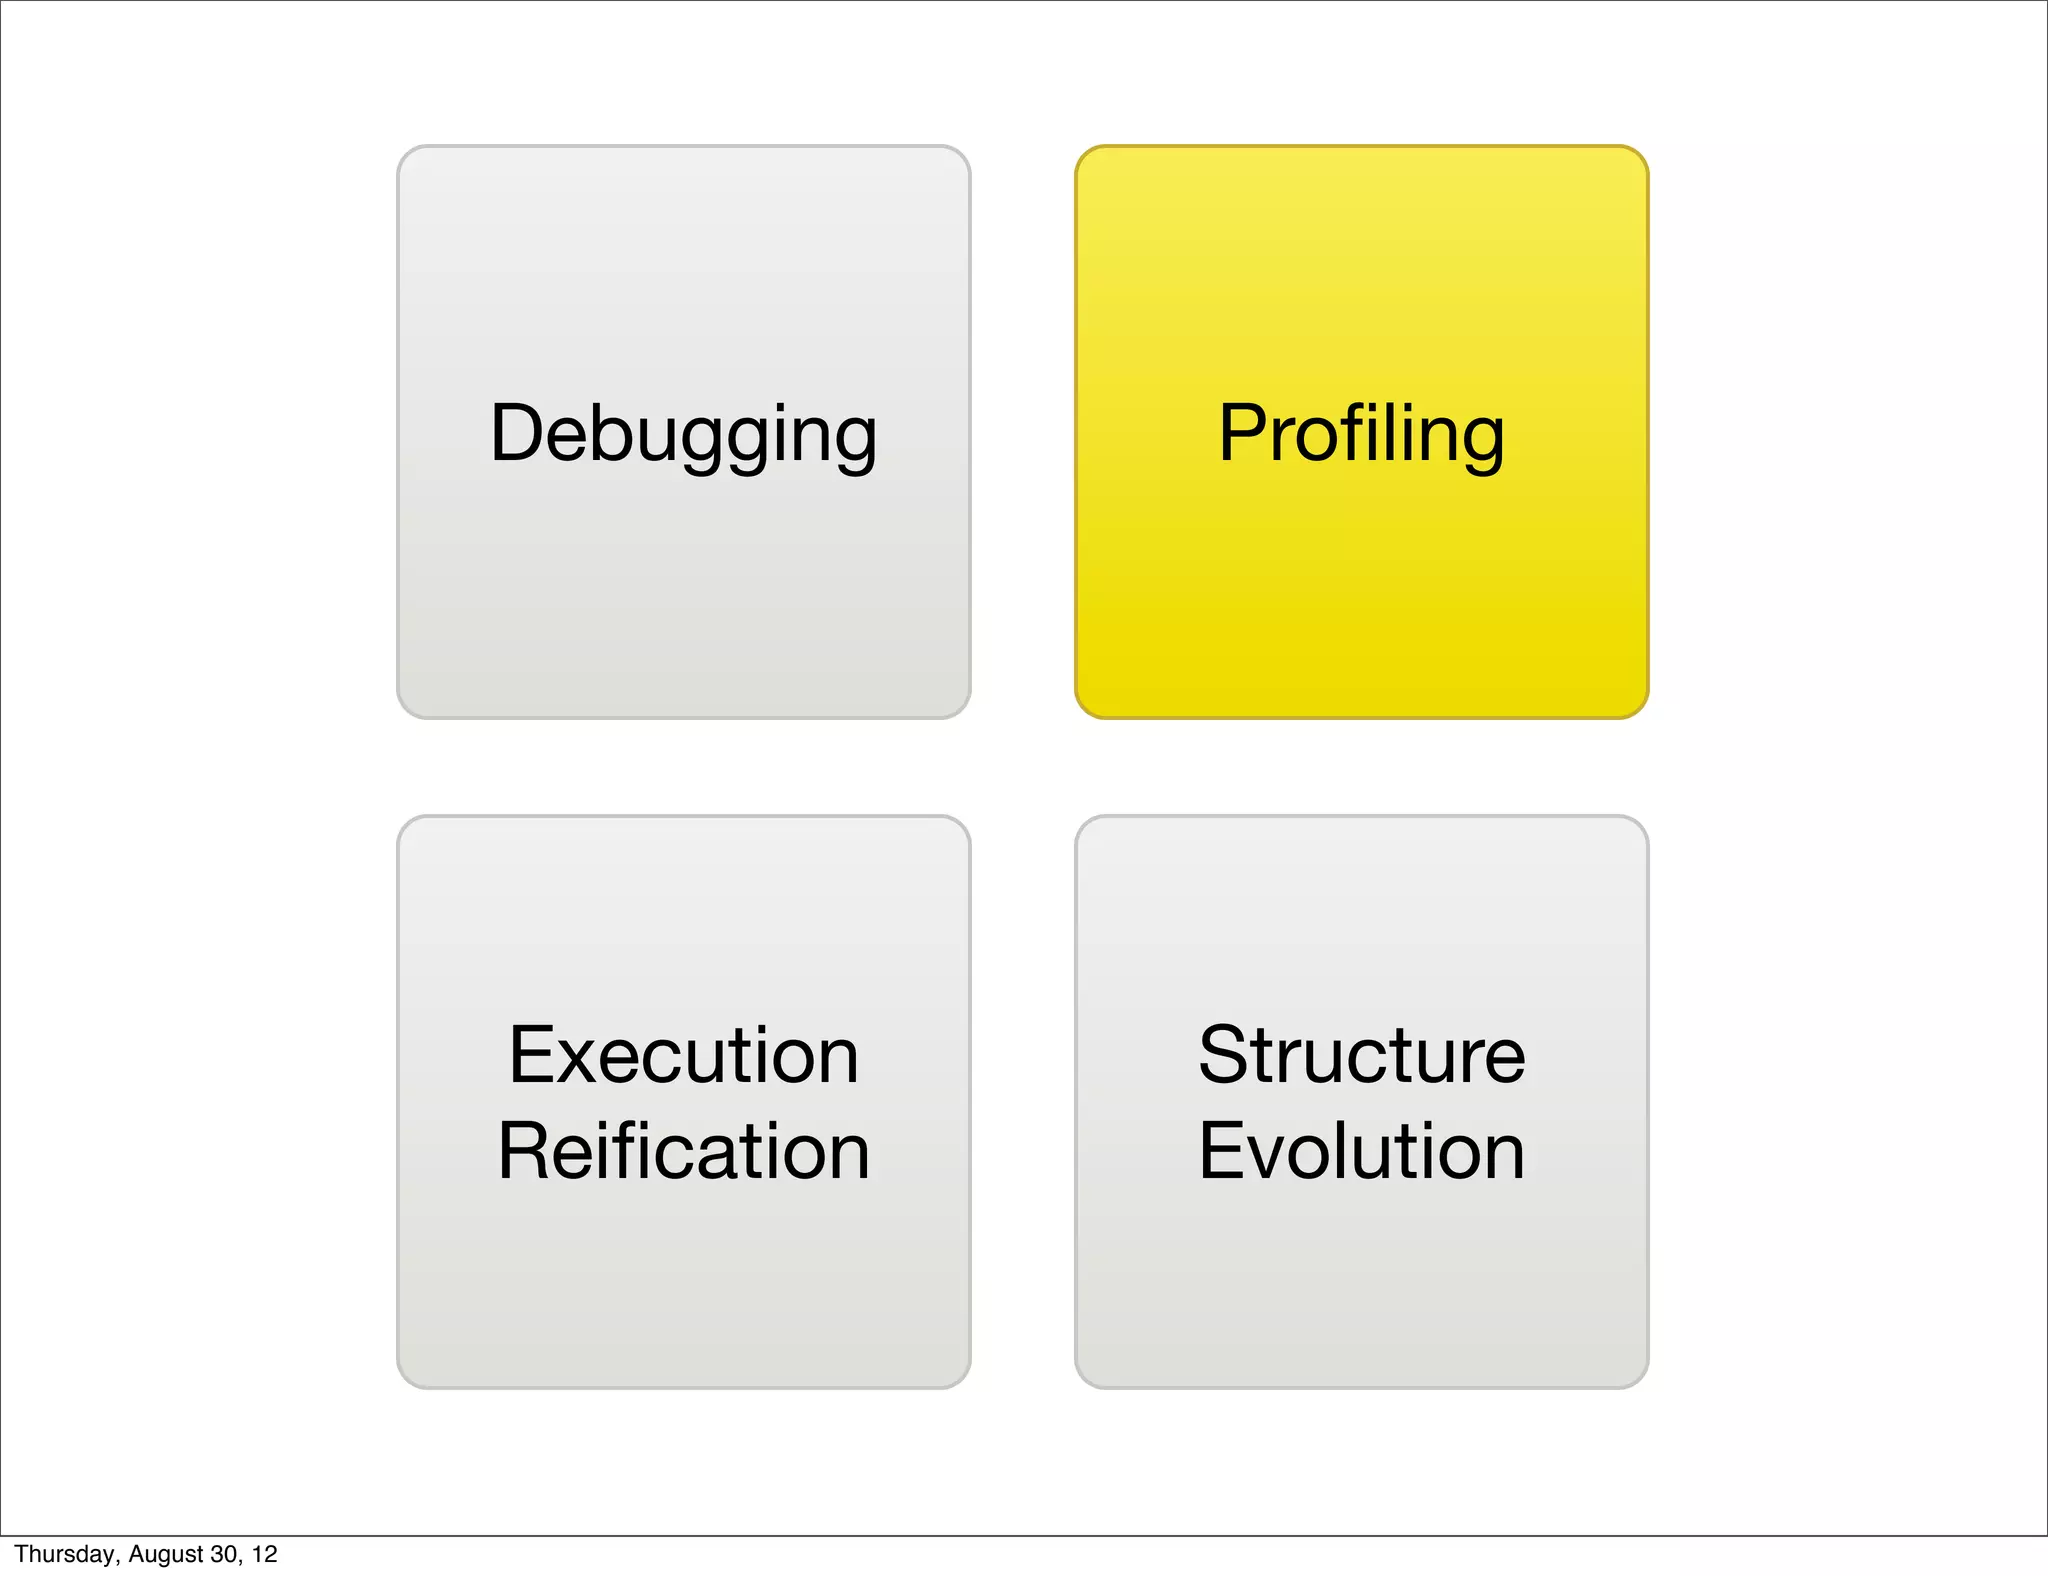
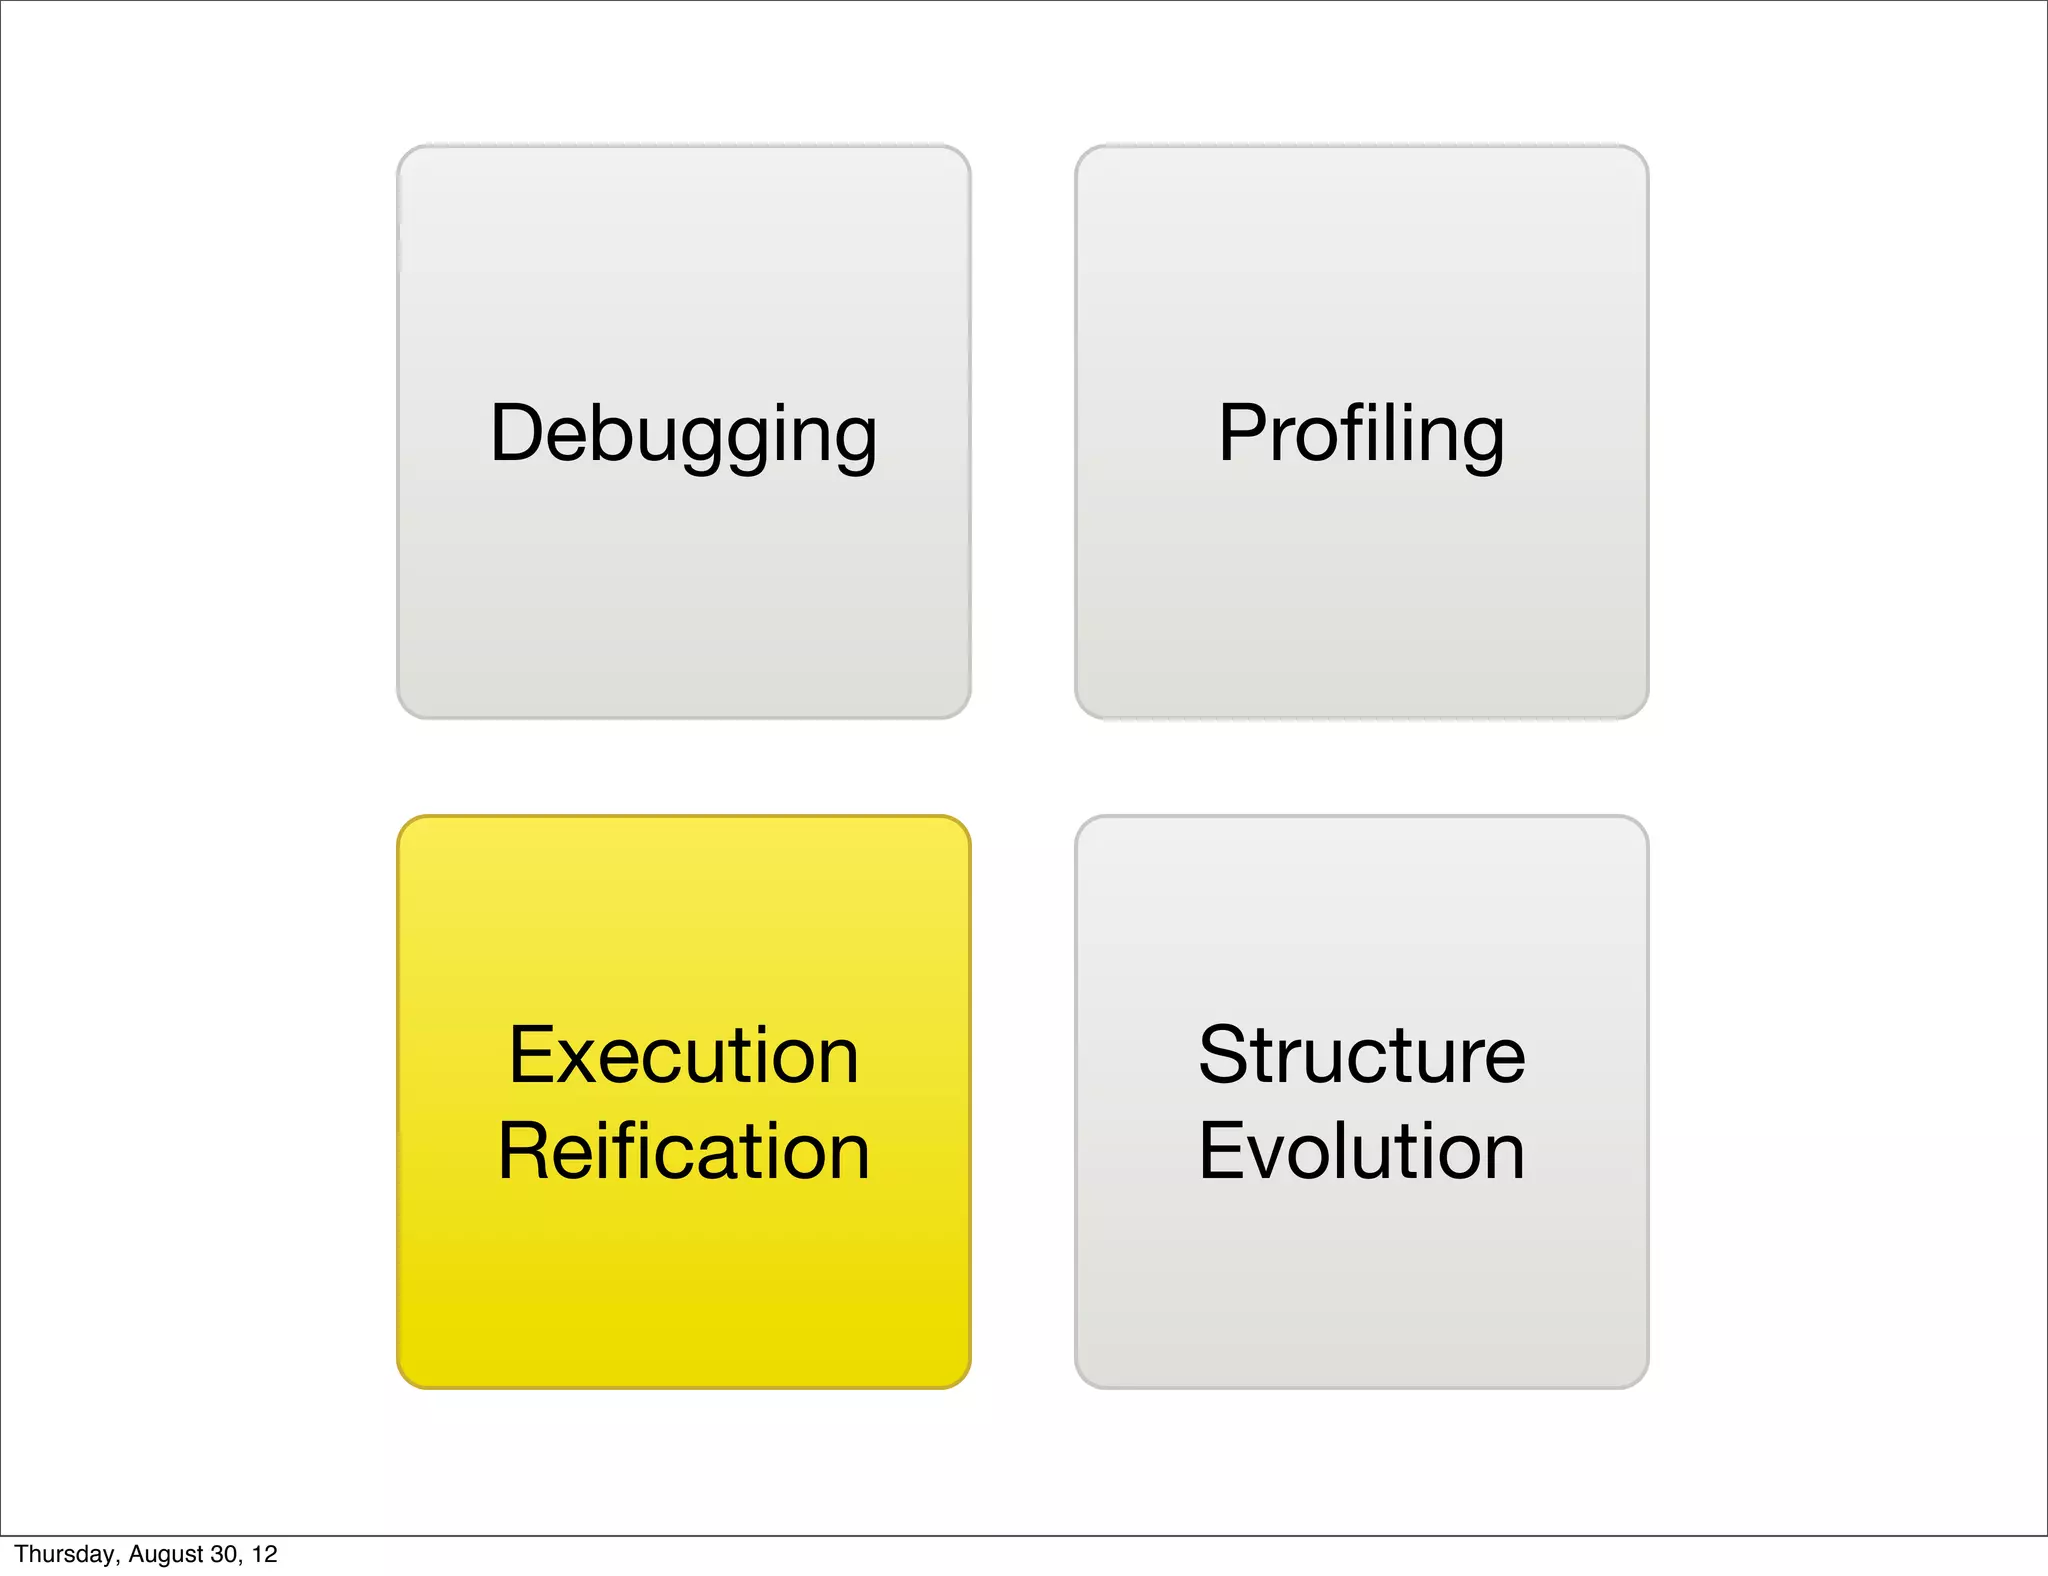
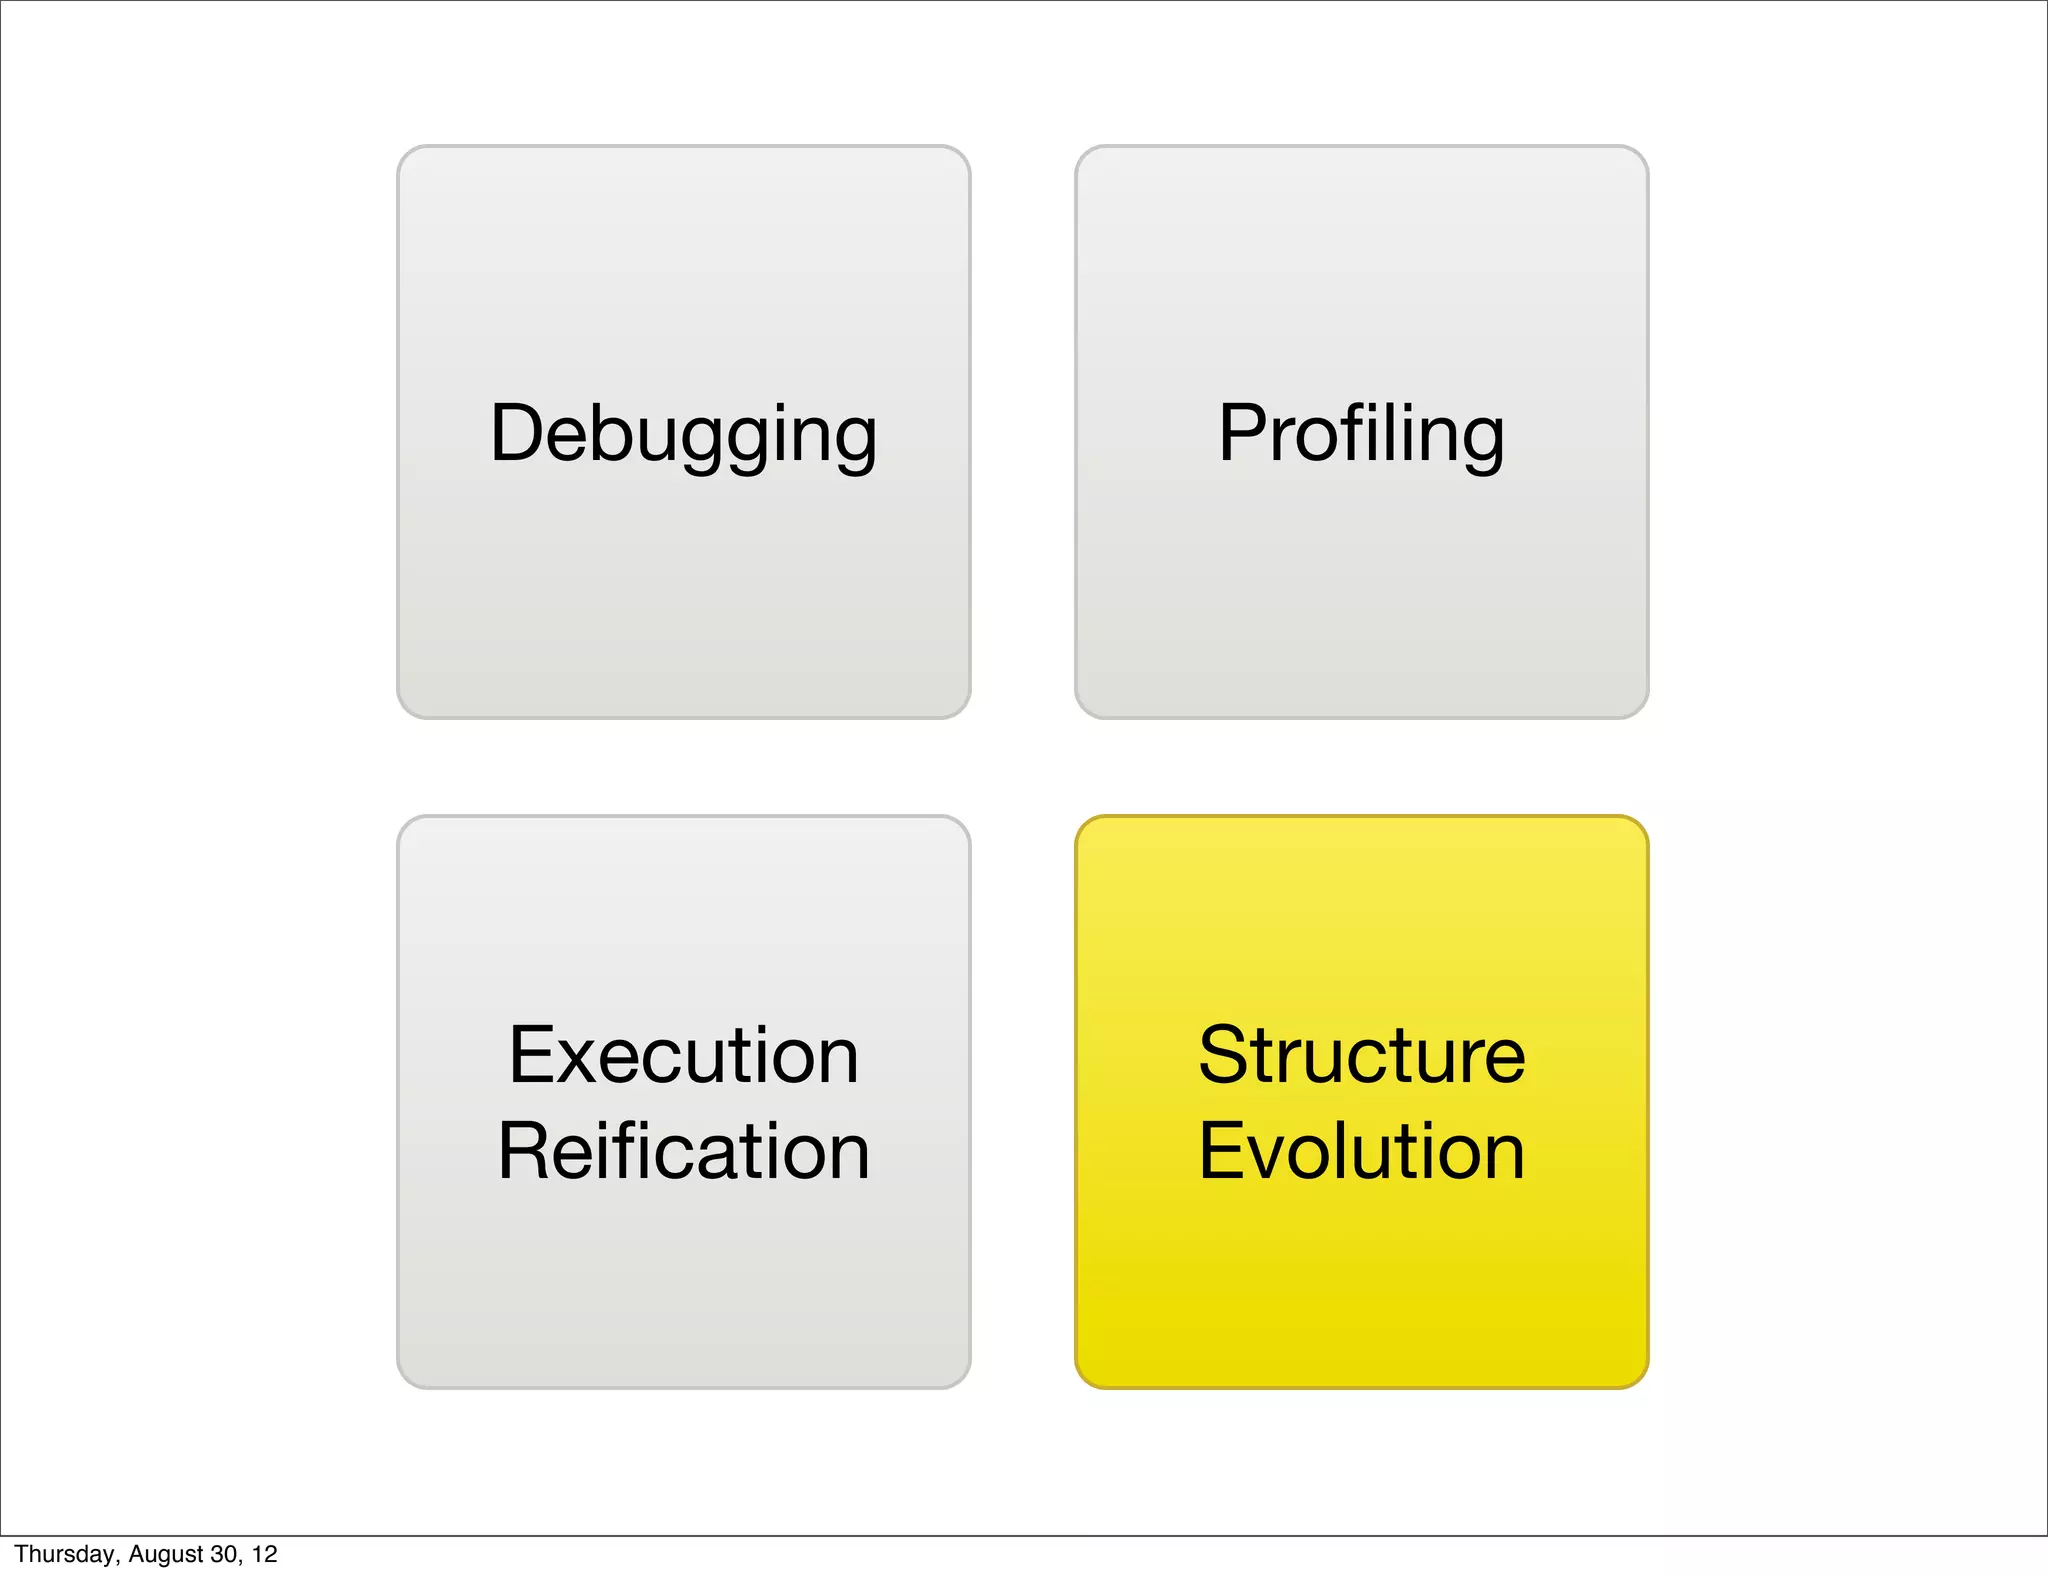
Debugging    Profiling


                          Execution    Structure
                          Reification   Evolution


Thursday, August 30, 12
Debugging    Profiling


                          Execution    Structure
                          Reification   Evolution


Thursday, August 30, 12
Object-Centric
                           Debugging


Thursday, August 30, 12
Object-Centric
                           Debugging
                                                   2
                                              201Nierstrasz
                                         ICSE    .
                                                      rgel and
                                                               O
                                  J. Ressi   a, A, Be


Thursday, August 30, 12
{               {
                {                   {
                                        }
                    }
                    }
                        }       {       }


Thursday, August 30, 12
{               {
                {                   {
                                        }
                    }
                    }
                        }       {       }


Thursday, August 30, 12
{               {
                              {                   {
                                                      }
                                  }
                                  }
                                      }       {       }


Thursday, August 30, 12
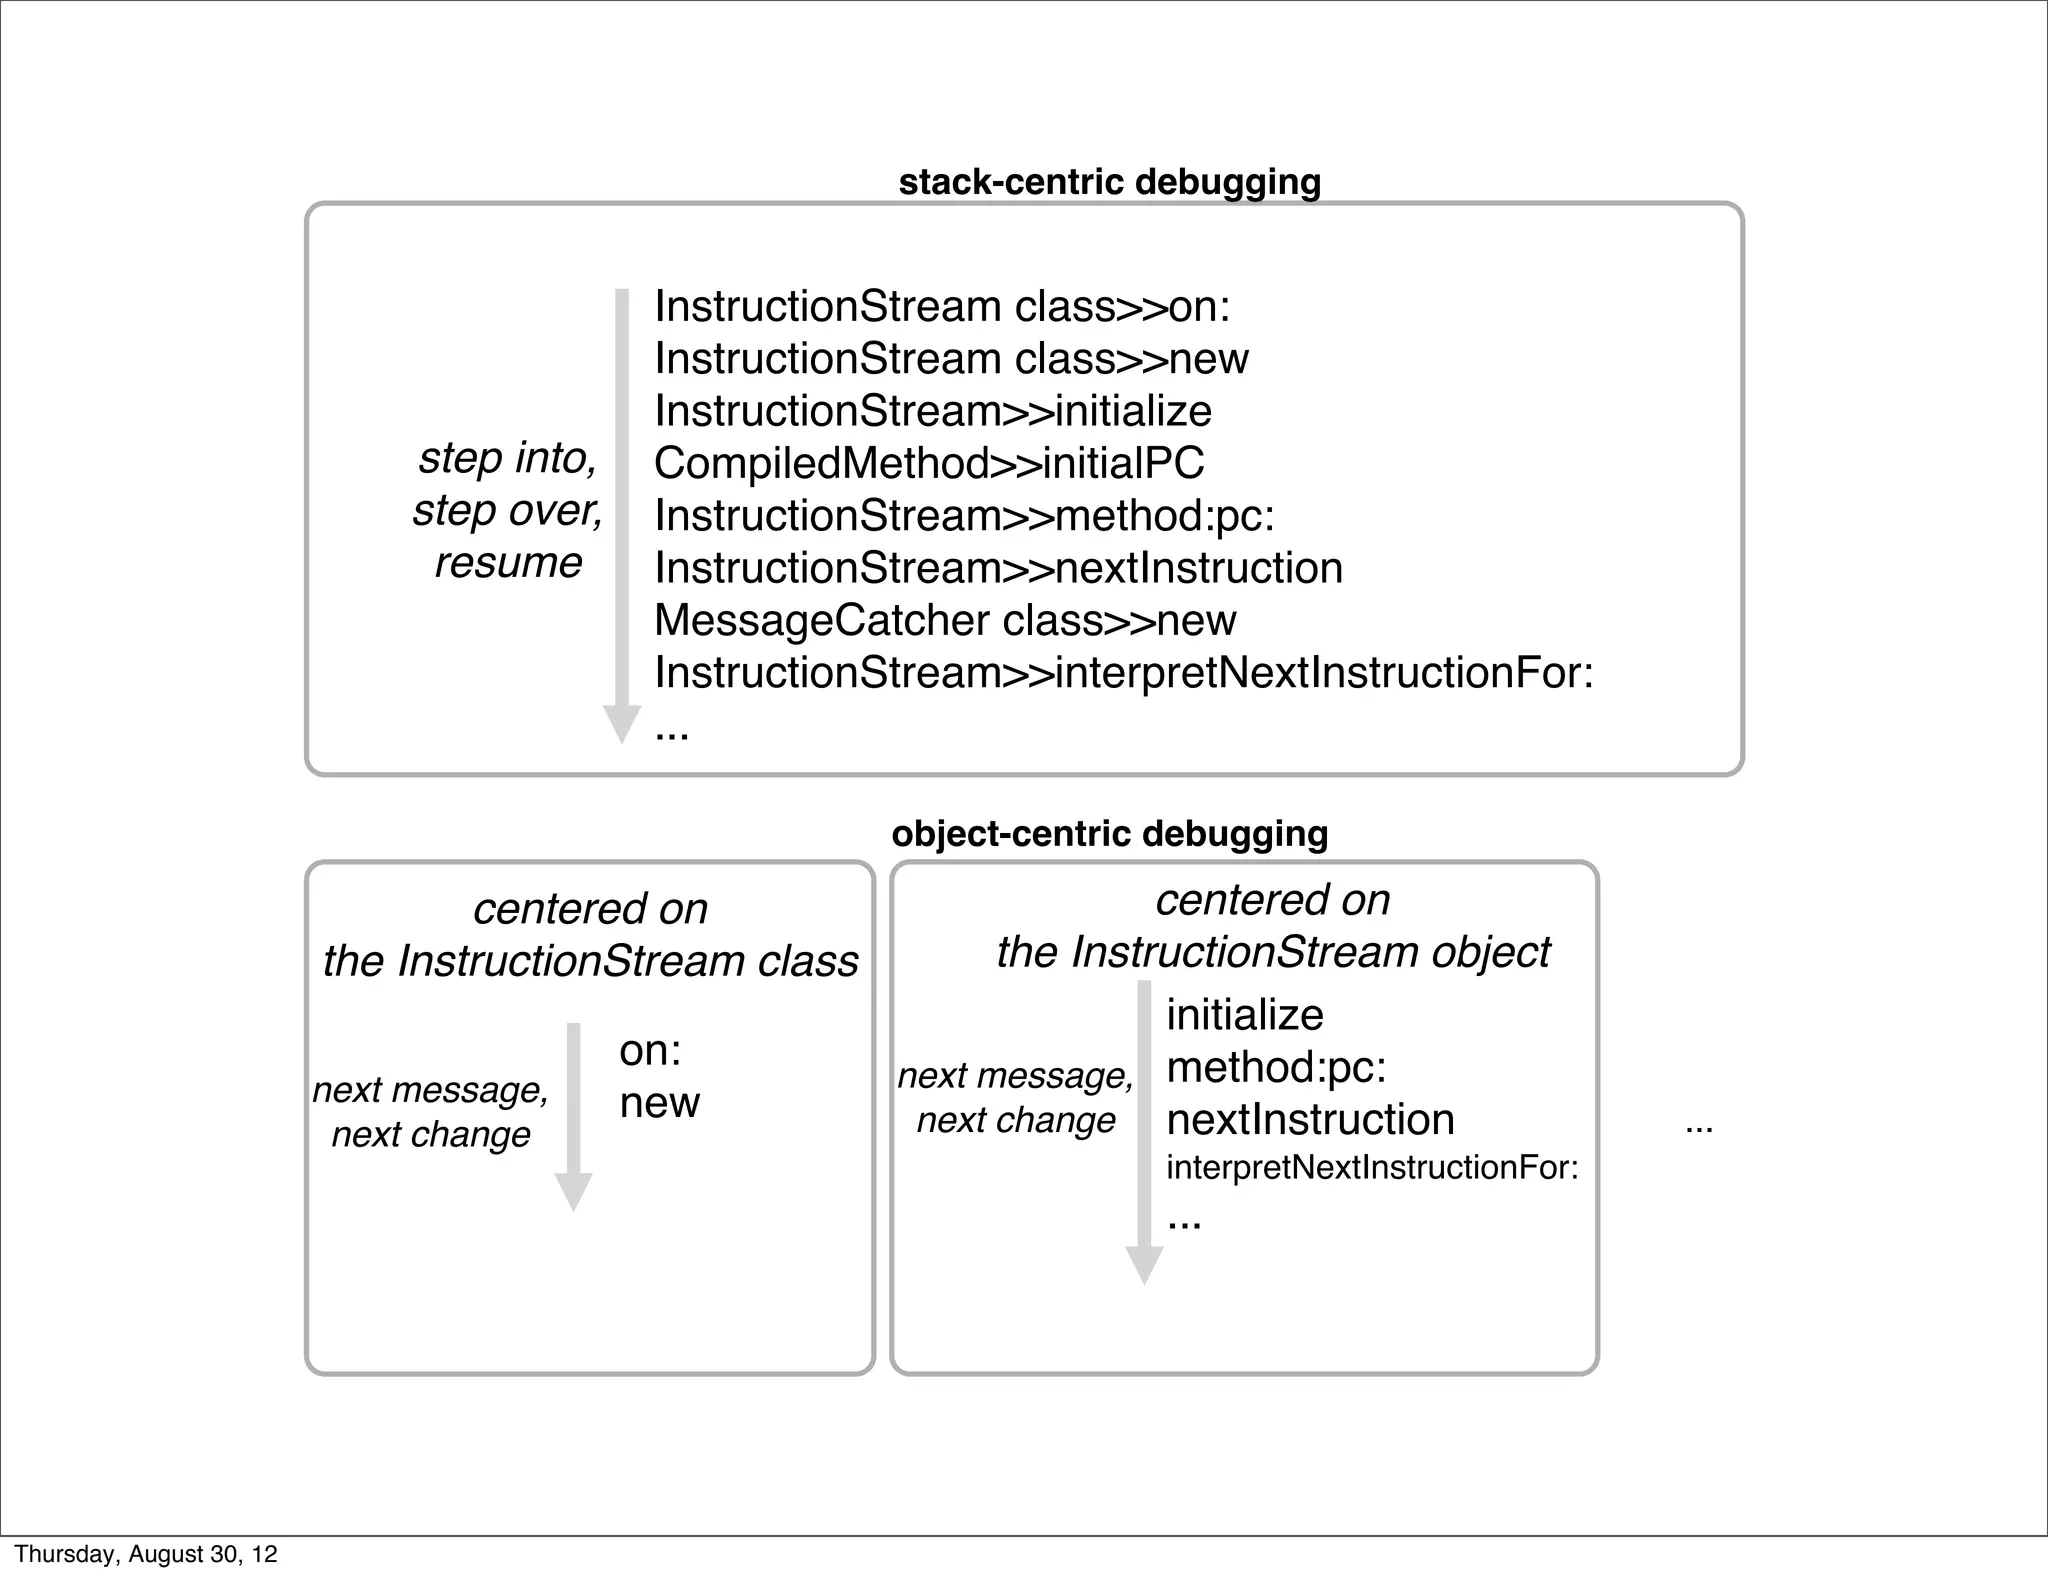
stack-centric debugging


                                             InstructionStream class>>on:
                                             InstructionStream class>>new
                                             InstructionStream>>initialize
                               step into,    CompiledMethod>>initialPC
                               step over,    InstructionStream>>method:pc:
                                resume       InstructionStream>>nextInstruction
                                             MessageCatcher class>>new
                                             InstructionStream>>interpretNextInstructionFor:
                                             ...

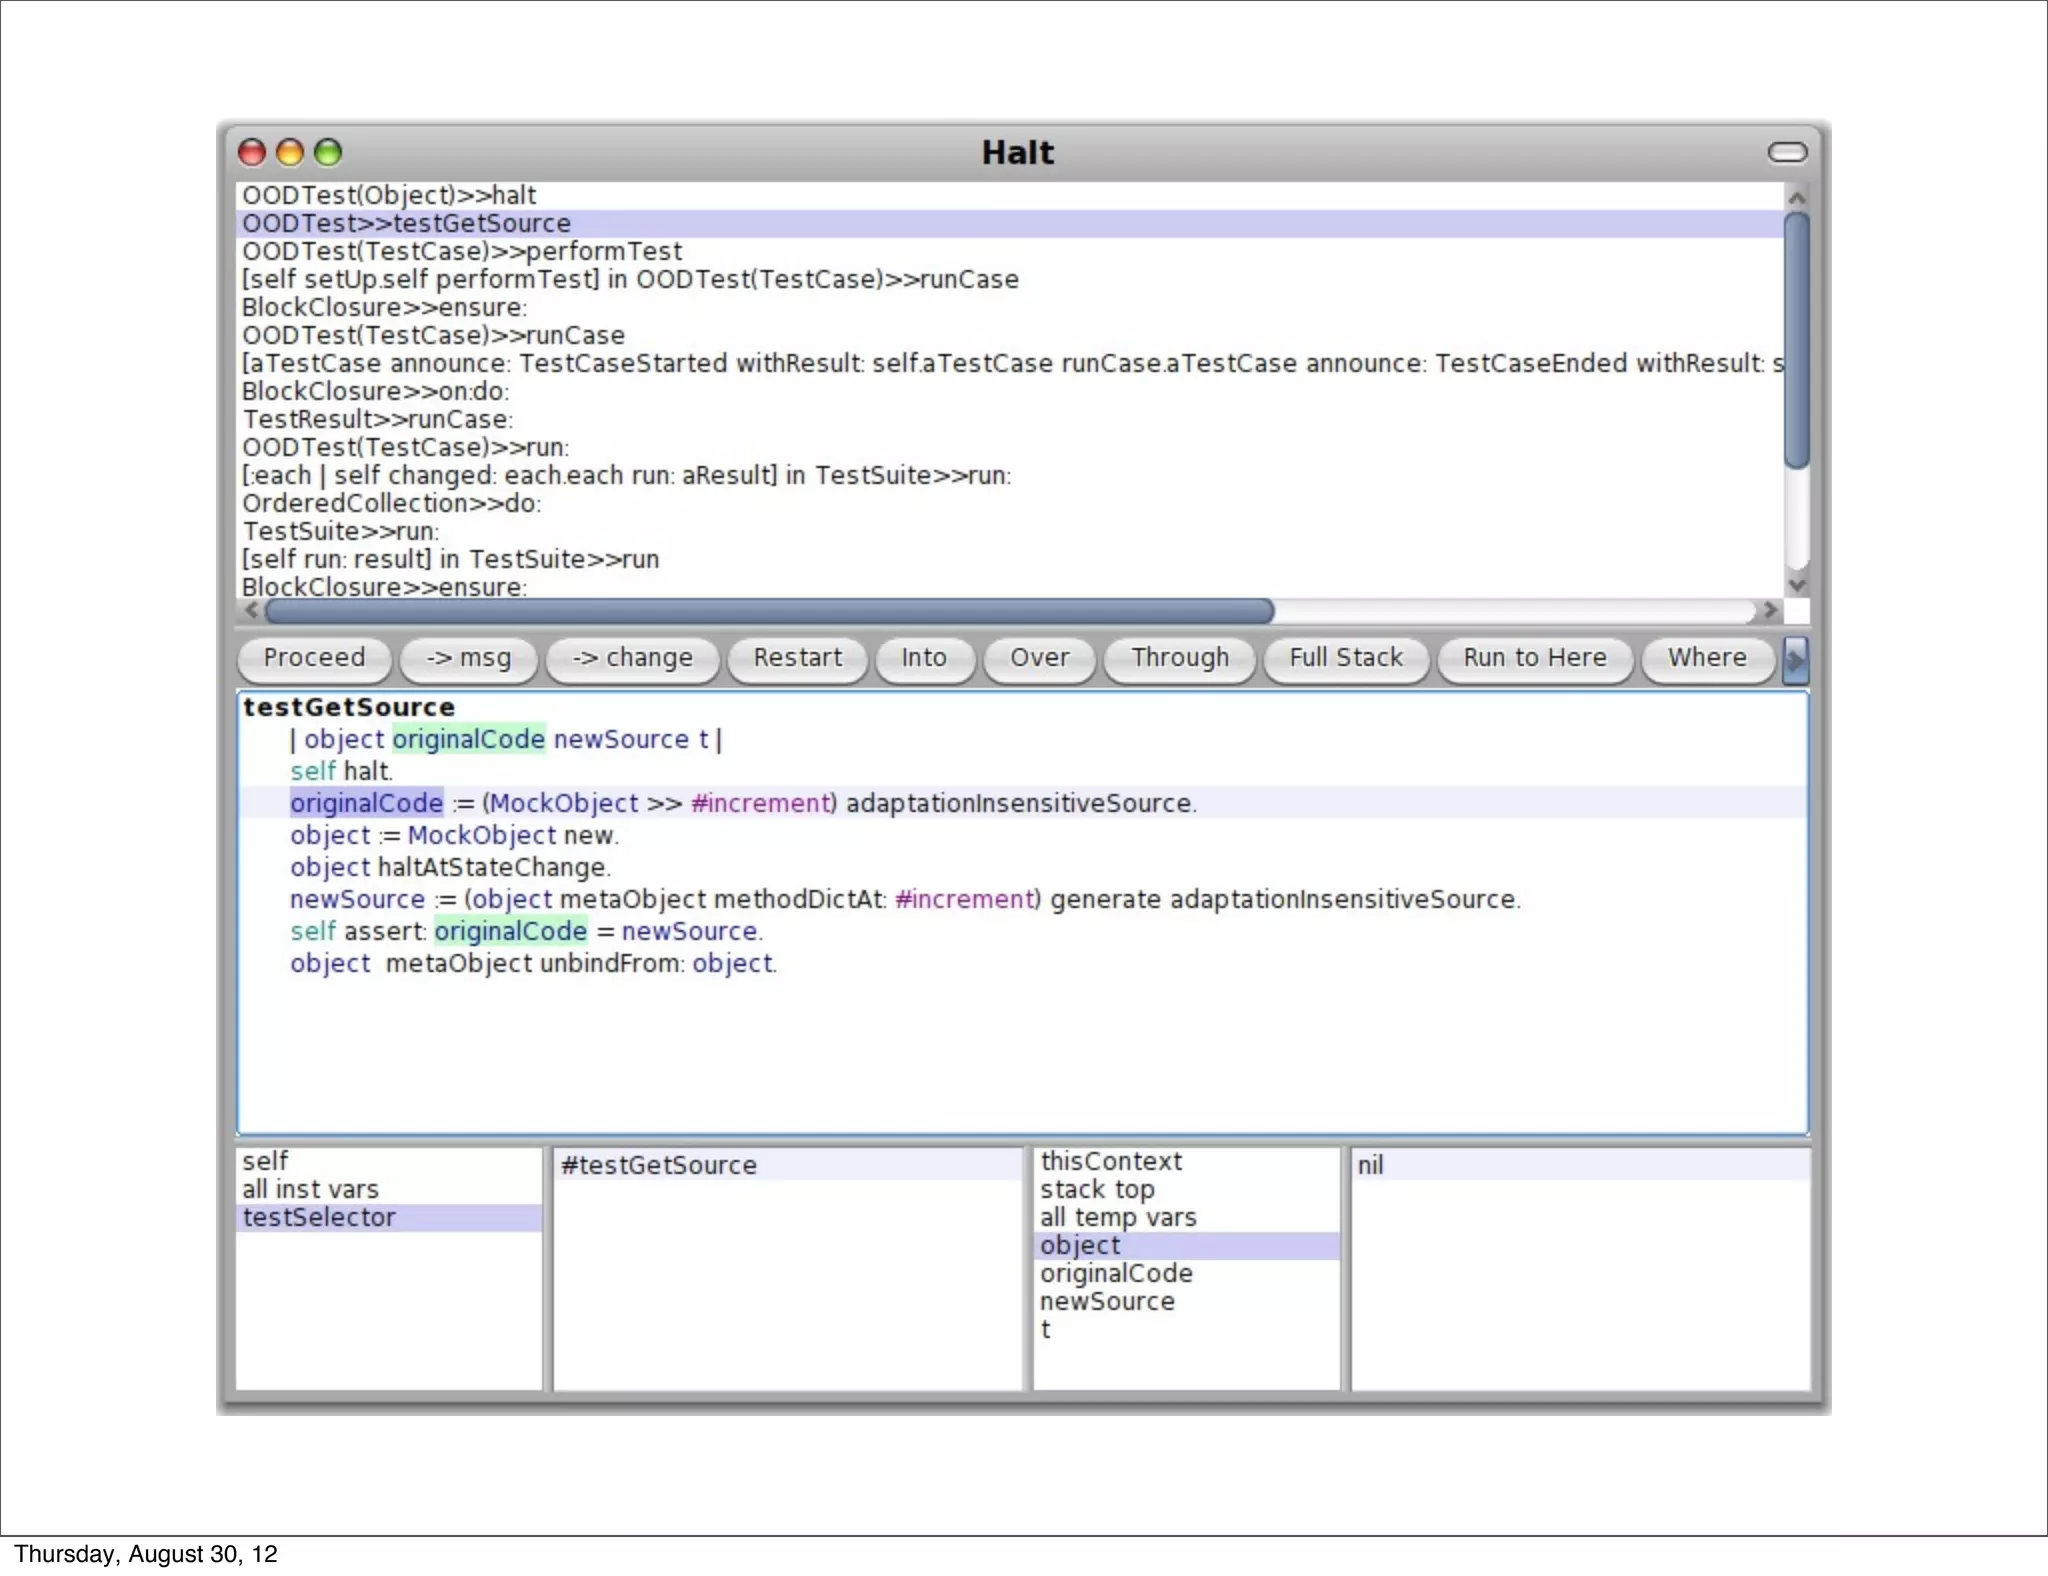
                                                        object-centric debugging

                                  centered on                           centered on
                          the InstructionStream class          the InstructionStream object
                                                                         initialize
                                            on:
                          next message,                  next message, method:pc:
                                            new           next change nextInstruction                 ...
                           next change
                                                                       interpretNextInstructionFor:
                                                                       ...


Thursday, August 30, 12
Mondrian


Thursday, August 30, 12
Shape and Nodes


Thursday, August 30, 12
halt on object in
                                 call


Thursday, August 30, 12
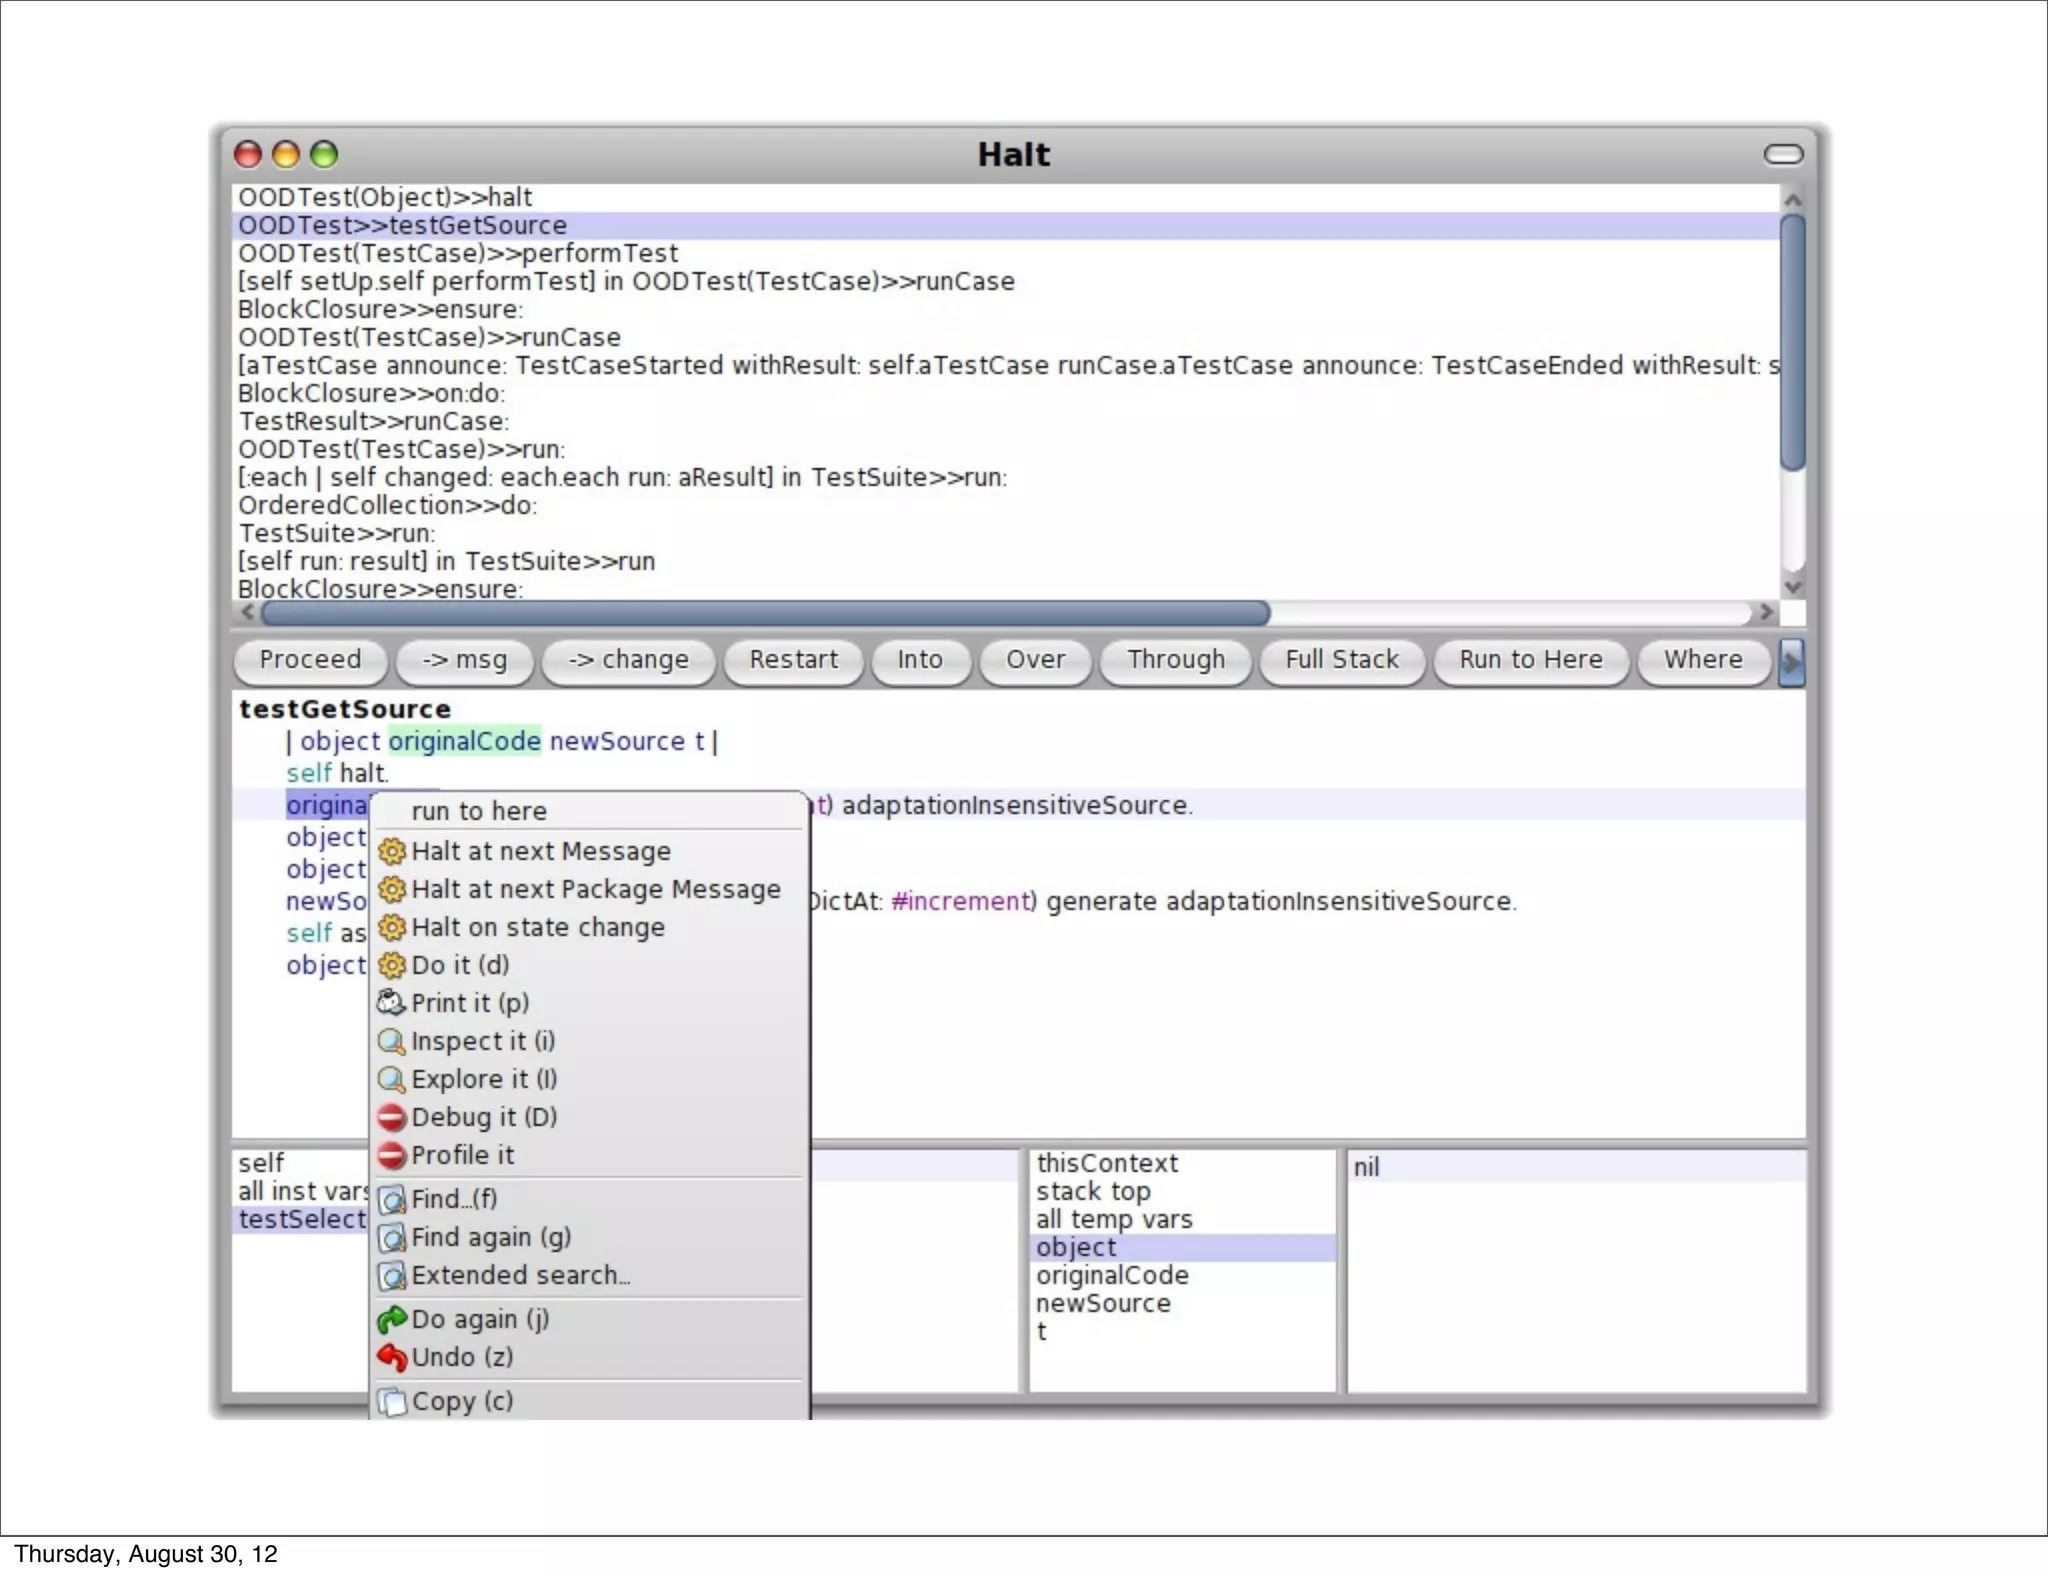
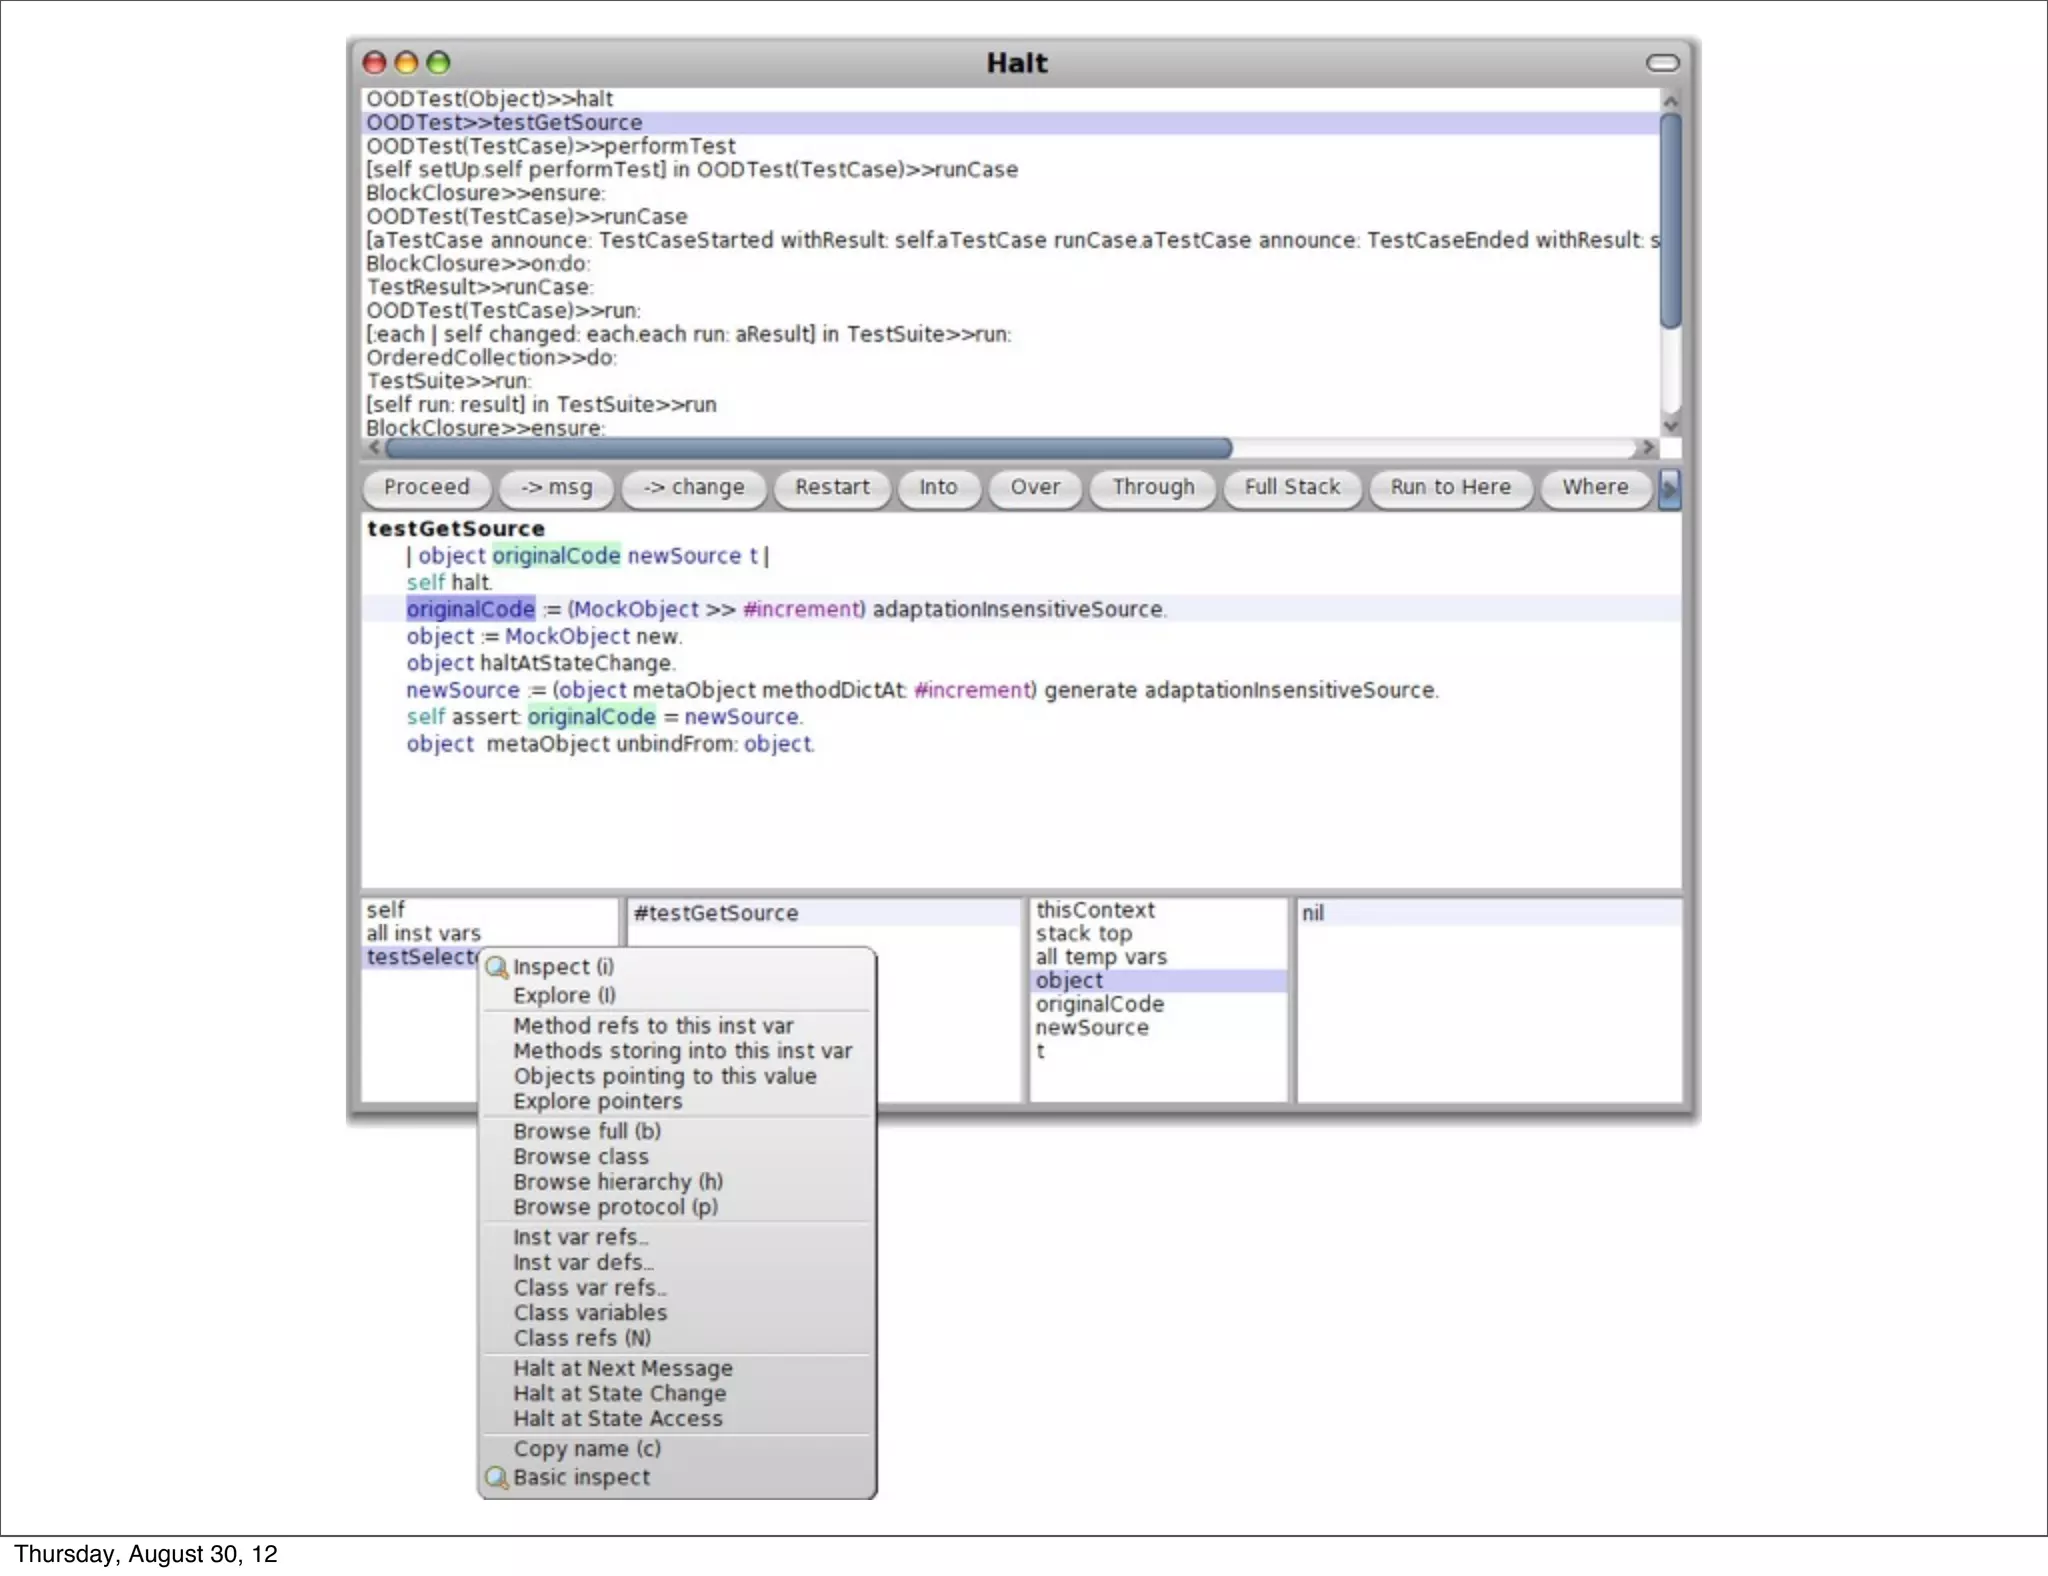
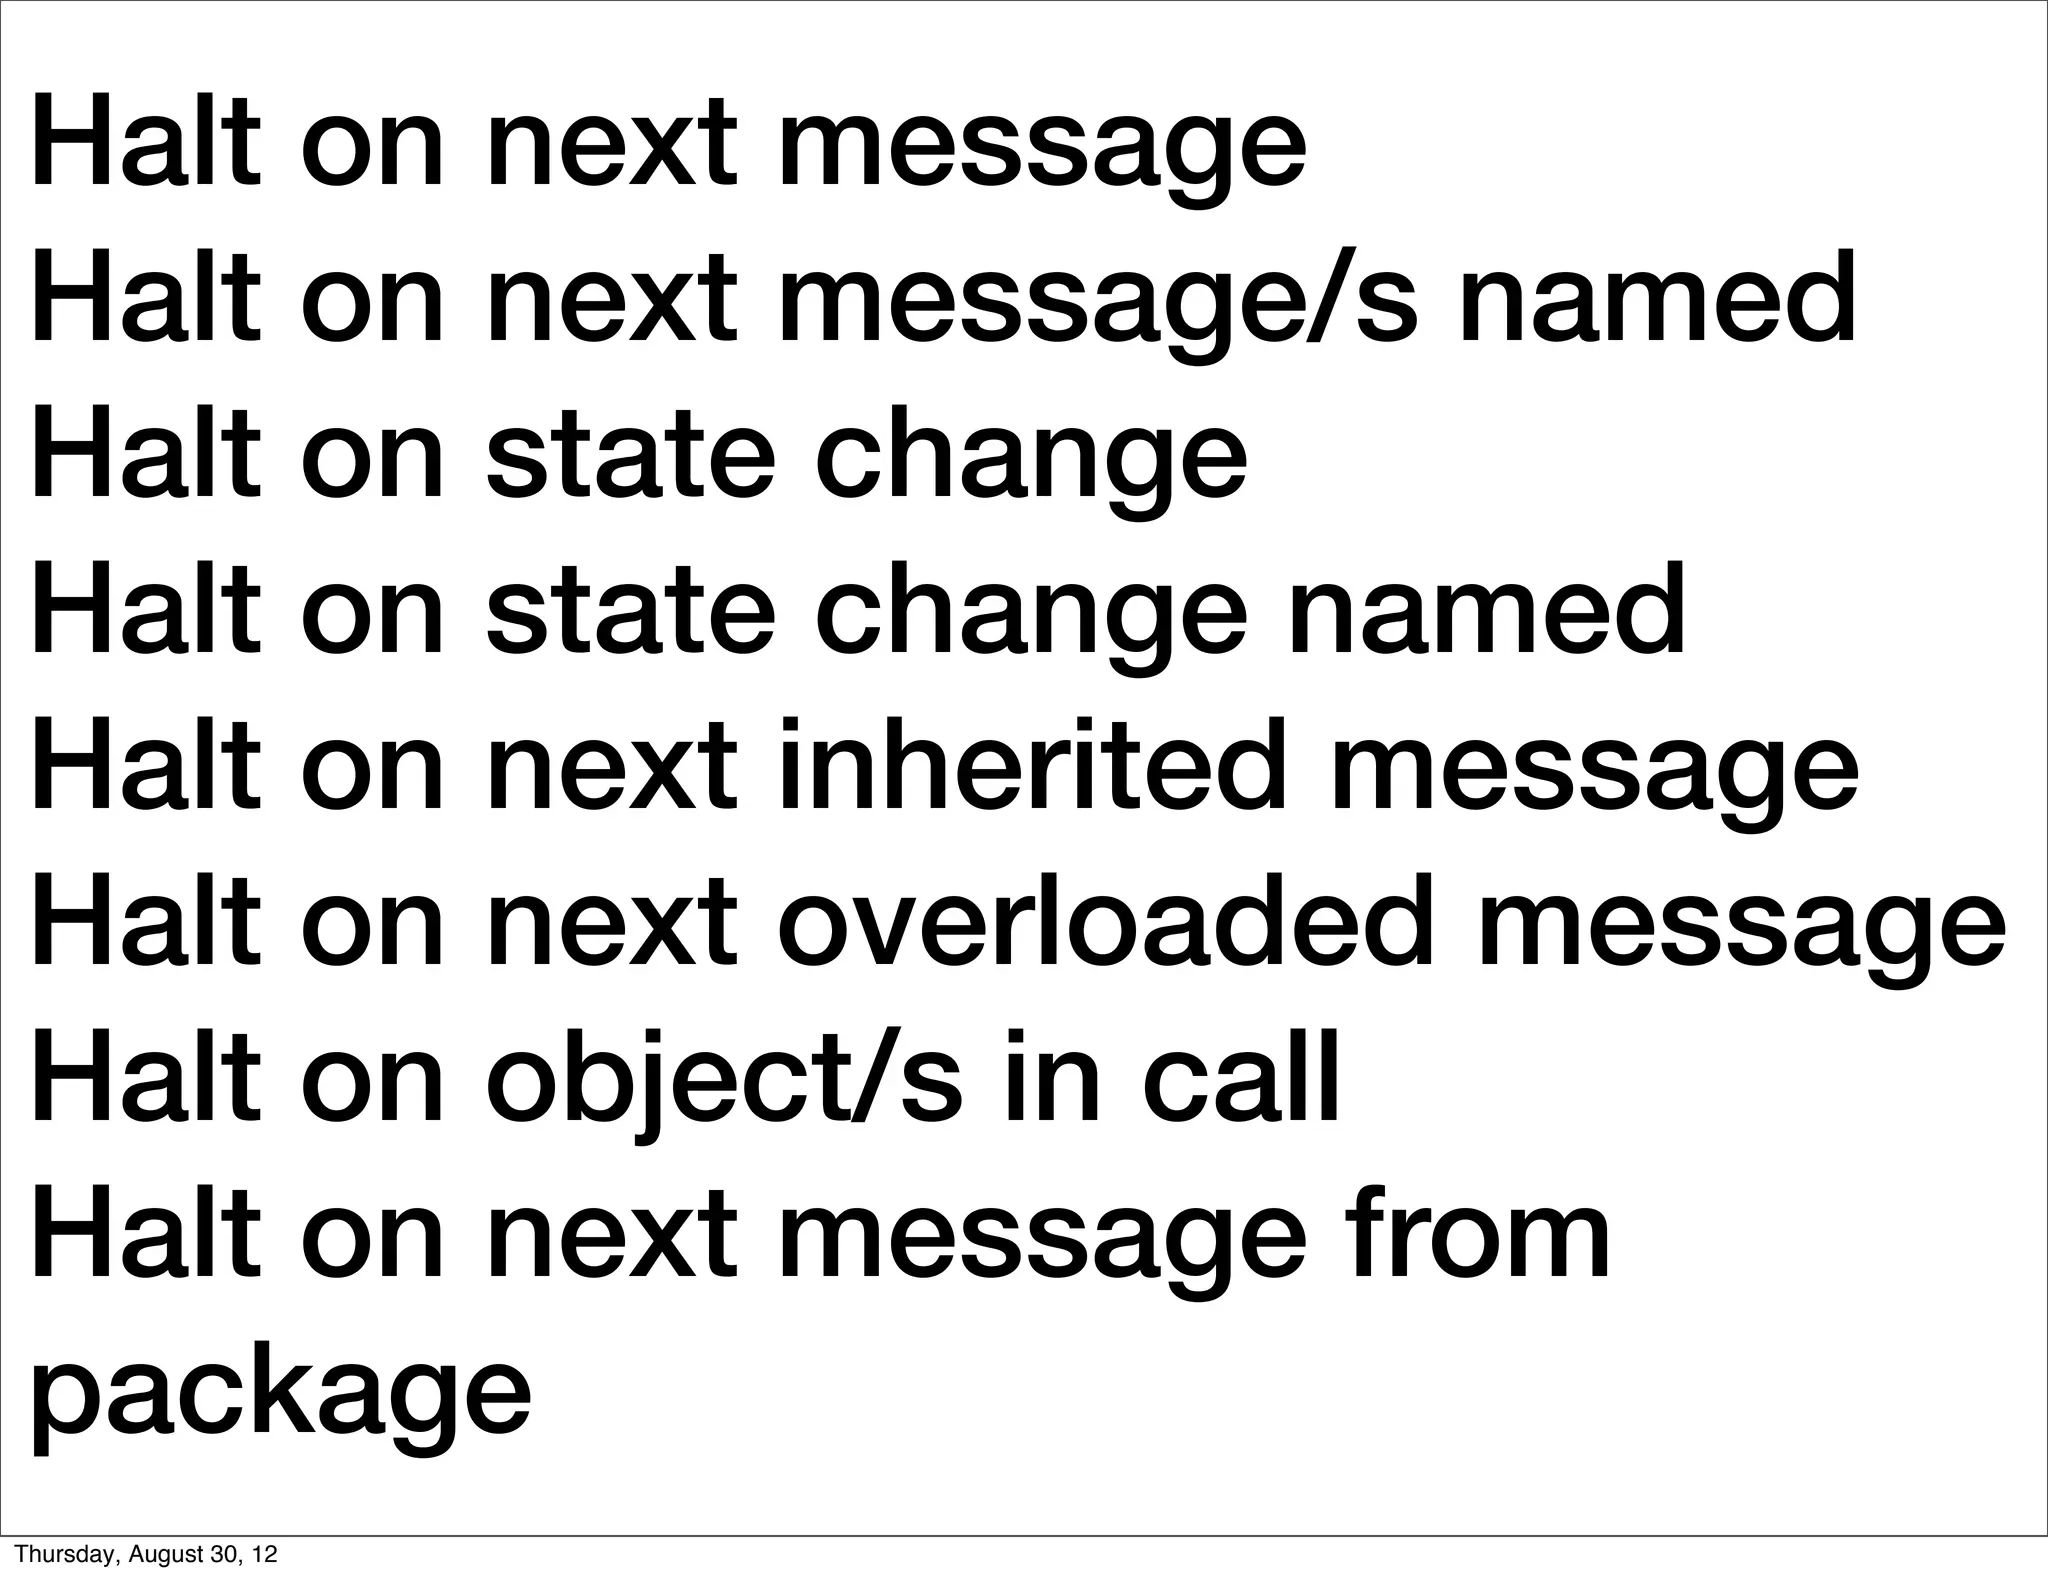
Halt on next message
 Halt on next message/s named
 Halt on state change
 Halt on state change named
 Halt on next inherited message
 Halt on next overloaded message
 Halt on object/s in call
 Halt on next message from
 package
Thursday, August 30, 12
Debugging    Profiling


                          Execution    Structure
                          Reification   Evolution


Thursday, August 30, 12
MetaSpy


Thursday, August 30, 12
MetaSpy

                                    OLS 2011
                               TO   Ber gel etal.


Thursday, August 30, 12
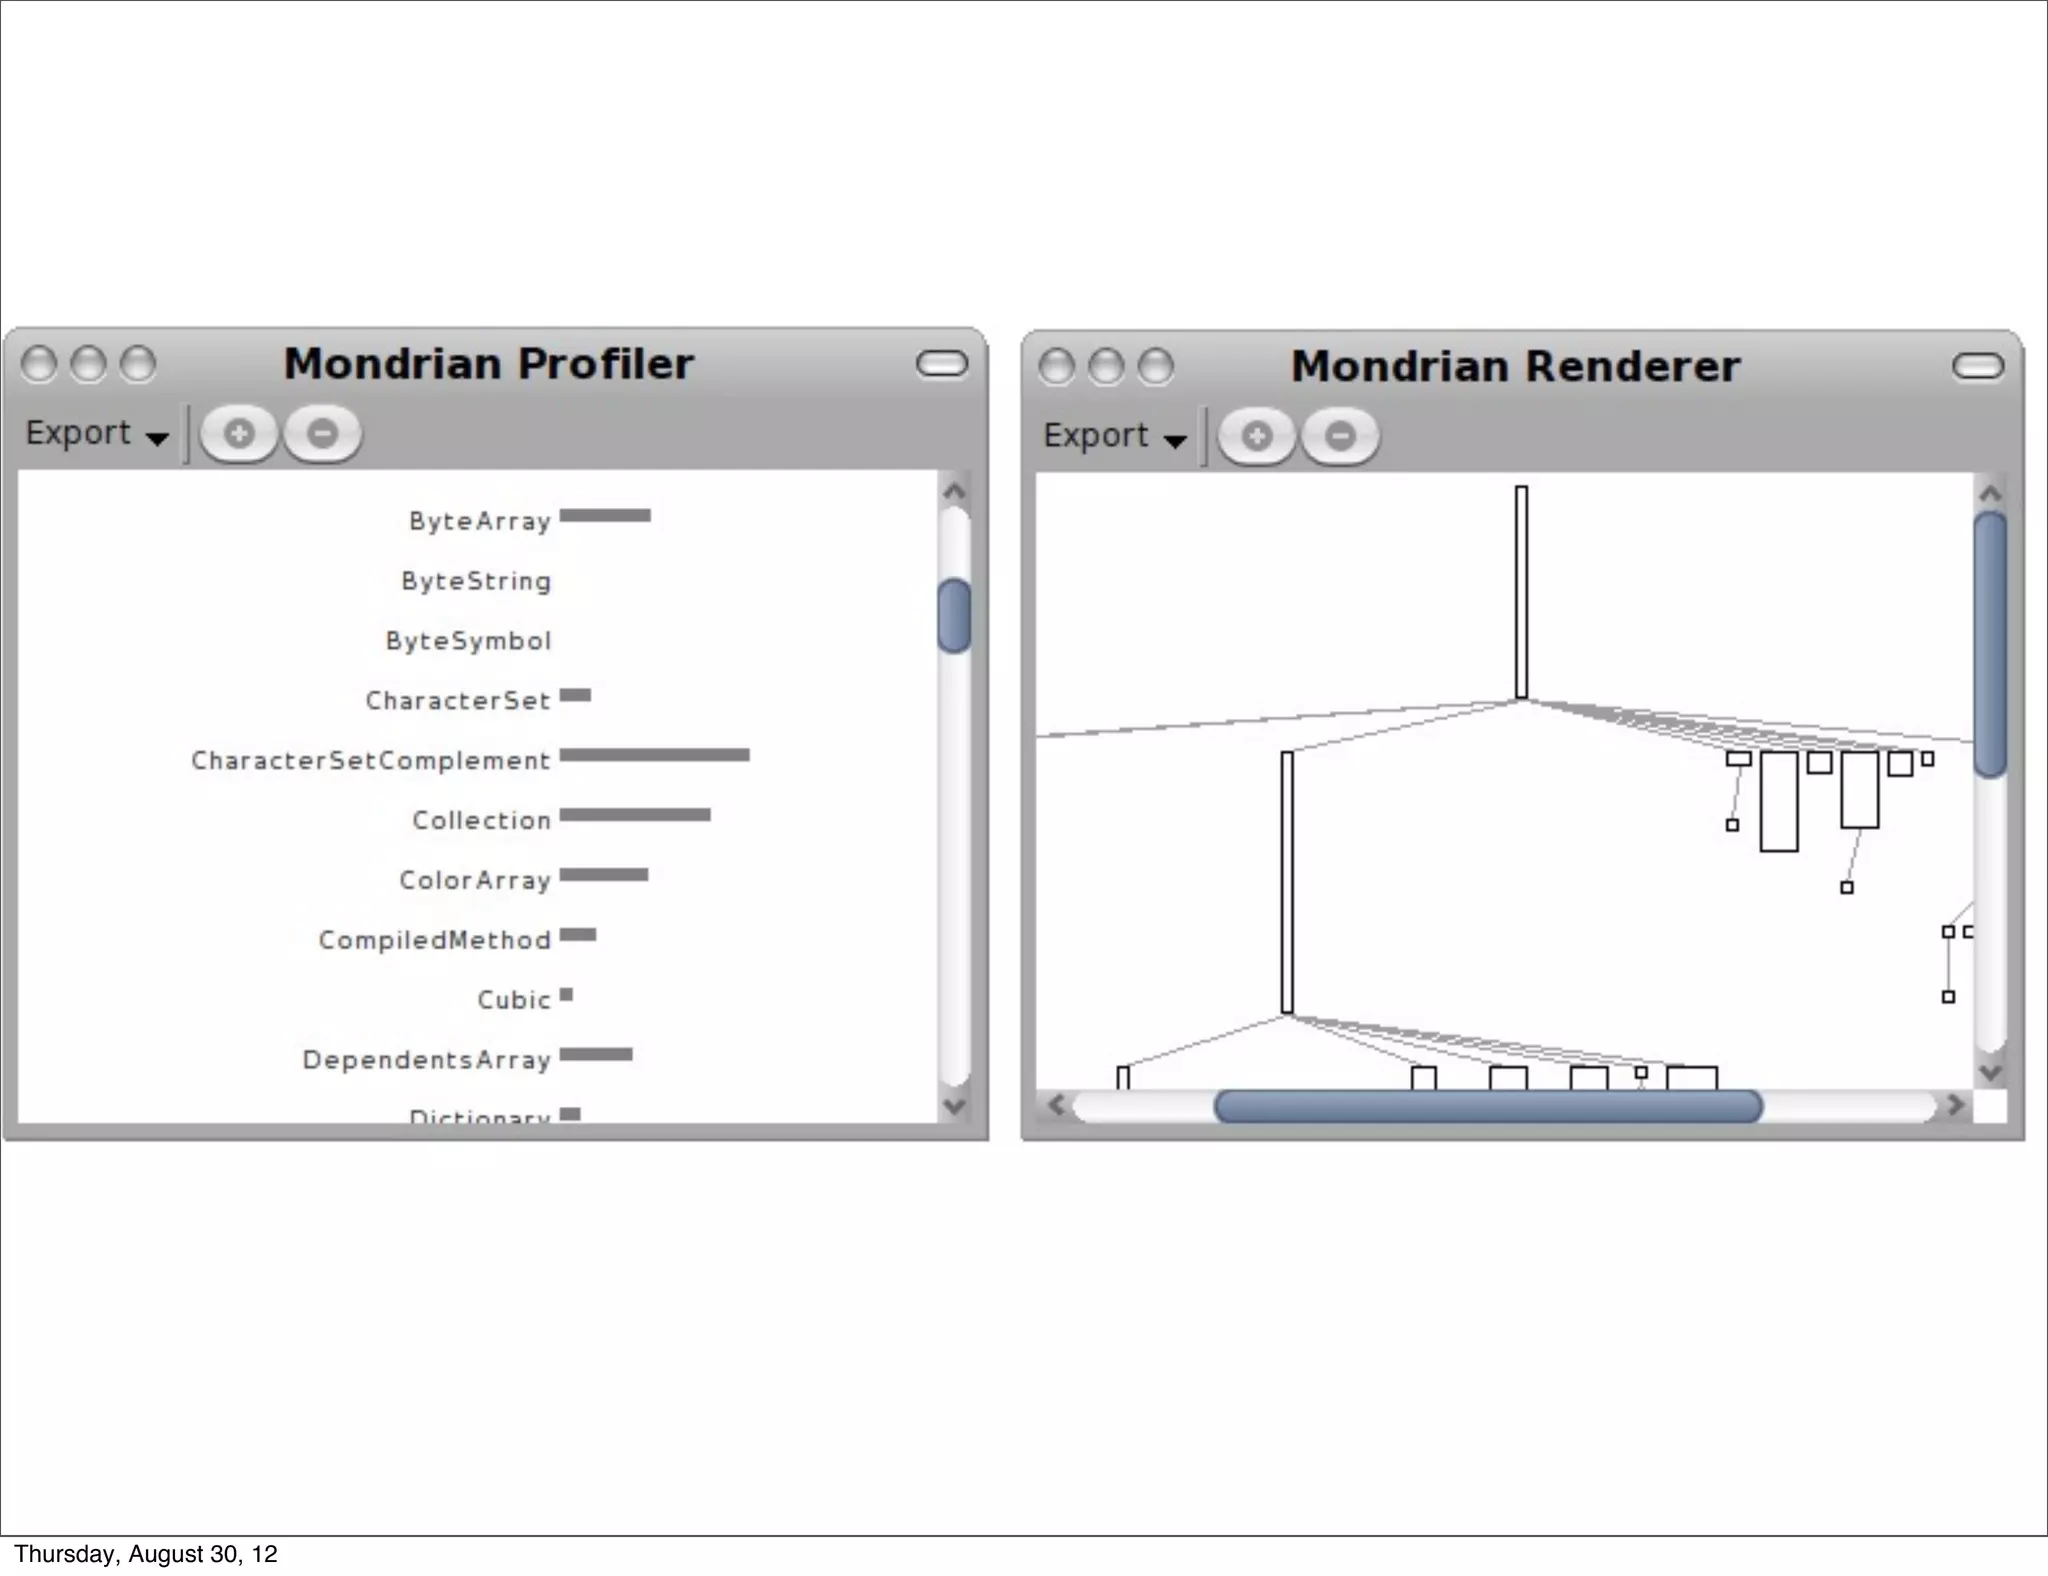
Mondrian Profiler


Thursday, August 30, 12
C omp lexity
                            stema, Ducasse 2003
                          Sy anz L


Thursday, August 30, 12
Debugging    Profiling


                          Execution    Structure
                          Reification   Evolution


Thursday, August 30, 12
What if we do not
              know what to evolve?


Thursday, August 30, 12
?
Thursday, August 30, 12
Prisma


Thursday, August 30, 12
Back in time
                           Debugger


Thursday, August 30, 12
Back in time
                           Debugger

                                                        Debu gger
                                              w
                                           Floal. ECOOP 2008
                                O   b ject  nhard e
                                                    t
                                        Lie


Thursday, August 30, 12
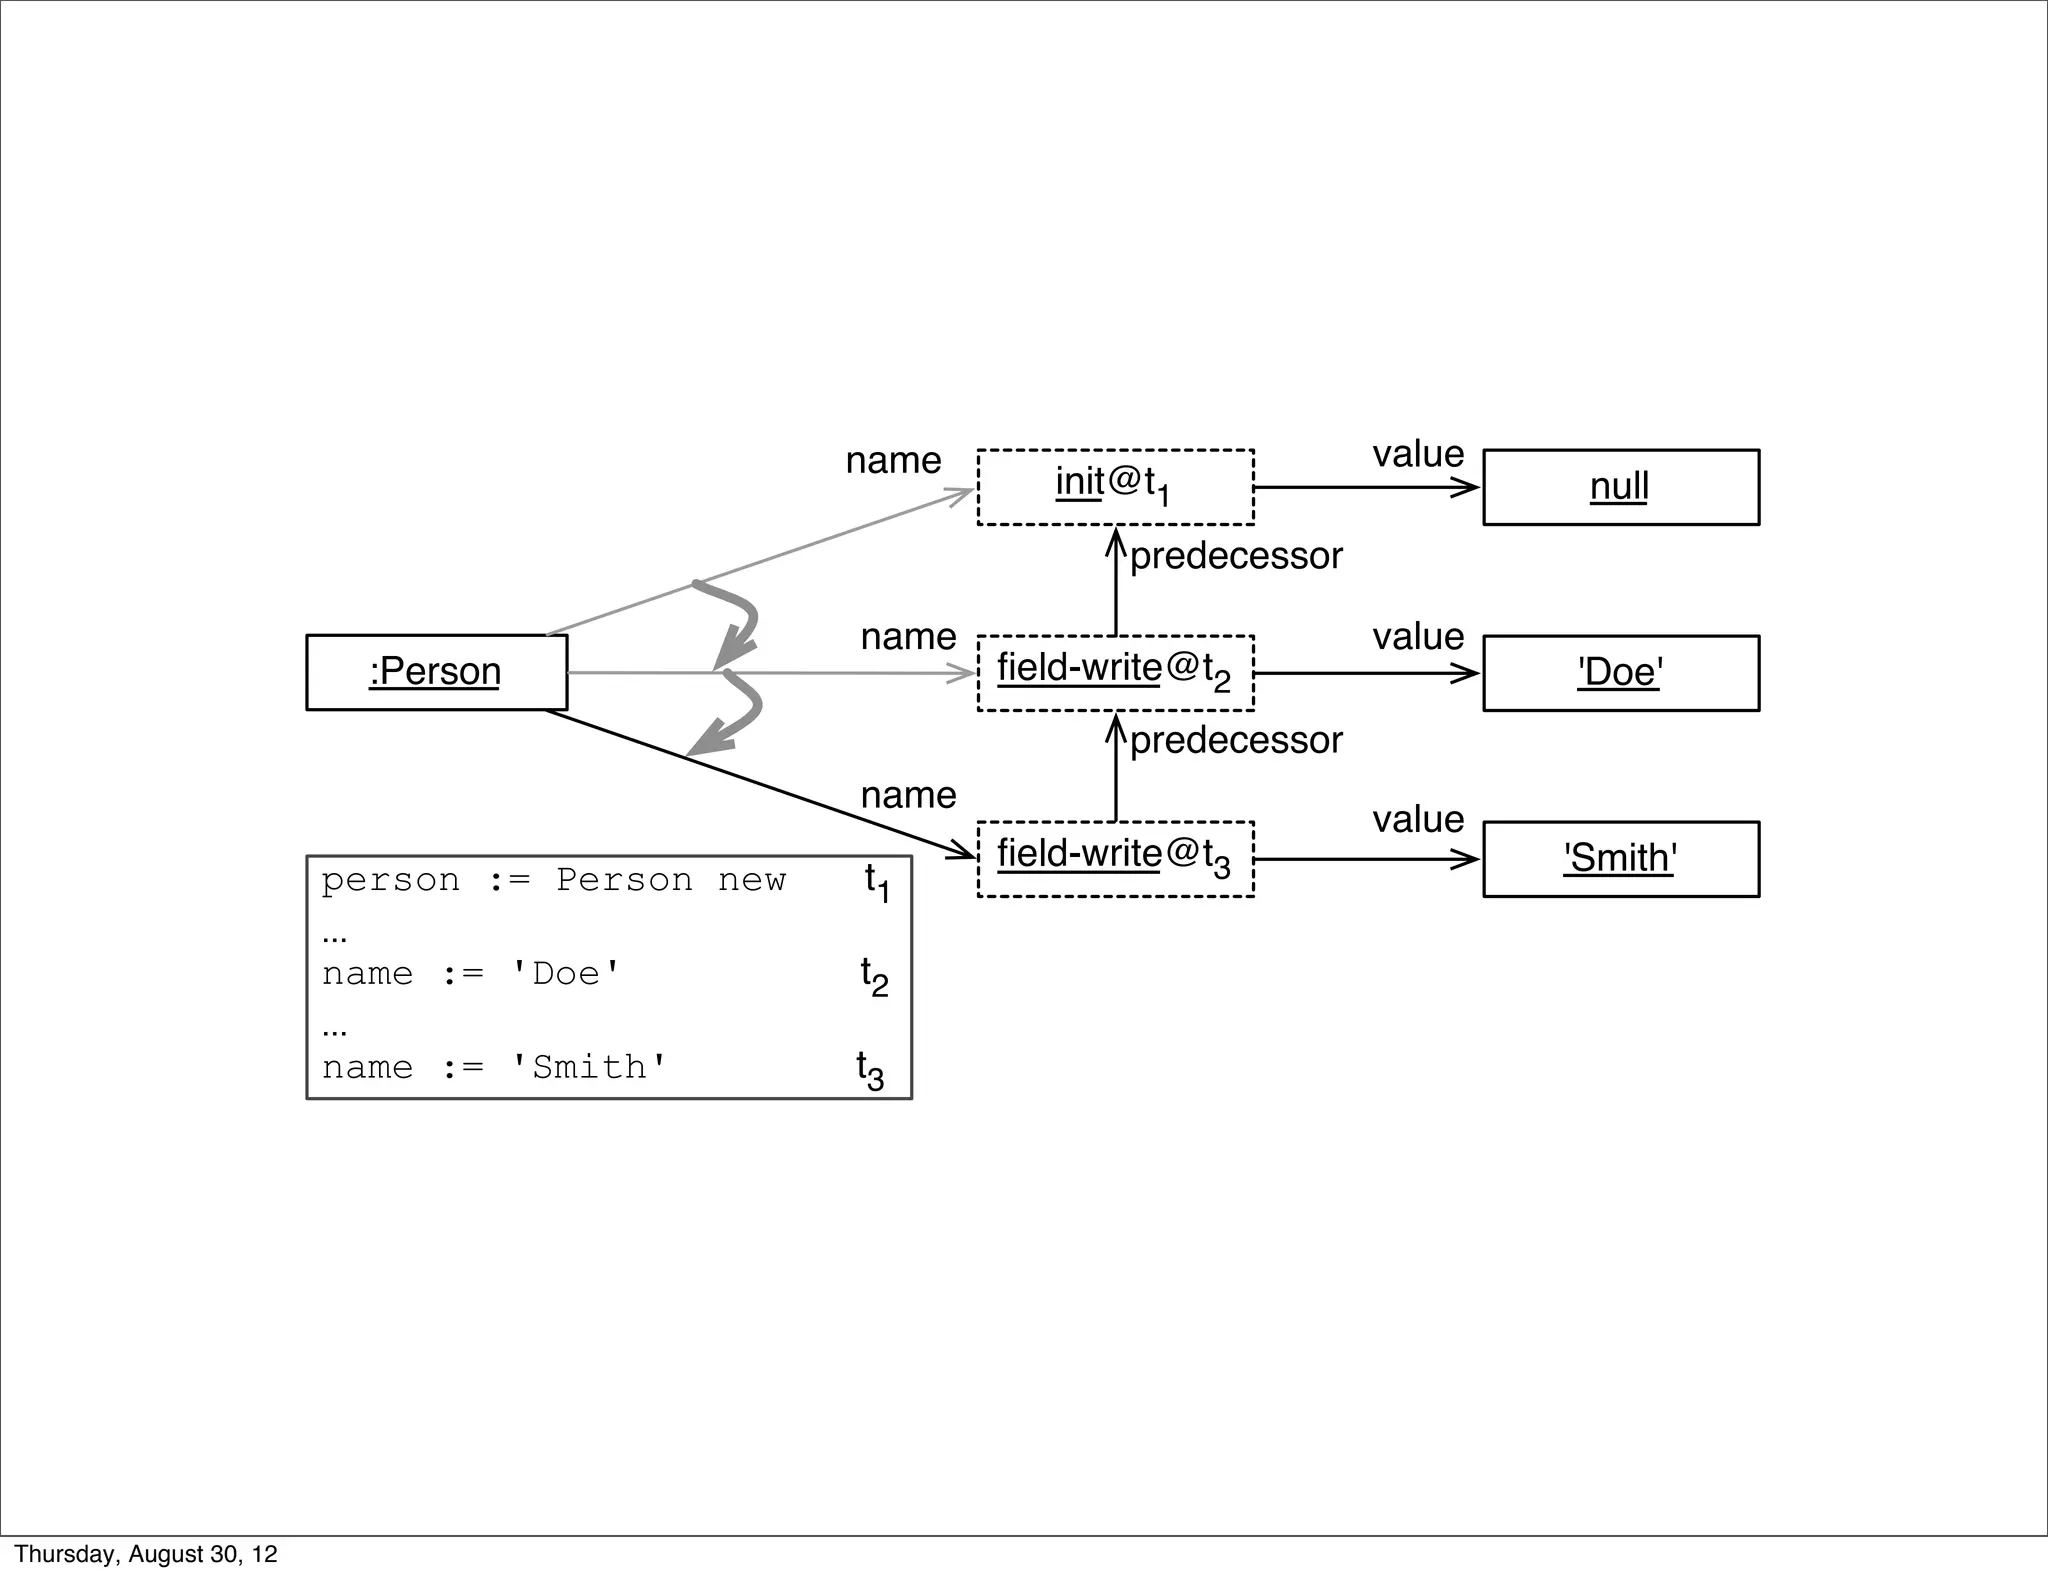
name                        value
                                                           init@t1                    null
                                                               predecessor

                                                 name                        value
                                :Person                 field-write@t2                'Doe'
                                                               predecessor
                                                 name
                                                                             value
                                                        field-write@t3                'Smith'
                          person := Person new   t1
                          ...
                          name := 'Doe'          t2
                          ...
                          name := 'Smith'        t3


Thursday, August 30, 12
Debugging    Profiling


                          Execution    Structure
                          Reification   Evolution


Thursday, August 30, 12
Talents


                          scg.unibe.ch/research/talents

Thursday, August 30, 12
Talents
                                                             ST 2 011F. Perin and
                                                      IW                ie rstrasz,
                                                            îr ba, O. N gli
                                           J. Re ssia, T. G        L. Reng


                          scg.unibe.ch/research/talents

Thursday, August 30, 12
Dynamically
                   composable units of
                        reuse


Thursday, August 30, 12
Streams


Thursday, August 30, 12
scg.unibe.ch/research/bifrost


Thursday, August 30, 12
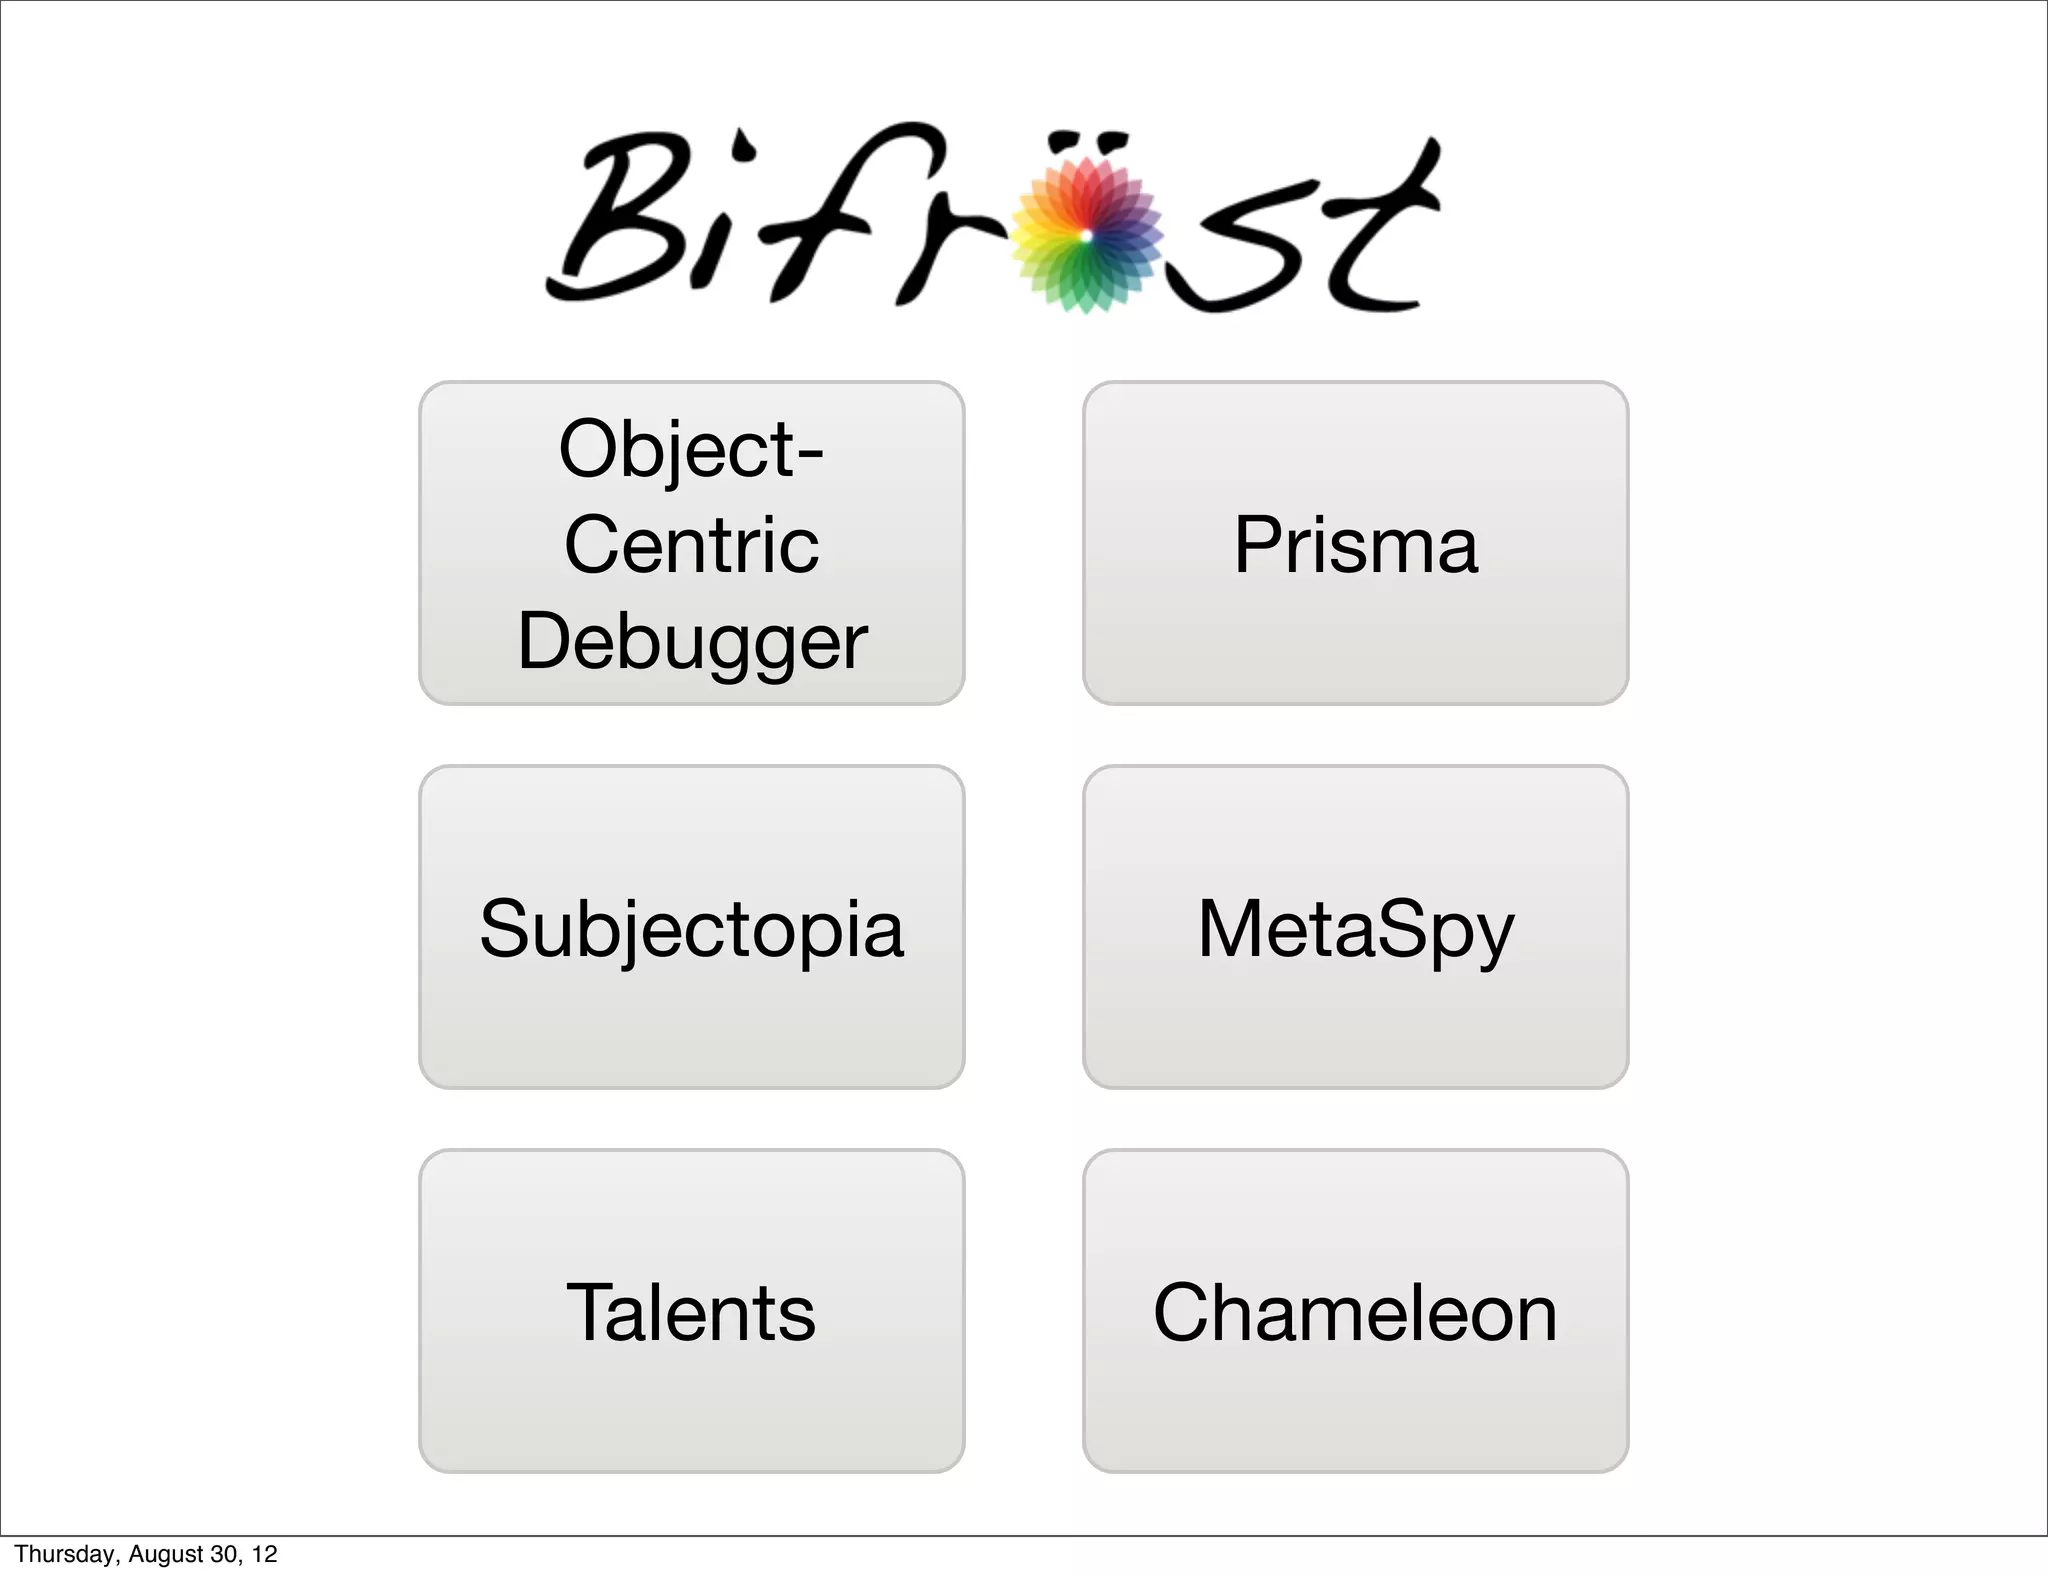
Object-
                           Centric       Prisma
                          Debugger


                          Subjectopia   MetaSpy


                            Talents     Chameleon

Thursday, August 30, 12
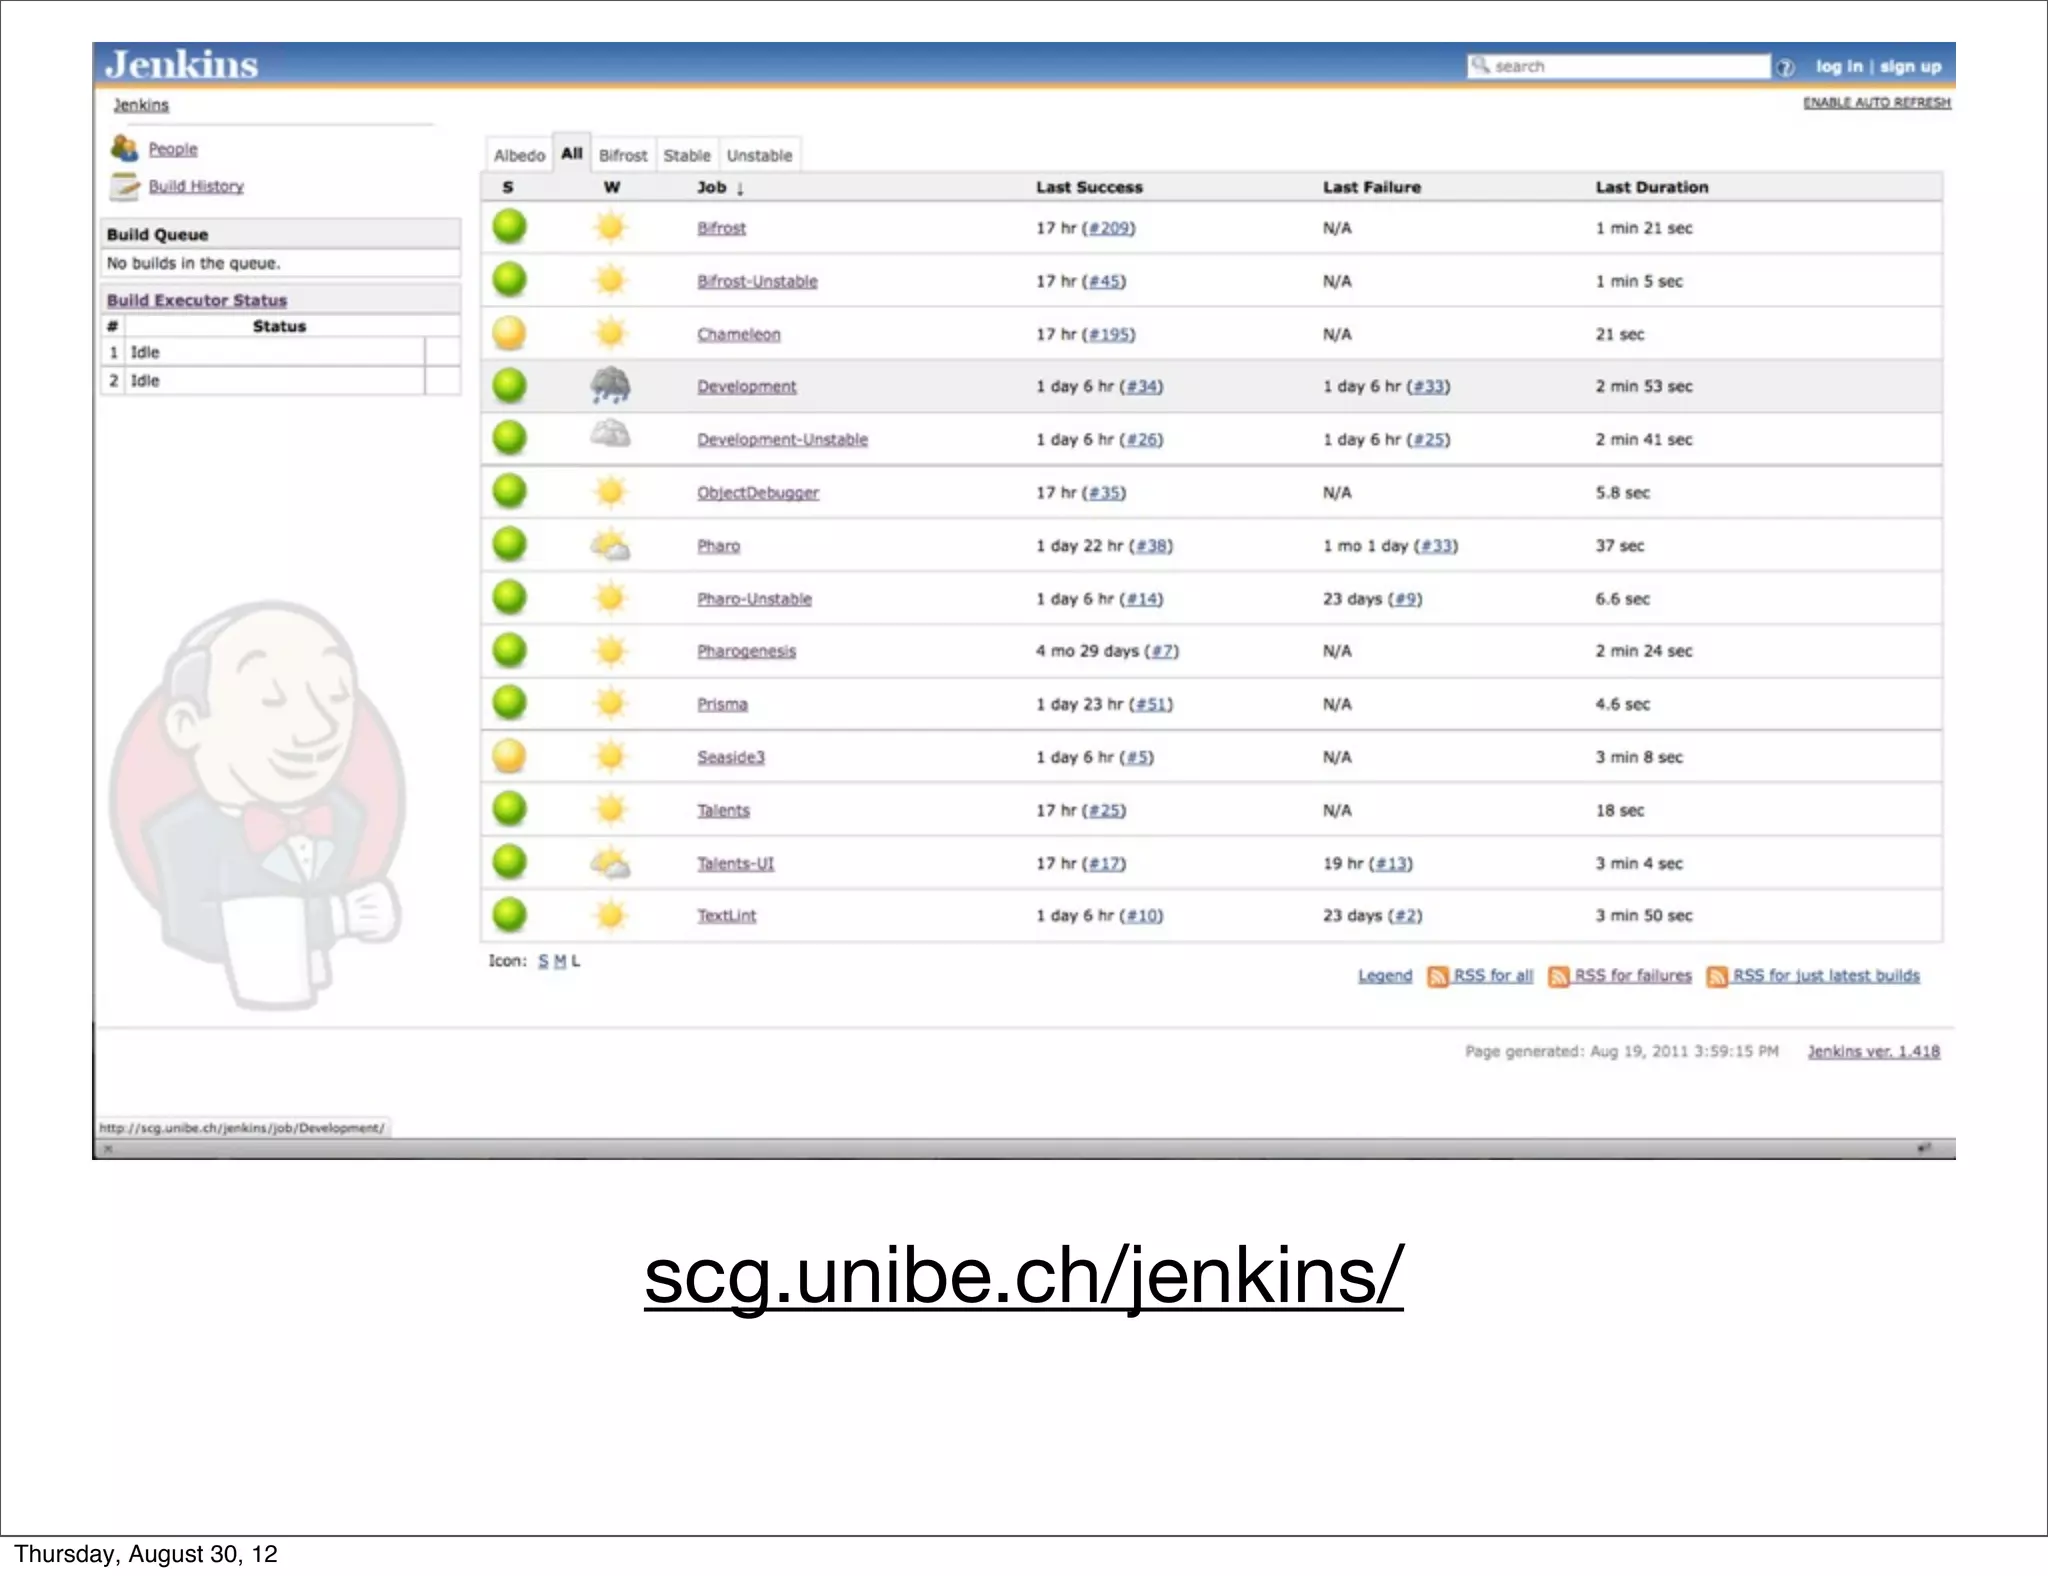
scg.unibe.ch/jenkins/


Thursday, August 30, 12
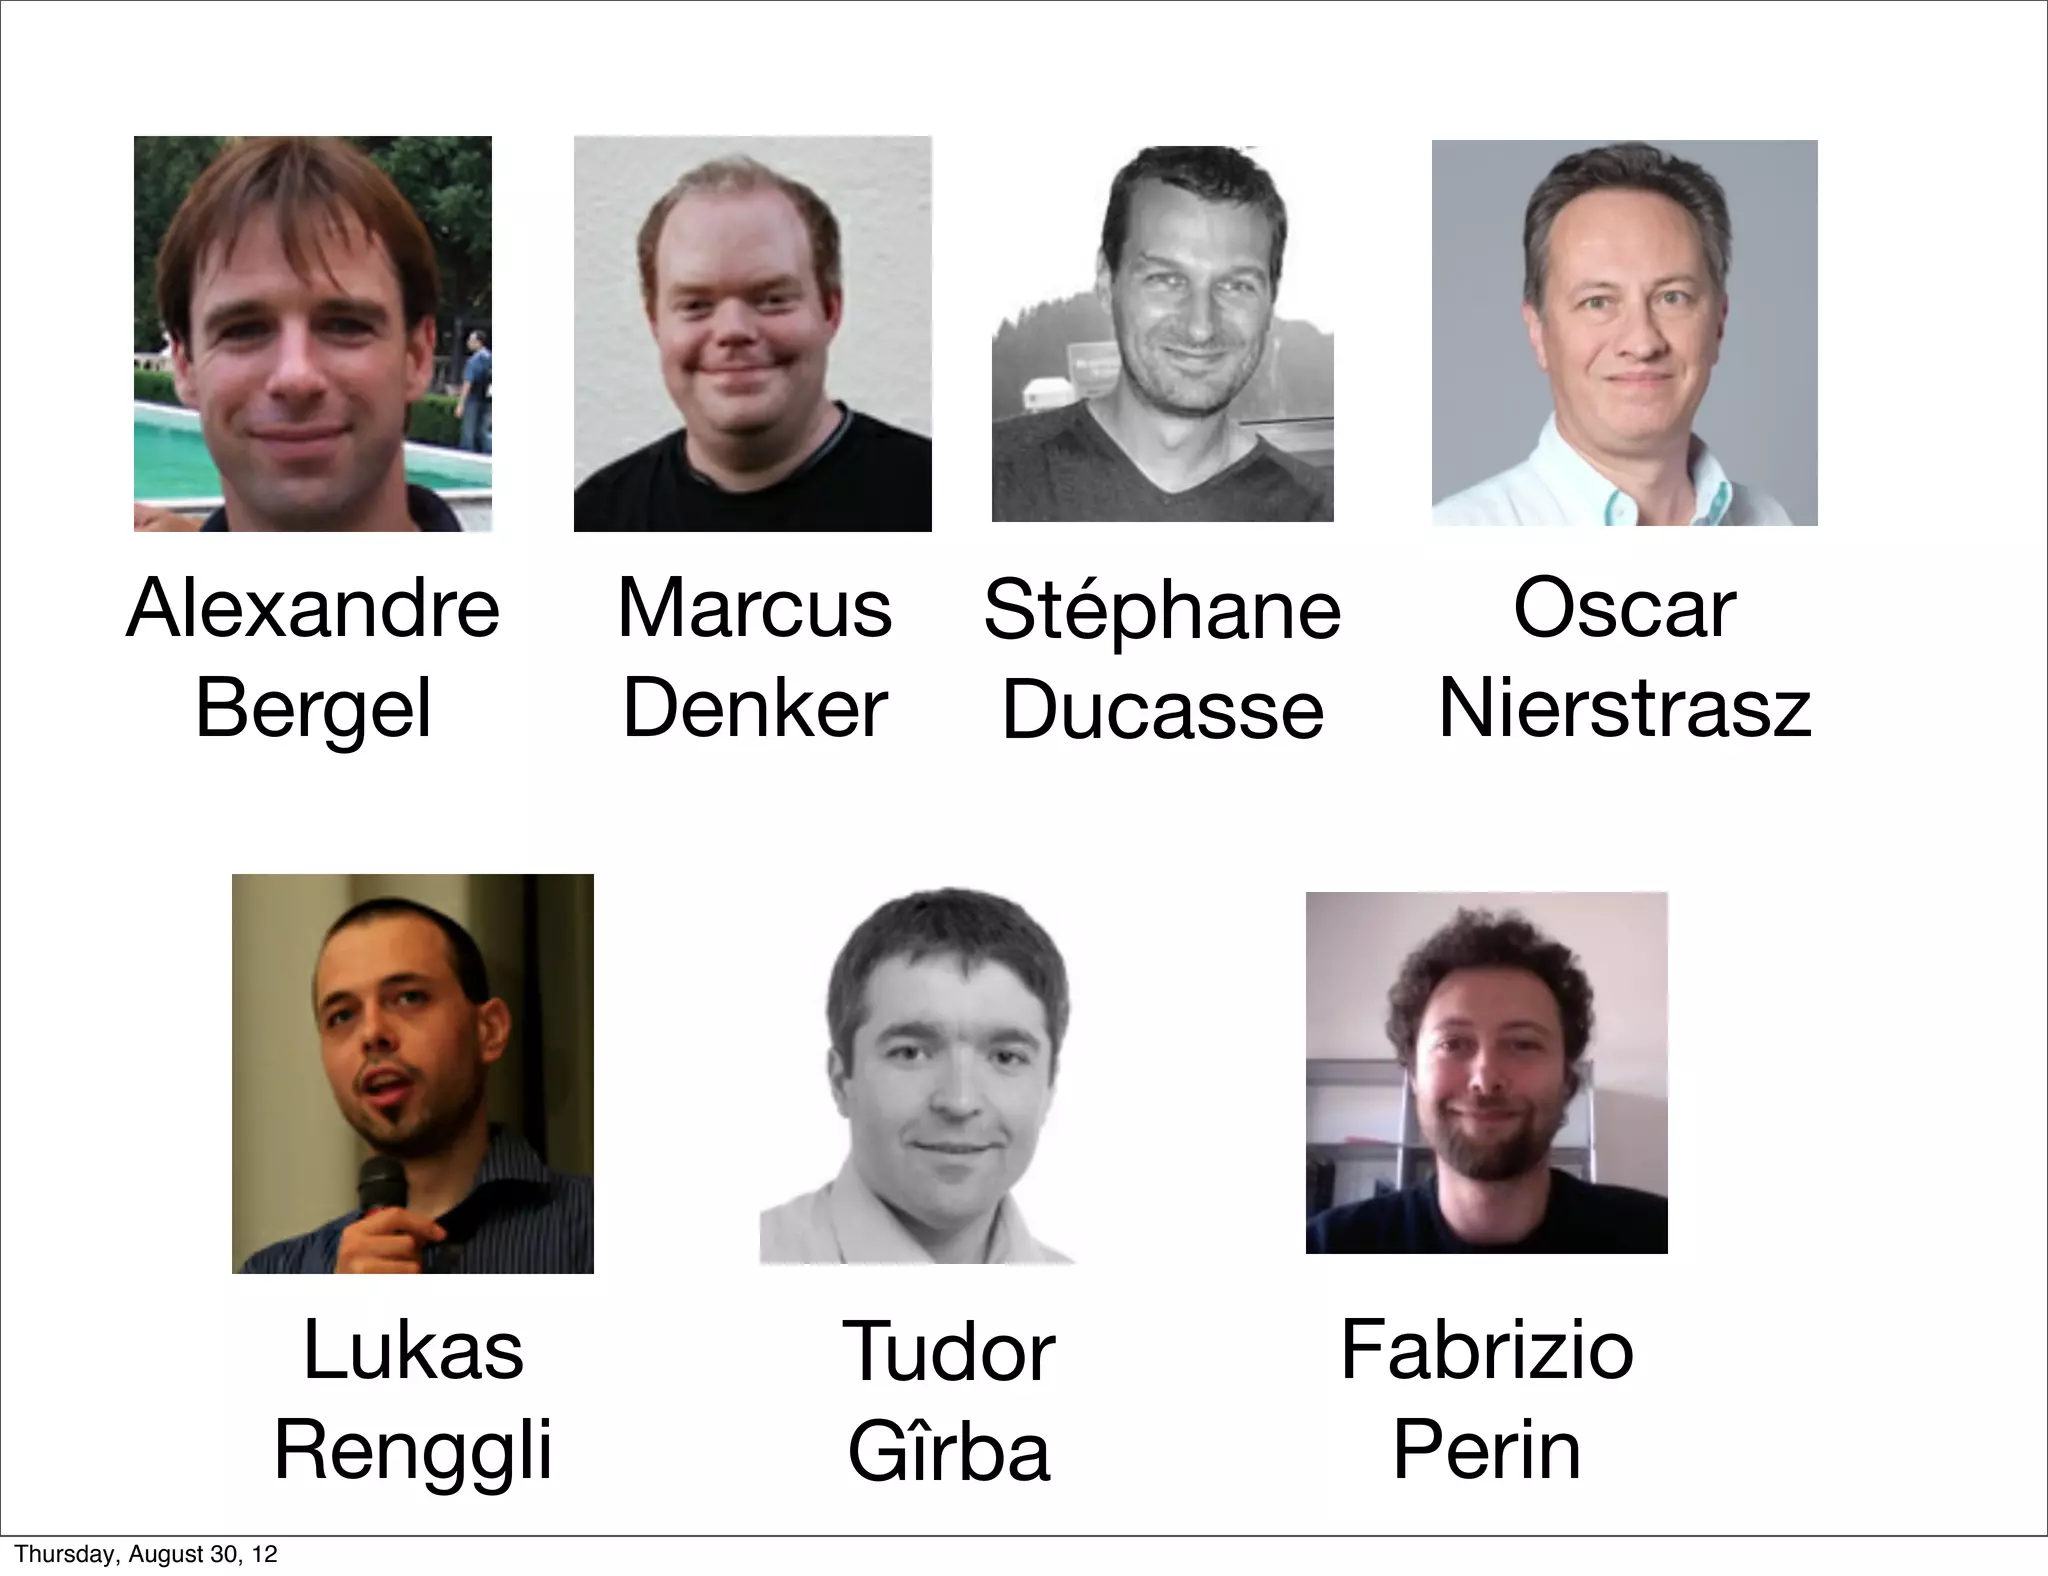
Alexandre              Marcus   Stéphane     Oscar
           Bergel               Denker   Ducasse    Nierstrasz


                       Lukas        Tudor       Fabrizio
                      Renggli       Gîrba        Perin
Thursday, August 30, 12
scg.unibe.ch/research/bifrost


Thursday, August 30, 12

Object Centric Reflection

  • 1.
    Object-Centric Reflection Jorge Ressia Software Composition Group Thursday, August 30, 12
  • 2.
  • 3.
    Profiling: Is the activity of analyzing a program execution. Thursday, August 30, 12
  • 4.
    Domain-Sp CPU time profiling Mondrian [9] is an open and agile visualization engine. visualization using a graph of (possibly nested) nodes an Profile a serious performance issue was raised1 . Tracking down performance was not trivial. We first used a standard sam Execution sampling approximates the time spent in an by periodically stopping a program and recording the cu under executions. Such a profiling technique is relatively little impact on the overall execution. This sampling techn all mainstream profilers, such as JProfiler, YourKit, xprof MessageTally, the standard sampling-based profiler in P tually describes the execution in terms of CPU consumpt each method of Mondrian: 54.8% {11501ms} MOCanvas>>drawOn: 54.8% {11501ms} MORoot(MONode)>>displayOn: 30.9% {6485ms} MONode>>displayOn: { { | 18.1% {3799ms} MOEdge>>displayOn: { { ... } | 8.4% {1763ms} MOEdge>>displayOn: } } | | 8.0% {1679ms} MOStraightLineShape>>display:on: | | 2.6% {546ms} FormCanvas>>line:to:width:color: } { } ... 23.4% {4911ms} MOEdge>>displayOn: ... We can observe that the virtual machine spent abou the method displayOn: defined in the class MORoot. A ro nested node that contains all the nodes of the edges of t general profiling information says that rendering nodes a great share of the CPU time, but it does not help in pin and edges are responsible for the time spent. Not all grap consume resources. Traditional execution sampling profilers center their r the execution stack and completely ignore the identity of th the method call and its arguments. As a consequence, it which objects cause the slowdown. For the example above, says that we spent 30.9% in MONode>>displayOn: withou were actually refreshed too often. Coverage PetitParser is a parsing framework combining ideas from parser combinators, parsing expression grammars and pac grammars and parsers as objects that can be reconfigured Thursday, August 30, 12 1 http://forum.world.st/Mondrian-is-slow-next-step-tc
  • 5.
    CPU time profiling Mondrian [9] is an open and agile visualization engine. Profile visualization using a graph of (possibly nested) nodes an a serious performance issue was raised1 . Tracking down performance was not trivial. We first used a standard sam Execution sampling approximates the time spent in an by periodically stopping a program and recording the cu under executions. Such a profiling technique is relatively little impact on the overall execution. This sampling techn all mainstream profilers, such as JProfiler, YourKit, xprof MessageTally, the standard sampling-based profiler in P tually describes the execution in terms of CPU consumpt each method of Mondrian: 54.8% {11501ms} MOCanvas>>drawOn: 54.8% {11501ms} MORoot(MONode)>>displayOn: { { 30.9% {6485ms} MONode>>displayOn: { { | 18.1% {3799ms} MOEdge>>displayOn: } ... } } | 8.4% {1763ms} MOEdge>>displayOn: | | 8.0% {1679ms} MOStraightLineShape>>display:on: } { } | | 2.6% {546ms} FormCanvas>>line:to:width:color: ... 23.4% {4911ms} MOEdge>>displayOn: ... We can observe that the virtual machine spent abou the method displayOn: defined in the class MORoot. A ro nested node that contains all the nodes of the edges of t general profiling information says that rendering nodes a great share of the CPU time, but it does not help in pin and edges are responsible for the time spent. Not all grap consume resources. Traditional execution sampling profilers center their r the execution stack and completely ignore the identity of th the method call and its arguments. As a consequence, it which objects cause the slowdown. For the example above, says that we spent 30.9% in MONode>>displayOn: withou were actually refreshed too often. Domain Coverage PetitParser is a parsing framework combining ideas from parser combinators, parsing expression grammars and pac grammars and parsers as objects that can be reconfigured 1 http://forum.world.st/Mondrian-is-slow-next-step-tc a2261116 2 http://www.pharo-project.org/ Thursday, August 30, 12
  • 6.
  • 7.
  • 8.
    C omp lexity stemand Ducasse 2003 Sy zaLan Thursday, August 30, 12
  • 9.
    little impact onthe overall execution. This sampling technique is u all mainstream profilers, such as JProfiler, YourKit, xprof [10], an MessageTally, the standard sampling-based profiler in Pharo Sm tually describes the execution in terms of CPU consumption and i each method of Mondrian: 54.8% {11501ms} MOCanvas>>drawOn: 54.8% {11501ms} MORoot(MONode)>>displayOn: 30.9% {6485ms} MONode>>displayOn: | 18.1% {3799ms} MOEdge>>displayOn: ... | 8.4% {1763ms} MOEdge>>displayOn: | | 8.0% {1679ms} MOStraightLineShape>>display:on: | | 2.6% {546ms} FormCanvas>>line:to:width:color: ... 23.4% {4911ms} MOEdge>>displayOn: ... We can observe that the virtual machine spent about 54% o the method displayOn: defined in the class MORoot. A root is the nested node that contains all the nodes of the edges of the visua general profiling information says that rendering nodes and edge great share of the CPU time, but it does not help in pinpointing Thursday, August 30, 12
  • 10.
    Domain-Specific Profiling 3 CPU time profiling Which is the relationship? Mondrian [9] is an open and agile visualization engine. Mondrian describes a visualization using a graph of (possibly nested) nodes and edges. In June 2010 a serious performance issue was raised1 . Tracking down the cause of the poor performance was not trivial. We first used a standard sample-based profiler. Execution sampling approximates the time spent in an application’s methods by periodically stopping a program and recording the current set of methods under executions. Such a profiling technique is relatively accurate since it has little impact on the overall execution. This sampling technique is used by almost all mainstream profilers, such as JProfiler, YourKit, xprof [10], and hprof. MessageTally, the standard sampling-based profiler in Pharo Smalltalk2 , tex- tually describes the execution in terms of CPU consumption and invocation for each method of Mondrian: 54.8% {11501ms} MOCanvas>>drawOn: 54.8% {11501ms} MORoot(MONode)>>displayOn: 30.9% {6485ms} MONode>>displayOn: ? | 18.1% {3799ms} MOEdge>>displayOn: ... | 8.4% {1763ms} MOEdge>>displayOn: | | 8.0% {1679ms} MOStraightLineShape>>display:on: | | 2.6% {546ms} FormCanvas>>line:to:width:color: ... 23.4% {4911ms} MOEdge>>displayOn: ... We can observe that the virtual machine spent about 54% of its time in the method displayOn: defined in the class MORoot. A root is the unique non- nested node that contains all the nodes of the edges of the visualization. This general profiling information says that rendering nodes and edges consumes a great share of the CPU time, but it does not help in pinpointing which nodes and edges are responsible for the time spent. Not all graphical elements equally consume resources. Traditional execution sampling profilers center their result on the frames of the execution stack and completely ignore the identity of the object that received the method call and its arguments. As a consequence, it is hard to track down which objects cause the slowdown. For the example above, the traditional profiler says that we spent 30.9% in MONode>>displayOn: without saying which nodes were actually refreshed too often. Coverage PetitParser is a parsing framework combining ideas from scannerless parsing, parser combinators, parsing expression grammars and packrat parsers to model Thursday, August 30, 12 grammars and parsers as objects that can be reconfigured dynamically [11].
  • 11.
  • 12.
    Debugging: Is the process of interacting with a running software system to test and understand its current behavior. Thursday, August 30, 12
  • 13.
  • 14.
  • 15.
    C omp lexity stemand Ducasse 2003 Sy zaLan Thursday, August 30, 12
  • 16.
  • 17.
  • 18.
  • 19.
  • 20.
    How do wedebug this? Thursday, August 30, 12
  • 21.
  • 22.
    Conditional Breakpoints Thursday, August 30, 12
  • 23.
    { { { { } } } } { } Thursday, August 30, 12
  • 24.
    { { { { } } } } { } Thursday, August 30, 12
  • 25.
  • 26.
    When during theexecution is this method called? (Q.13) Where are instances of this class created? (Q.14) Where is this variable or data structure being accessed? (Q.15) What are the values of the argument at runtime? (Q.19) What data is being modified in this code? (Q.20) How are these types or objects related? (Q.22) How can data be passed to (or accessed at) this point in the code? (Q.28) What parts of this data structure are accessed in this code? (Q.33) Thursday, August 30, 12
  • 27.
    When during theexecution is this method called? (Q.13) Where are instances of this class created? (Q.14) Where is this variable or data structure being accessed? (Q.15) What are the values of the argument at runtime? (Q.19) What data is being modified in this code? (Q.20) How are these types or objects related? (Q.22) How can data be passed to (or accessed at) this point in the code? (Q.28) What parts of this data structure are accessed in this code? (Q.33) llito Si etal. g softwar e ask durin gr ammers s. 2008 Questi ons pro ution task evol Thursday, August 30, 12
  • 28.
    Which is therelationship? When during the execution is this method called? (Q.13) ? Where are instances of this class created? (Q.14) Where is this variable or data structure being accessed? (Q.15) What are the values of the argument at runtime? (Q.19) What data is being modified in this code? (Q.20) How are these types or objects related? (Q.22) How can data be passed to (or accessed at) this point in the code? (Q.28) What parts of this data structure are accessed in this code? (Q.33) Thursday, August 30, 12
  • 29.
    What is the problem? Thursday, August 30, 12
  • 30.
    Traditional Reflection Thursday, August 30, 12
  • 31.
    visualization using agraph of (possibly nested) nodes and edges. In June 2010 a serious performance issue was raised1 . Tracking down the cause of the poor performance was not trivial. We first used a standard sample-based profiler. Execution sampling approximates the time spent in an application’s methods by periodically stopping a program and recording the current set of methods Profiling under executions. Such a profiling technique is relatively accurate since it has little impact on the overall execution. This sampling technique is used by almost all mainstream profilers, such as JProfiler, YourKit, xprof [10], and hprof. MessageTally, the standard sampling-based profiler in Pharo Smalltalk2 , tex- tually describes the execution in terms of CPU consumption and invocation for each method of Mondrian: 54.8% {11501ms} MOCanvas>>drawOn: 54.8% {11501ms} MORoot(MONode)>>displayOn: 30.9% {6485ms} MONode>>displayOn: ? | 18.1% {3799ms} MOEdge>>displayOn: ... | 8.4% {1763ms} MOEdge>>displayOn: | | 8.0% {1679ms} MOStraightLineShape>>display:on: | | 2.6% {546ms} FormCanvas>>line:to:width:color: ... 23.4% {4911ms} MOEdge>>displayOn: ... We can observe that the virtual machine spent about 54% of its time in the method displayOn: defined in the class MORoot. A root is the unique non- nested node that contains all the nodes of the edges of the visualization. This general profiling information says that rendering nodes and edges consumes a great share of the CPU time, but it does not help in pinpointing which nodes and edges are responsible for the time spent. Not all graphical elements equally consume resources. Traditional execution sampling profilers center their result on the frames of the execution stack and completely ignore the identity of the object that received the method call and its arguments. As a consequence, it is hard to track down which objects cause the slowdown. For the example above, the traditional profiler says that we spent 30.9% in MONode>>displayOn: without saying which nodes were actually refreshed too often. Coverage PetitParser is Thursday, August 30, 12 a parsing framework combining ideas from scannerless parsing,
  • 32.
    Debugging When during the execution is this method called? (Q.13) ? Where are instances of this class created? (Q.14) Where is this variable or data structure being accessed? (Q.15) What are the values of the argument at runtime? (Q.19) What data is being modified in this code? (Q.20) How are these types or objects related? (Q.22) How can data be passed to (or accessed at) this point in the code? (Q.28) What parts of this data structure are accessed in this code? (Q.33) Thursday, August 30, 12
  • 33.
  • 34.
    Object-Centric Reflection Thursday, August 30, 12
  • 35.
  • 36.
    Organize the Meta-level Thursday, August 30, 12
  • 37.
    Explicit Meta-objects Thursday, August 30, 12
  • 38.
    Class Meta-object Object Thursday, August 30, 12
  • 39.
    Class Meta-object Object Thursday, August 30, 12
  • 40.
    Class Meta-object Evolved Object Thursday, August 30, 12
  • 41.
    Debugging Profiling Execution Structure Reification Evolution Thursday, August 30, 12
  • 42.
    Debugging Profiling Execution Structure Reification Evolution Thursday, August 30, 12
  • 43.
    Object-Centric Debugging Thursday, August 30, 12
  • 44.
    Object-Centric Debugging 2 201Nierstrasz ICSE . rgel and O J. Ressi a, A, Be Thursday, August 30, 12
  • 45.
    { { { { } } } } { } Thursday, August 30, 12
  • 46.
    { { { { } } } } { } Thursday, August 30, 12
  • 47.
    { { { { } } } } { } Thursday, August 30, 12
  • 48.
  • 49.
  • 50.
  • 51.
    stack-centric debugging InstructionStream class>>on: InstructionStream class>>new InstructionStream>>initialize step into, CompiledMethod>>initialPC step over, InstructionStream>>method:pc: resume InstructionStream>>nextInstruction MessageCatcher class>>new InstructionStream>>interpretNextInstructionFor: ... object-centric debugging centered on centered on the InstructionStream class the InstructionStream object initialize on: next message, next message, method:pc: new next change nextInstruction ... next change interpretNextInstructionFor: ... Thursday, August 30, 12
  • 52.
  • 53.
  • 54.
  • 55.
  • 56.
    halt on objectin call Thursday, August 30, 12
  • 57.
    Halt on nextmessage Halt on next message/s named Halt on state change Halt on state change named Halt on next inherited message Halt on next overloaded message Halt on object/s in call Halt on next message from package Thursday, August 30, 12
  • 58.
    Debugging Profiling Execution Structure Reification Evolution Thursday, August 30, 12
  • 59.
  • 60.
    MetaSpy OLS 2011 TO Ber gel etal. Thursday, August 30, 12
  • 61.
  • 62.
  • 63.
    C omp lexity stema, Ducasse 2003 Sy anz L Thursday, August 30, 12
  • 64.
  • 65.
    Debugging Profiling Execution Structure Reification Evolution Thursday, August 30, 12
  • 66.
    What if wedo not know what to evolve? Thursday, August 30, 12
  • 67.
  • 68.
  • 69.
  • 70.
  • 71.
  • 72.
  • 73.
  • 74.
  • 75.
    Back in time Debugger Thursday, August 30, 12
  • 76.
    Back in time Debugger Debu gger w Floal. ECOOP 2008 O b ject nhard e t Lie Thursday, August 30, 12
  • 77.
    name value init@t1 null predecessor name value :Person field-write@t2 'Doe' predecessor name value field-write@t3 'Smith' person := Person new t1 ... name := 'Doe' t2 ... name := 'Smith' t3 Thursday, August 30, 12
  • 78.
    Debugging Profiling Execution Structure Reification Evolution Thursday, August 30, 12
  • 79.
    Talents scg.unibe.ch/research/talents Thursday, August 30, 12
  • 80.
    Talents ST 2 011F. Perin and IW ie rstrasz, îr ba, O. N gli J. Re ssia, T. G L. Reng scg.unibe.ch/research/talents Thursday, August 30, 12
  • 81.
    Dynamically composable units of reuse Thursday, August 30, 12
  • 82.
  • 83.
  • 84.
    Object- Centric Prisma Debugger Subjectopia MetaSpy Talents Chameleon Thursday, August 30, 12
  • 85.
  • 86.
    Alexandre Marcus Stéphane Oscar Bergel Denker Ducasse Nierstrasz Lukas Tudor Fabrizio Renggli Gîrba Perin Thursday, August 30, 12
  • 87.