Download to read offline
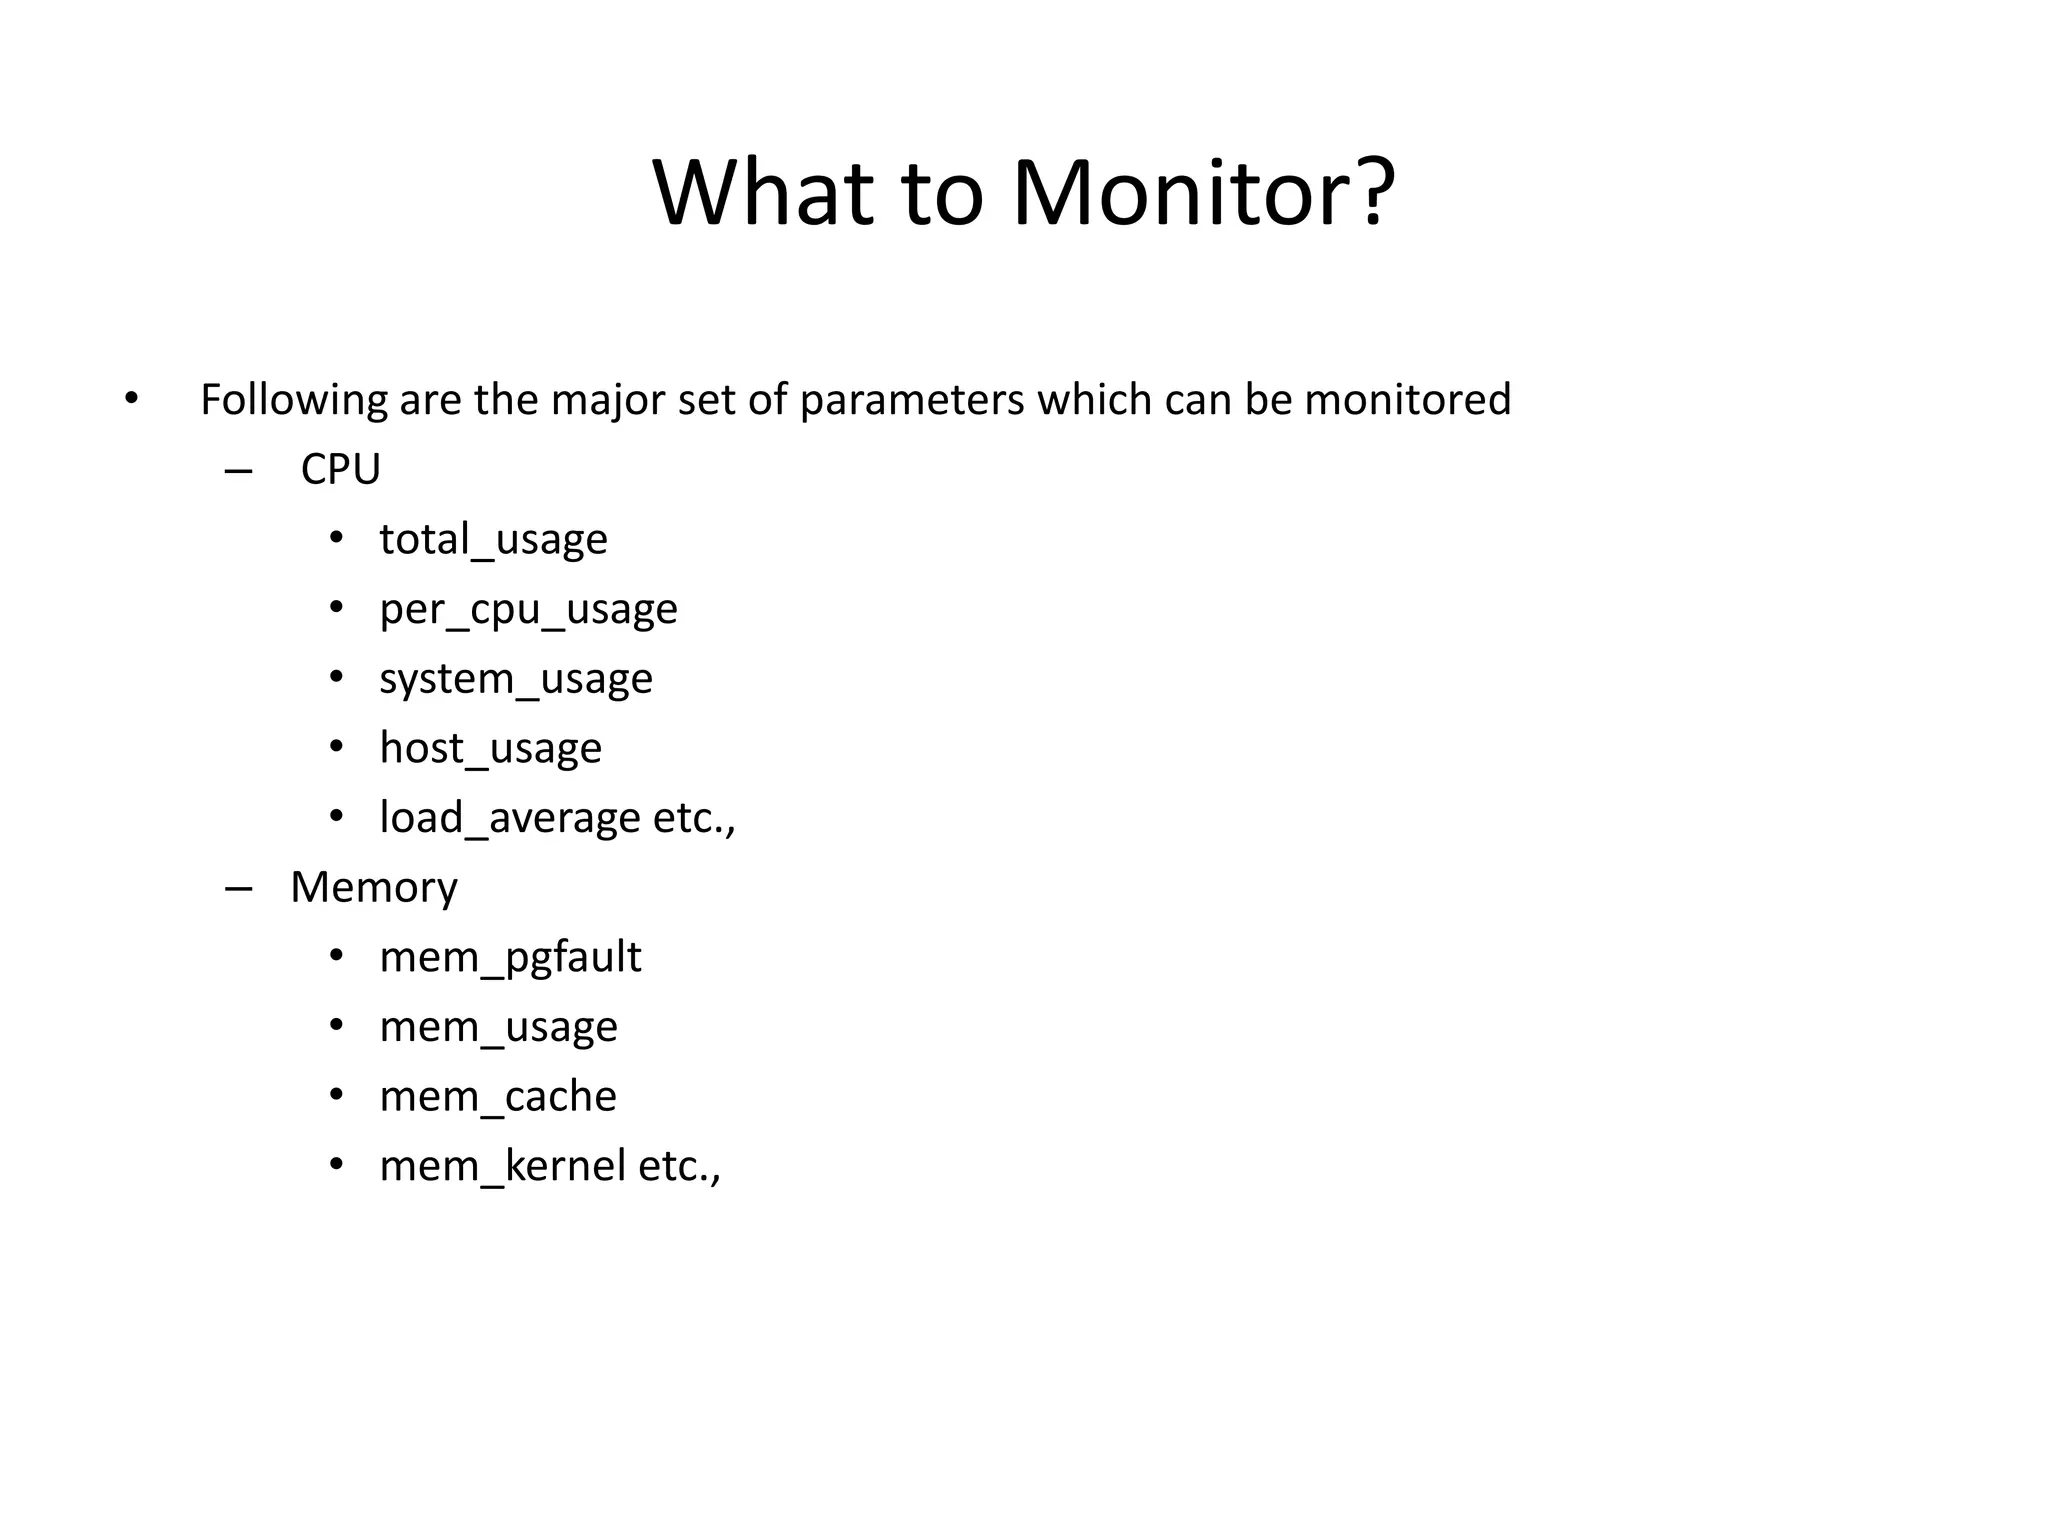
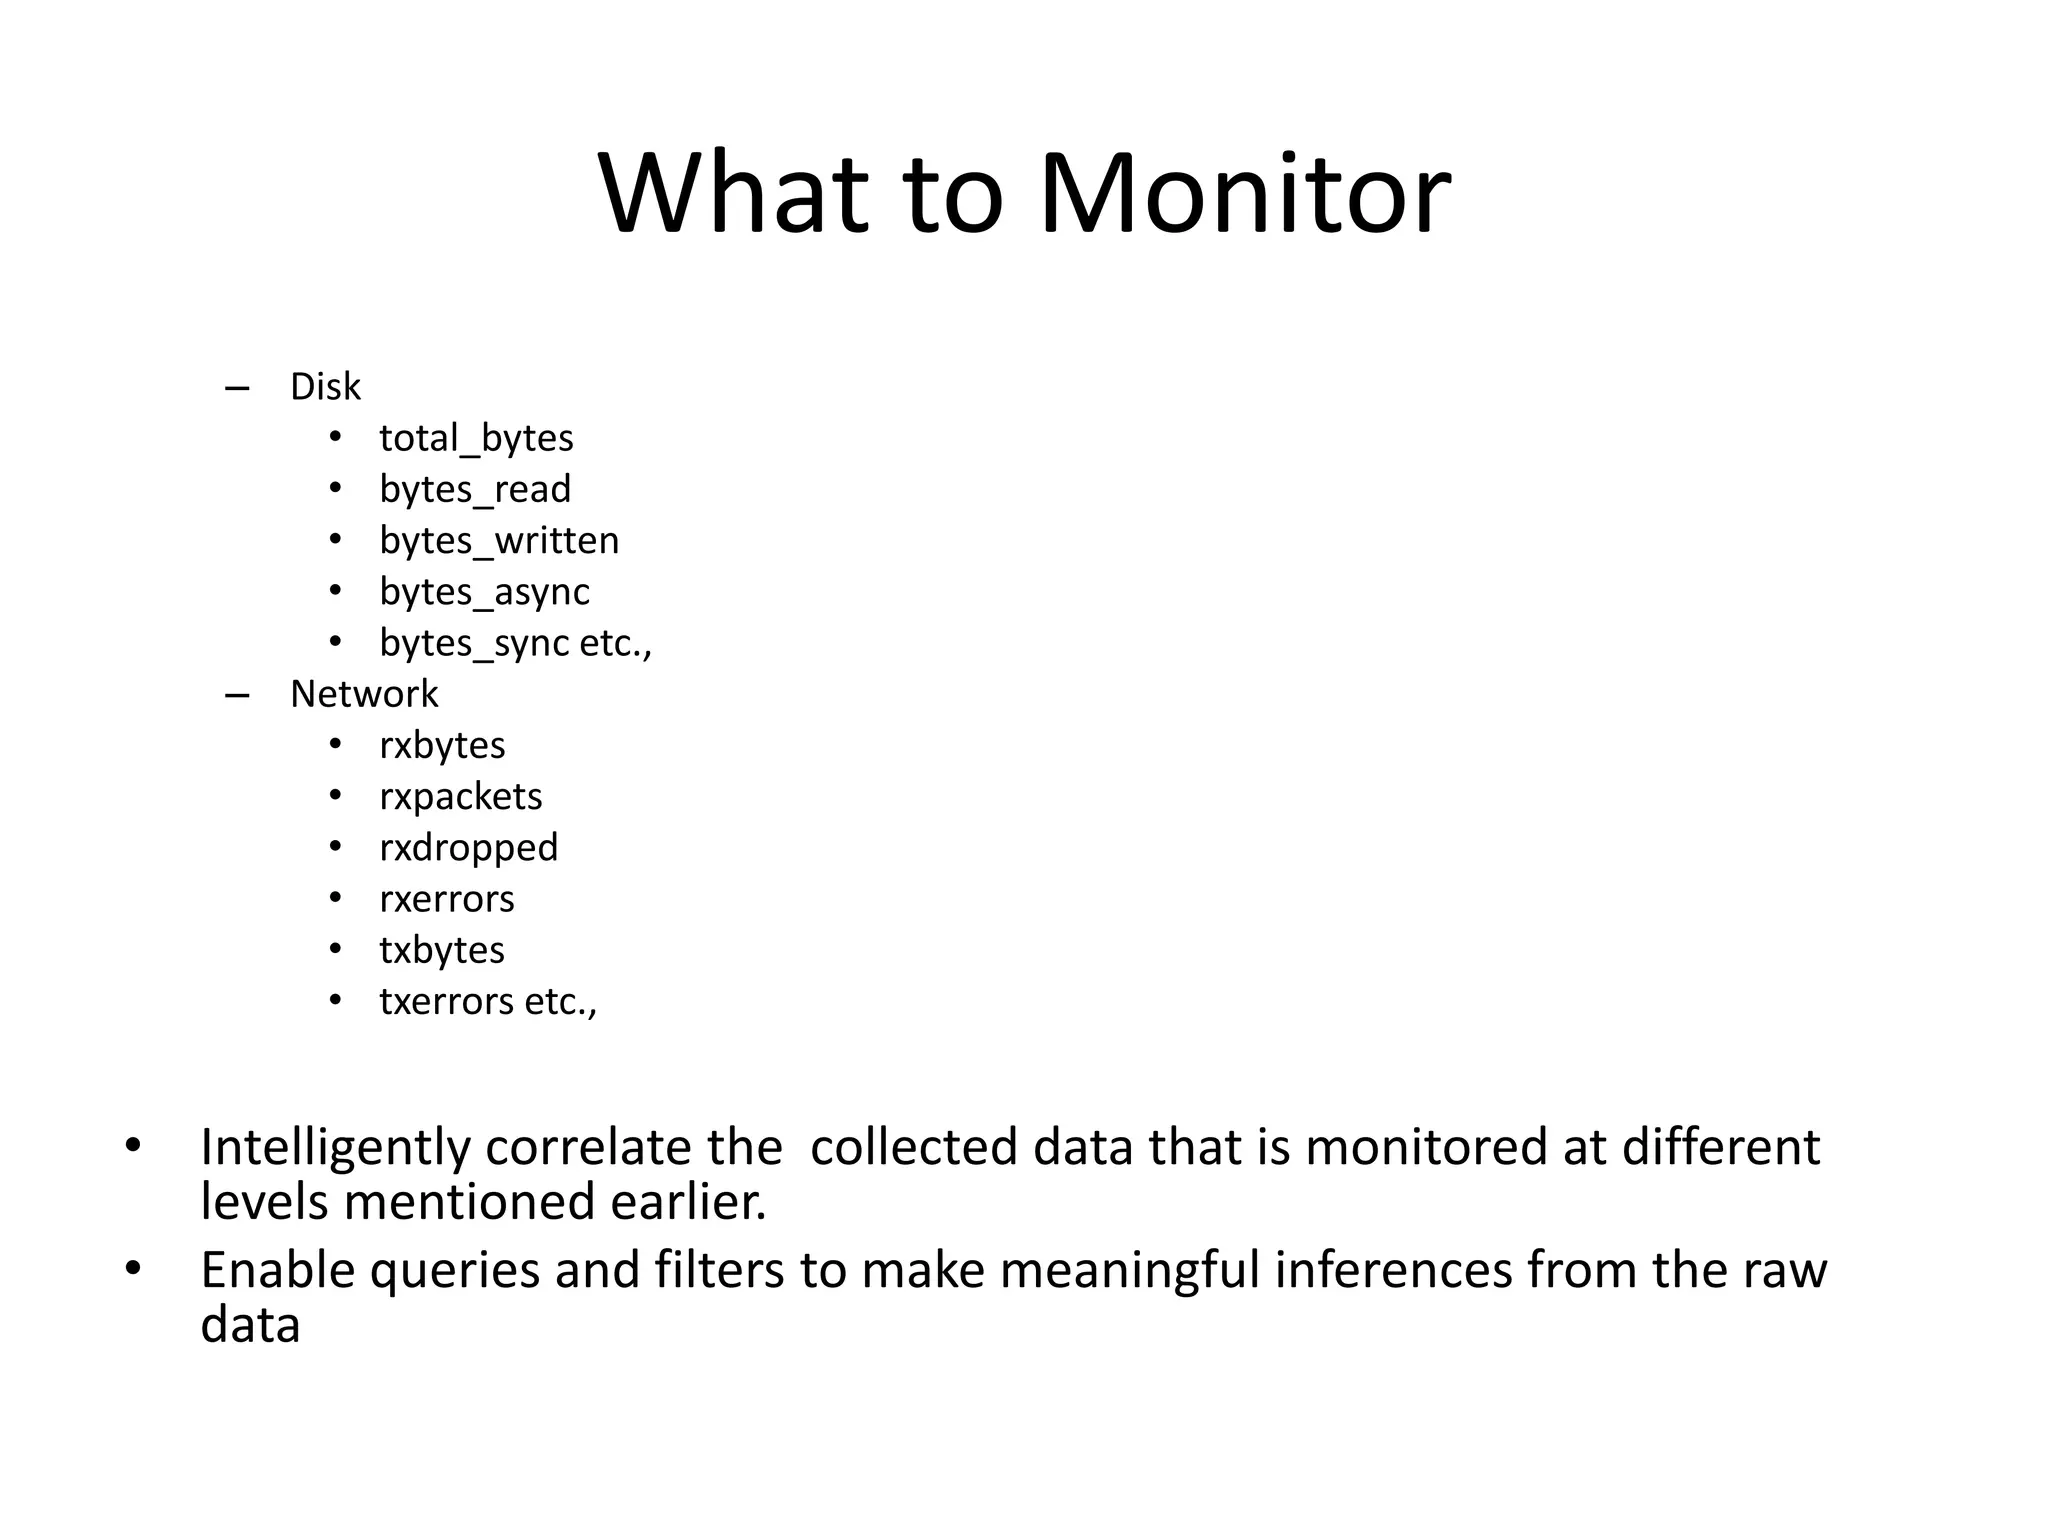
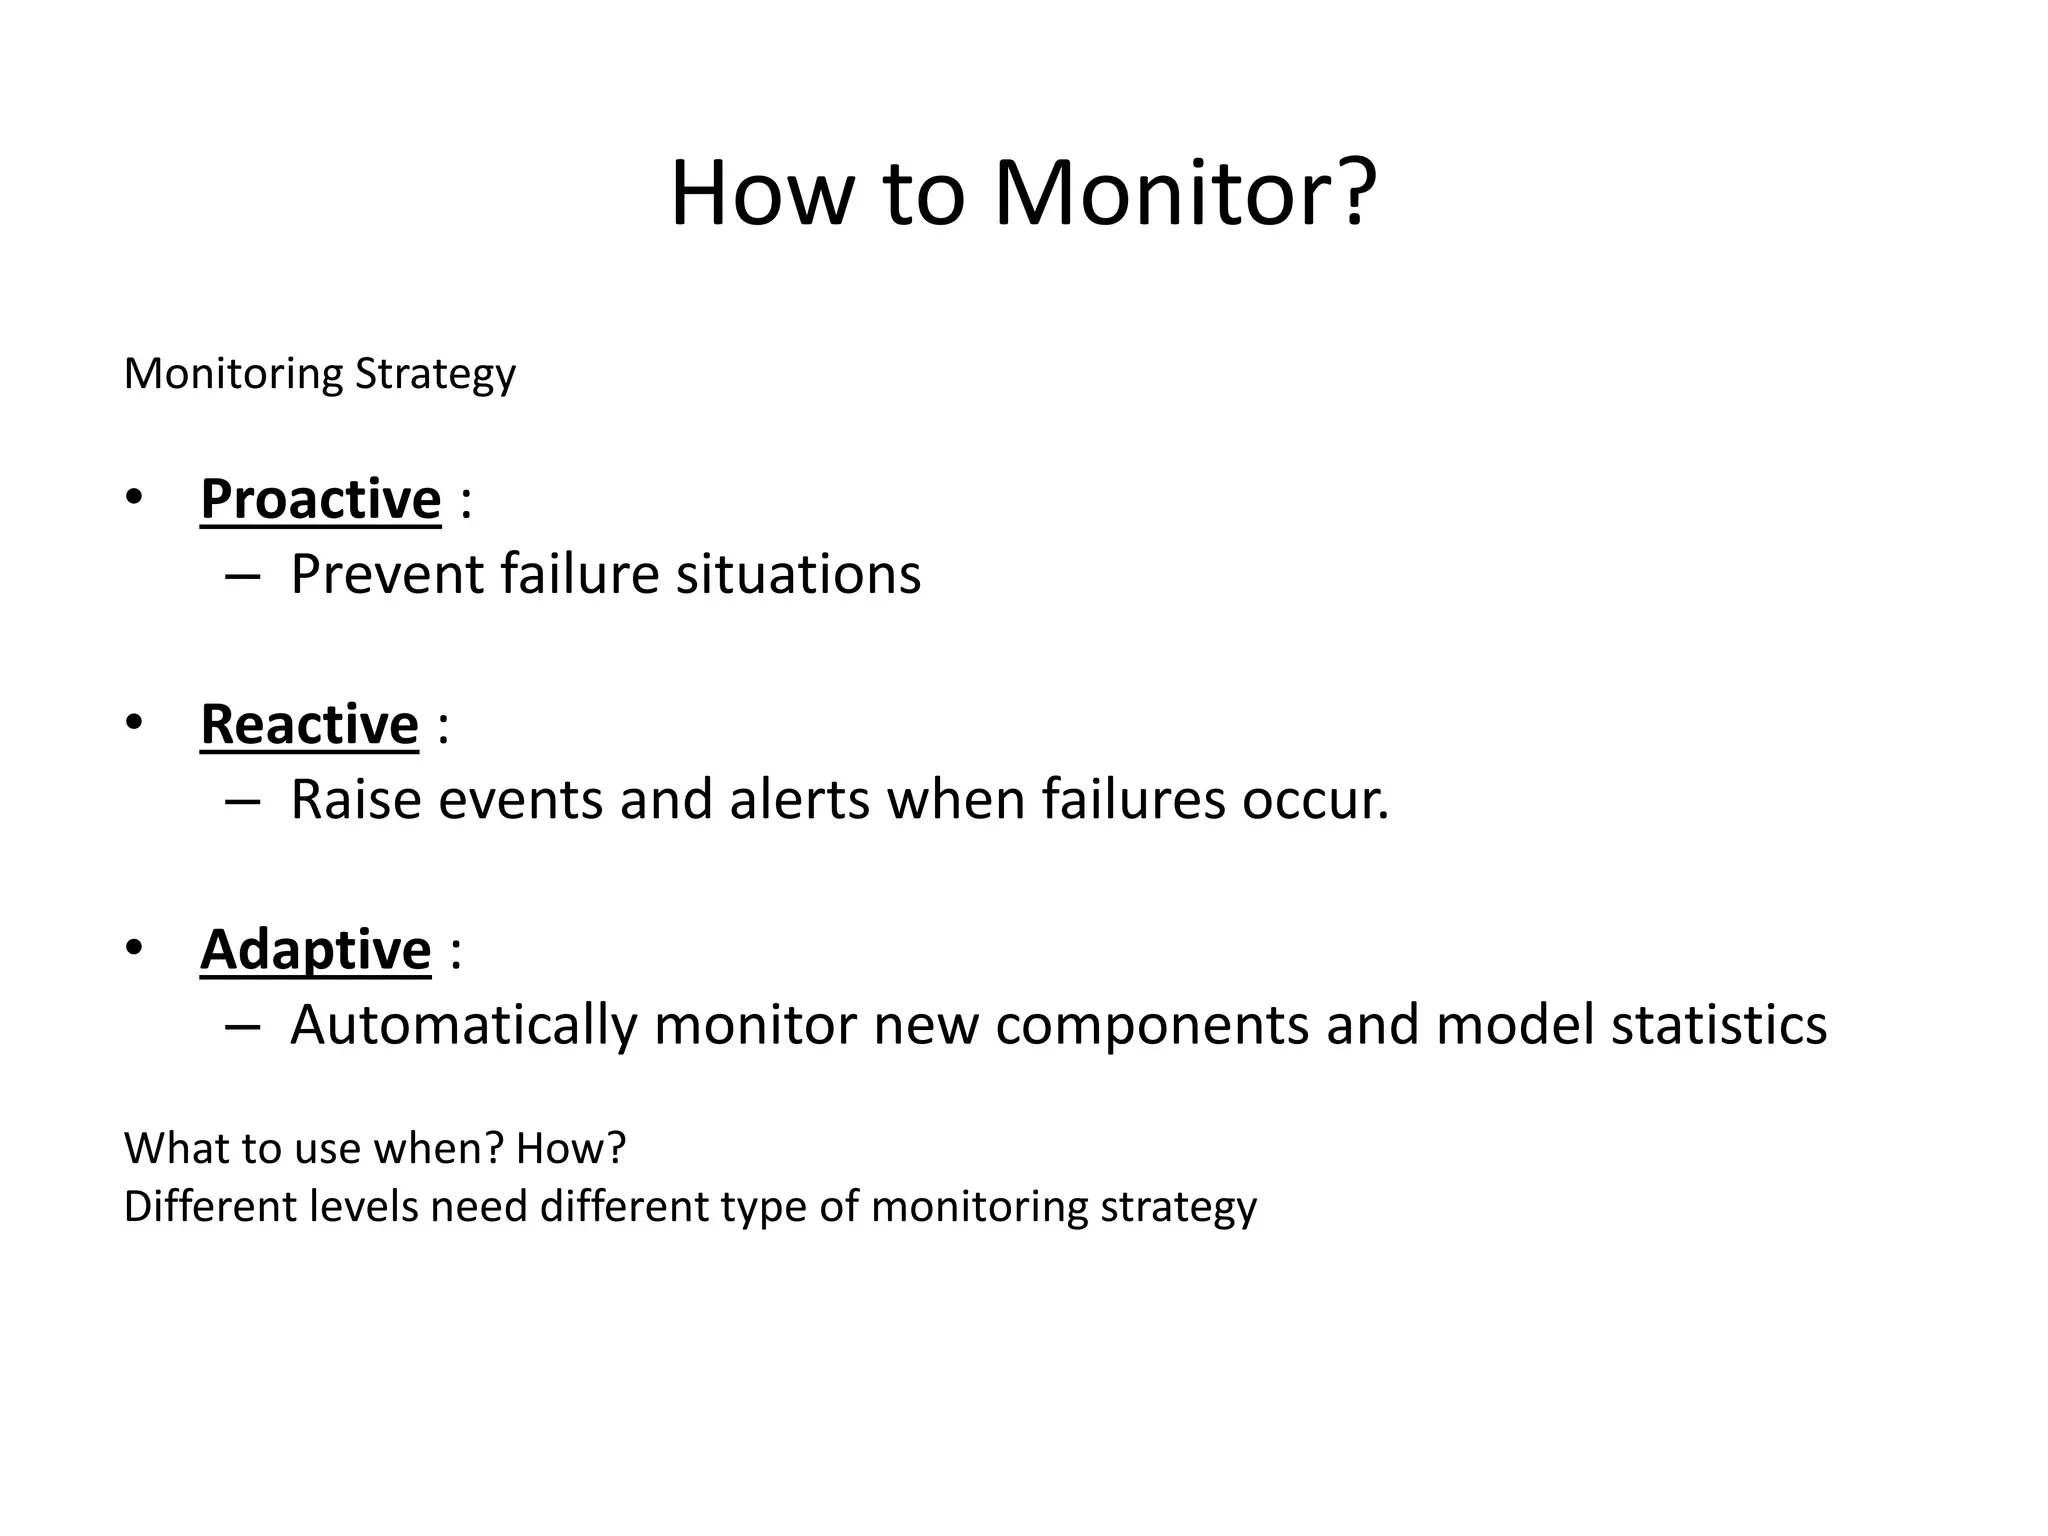
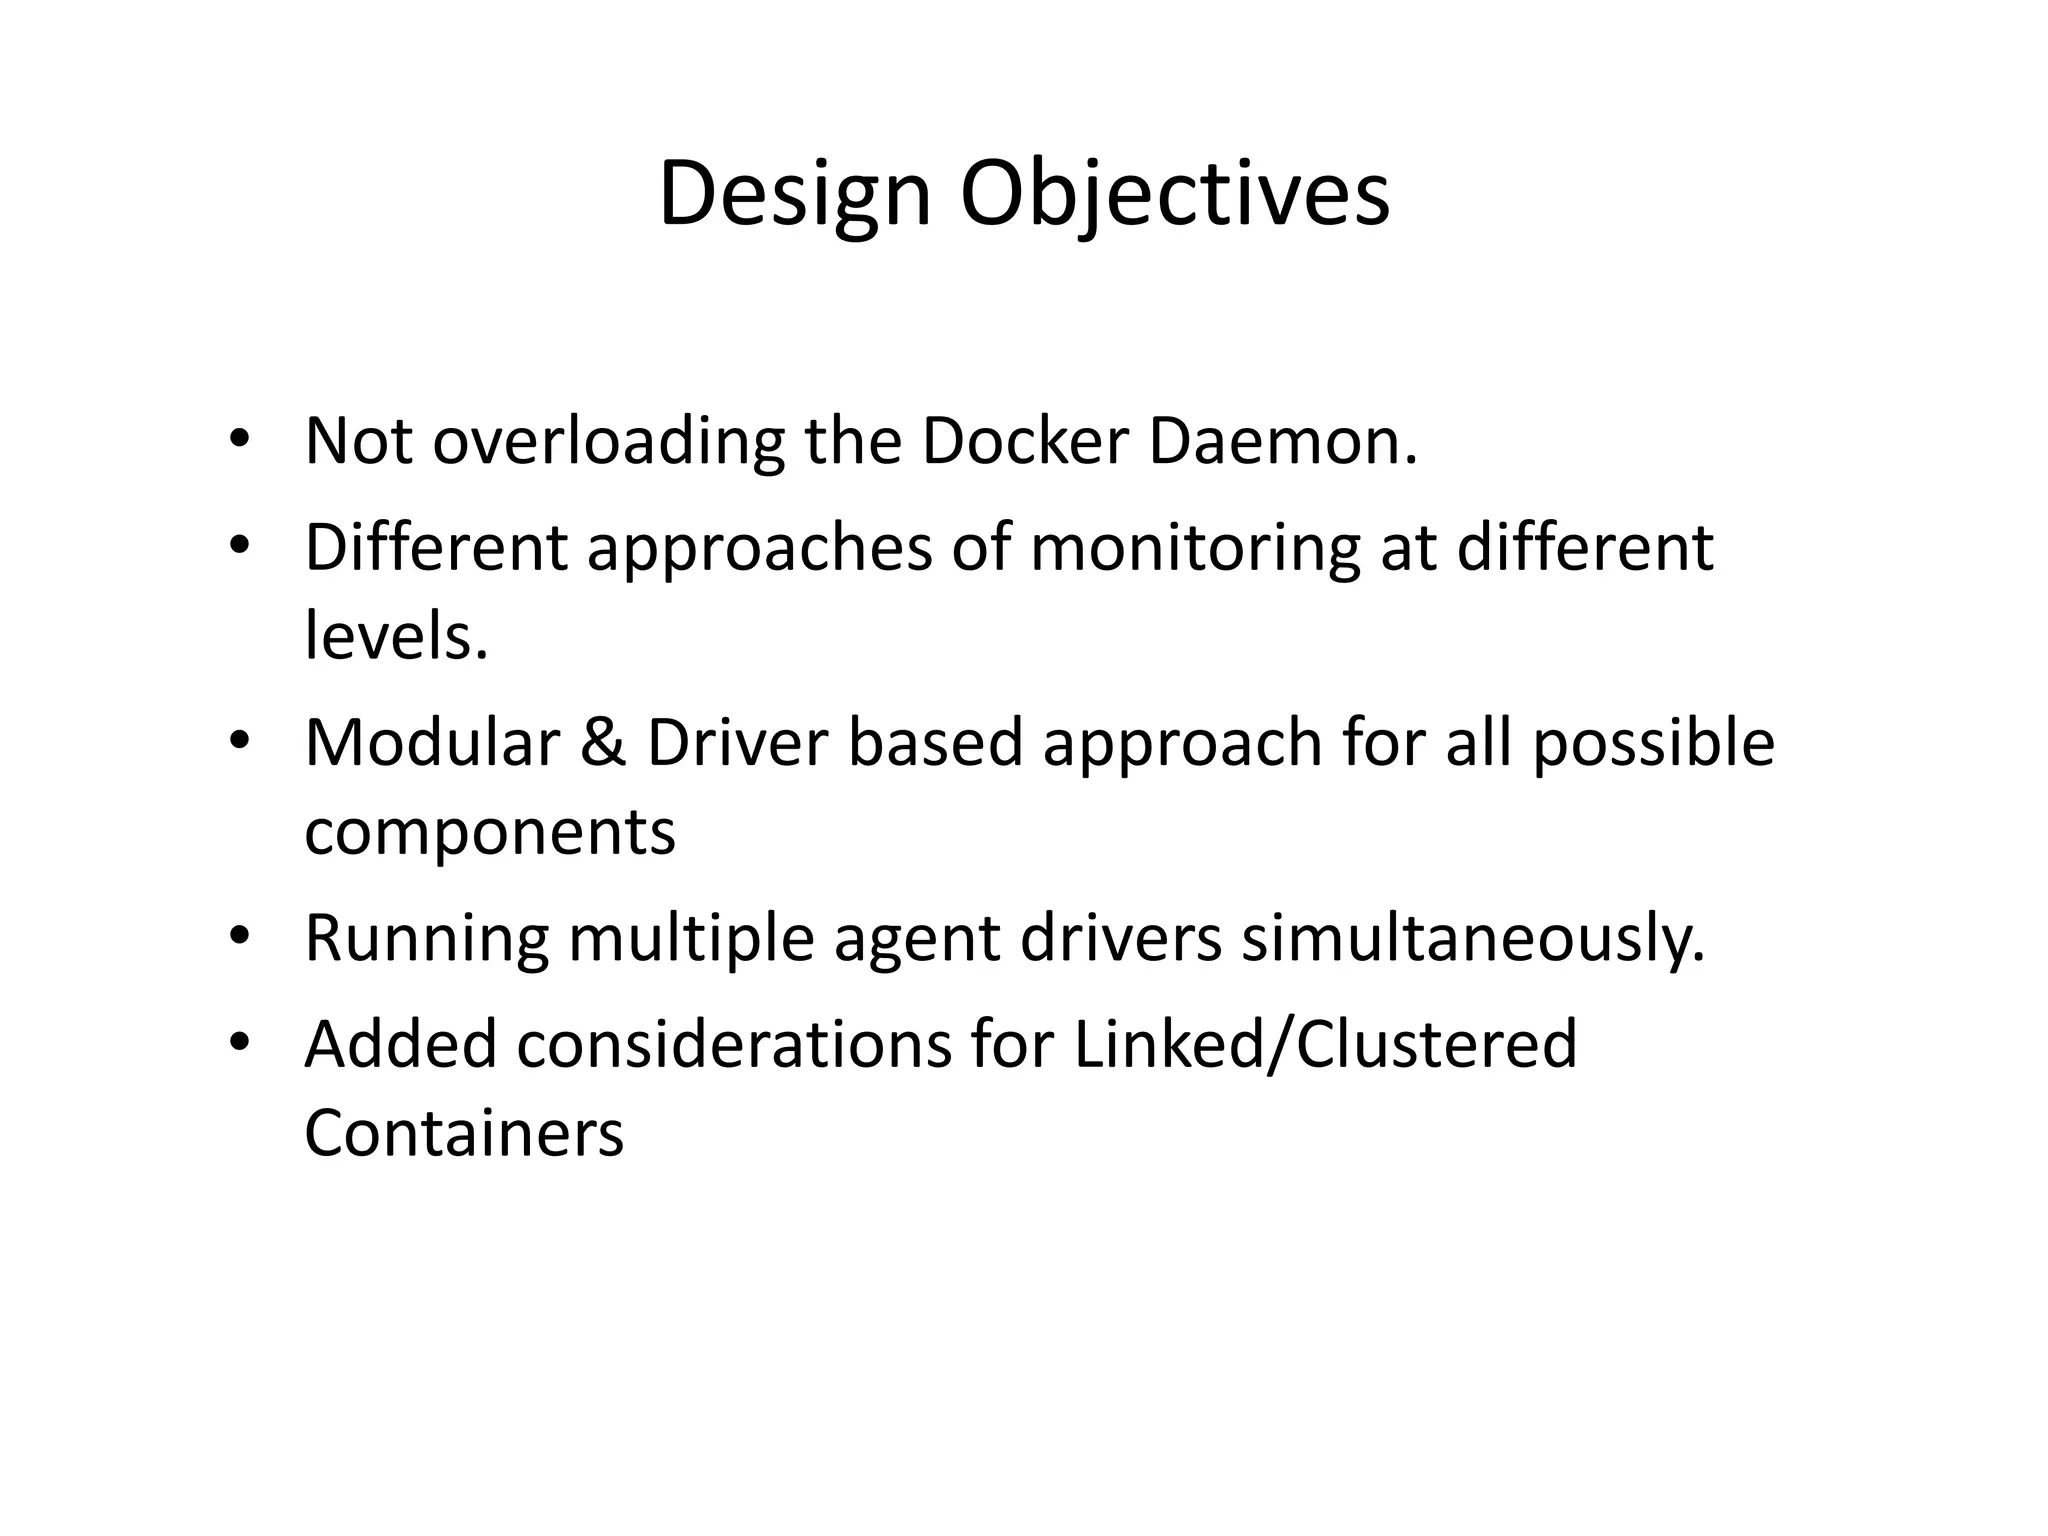
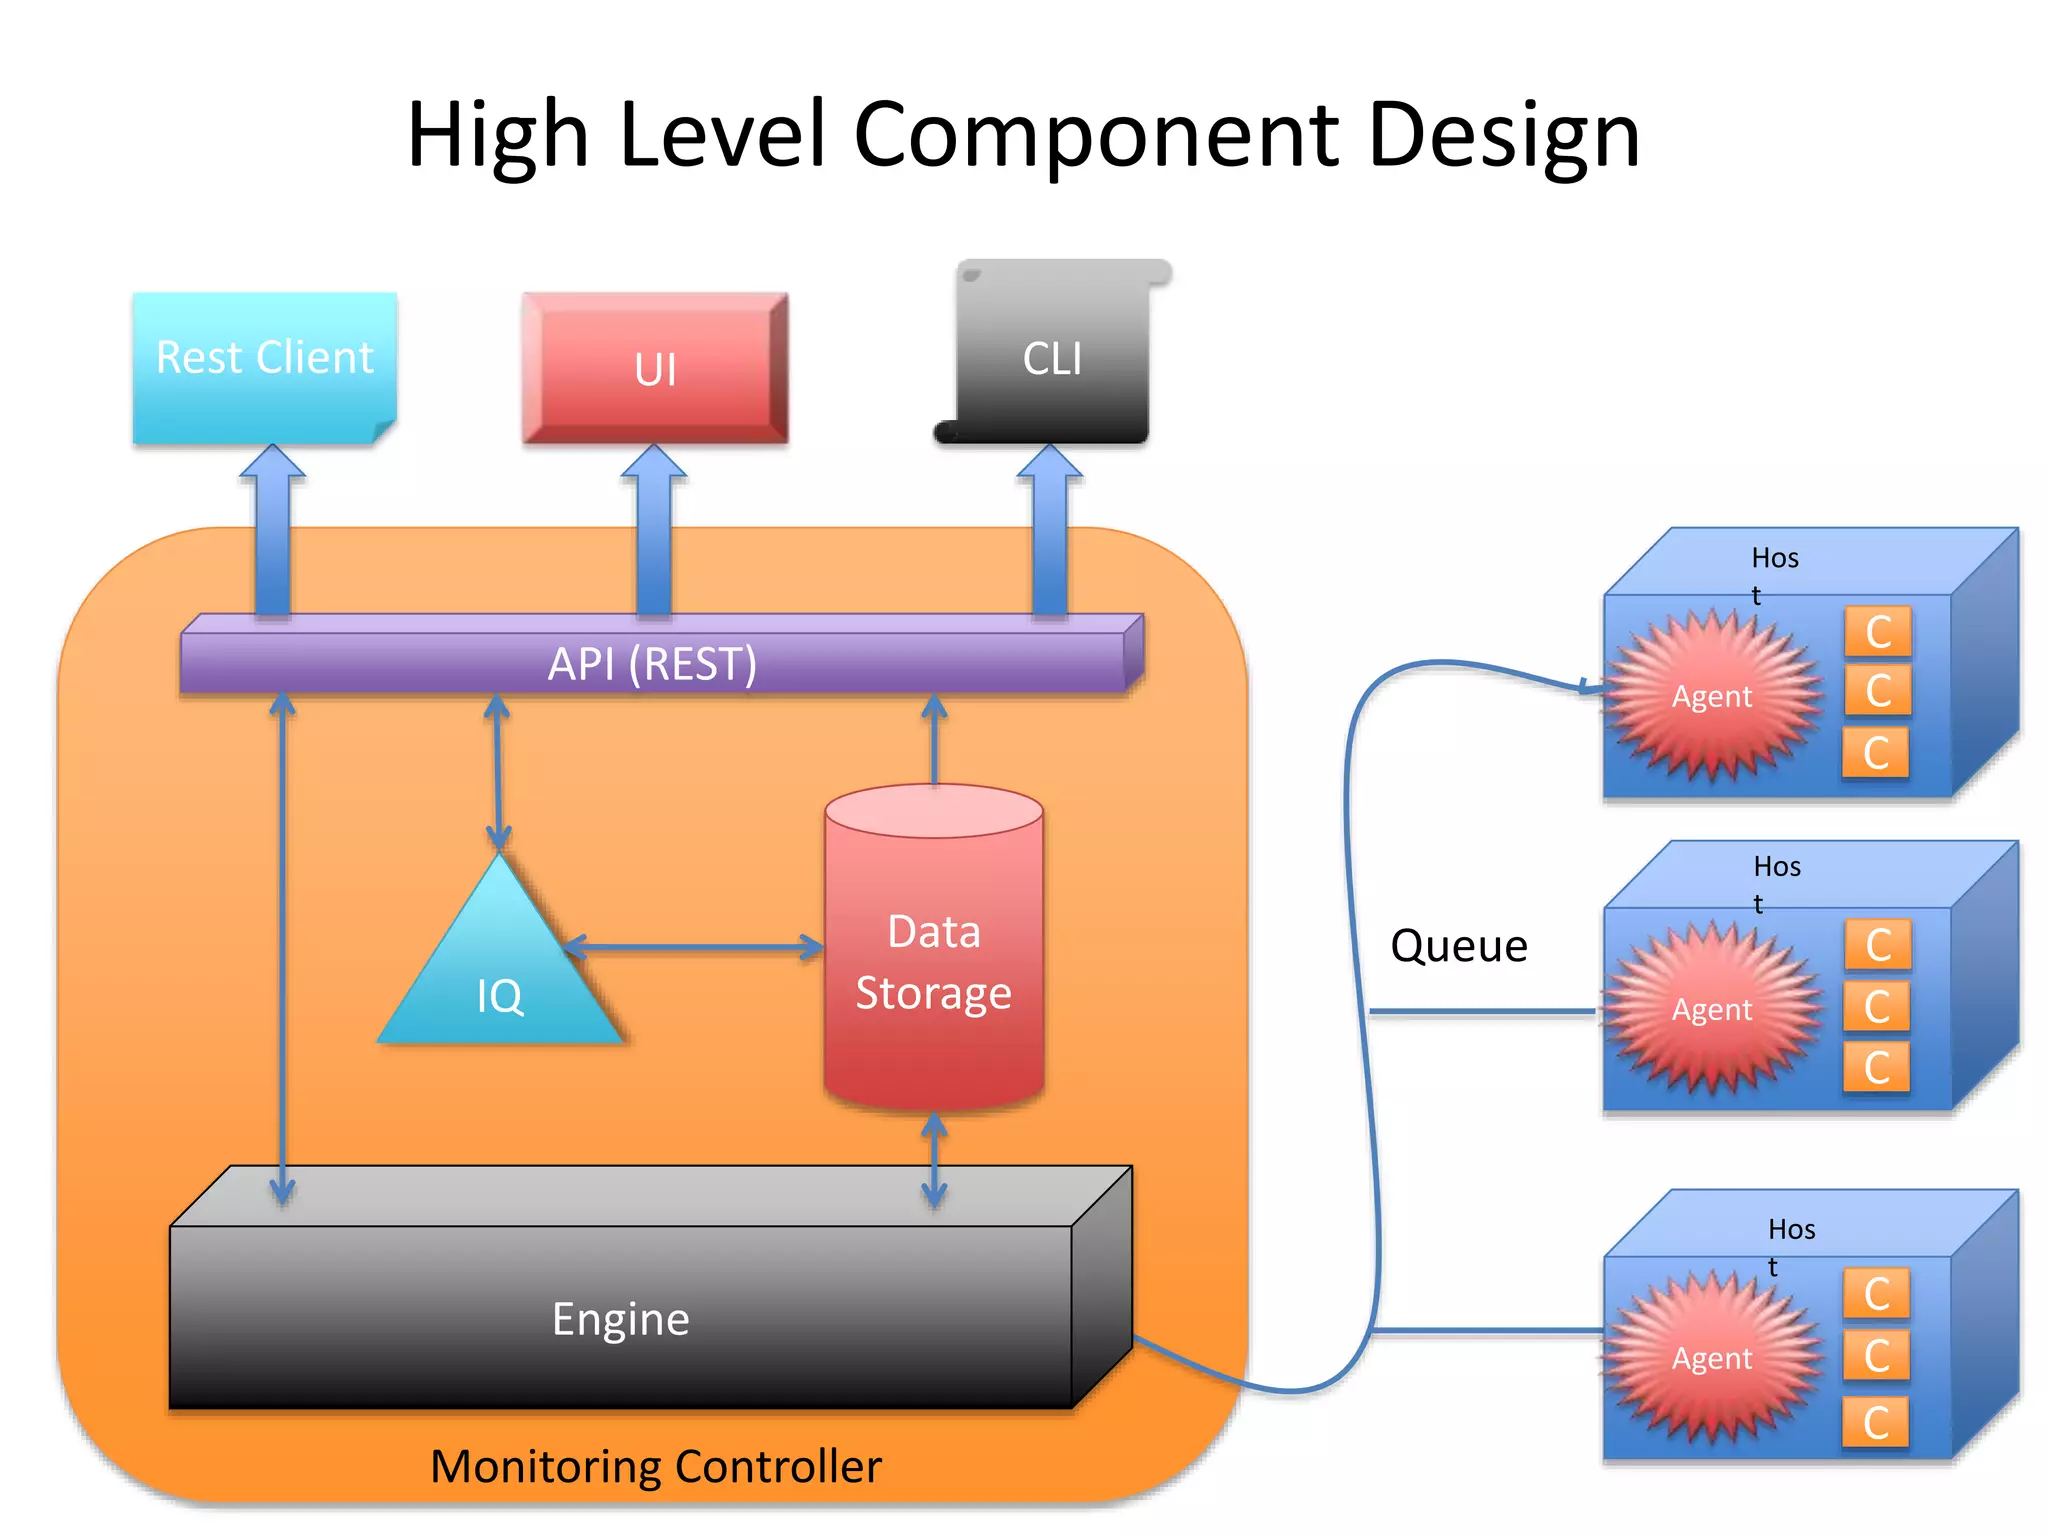
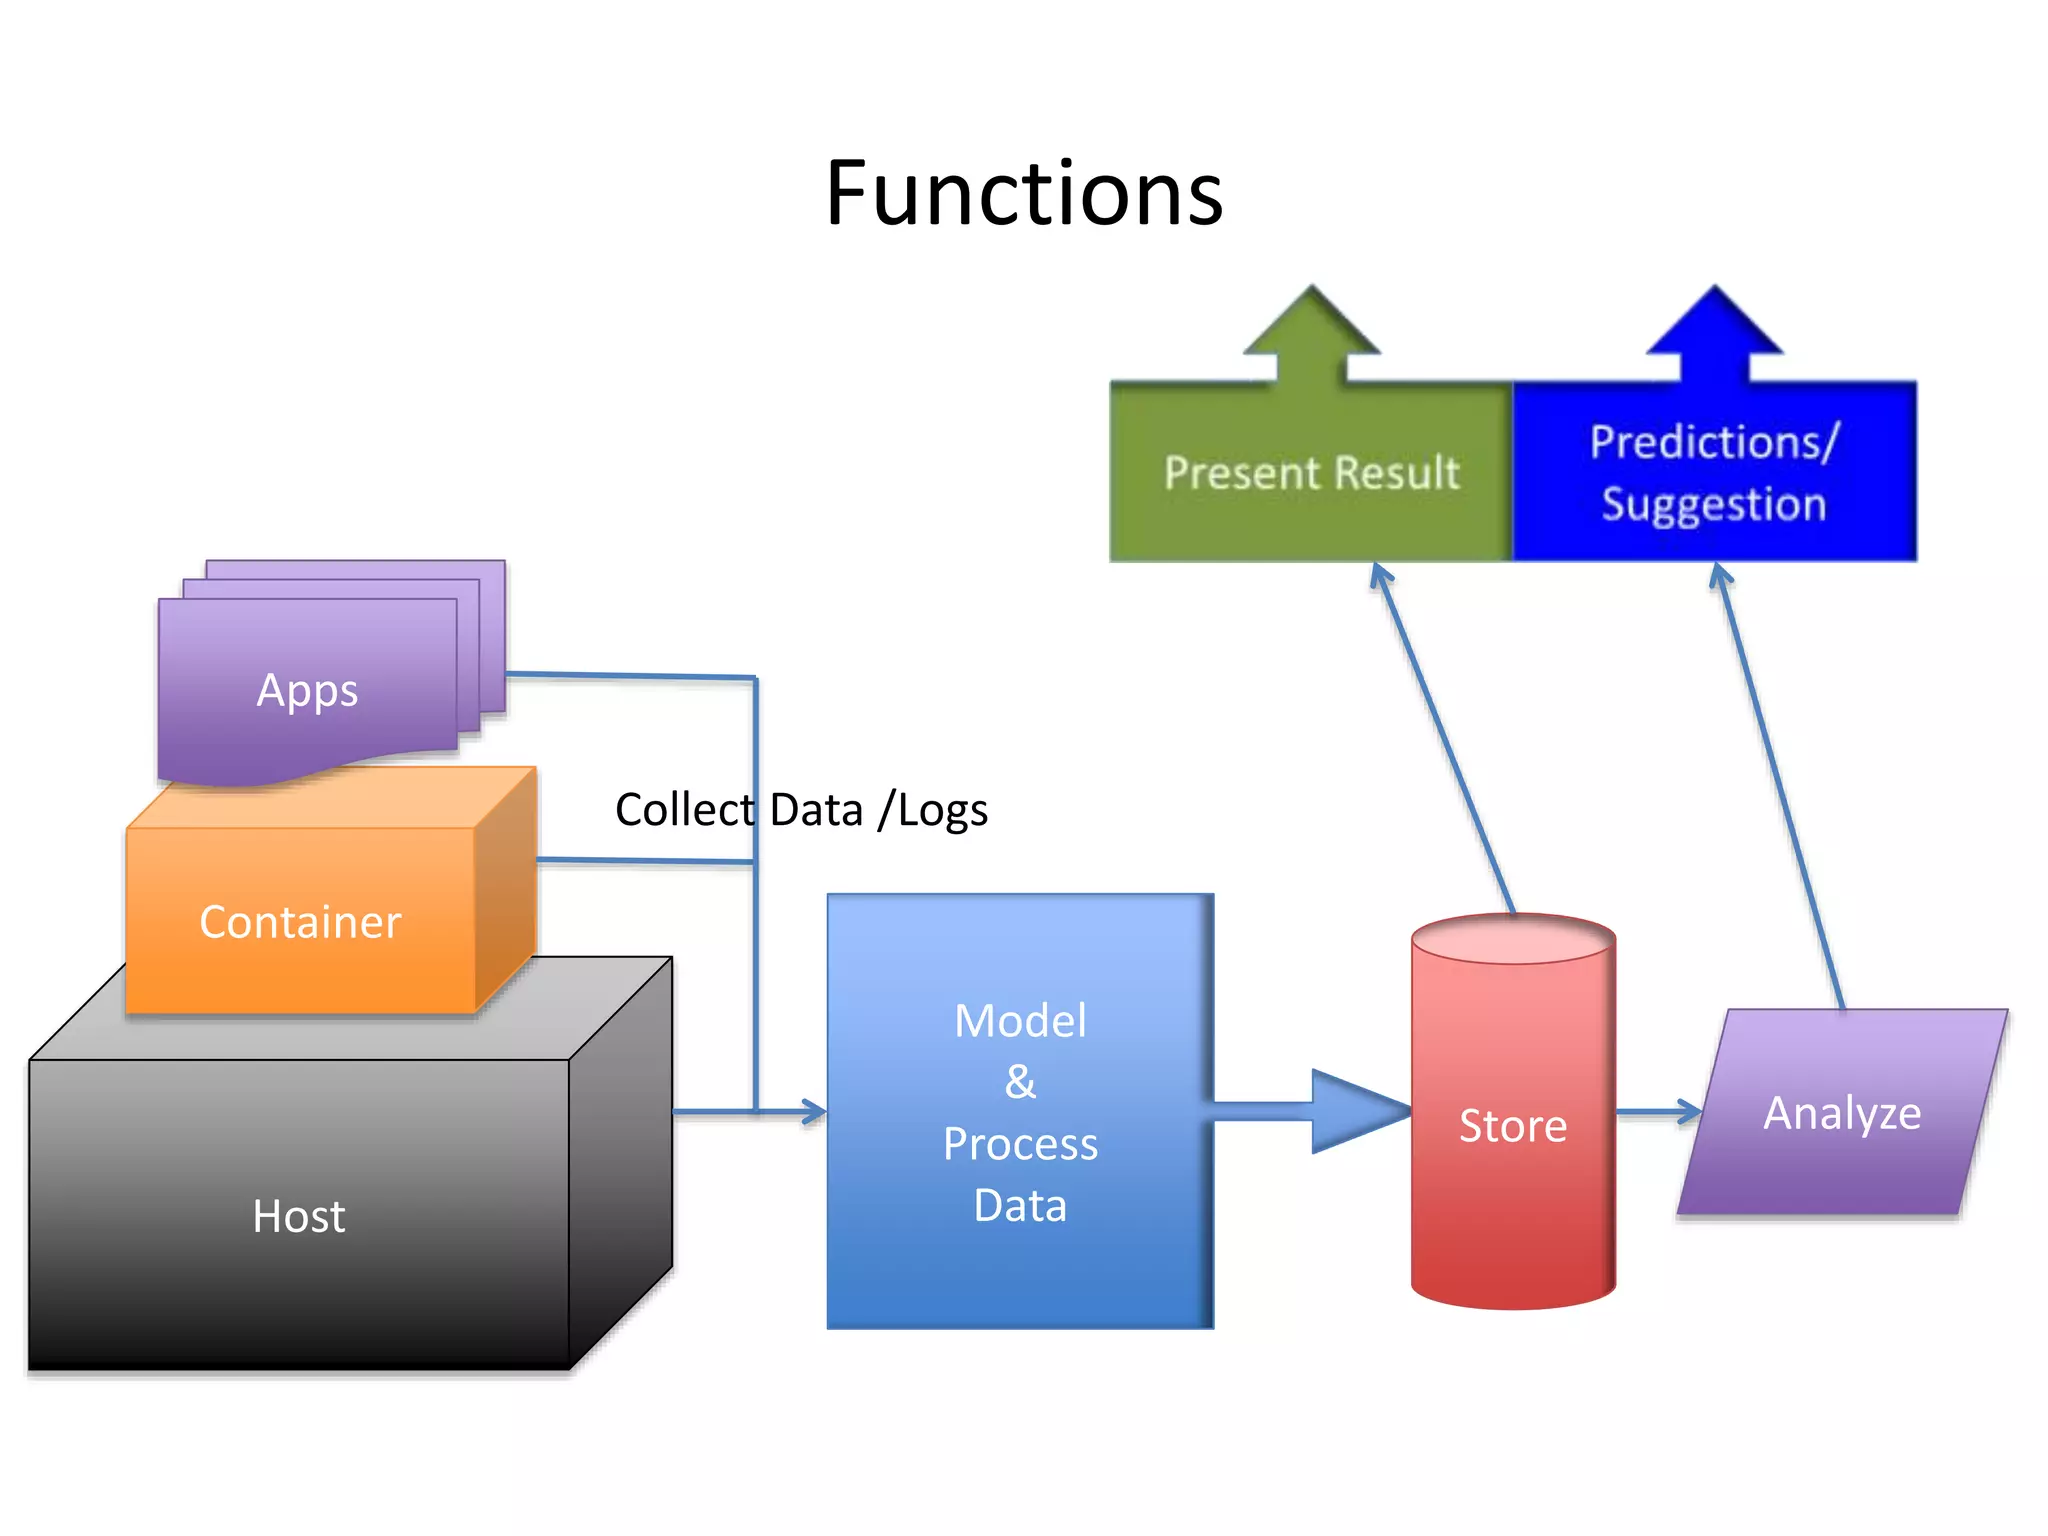
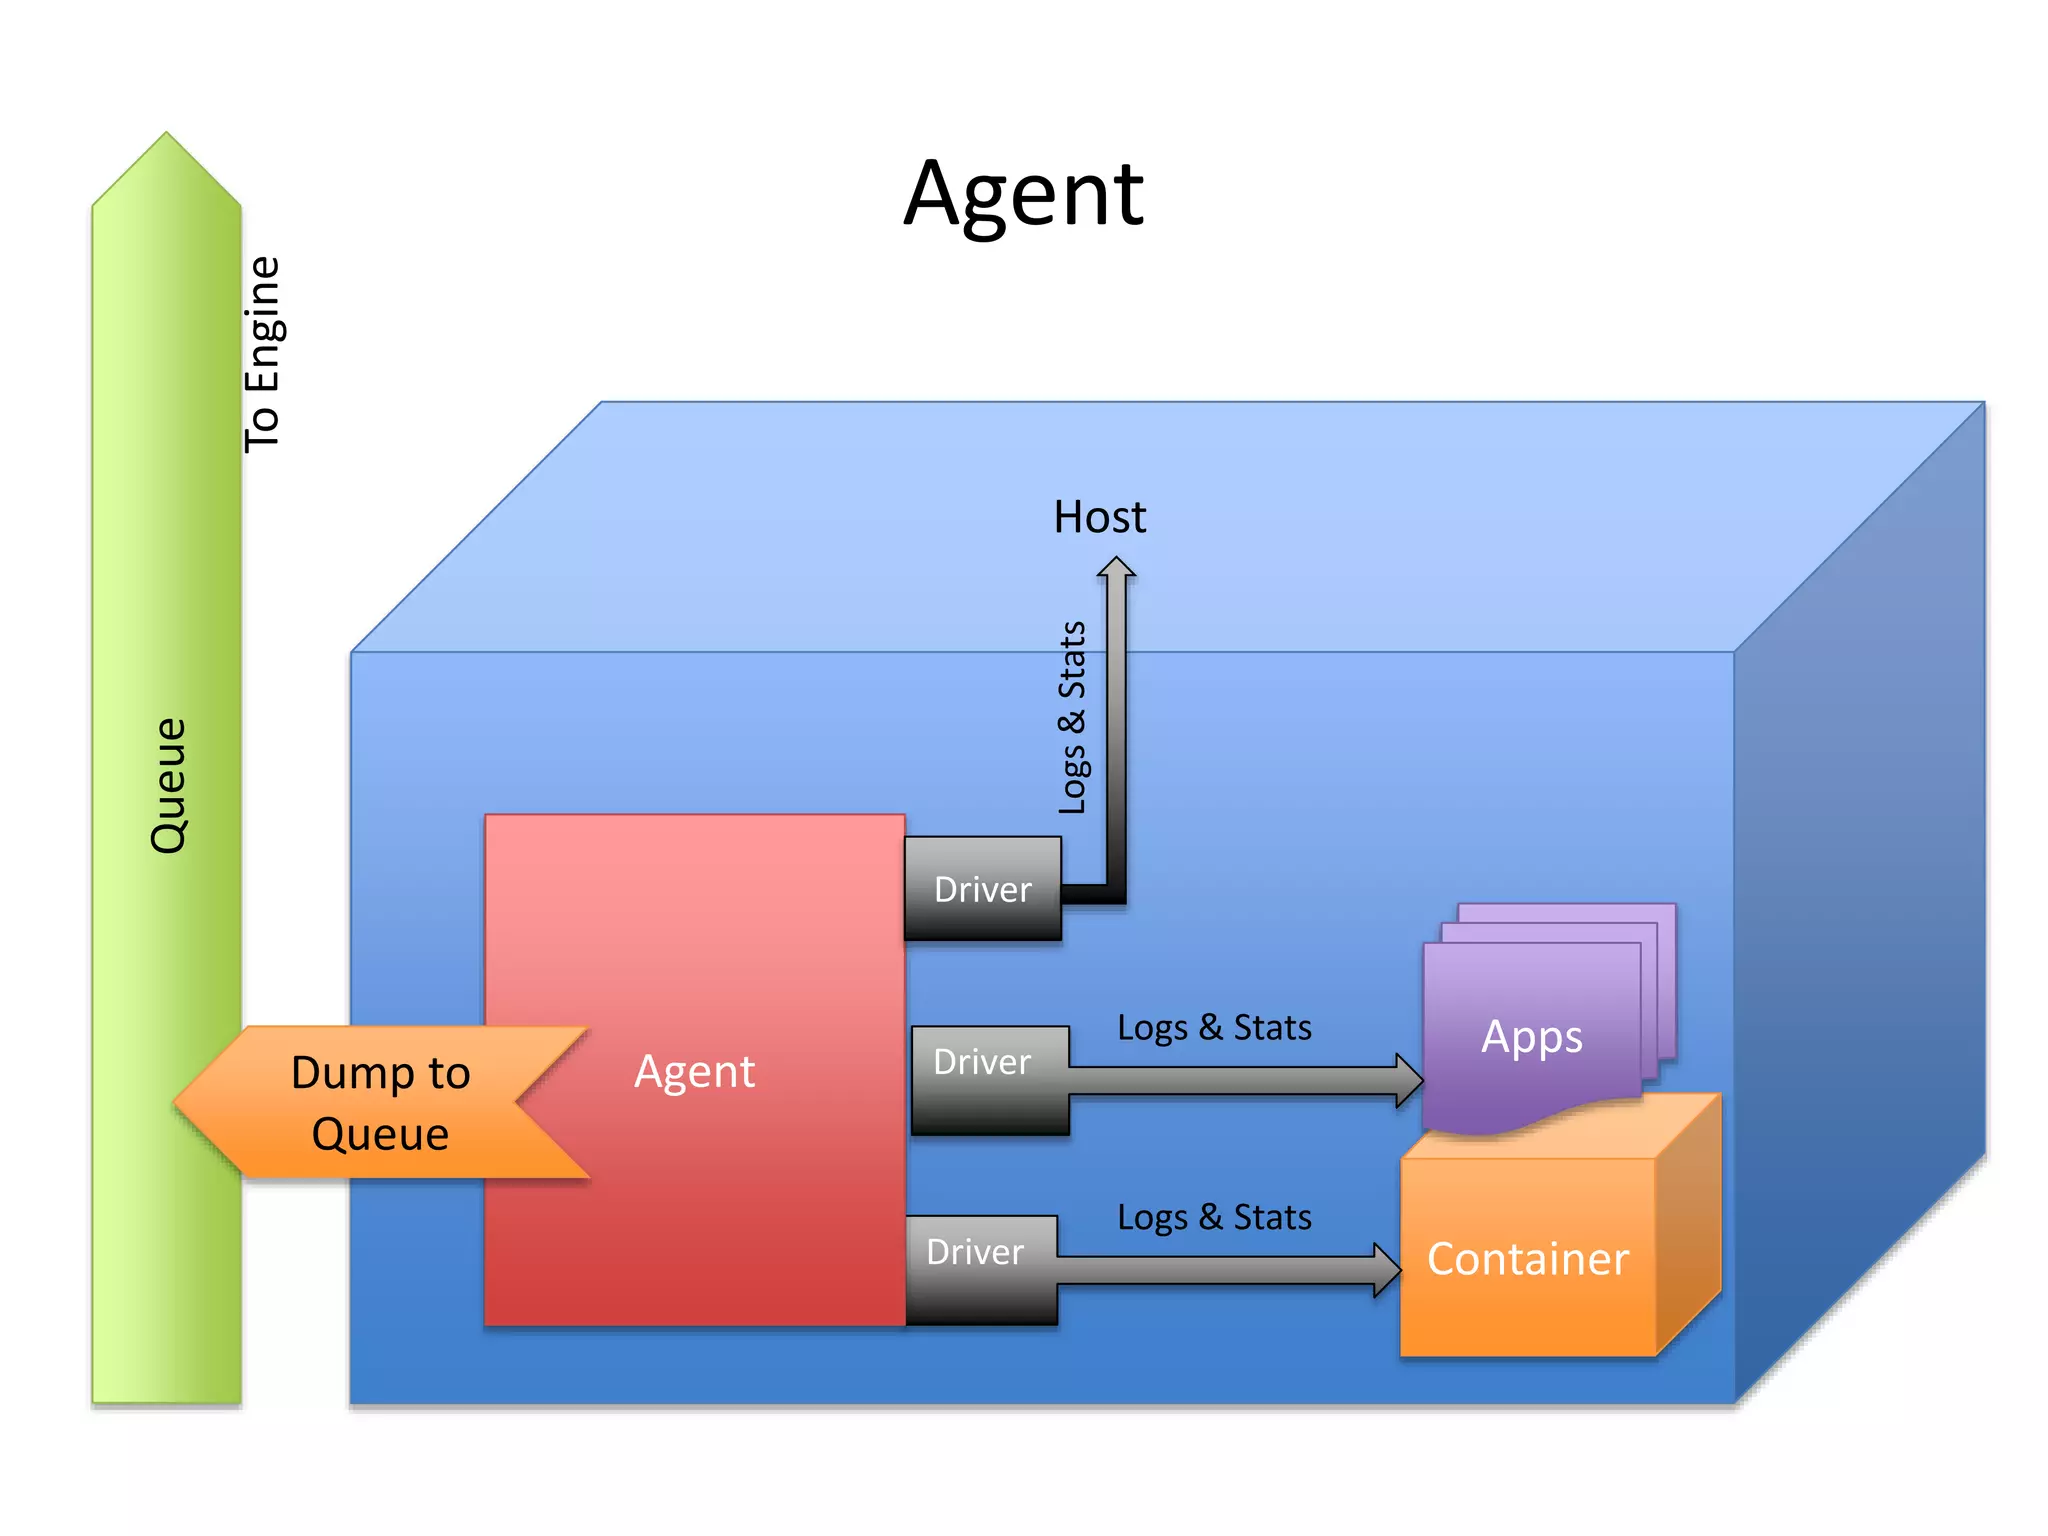
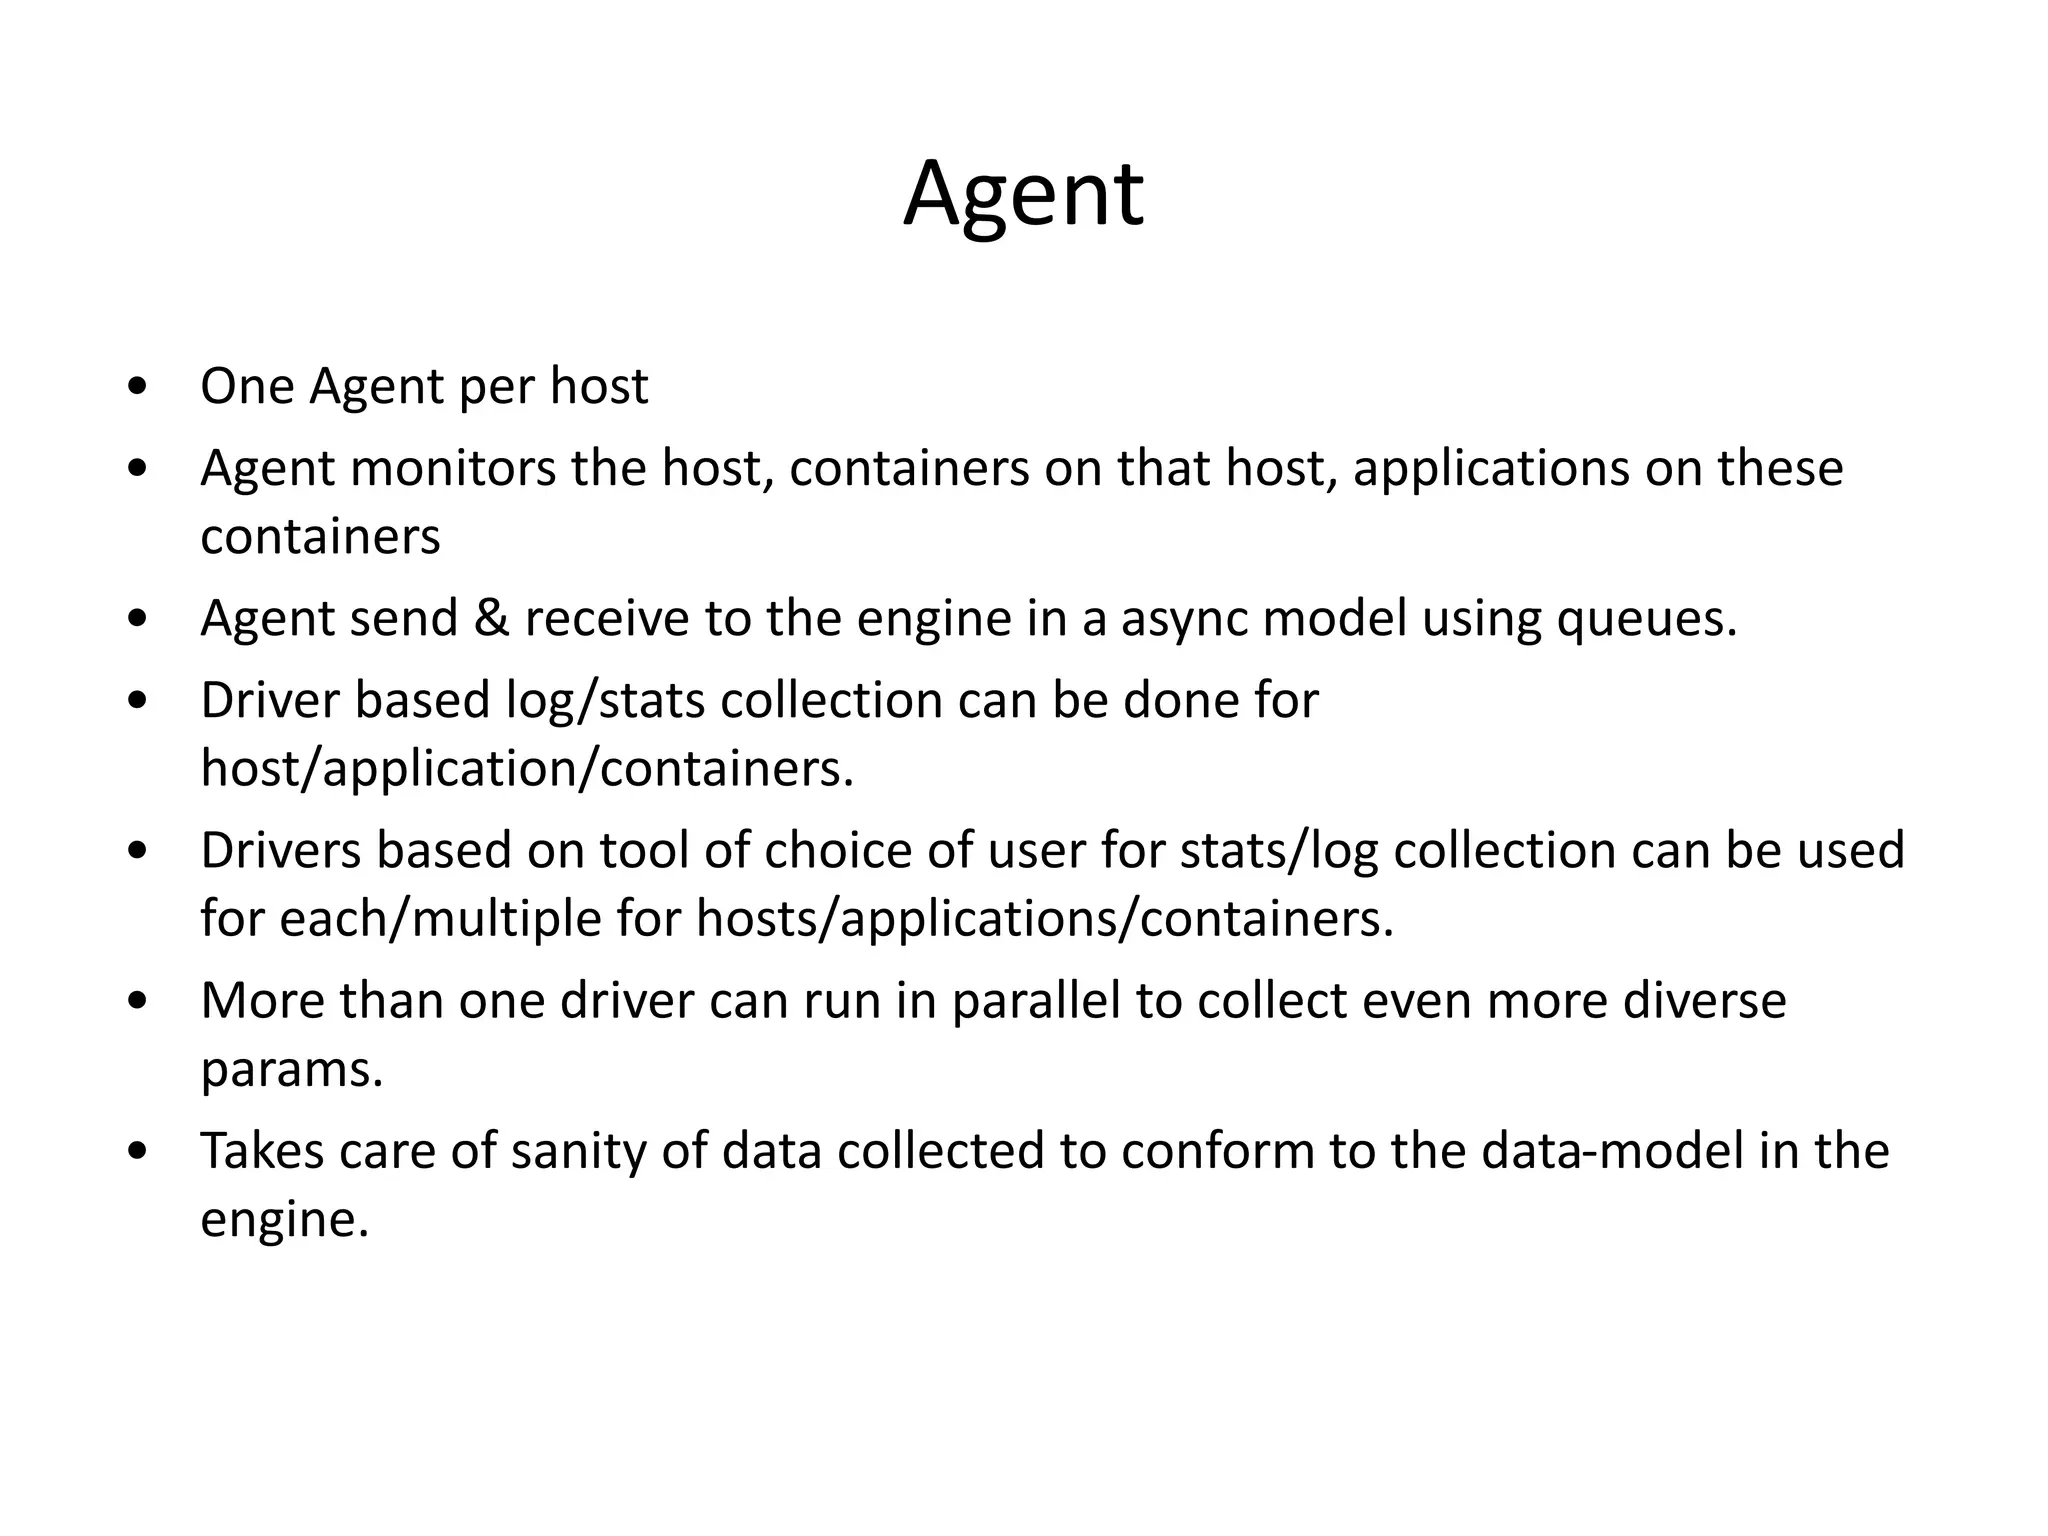
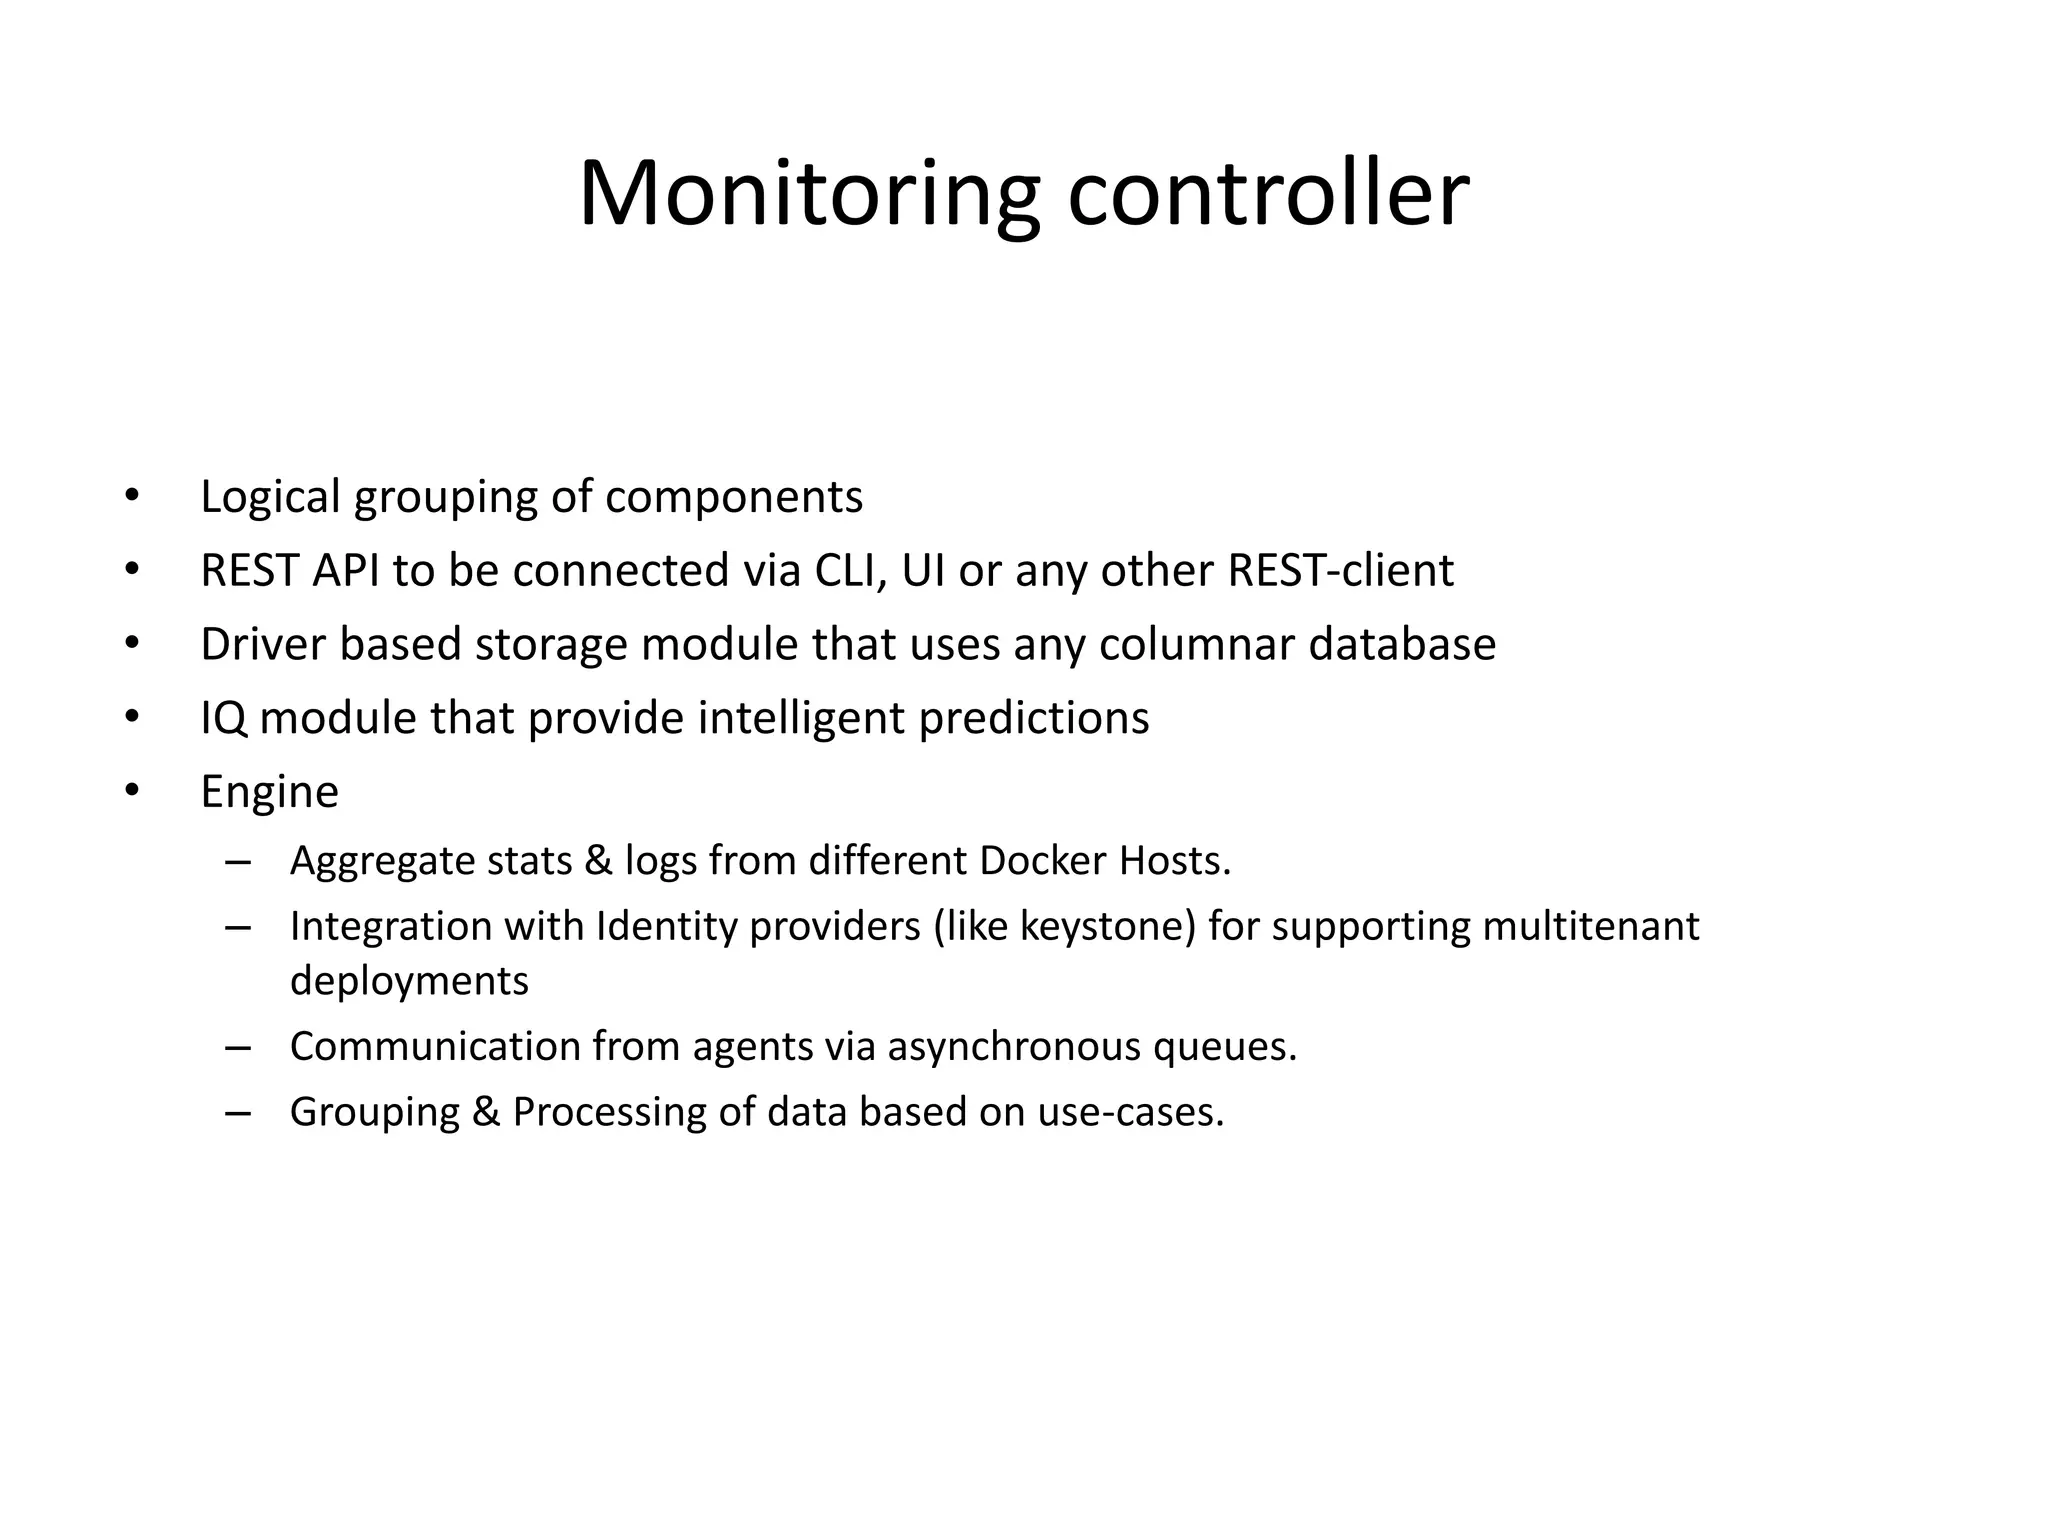
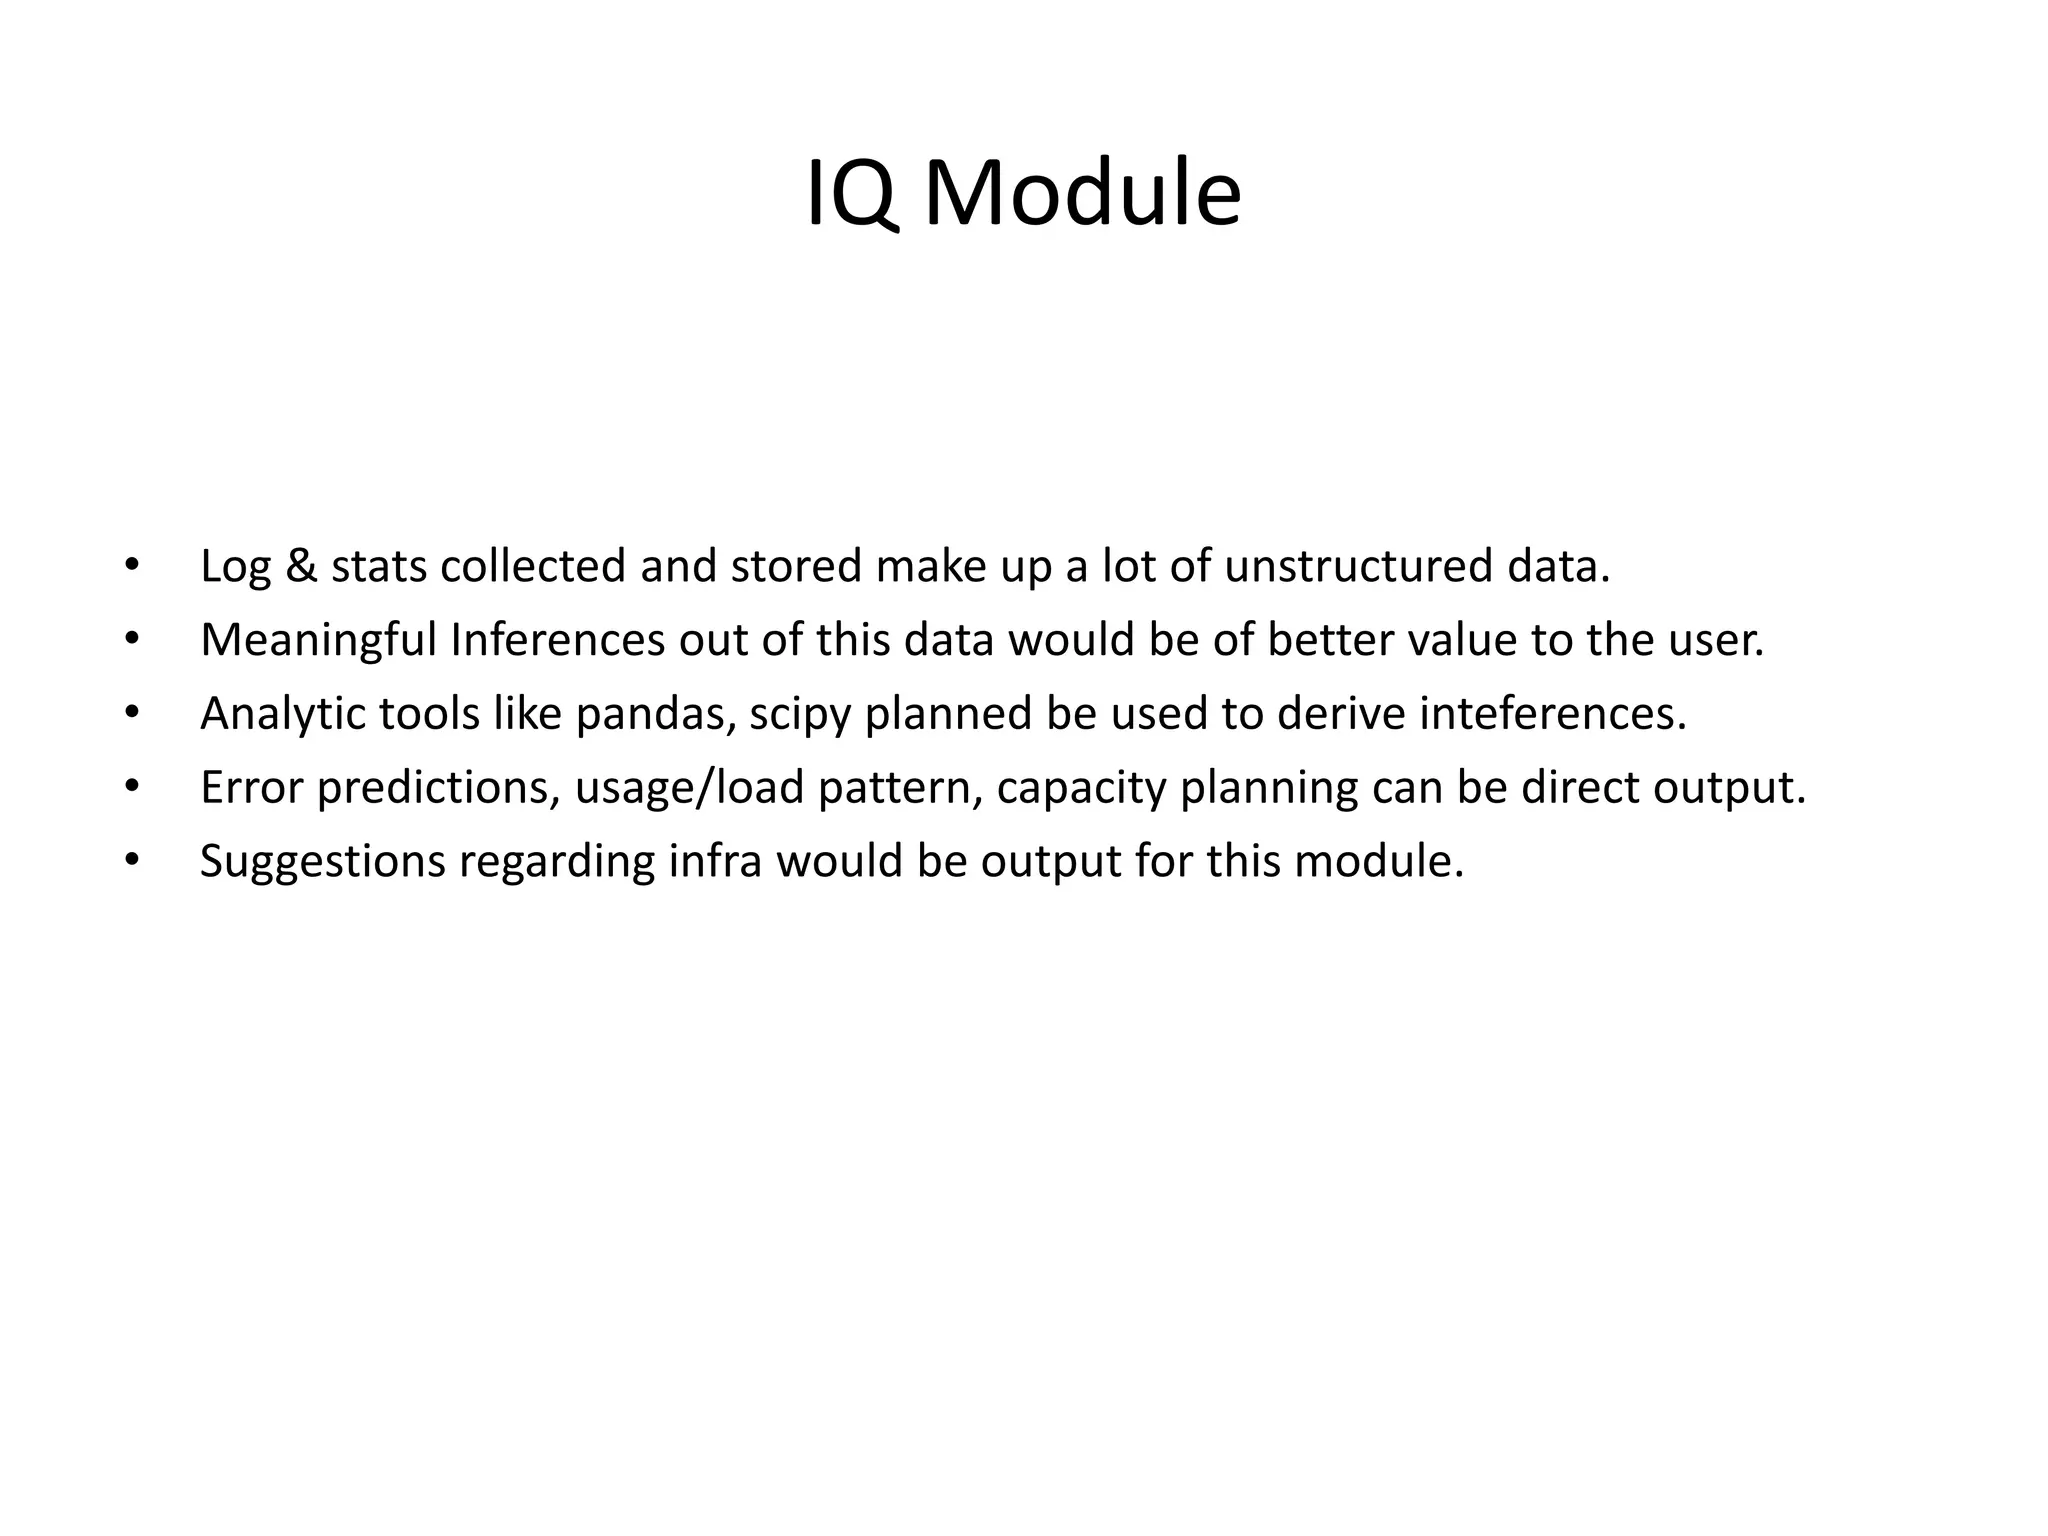
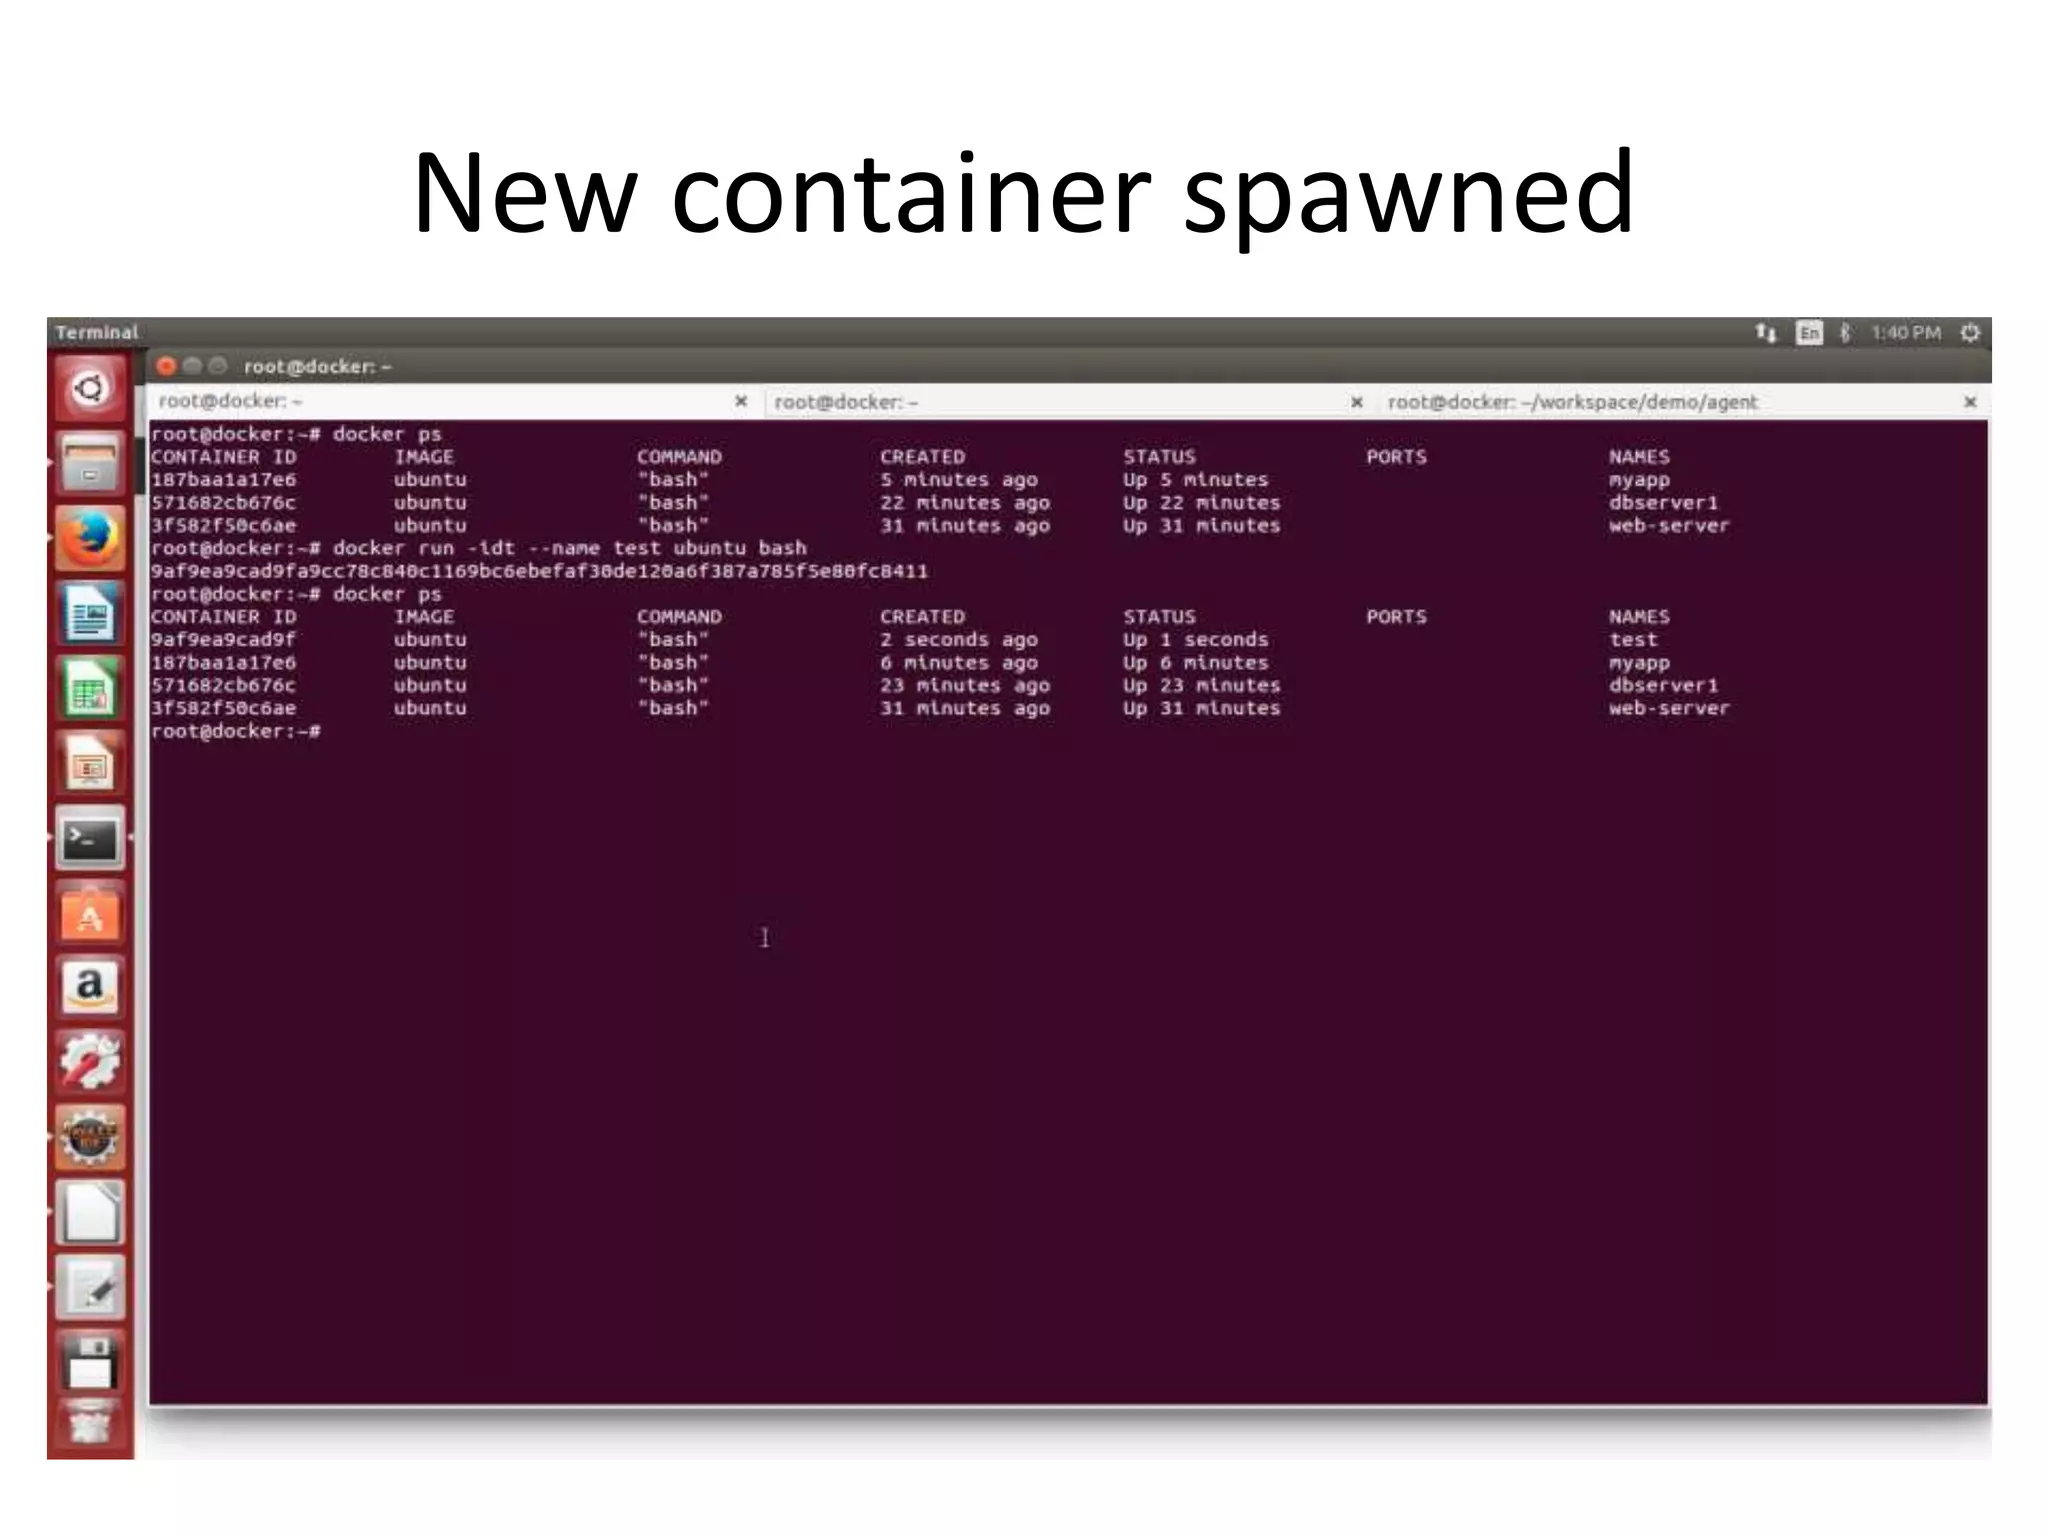
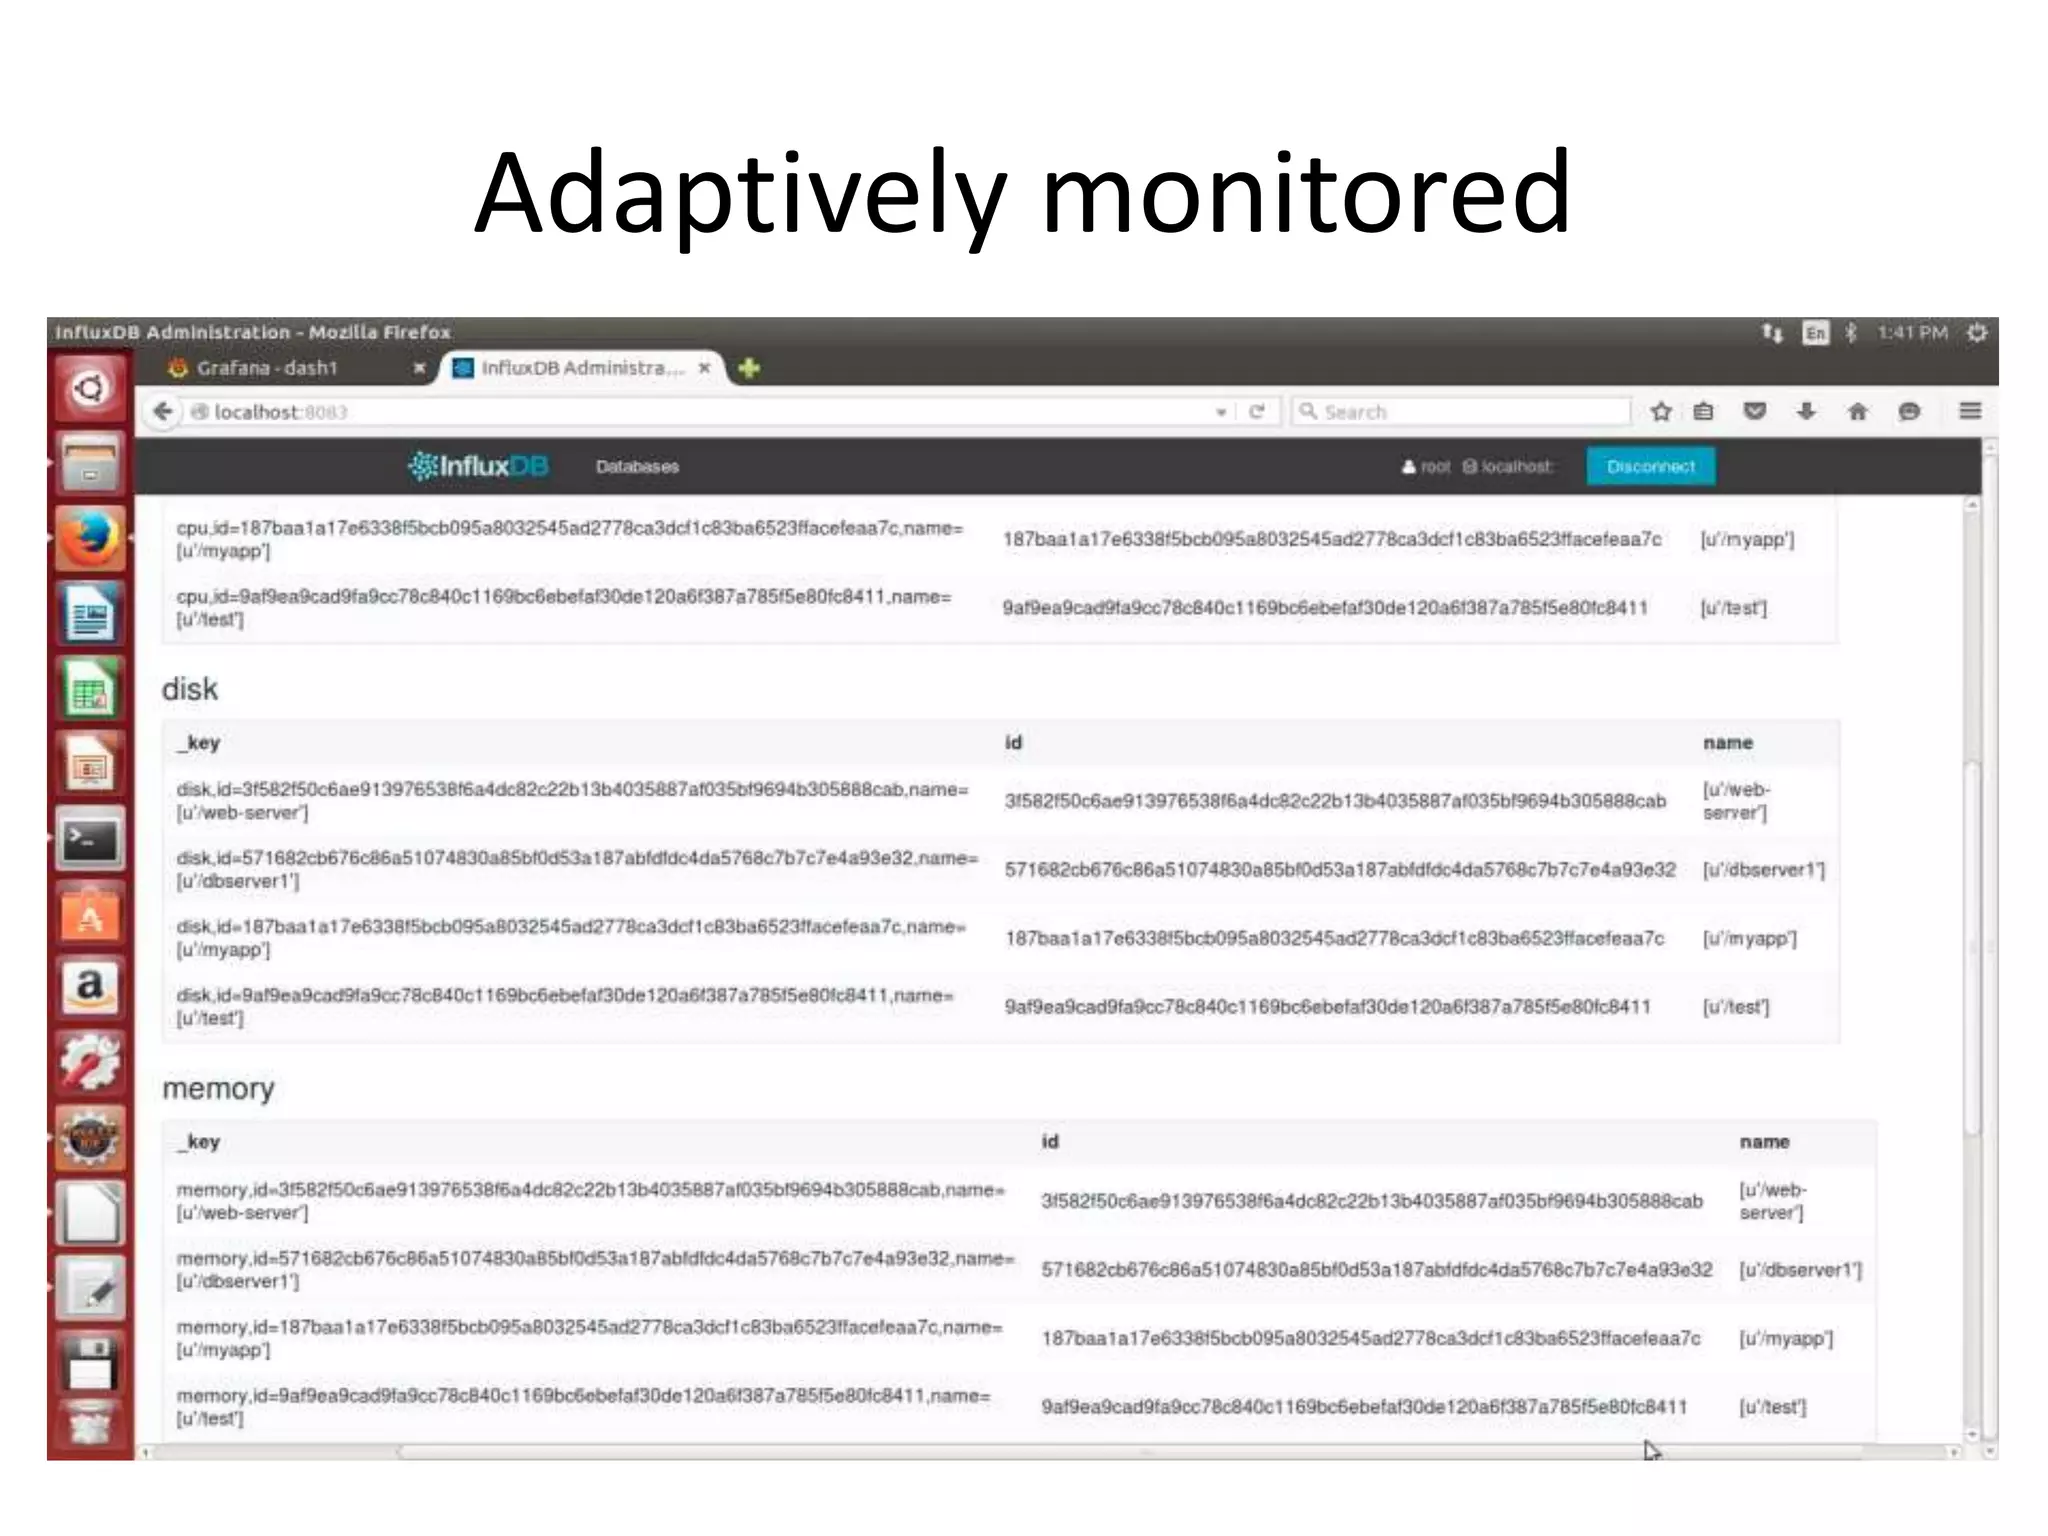
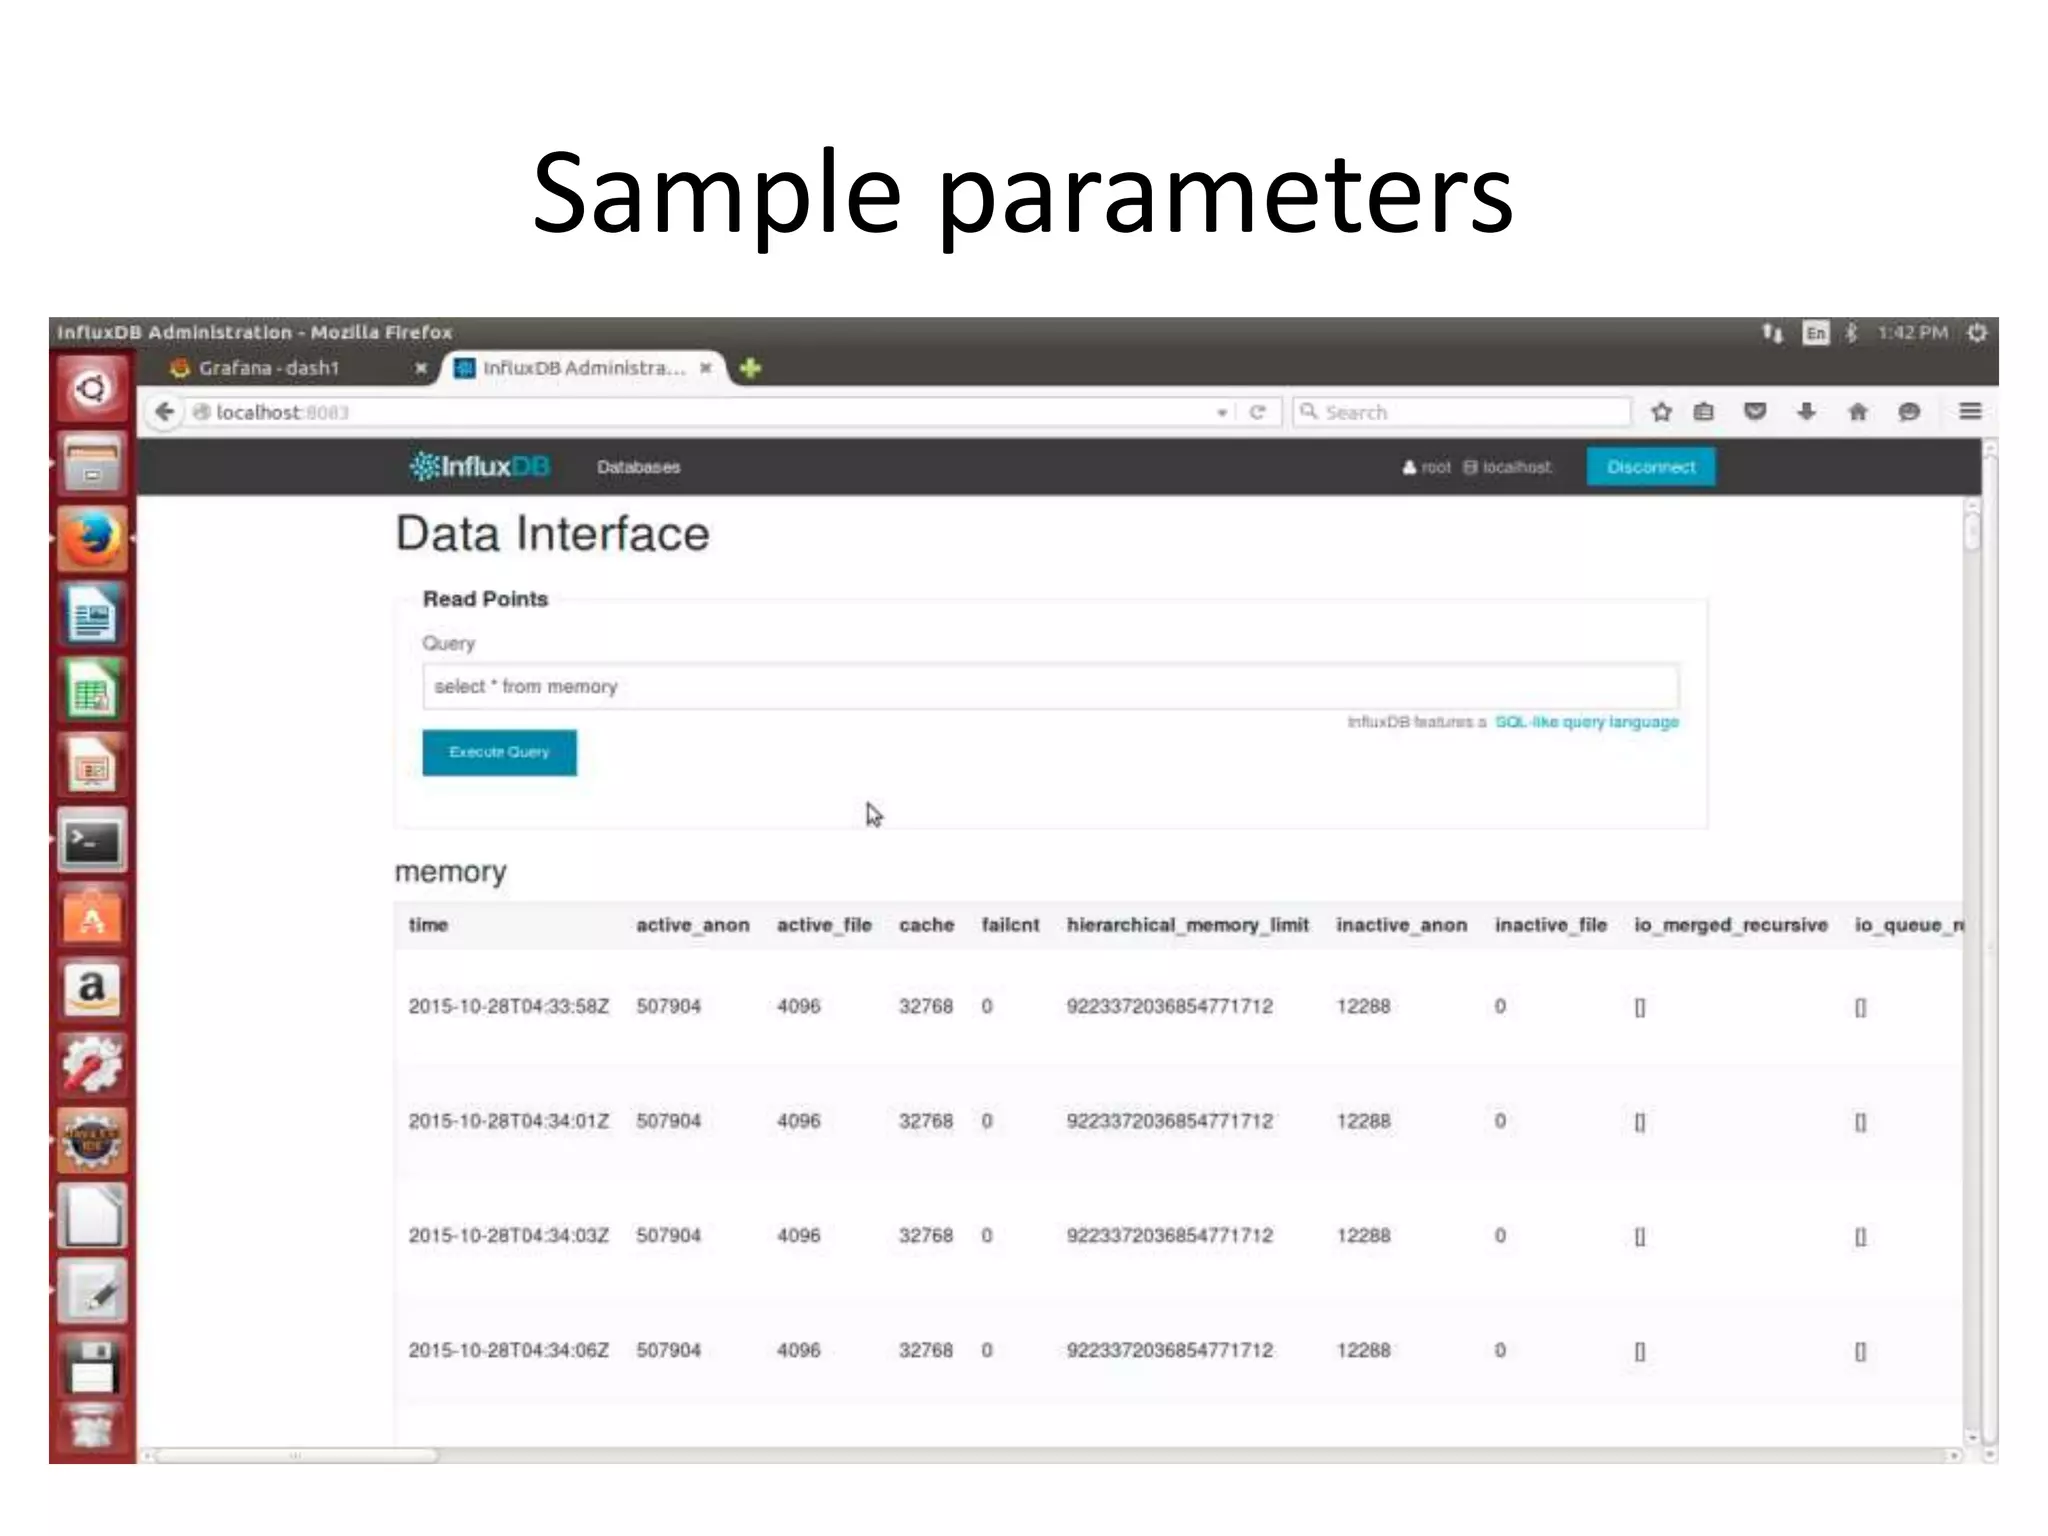
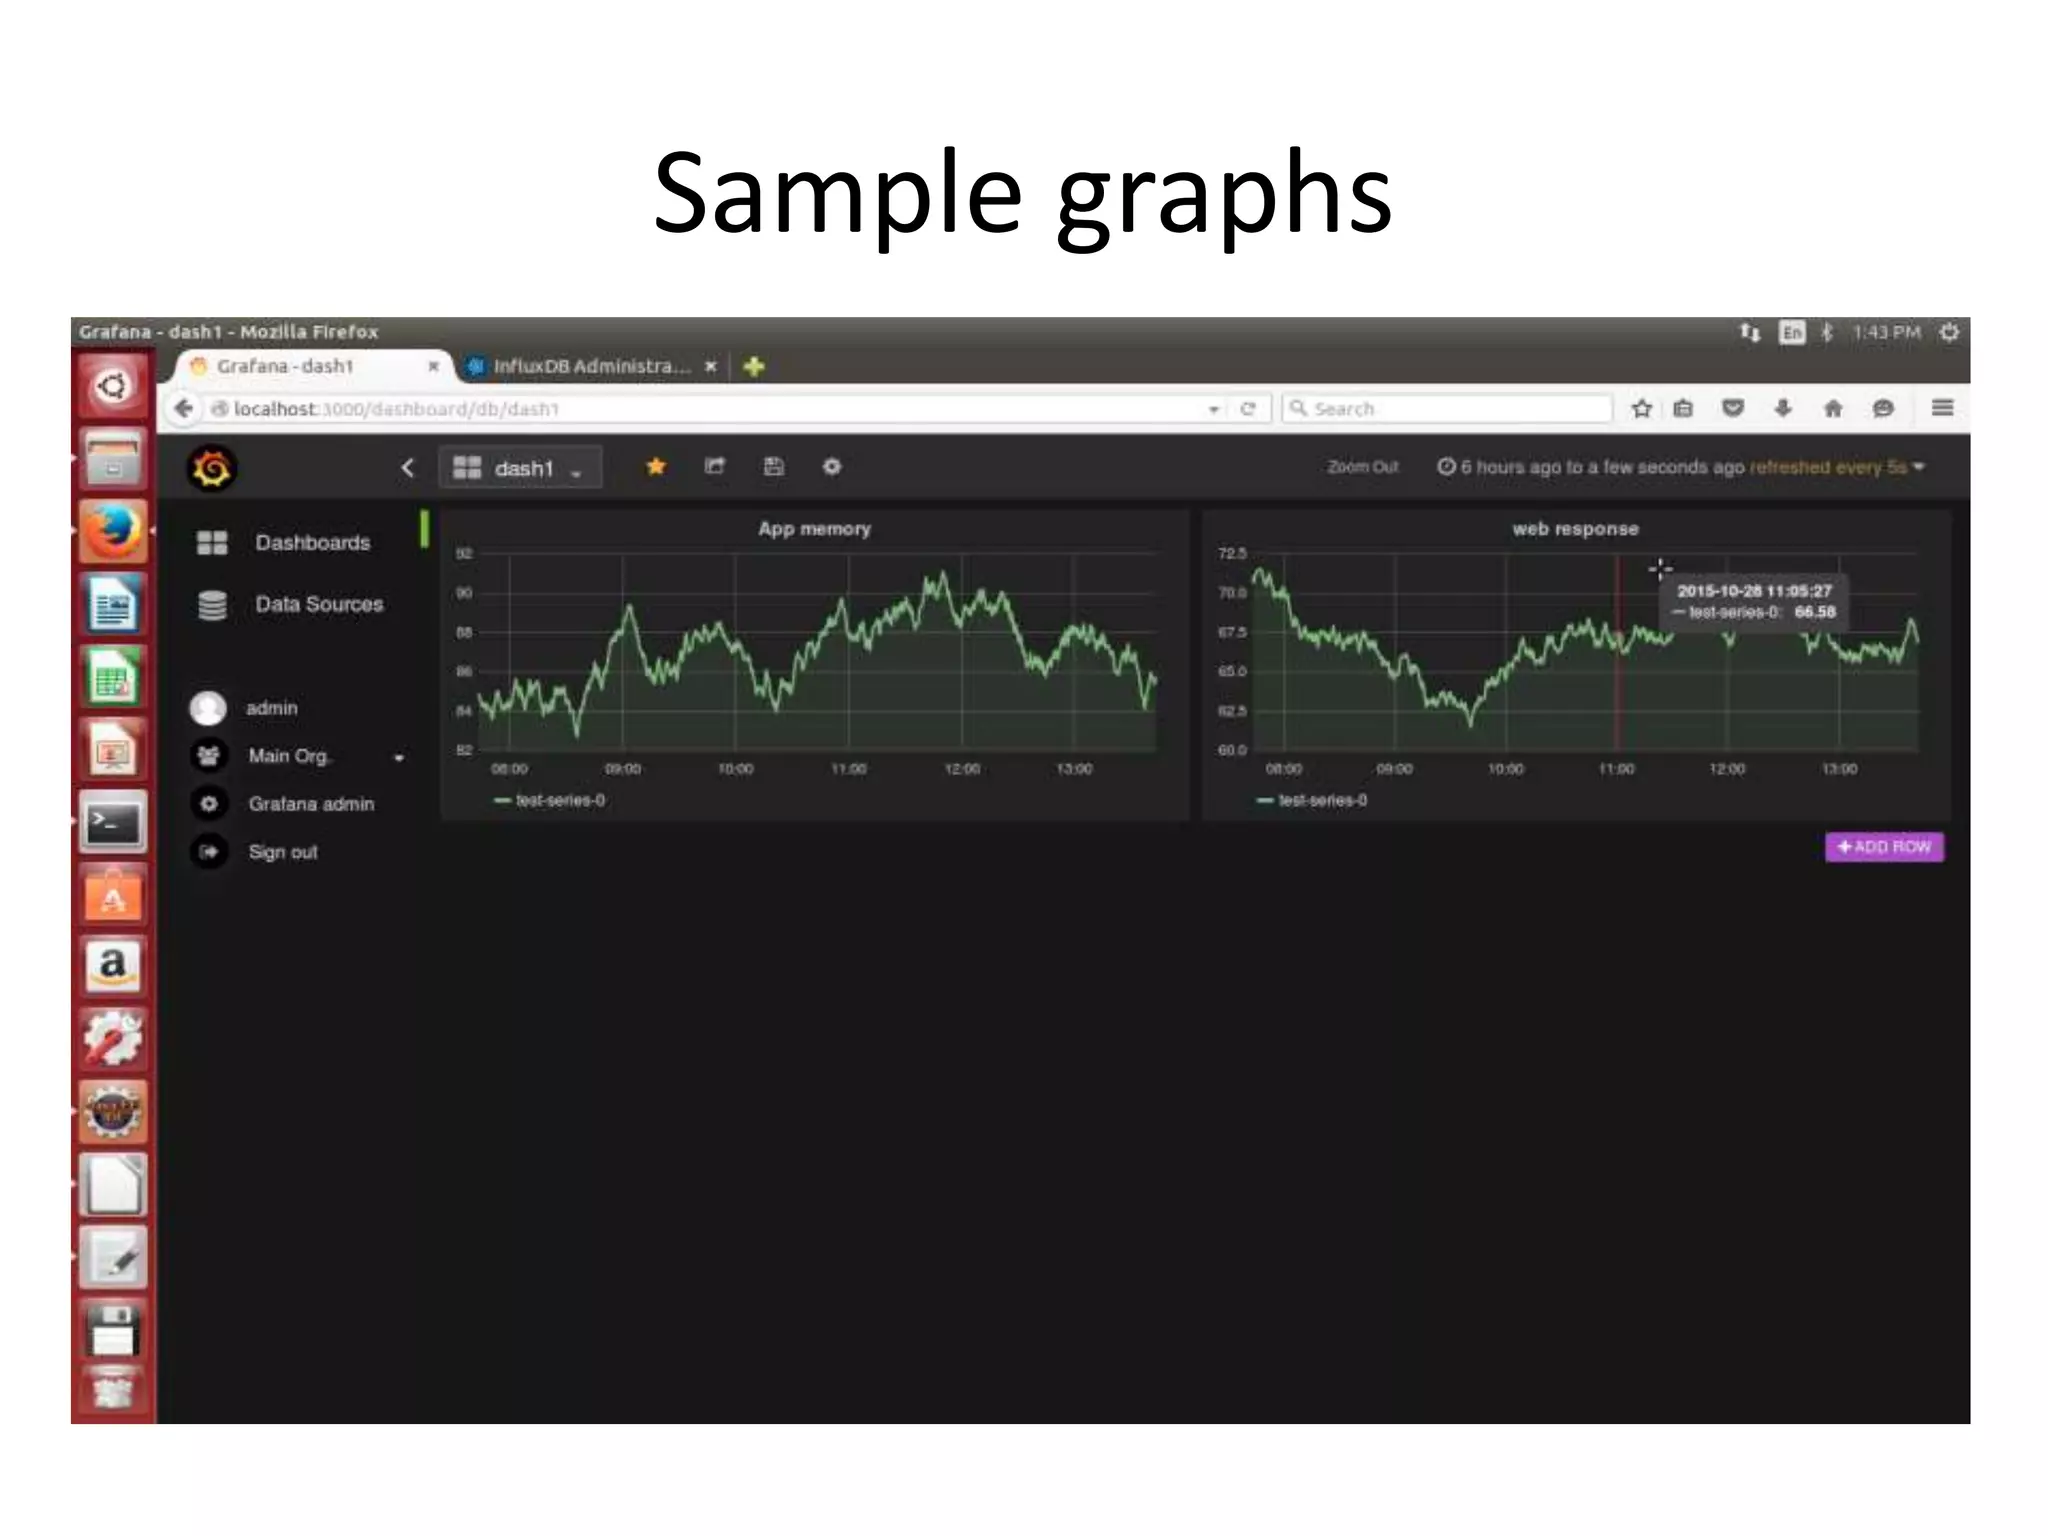


The document discusses the challenges and approaches for monitoring Docker containers and applications, emphasizing the need for comprehensive monitoring that incorporates application and infrastructure data. It outlines various strategies for monitoring including proactive, reactive, and adaptive methods, and highlights important metrics such as CPU, memory, disk, and network statistics. A modular design is proposed for collecting and analyzing data through agents, ensuring efficient resource usage while providing meaningful insights from the collected statistics.


![从CI到CD[麻袋理财王天青]v1](https://cdn.slidesharecdn.com/ss_thumbnails/4e7f8986-44e7-4217-97fa-2044abc0e3cf-161028014326-thumbnail.jpg?width=640&height=640&fit=bounds)


