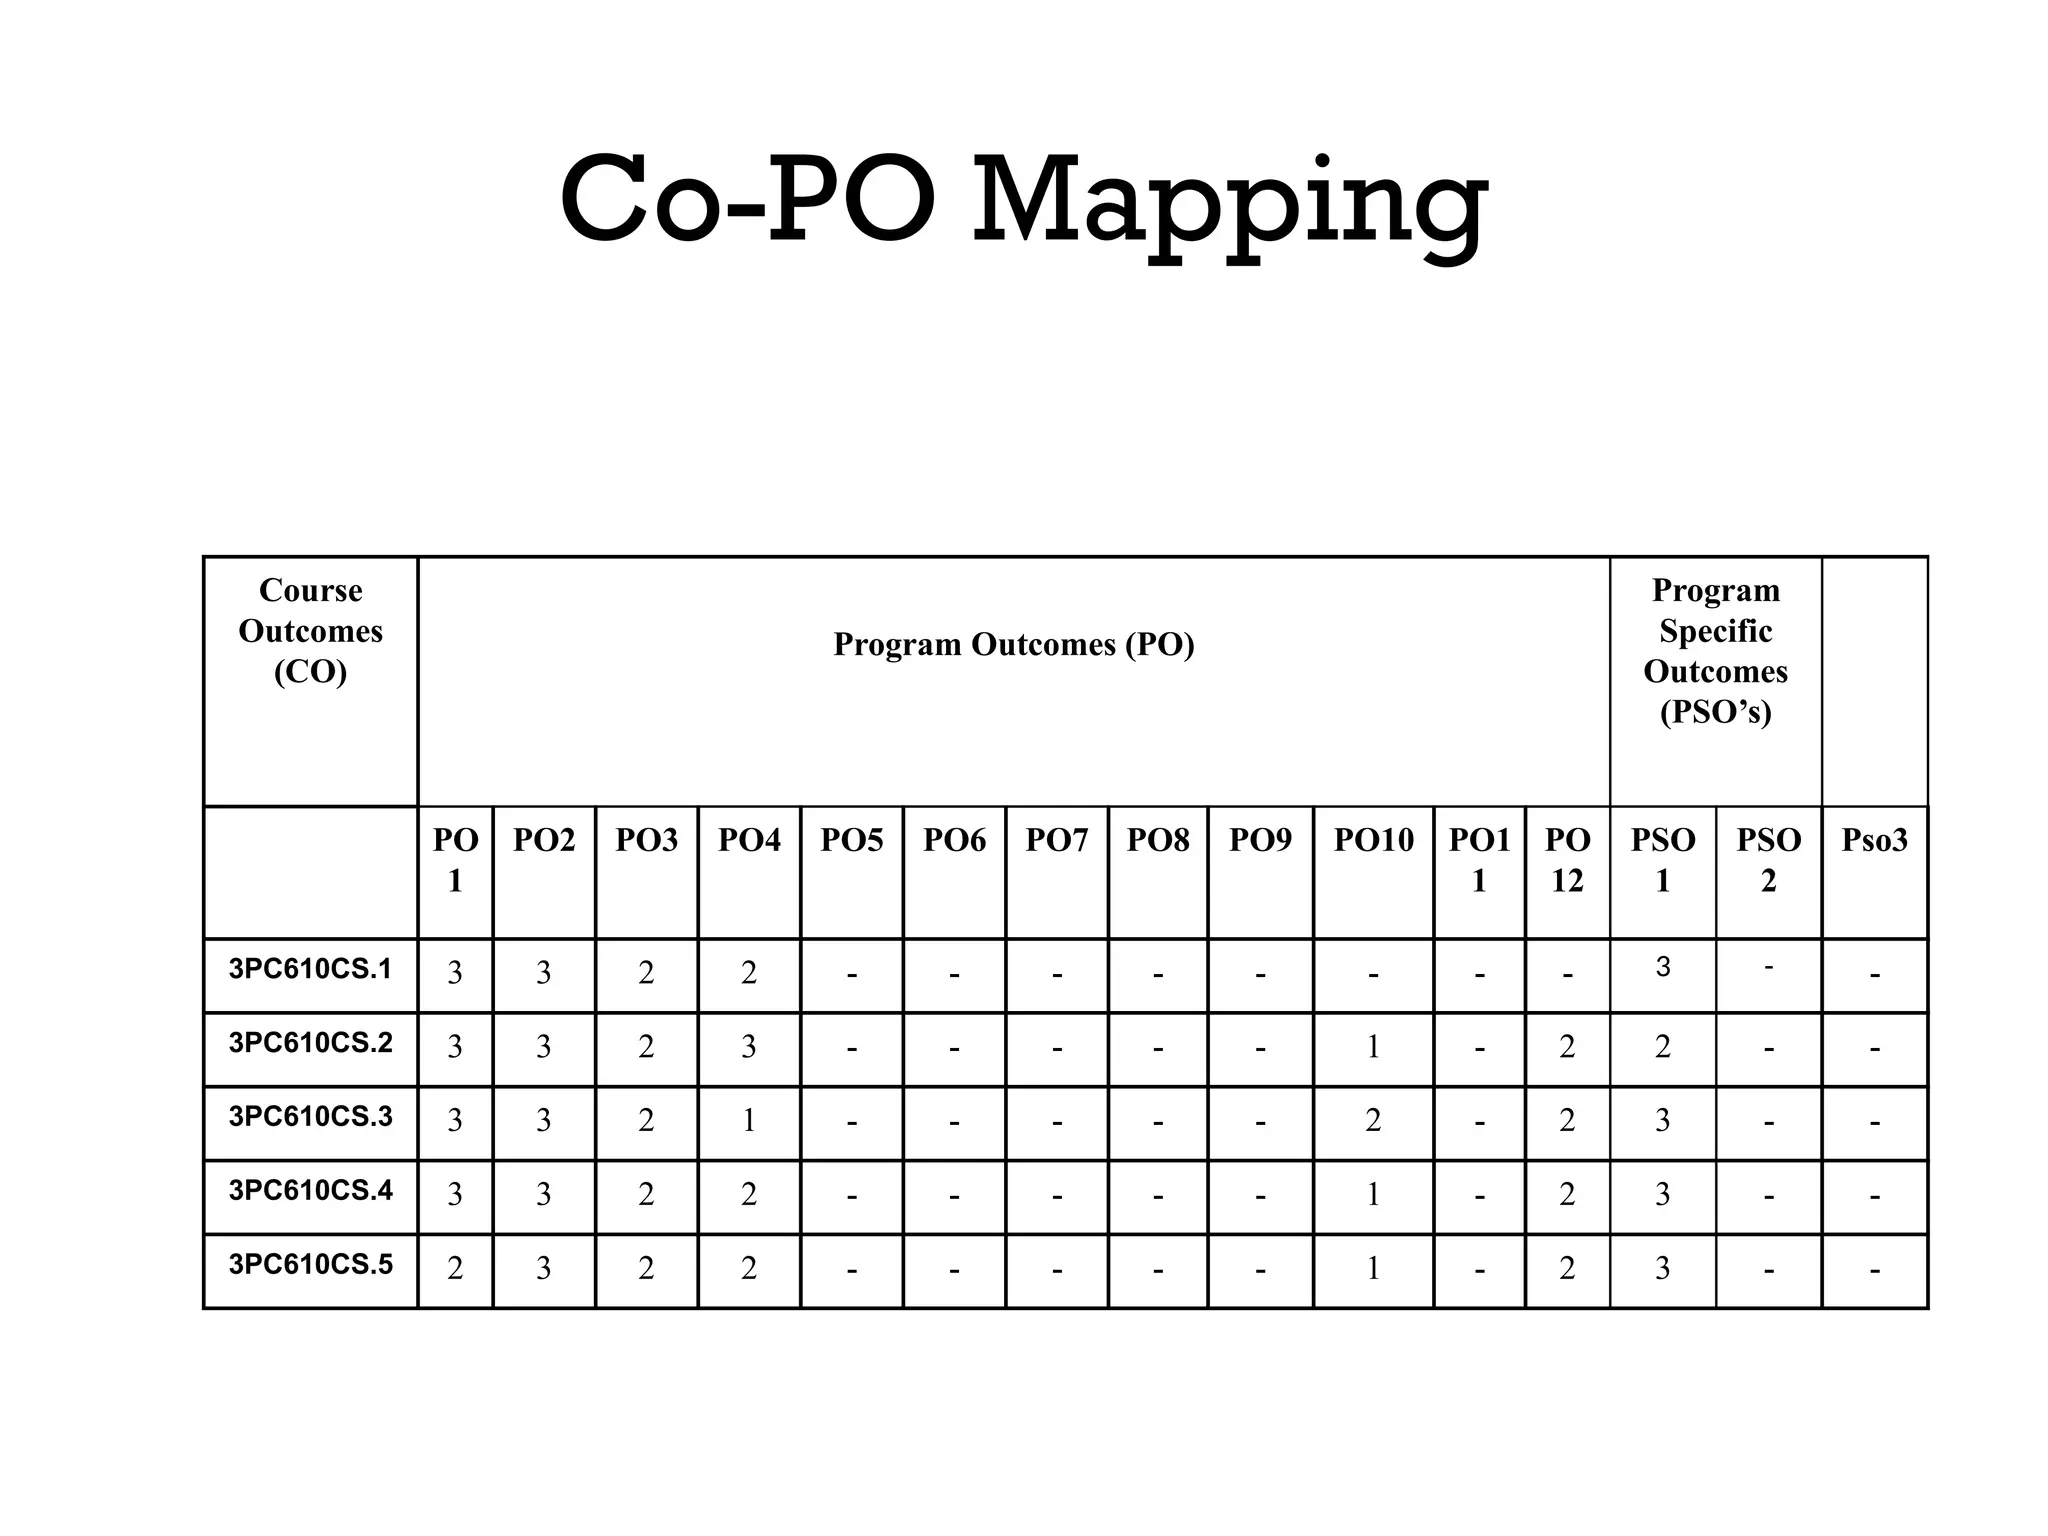
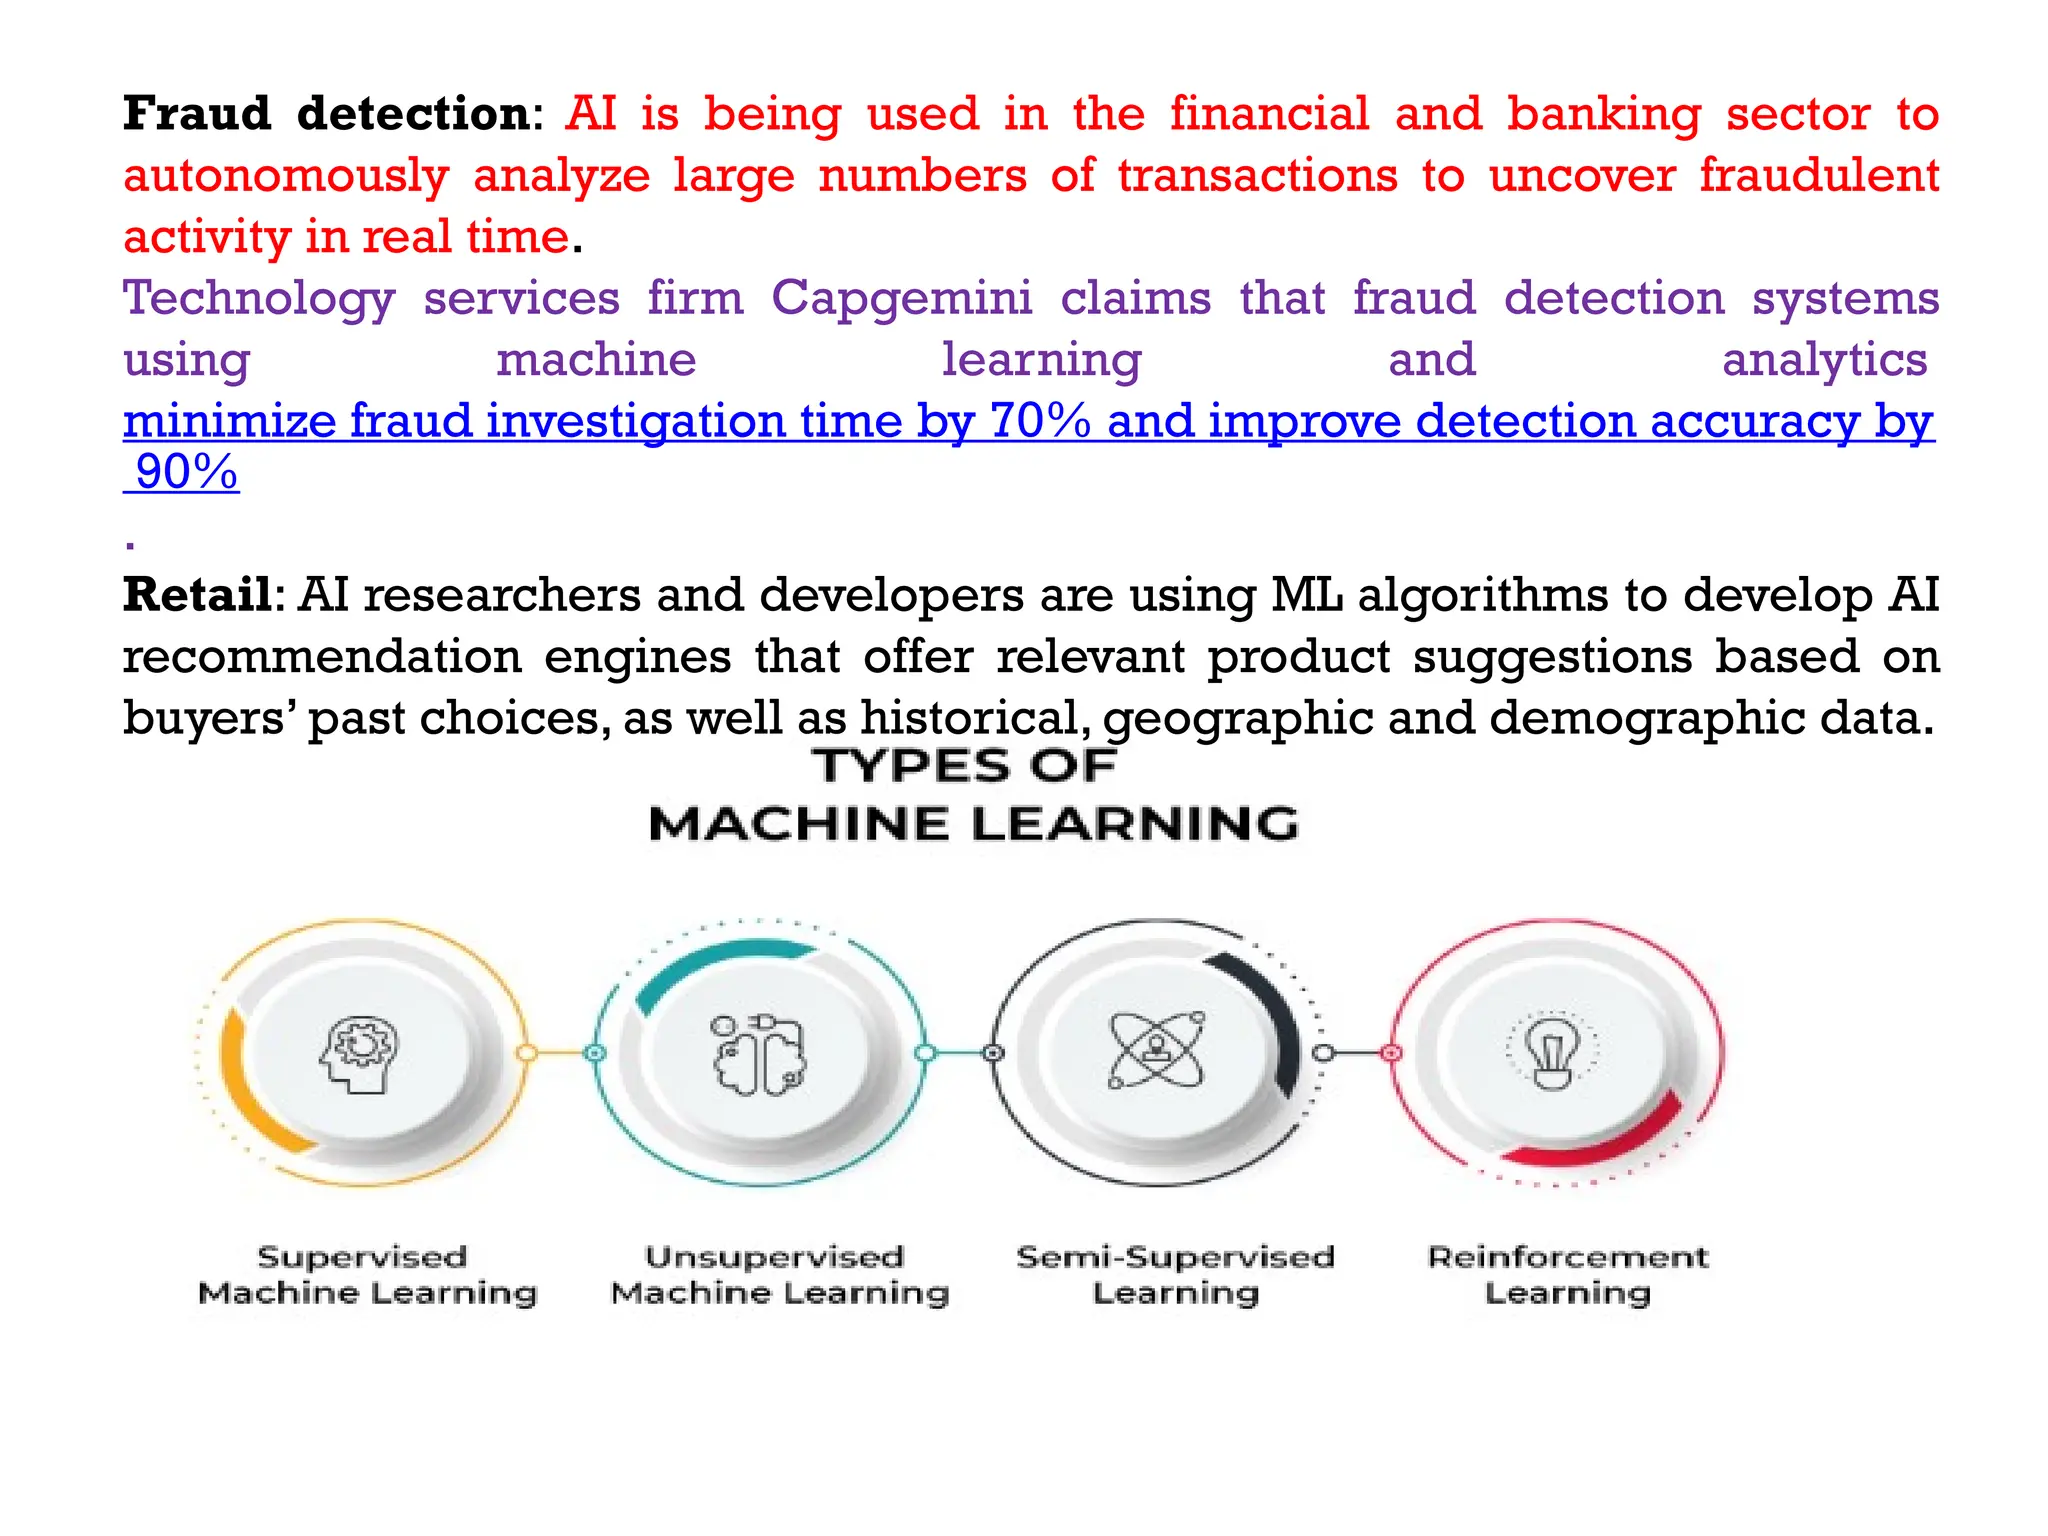
Unit-1
Machine Learning
• Vision of the Institute:
• To produce ethical, socially conscious and innovative professionals
who would contribute to sustainable technological development of
the society.
• Mission of the Institute:
To impart quality engineering education with latest
technological developments and interdisciplinary skills to
make students succeed in professional practice.
• To encourage research culture among faculty and students by
establishing state of art laboratories and exposing them to modern
industrial and organizational practices.
• To inculcate humane qualities like environmental
consciousness, leadership, social values, professional ethics
and engage in independent and lifelong learning for
sustainable contribution to the society.
• Vision of the Department:
•
• To become a leader in providing Computer Science and Engineering
education with emphasis on knowledge and innovation.
• Mission of the Department:
• To offer flexible programs of study with collaborations to suit
industry needs.
• To provide quality education and training through novel pedagogical
practices.
• To expedite high performance of excellence in teaching, research
and innovations.
• To impart moral, ethical values and education with social
responsibility.
Course Objectives
• To learn the concepts of machine learning and
types of learning along with evaluation metrics.
• To study various supervised learning
algorithms.
• To learn ensemble techniques and various
unsupervised learning algorithms.
• To explore Neural Networks and Deep learning
basics.
• To learn reinforcement learning and study
applications of machine learning.
Course Outcomes
• I . Extract features that can be used for a particular
machine learning approach in various applications.
• 2. Compare and contrast pros and cons of various
machine learning techniques and to get an insight
when to apply particular machine learning approach.
• 3. Understand different machine learning types along
with algorithms.
• 4. Understand how to apply machine learning in
various applications.
• 5. Apply ensemble techniques for improvement of
classifiers.
Co-PO Mapping
Course
Outcomes
(CO)
Program Outcomes (PO)
Program
Specific
Outcomes
(PSO’s)
PO
1
PO2 PO3 PO4 PO5 PO6 PO7 PO8 PO9 PO10 PO1
1
PO
12
PSO
1
PSO
2
Pso3
3PC610CS.1 3 3 2 2 - - - - - - - - 3 - -
3PC610CS.2 3 3 2 3 - - - - - 1 - 2 2 - -
3PC610CS.3 3 3 2 1 - - - - - 2 - 2 3 - -
3PC610CS.4 3 3 2 2 - - - - - 1 - 2 3 - -
3PC610CS.5 2 3 2 2 - - - - - 1 - 2 3 - -
What is Machine Learning?
• Machine Learning is concerned with computer
programs that automatically improve their
performance through experience.
• Machine learning is an application of AI that
enables systems to learn and improve from
experience without being explicitly
programmed.
• Machine learning focuses on developing
computer programs that can access data and
use it to learn for themselves.
Why is ML important?
• Machine learning is important because it gives
enterprises a view of trends in customer behavior and
operational business patterns, as well as supports
the development of new products.
• The term “machine learning” was coined by Arthur
Samuel, a computer scientist at IBM and a pioneer in
AI and computer gaming.
• Samuel designed a computer program for playing
checkers. The more the program played, the
more it learned from experience, using
algorithms to make predictions.
Why is ML important?
• machine learning explores the analysis and
construction of algorithms that can learn from and
make predictions on data.
• ML has proven valuable because it can solve
problems at a speed and scale that cannot be
duplicated by the human mind alone.
• With massive amounts of computational ability
behind a single task or multiple specific tasks,
• machines can be trained to identify patterns in and
relationships between input data and automate
routine processes.
Why is ML important?
• Data Is Key: The algorithms that drive machine learning are critical to
success.
• ML algorithms build a mathematical model based on sample data,
known as “training data,” to make predictions or decisions without being
explicitly programmed to do so.
• This can reveal trends within data that information businesses can use to
improve decision making, optimize efficiency and capture actionable
data at scale.
• AI Is the Goal: ML provides the foundation for AI systems that automate
processes and solve data-based business problems autonomously.
• It enables companies to replace or augment certain human capabilities.
• Common machine learning applications you may find in the real
world include chatbots, self-driving cars and speech recognition.
Applications of ML
• Data security: Machine learning models can identify data security
vulnerabilities before they can turn into breaches.
• By looking at past experiences, machine learning models can predict future
high-risk activities so risk can be proactively mitigated.
• Finance: Banks, trading brokerages and fintech firms use machine learning
algorithms to automate trading and to provide financial advisory services to
investors.
• Bank of America is using a chatbot, Erica, to automate customer support.
• Healthcare: ML is used to analyze massive healthcare data sets to accelerate
discovery of treatments and cures, improve patient outcomes, and
automate routine processes to prevent human error.
• For example, IBM’s Watson uses data mining to provide physicians data they
can use to personalize patient treatment.
Fraud detection: AI is being used in the financial and banking sector to
autonomously analyze large numbers of transactions to uncover fraudulent
activity in real time.
Technology services firm Capgemini claims that fraud detection systems
using machine learning and analytics
minimize fraud investigation time by 70% and improve detection accuracy by
90%
.
Retail: AI researchers and developers are using ML algorithms to develop AI
recommendation engines that offer relevant product suggestions based on
buyers’ past choices, as well as historical, geographic and demographic data.
Types of ML
• Supervised learning: We are given an input, for example a
photograph with a traffic sign, and the task is to predict the
correct output or label, for example which traffic sign is in the
picture (speed limit, stop sign, etc.).
• In the simplest cases, the answers are in the form of yes/no (we
call these binary classification problems).
• Unsupervised learning: There are no labels or correct outputs.
The task is to discover the structure of the data:
• for example, grouping similar items to form “clusters”, or
reducing the data to a small number of important
“dimensions”.
• Data visualization can also be considered unsupervised learning.
Types of ML
• Reinforcement learning: Commonly used in situations
where an AI agent like a self-driving car must operate
in an environment and where feedback about good or
bad choices is available with some delay.
• Also used in games where the outcome may be
decided only at the end of the game.
• The categories are somewhat overlapping and fuzzy, so
a particular method can sometimes be hard to place in
one category.
• For example, as the name suggests, so-
called semisupervised learning is partly
supervised and partly unsupervised.
Supervised Learning
Supervised learning is an approach to machine learning (ML) that
uses labeled datasets and correct outputs to train learning
algorithms how to classify data or predict an outcome.
• Supervised learning is useful for grouping
data into specific categories (classification)
and understanding the relationship between
variables in order to make predictions
(regression).
• It is used to provide product recommendations,
segment customers based on customer data,
diagnose disease based on previous
symptoms and perform many other tasks.
How supervised learning works?
• Supervised learning uses a training set to teach models to yield the desired output.
• This training dataset includes inputs and correct outputs, which allow the model to
learn over time.
• The algorithm measures its accuracy through the loss function, adjusting until the
error has been sufficiently minimized.
• Supervised learning can be separated into two types of problems when data
mining—classification and regression:
• Classification uses an algorithm to accurately assign test data into specific
categories.
• It recognizes specific entities within the dataset and attempts to draw some
conclusions on how those entities should be labeled or defined. Common
classification algorithms are linear classifiers, support vector machines (SVM),
decision trees, k-nearest neighbor, and random forest, which are described in more
detail below.
• Regression is used to understand the relationship between dependent and
independent variables.
• It is commonly used to make projections, such as for sales revenue for a given
business.
• Linear regression, logistical regression, and polynomial regression are popular
regression algorithms.
Classification
• Classification algorithms are used when the output
variable is categorical, which means there are two
classes such as Yes-No, Male-Female, True-false,
etc.
• Spam Filtering
• Random Forest
• Decision Trees
• Logistic Regression
• Support vector Machines
Unsupervised learning
• In Unsupervised Learning, the machine uses
unlabeled data and learns on itself without
any supervision.
• The machine tries to find a pattern in the
unlabeled data and gives a response.
• Unsupervised learning is a type of machine
learning in which models are trained using
unlabeled dataset and are allowed to act on that
data without any supervision.
1. Clustering
• Clustering is the method of dividing the objects into
clusters that are similar between them and are
dissimilar to the objects belonging to another
cluster.
• For example, finding out which customers made
similar product purchases.
example
• Suppose a telecom company wants to reduce its customer churn rate by
providing personalized call and data plans. The behavior of the
customers is studied and the model segments the customers with
similar traits. Several strategies are adopted to minimize churn rate and
maximize profit through suitable promotions and campaigns.
• On the right side of the image, you can see a graph where customers are
grouped.
• Group A customers use more data and also have high call durations.
• Group B customers are heavy Internet users, while Group C customers
have high call duration.
• So, Group B will be given more data benefit plants, while
• Group C will be given cheaper called call rate plans and group A
will be given the benefit of both.
2. Association - Unsupervised Learning
• Association is a rule-based machine learning to
discover the probability of the co-occurrence of items
in a collection. For example, finding out which
products were purchased together.
Supervised Learning
• It uses known and
labeled data as input.
• Supervised learning
model takes direct
feedback to check if it
is predicting correct
output or not.
• Supervised learning
model predicts the
output.
• In supervised learning,
input data is provided to
the model along with the
output.
Unsupervised Learning
• It uses unlabeled data as
input
• Unsupervised learning
model does not take
any feedback.
• Unsupervised learning
model finds the hidden
patterns in data.
• In unsupervised
learning, only input data
is provided to the model.
Supervised Learning
• Supervised learning
needs supervision to
train the model.
• Supervised learning can
be categorized
in Classification and Re
gression problems.
• The most commonly used
supervised learning
algorithms are:
• Decision tree
• Logistic regression
• Support vector machine
Unsupervised Learning
• Unsupervised learning
does not need any
supervision to train the
model.
• Unsupervised Learning
can be classified
in Clustering and Associ
ations problems.
• The most commonly used
unsupervised learning
algorithms are:
• K-means clustering
• Hierarchical clustering
• Apriori algorithm
Semi-Supervised Learning
• It utilizes both labeled and unlabeled data; in
this way, as the name suggests,
• it is a hybrid technique between supervised
and unsupervised learning.
example
• Let’s take one example from the below image to make
it clear.
• Suppose a bucket consists of three fruits , apple,
banana and orange.
• Someone captured the image of all the three but
labeled only the orange and banana images.
• Here, the model first will classify the new apple image
as not a banana and not orange.
• Then someone will observe these predictions and
label them as apples.
• Then retraining the model with that label will give it
the ability to classify apple images as an apple.
Examples of Semi-Supervised Learning
• Text classification: In text classification, the goal is to classify a
given text into one or more predefined categories.
• Semi-supervised learning can be used to train a text classification
model using a small amount of labeled data and a large
amount of unlabeled text data.
• Image classification: In image classification, the goal is to
classify a given image into one or more predefined categories.
Semi-supervised learning can be used to train an image
classification model using a small amount of labeled data and a
large amount of unlabeled image data.
• Semi-Supervised Support Vector Machines (S3VM): extends
traditional Support Vector Machines (SVM) to handle both labeled
and unlabeled data.
Types of Semi-Supervised Learning
• Self Training is the procedure in which we can take a supervised
method for classification or regression and modify it to work in a
semi-supervised manner, taking advantage of labeled and
unlabeled data
• Co-Training is derived from self-training approach and being
its improved version, it is used when only small portion of
labeled data is available. Unlike the typical process, co-training
trains two individual classifiers based on two views of data.
• The basic idea behind co-training is to train multiple models,
each on a different subset of features or views of the data,
and
• then use the predictions of one model to assist in the training
of the other model
Reinforcement Learning
• Reinforcement Learning is a
feedback-based Machine learning
technique in which an agent learns
to behave in an environment by
performing the actions and seeing
the results of actions.
• For each good action, the agent
gets positive feedback, and for
each bad action, the agent gets
negative feedback or penalty.
• Policy-based:
Policy-based approach is to find the optimal policy for the
maximum future rewards.
• In this approach, the agent tries to apply such a policy that the
action performed in each step helps to maximize the future
reward.
• Q-Learning is a Reinforcement learning policy that will find
the next best action, given a current state.
• It chooses this action at random and aims to maximize the reward.
Decision Trees
• Decision Tree algorithm belongs to the family of
supervised learning algorithms. Unlike other
supervised learning algorithms, the decision tree
algorithm can be used for solving regression
and classification problems too.
• The goal of using a Decision Tree is to create a
training model that can use to predict the class or
value of the target variable by learning simple
decision rules inferred from prior
data(training data).
Decision Tree
• In Decision Trees, for predicting a class label
for a record we start from the root of the tree.
• We compare the values of the root attribute
with the record’s attribute.
• On the basis of comparison, we follow the
branch corresponding to that value and
jump to the next node.
Important Terminology related to
Decision Trees
• Root Node: It represents the entire
population or sample and this further gets
divided into two or more homogeneous sets.
• Splitting: It is a process of dividing a node into
two or more sub-nodes.
• Decision Node: When a sub-node splits into
further sub-nodes, then it is called the decision
node.
• Leaf / Terminal Node: Nodes do not split is
called Leaf or Terminal node.
Important Terminology related to
Decision Trees
• Pruning: When we remove sub-nodes of
a decision node, this process is called
pruning.
• Branch / Sub-Tree: A subsection of the
entire tree is called branch or sub-tree.
• Parent and Child Node: A node, which is
divided into sub-nodes is called a parent
node of sub-nodes whereas sub-nodes
are the child of a parent node.
• Decision trees use multiple algorithms to
decide to split a node into two or more sub-
nodes.
• In other words, we can say that the purity of the
node increases with respect to the target
variable.
• The algorithm selection is also based on the
type of target variables. some algorithms used
in Decision Trees:
• ID3 (Iterative Dichotomiser 3)
→
CART (Classification And Regression Tree)
→
ID3 Algorithm
• The ID3 algorithm builds decision trees using a top-
down greedy search approach through the space of
possible branches with no backtracking.
• A greedy algorithm, as the name suggests, always
makes the choice that seems to be the best at that
moment.
• Steps in ID3 algorithm:
• It begins with the original set S as the root node.
• On each iteration of the algorithm, it iterates
through the very unused attribute of the set S
and calculates Entropy(H) and Information
gain(IG) of this attribute.
• It then selects the attribute which has the
smallest Entropy or Largest Information gain.
• The set S is then split by the selected attribute to
produce a subset of the data.
• The algorithm continues to recur on each subset,
considering only attributes never selected before.
• Attribute Selection Measures
• If the dataset consists of N attributes then
deciding which attribute to place at the root or
at different levels of the tree as internal nodes
is a complicated step.
• By just randomly selecting any node to be
the root can’t solve the issue.
• If we follow a random approach, it may give us
bad results with low accuracy.
• For solving this attribute selection problem,
suggested using some criteria like :
• Entropy,
Information gain,
• These criteria will calculate values for every
attribute.
• The values are sorted, and attributes are placed in
the tree by following the order i.e, the attribute with a
high value(in case of information gain) is placed at
the root.
• While using Information Gain as a criterion, we
assume attributes to be categorical, and for the
Gini index, attributes are assumed to be continuous.
• Entropy
• Entropy is a measure of the randomness in the
information being processed.
• It measures impurity or uncertainty in group of
observations.
• The higher the entropy, the harder it is to draw any
conclusions from that information.
• Flipping a coin is an example of an action that provides
information that is random.
• From the above graph, it is quite evident that the
entropy H(X) is zero when the probability is either 0
or 1.
• The Entropy is maximum when the probability is 0.5
because it projects perfect randomness in the data and
there is no chance of perfectly determining the
outcome.
• ID3 follows the rule — A branch with an entropy of
zero is a leaf node and A brach with entropy more
than zero needs further splitting.
• Mathematically Entropy for 1 attribute is represented
as:
Where S Current state, and Pi Probability of an event
→ → i of state S or
Percentage of class i in a node of state S.
Probability that the situation is play = 9 / 14
Probability that the situation not to play = 5 / 14
Calculating the Entropy for one attribute,
Entropy(Play Golf) = Entropy(5, 9)
= Entropy(5/14, 9/14) =
Entropy(0.36, 0.64)
= -(0.36 log2 0.36) – (0.64 log2 0.64)
= 0.94
where T Current state and X
→ →
Selected attribute
Calculating the Entropy for more than one attribute,
E(T, X) = ∑ P(c) E(c)
E(PlayGolf, Outlook) = P(Sunny)*E(3,2) +
P(Overcast)*E(4,0) + P(Rainy)*E(2,3)
= (5/14) * 0.971 + (4/14) * 0 +
(5/14) * 0.971 = 0.693
Information Gain
Information gain or IG measures how well a given attribute separates the
training examples according to their target classification.
Constructing a decision tree is all about finding an attribute that returns
the highest information gain and the smallest entropy.
Information gain computes the difference between entropy before split and
average entropy after split of the dataset based on given attribute values.
ID3 (Iterative Dichotomiser) decision tree algorithm uses information
gain.
• After calculating information gain for all
attributes:
• Gain(S,Outlook)= 0.2464,
Gain(S,Temperature)= 0.0289
Gain(S,Humidity)=0.1516
• Gain(S,Wind) =0.0478
• We can clearly see that IG(S, Outlook) has the
highest information gain of 0.246, hence we
chose Outlook attribute as the root node. At
this point, the decision tree looks like.
• Here we observe that whenever the outlook is
Overcast, Play Golf is always ‘Yes’
• the simple tree resulted because of the highest
information gain is given by the attribute Outlook.
•  Now how do we proceed from this point? We can
simply apply recursion.
•  Now that we’ve used Outlook, we’ve got three of
them remaining Humidity, Temperature, and
Wind. And, we had three possible values of Outlook:
Sunny, Overcast, Rain.
•  Where the Overcast node already ended up
having leaf node ‘Yes’, so we’re left with two
subtrees to compute: Sunny and Rain.
Inductive learning
•  Inductive learning also known as discovery
learning, is a process where the learner discovers
rules by observing examples.
•  We can often work out rules for ourselves by
observing examples. If there is a pattern; then
record it.
•  We then apply the rule in different situations to
see if it works.
•  With inductive language learning, tasks are
designed specifically to guide the learner and
assist them in discovering a rule.
•  Inductive learning: System tries to
make a “general rule” from a set of
observed instances.
•  Example:
• Mango f(Mango) -> sweet (e1)
→
• Banana f(Banana) -> sweet (e2) …..
→
• Fruits f(Fruits) sweet (general
→ →
rule)
Example
• Suppose an example set having attributes -
Place type, weather, location, decision and
seven examples.
•  Our task is to generate a set of rules that
under what condition what is the decision.
• at iteration 1
• row 3 & 4 column weather is selected and row 3 & 4 are marked.
• the rule is added to R IF weather is warm then a decision is yes.
•  at iteration 2
• row 1 column place type is selected and row 1 is marked.
• the rule is added to R IF place type is hilly then the decision is
yes.
•  at iteration 3
• row 2 column location is selected and row 2 is marked.
• the rule is added to R IF location is Shimla then the decision
is yes.
•  at iteration 4
• row 5&6 column location is selected and row 5&6 are marked.
• the rule is added to R IF location is Mumbai then a decision is no.
•  at iteration 5
• row 7 column place type & the weather is selected and row 7 is
marked. rule is added to R IF place type is beach AND
weather is windy then the decision is no.
machine learning introduction notes foRr

machine learning introduction notes foRr

  • 1.
  • 2.
    • Vision ofthe Institute: • To produce ethical, socially conscious and innovative professionals who would contribute to sustainable technological development of the society. • Mission of the Institute: To impart quality engineering education with latest technological developments and interdisciplinary skills to make students succeed in professional practice. • To encourage research culture among faculty and students by establishing state of art laboratories and exposing them to modern industrial and organizational practices. • To inculcate humane qualities like environmental consciousness, leadership, social values, professional ethics and engage in independent and lifelong learning for sustainable contribution to the society.
  • 3.
    • Vision ofthe Department: • • To become a leader in providing Computer Science and Engineering education with emphasis on knowledge and innovation. • Mission of the Department: • To offer flexible programs of study with collaborations to suit industry needs. • To provide quality education and training through novel pedagogical practices. • To expedite high performance of excellence in teaching, research and innovations. • To impart moral, ethical values and education with social responsibility.
  • 4.
    Course Objectives • Tolearn the concepts of machine learning and types of learning along with evaluation metrics. • To study various supervised learning algorithms. • To learn ensemble techniques and various unsupervised learning algorithms. • To explore Neural Networks and Deep learning basics. • To learn reinforcement learning and study applications of machine learning.
  • 5.
    Course Outcomes • I. Extract features that can be used for a particular machine learning approach in various applications. • 2. Compare and contrast pros and cons of various machine learning techniques and to get an insight when to apply particular machine learning approach. • 3. Understand different machine learning types along with algorithms. • 4. Understand how to apply machine learning in various applications. • 5. Apply ensemble techniques for improvement of classifiers.
  • 6.
    Co-PO Mapping Course Outcomes (CO) Program Outcomes(PO) Program Specific Outcomes (PSO’s) PO 1 PO2 PO3 PO4 PO5 PO6 PO7 PO8 PO9 PO10 PO1 1 PO 12 PSO 1 PSO 2 Pso3 3PC610CS.1 3 3 2 2 - - - - - - - - 3 - - 3PC610CS.2 3 3 2 3 - - - - - 1 - 2 2 - - 3PC610CS.3 3 3 2 1 - - - - - 2 - 2 3 - - 3PC610CS.4 3 3 2 2 - - - - - 1 - 2 3 - - 3PC610CS.5 2 3 2 2 - - - - - 1 - 2 3 - -
  • 7.
    What is MachineLearning? • Machine Learning is concerned with computer programs that automatically improve their performance through experience. • Machine learning is an application of AI that enables systems to learn and improve from experience without being explicitly programmed. • Machine learning focuses on developing computer programs that can access data and use it to learn for themselves.
  • 8.
    Why is MLimportant? • Machine learning is important because it gives enterprises a view of trends in customer behavior and operational business patterns, as well as supports the development of new products. • The term “machine learning” was coined by Arthur Samuel, a computer scientist at IBM and a pioneer in AI and computer gaming. • Samuel designed a computer program for playing checkers. The more the program played, the more it learned from experience, using algorithms to make predictions.
  • 9.
    Why is MLimportant? • machine learning explores the analysis and construction of algorithms that can learn from and make predictions on data. • ML has proven valuable because it can solve problems at a speed and scale that cannot be duplicated by the human mind alone. • With massive amounts of computational ability behind a single task or multiple specific tasks, • machines can be trained to identify patterns in and relationships between input data and automate routine processes.
  • 10.
    Why is MLimportant? • Data Is Key: The algorithms that drive machine learning are critical to success. • ML algorithms build a mathematical model based on sample data, known as “training data,” to make predictions or decisions without being explicitly programmed to do so. • This can reveal trends within data that information businesses can use to improve decision making, optimize efficiency and capture actionable data at scale. • AI Is the Goal: ML provides the foundation for AI systems that automate processes and solve data-based business problems autonomously. • It enables companies to replace or augment certain human capabilities. • Common machine learning applications you may find in the real world include chatbots, self-driving cars and speech recognition.
  • 11.
    Applications of ML •Data security: Machine learning models can identify data security vulnerabilities before they can turn into breaches. • By looking at past experiences, machine learning models can predict future high-risk activities so risk can be proactively mitigated. • Finance: Banks, trading brokerages and fintech firms use machine learning algorithms to automate trading and to provide financial advisory services to investors. • Bank of America is using a chatbot, Erica, to automate customer support. • Healthcare: ML is used to analyze massive healthcare data sets to accelerate discovery of treatments and cures, improve patient outcomes, and automate routine processes to prevent human error. • For example, IBM’s Watson uses data mining to provide physicians data they can use to personalize patient treatment.
  • 12.
    Fraud detection: AIis being used in the financial and banking sector to autonomously analyze large numbers of transactions to uncover fraudulent activity in real time. Technology services firm Capgemini claims that fraud detection systems using machine learning and analytics minimize fraud investigation time by 70% and improve detection accuracy by 90% . Retail: AI researchers and developers are using ML algorithms to develop AI recommendation engines that offer relevant product suggestions based on buyers’ past choices, as well as historical, geographic and demographic data.
  • 13.
    Types of ML •Supervised learning: We are given an input, for example a photograph with a traffic sign, and the task is to predict the correct output or label, for example which traffic sign is in the picture (speed limit, stop sign, etc.). • In the simplest cases, the answers are in the form of yes/no (we call these binary classification problems). • Unsupervised learning: There are no labels or correct outputs. The task is to discover the structure of the data: • for example, grouping similar items to form “clusters”, or reducing the data to a small number of important “dimensions”. • Data visualization can also be considered unsupervised learning.
  • 14.
    Types of ML •Reinforcement learning: Commonly used in situations where an AI agent like a self-driving car must operate in an environment and where feedback about good or bad choices is available with some delay. • Also used in games where the outcome may be decided only at the end of the game. • The categories are somewhat overlapping and fuzzy, so a particular method can sometimes be hard to place in one category. • For example, as the name suggests, so- called semisupervised learning is partly supervised and partly unsupervised.
  • 15.
    Supervised Learning Supervised learningis an approach to machine learning (ML) that uses labeled datasets and correct outputs to train learning algorithms how to classify data or predict an outcome.
  • 16.
    • Supervised learningis useful for grouping data into specific categories (classification) and understanding the relationship between variables in order to make predictions (regression). • It is used to provide product recommendations, segment customers based on customer data, diagnose disease based on previous symptoms and perform many other tasks.
  • 17.
    How supervised learningworks? • Supervised learning uses a training set to teach models to yield the desired output. • This training dataset includes inputs and correct outputs, which allow the model to learn over time. • The algorithm measures its accuracy through the loss function, adjusting until the error has been sufficiently minimized. • Supervised learning can be separated into two types of problems when data mining—classification and regression: • Classification uses an algorithm to accurately assign test data into specific categories. • It recognizes specific entities within the dataset and attempts to draw some conclusions on how those entities should be labeled or defined. Common classification algorithms are linear classifiers, support vector machines (SVM), decision trees, k-nearest neighbor, and random forest, which are described in more detail below. • Regression is used to understand the relationship between dependent and independent variables. • It is commonly used to make projections, such as for sales revenue for a given business. • Linear regression, logistical regression, and polynomial regression are popular regression algorithms.
  • 18.
    Classification • Classification algorithmsare used when the output variable is categorical, which means there are two classes such as Yes-No, Male-Female, True-false, etc. • Spam Filtering • Random Forest • Decision Trees • Logistic Regression • Support vector Machines
  • 19.
    Unsupervised learning • InUnsupervised Learning, the machine uses unlabeled data and learns on itself without any supervision. • The machine tries to find a pattern in the unlabeled data and gives a response. • Unsupervised learning is a type of machine learning in which models are trained using unlabeled dataset and are allowed to act on that data without any supervision.
  • 21.
    1. Clustering • Clusteringis the method of dividing the objects into clusters that are similar between them and are dissimilar to the objects belonging to another cluster. • For example, finding out which customers made similar product purchases.
  • 22.
    example • Suppose atelecom company wants to reduce its customer churn rate by providing personalized call and data plans. The behavior of the customers is studied and the model segments the customers with similar traits. Several strategies are adopted to minimize churn rate and maximize profit through suitable promotions and campaigns. • On the right side of the image, you can see a graph where customers are grouped. • Group A customers use more data and also have high call durations. • Group B customers are heavy Internet users, while Group C customers have high call duration. • So, Group B will be given more data benefit plants, while • Group C will be given cheaper called call rate plans and group A will be given the benefit of both.
  • 23.
    2. Association -Unsupervised Learning • Association is a rule-based machine learning to discover the probability of the co-occurrence of items in a collection. For example, finding out which products were purchased together.
  • 24.
    Supervised Learning • Ituses known and labeled data as input. • Supervised learning model takes direct feedback to check if it is predicting correct output or not. • Supervised learning model predicts the output. • In supervised learning, input data is provided to the model along with the output. Unsupervised Learning • It uses unlabeled data as input • Unsupervised learning model does not take any feedback. • Unsupervised learning model finds the hidden patterns in data. • In unsupervised learning, only input data is provided to the model.
  • 25.
    Supervised Learning • Supervisedlearning needs supervision to train the model. • Supervised learning can be categorized in Classification and Re gression problems. • The most commonly used supervised learning algorithms are: • Decision tree • Logistic regression • Support vector machine Unsupervised Learning • Unsupervised learning does not need any supervision to train the model. • Unsupervised Learning can be classified in Clustering and Associ ations problems. • The most commonly used unsupervised learning algorithms are: • K-means clustering • Hierarchical clustering • Apriori algorithm
  • 26.
    Semi-Supervised Learning • Itutilizes both labeled and unlabeled data; in this way, as the name suggests, • it is a hybrid technique between supervised and unsupervised learning.
  • 27.
    example • Let’s takeone example from the below image to make it clear. • Suppose a bucket consists of three fruits , apple, banana and orange. • Someone captured the image of all the three but labeled only the orange and banana images. • Here, the model first will classify the new apple image as not a banana and not orange. • Then someone will observe these predictions and label them as apples. • Then retraining the model with that label will give it the ability to classify apple images as an apple.
  • 28.
    Examples of Semi-SupervisedLearning • Text classification: In text classification, the goal is to classify a given text into one or more predefined categories. • Semi-supervised learning can be used to train a text classification model using a small amount of labeled data and a large amount of unlabeled text data. • Image classification: In image classification, the goal is to classify a given image into one or more predefined categories. Semi-supervised learning can be used to train an image classification model using a small amount of labeled data and a large amount of unlabeled image data. • Semi-Supervised Support Vector Machines (S3VM): extends traditional Support Vector Machines (SVM) to handle both labeled and unlabeled data.
  • 29.
    Types of Semi-SupervisedLearning • Self Training is the procedure in which we can take a supervised method for classification or regression and modify it to work in a semi-supervised manner, taking advantage of labeled and unlabeled data • Co-Training is derived from self-training approach and being its improved version, it is used when only small portion of labeled data is available. Unlike the typical process, co-training trains two individual classifiers based on two views of data. • The basic idea behind co-training is to train multiple models, each on a different subset of features or views of the data, and • then use the predictions of one model to assist in the training of the other model
  • 30.
    Reinforcement Learning • ReinforcementLearning is a feedback-based Machine learning technique in which an agent learns to behave in an environment by performing the actions and seeing the results of actions. • For each good action, the agent gets positive feedback, and for each bad action, the agent gets negative feedback or penalty.
  • 31.
    • Policy-based: Policy-based approachis to find the optimal policy for the maximum future rewards. • In this approach, the agent tries to apply such a policy that the action performed in each step helps to maximize the future reward. • Q-Learning is a Reinforcement learning policy that will find the next best action, given a current state. • It chooses this action at random and aims to maximize the reward.
  • 32.
    Decision Trees • DecisionTree algorithm belongs to the family of supervised learning algorithms. Unlike other supervised learning algorithms, the decision tree algorithm can be used for solving regression and classification problems too. • The goal of using a Decision Tree is to create a training model that can use to predict the class or value of the target variable by learning simple decision rules inferred from prior data(training data).
  • 33.
    Decision Tree • InDecision Trees, for predicting a class label for a record we start from the root of the tree. • We compare the values of the root attribute with the record’s attribute. • On the basis of comparison, we follow the branch corresponding to that value and jump to the next node.
  • 35.
    Important Terminology relatedto Decision Trees • Root Node: It represents the entire population or sample and this further gets divided into two or more homogeneous sets. • Splitting: It is a process of dividing a node into two or more sub-nodes. • Decision Node: When a sub-node splits into further sub-nodes, then it is called the decision node. • Leaf / Terminal Node: Nodes do not split is called Leaf or Terminal node.
  • 37.
    Important Terminology relatedto Decision Trees • Pruning: When we remove sub-nodes of a decision node, this process is called pruning. • Branch / Sub-Tree: A subsection of the entire tree is called branch or sub-tree. • Parent and Child Node: A node, which is divided into sub-nodes is called a parent node of sub-nodes whereas sub-nodes are the child of a parent node.
  • 38.
    • Decision treesuse multiple algorithms to decide to split a node into two or more sub- nodes. • In other words, we can say that the purity of the node increases with respect to the target variable. • The algorithm selection is also based on the type of target variables. some algorithms used in Decision Trees: • ID3 (Iterative Dichotomiser 3) → CART (Classification And Regression Tree) →
  • 39.
    ID3 Algorithm • TheID3 algorithm builds decision trees using a top- down greedy search approach through the space of possible branches with no backtracking. • A greedy algorithm, as the name suggests, always makes the choice that seems to be the best at that moment.
  • 40.
    • Steps inID3 algorithm: • It begins with the original set S as the root node. • On each iteration of the algorithm, it iterates through the very unused attribute of the set S and calculates Entropy(H) and Information gain(IG) of this attribute. • It then selects the attribute which has the smallest Entropy or Largest Information gain. • The set S is then split by the selected attribute to produce a subset of the data. • The algorithm continues to recur on each subset, considering only attributes never selected before.
  • 41.
    • Attribute SelectionMeasures • If the dataset consists of N attributes then deciding which attribute to place at the root or at different levels of the tree as internal nodes is a complicated step. • By just randomly selecting any node to be the root can’t solve the issue. • If we follow a random approach, it may give us bad results with low accuracy.
  • 42.
    • For solvingthis attribute selection problem, suggested using some criteria like : • Entropy, Information gain, • These criteria will calculate values for every attribute. • The values are sorted, and attributes are placed in the tree by following the order i.e, the attribute with a high value(in case of information gain) is placed at the root. • While using Information Gain as a criterion, we assume attributes to be categorical, and for the Gini index, attributes are assumed to be continuous.
  • 43.
    • Entropy • Entropyis a measure of the randomness in the information being processed. • It measures impurity or uncertainty in group of observations. • The higher the entropy, the harder it is to draw any conclusions from that information. • Flipping a coin is an example of an action that provides information that is random.
  • 44.
    • From theabove graph, it is quite evident that the entropy H(X) is zero when the probability is either 0 or 1. • The Entropy is maximum when the probability is 0.5 because it projects perfect randomness in the data and there is no chance of perfectly determining the outcome. • ID3 follows the rule — A branch with an entropy of zero is a leaf node and A brach with entropy more than zero needs further splitting. • Mathematically Entropy for 1 attribute is represented as:
  • 46.
    Where S Currentstate, and Pi Probability of an event → → i of state S or Percentage of class i in a node of state S. Probability that the situation is play = 9 / 14 Probability that the situation not to play = 5 / 14 Calculating the Entropy for one attribute, Entropy(Play Golf) = Entropy(5, 9) = Entropy(5/14, 9/14) = Entropy(0.36, 0.64) = -(0.36 log2 0.36) – (0.64 log2 0.64) = 0.94
  • 47.
    where T Currentstate and X → → Selected attribute
  • 48.
    Calculating the Entropyfor more than one attribute, E(T, X) = ∑ P(c) E(c) E(PlayGolf, Outlook) = P(Sunny)*E(3,2) + P(Overcast)*E(4,0) + P(Rainy)*E(2,3) = (5/14) * 0.971 + (4/14) * 0 + (5/14) * 0.971 = 0.693 Information Gain Information gain or IG measures how well a given attribute separates the training examples according to their target classification. Constructing a decision tree is all about finding an attribute that returns the highest information gain and the smallest entropy. Information gain computes the difference between entropy before split and average entropy after split of the dataset based on given attribute values. ID3 (Iterative Dichotomiser) decision tree algorithm uses information gain.
  • 51.
    • After calculatinginformation gain for all attributes: • Gain(S,Outlook)= 0.2464, Gain(S,Temperature)= 0.0289 Gain(S,Humidity)=0.1516 • Gain(S,Wind) =0.0478 • We can clearly see that IG(S, Outlook) has the highest information gain of 0.246, hence we chose Outlook attribute as the root node. At this point, the decision tree looks like.
  • 52.
    • Here weobserve that whenever the outlook is Overcast, Play Golf is always ‘Yes’ • the simple tree resulted because of the highest information gain is given by the attribute Outlook. •  Now how do we proceed from this point? We can simply apply recursion. •  Now that we’ve used Outlook, we’ve got three of them remaining Humidity, Temperature, and Wind. And, we had three possible values of Outlook: Sunny, Overcast, Rain. •  Where the Overcast node already ended up having leaf node ‘Yes’, so we’re left with two subtrees to compute: Sunny and Rain.
  • 56.
    Inductive learning • Inductive learning also known as discovery learning, is a process where the learner discovers rules by observing examples. •  We can often work out rules for ourselves by observing examples. If there is a pattern; then record it. •  We then apply the rule in different situations to see if it works. •  With inductive language learning, tasks are designed specifically to guide the learner and assist them in discovering a rule.
  • 57.
    •  Inductivelearning: System tries to make a “general rule” from a set of observed instances. •  Example: • Mango f(Mango) -> sweet (e1) → • Banana f(Banana) -> sweet (e2) ….. → • Fruits f(Fruits) sweet (general → → rule)
  • 58.
    Example • Suppose anexample set having attributes - Place type, weather, location, decision and seven examples. •  Our task is to generate a set of rules that under what condition what is the decision.
  • 60.
    • at iteration1 • row 3 & 4 column weather is selected and row 3 & 4 are marked. • the rule is added to R IF weather is warm then a decision is yes. •  at iteration 2 • row 1 column place type is selected and row 1 is marked. • the rule is added to R IF place type is hilly then the decision is yes. •  at iteration 3 • row 2 column location is selected and row 2 is marked. • the rule is added to R IF location is Shimla then the decision is yes. •  at iteration 4 • row 5&6 column location is selected and row 5&6 are marked. • the rule is added to R IF location is Mumbai then a decision is no. •  at iteration 5 • row 7 column place type & the weather is selected and row 7 is marked. rule is added to R IF place type is beach AND weather is windy then the decision is no.