Download to read offline
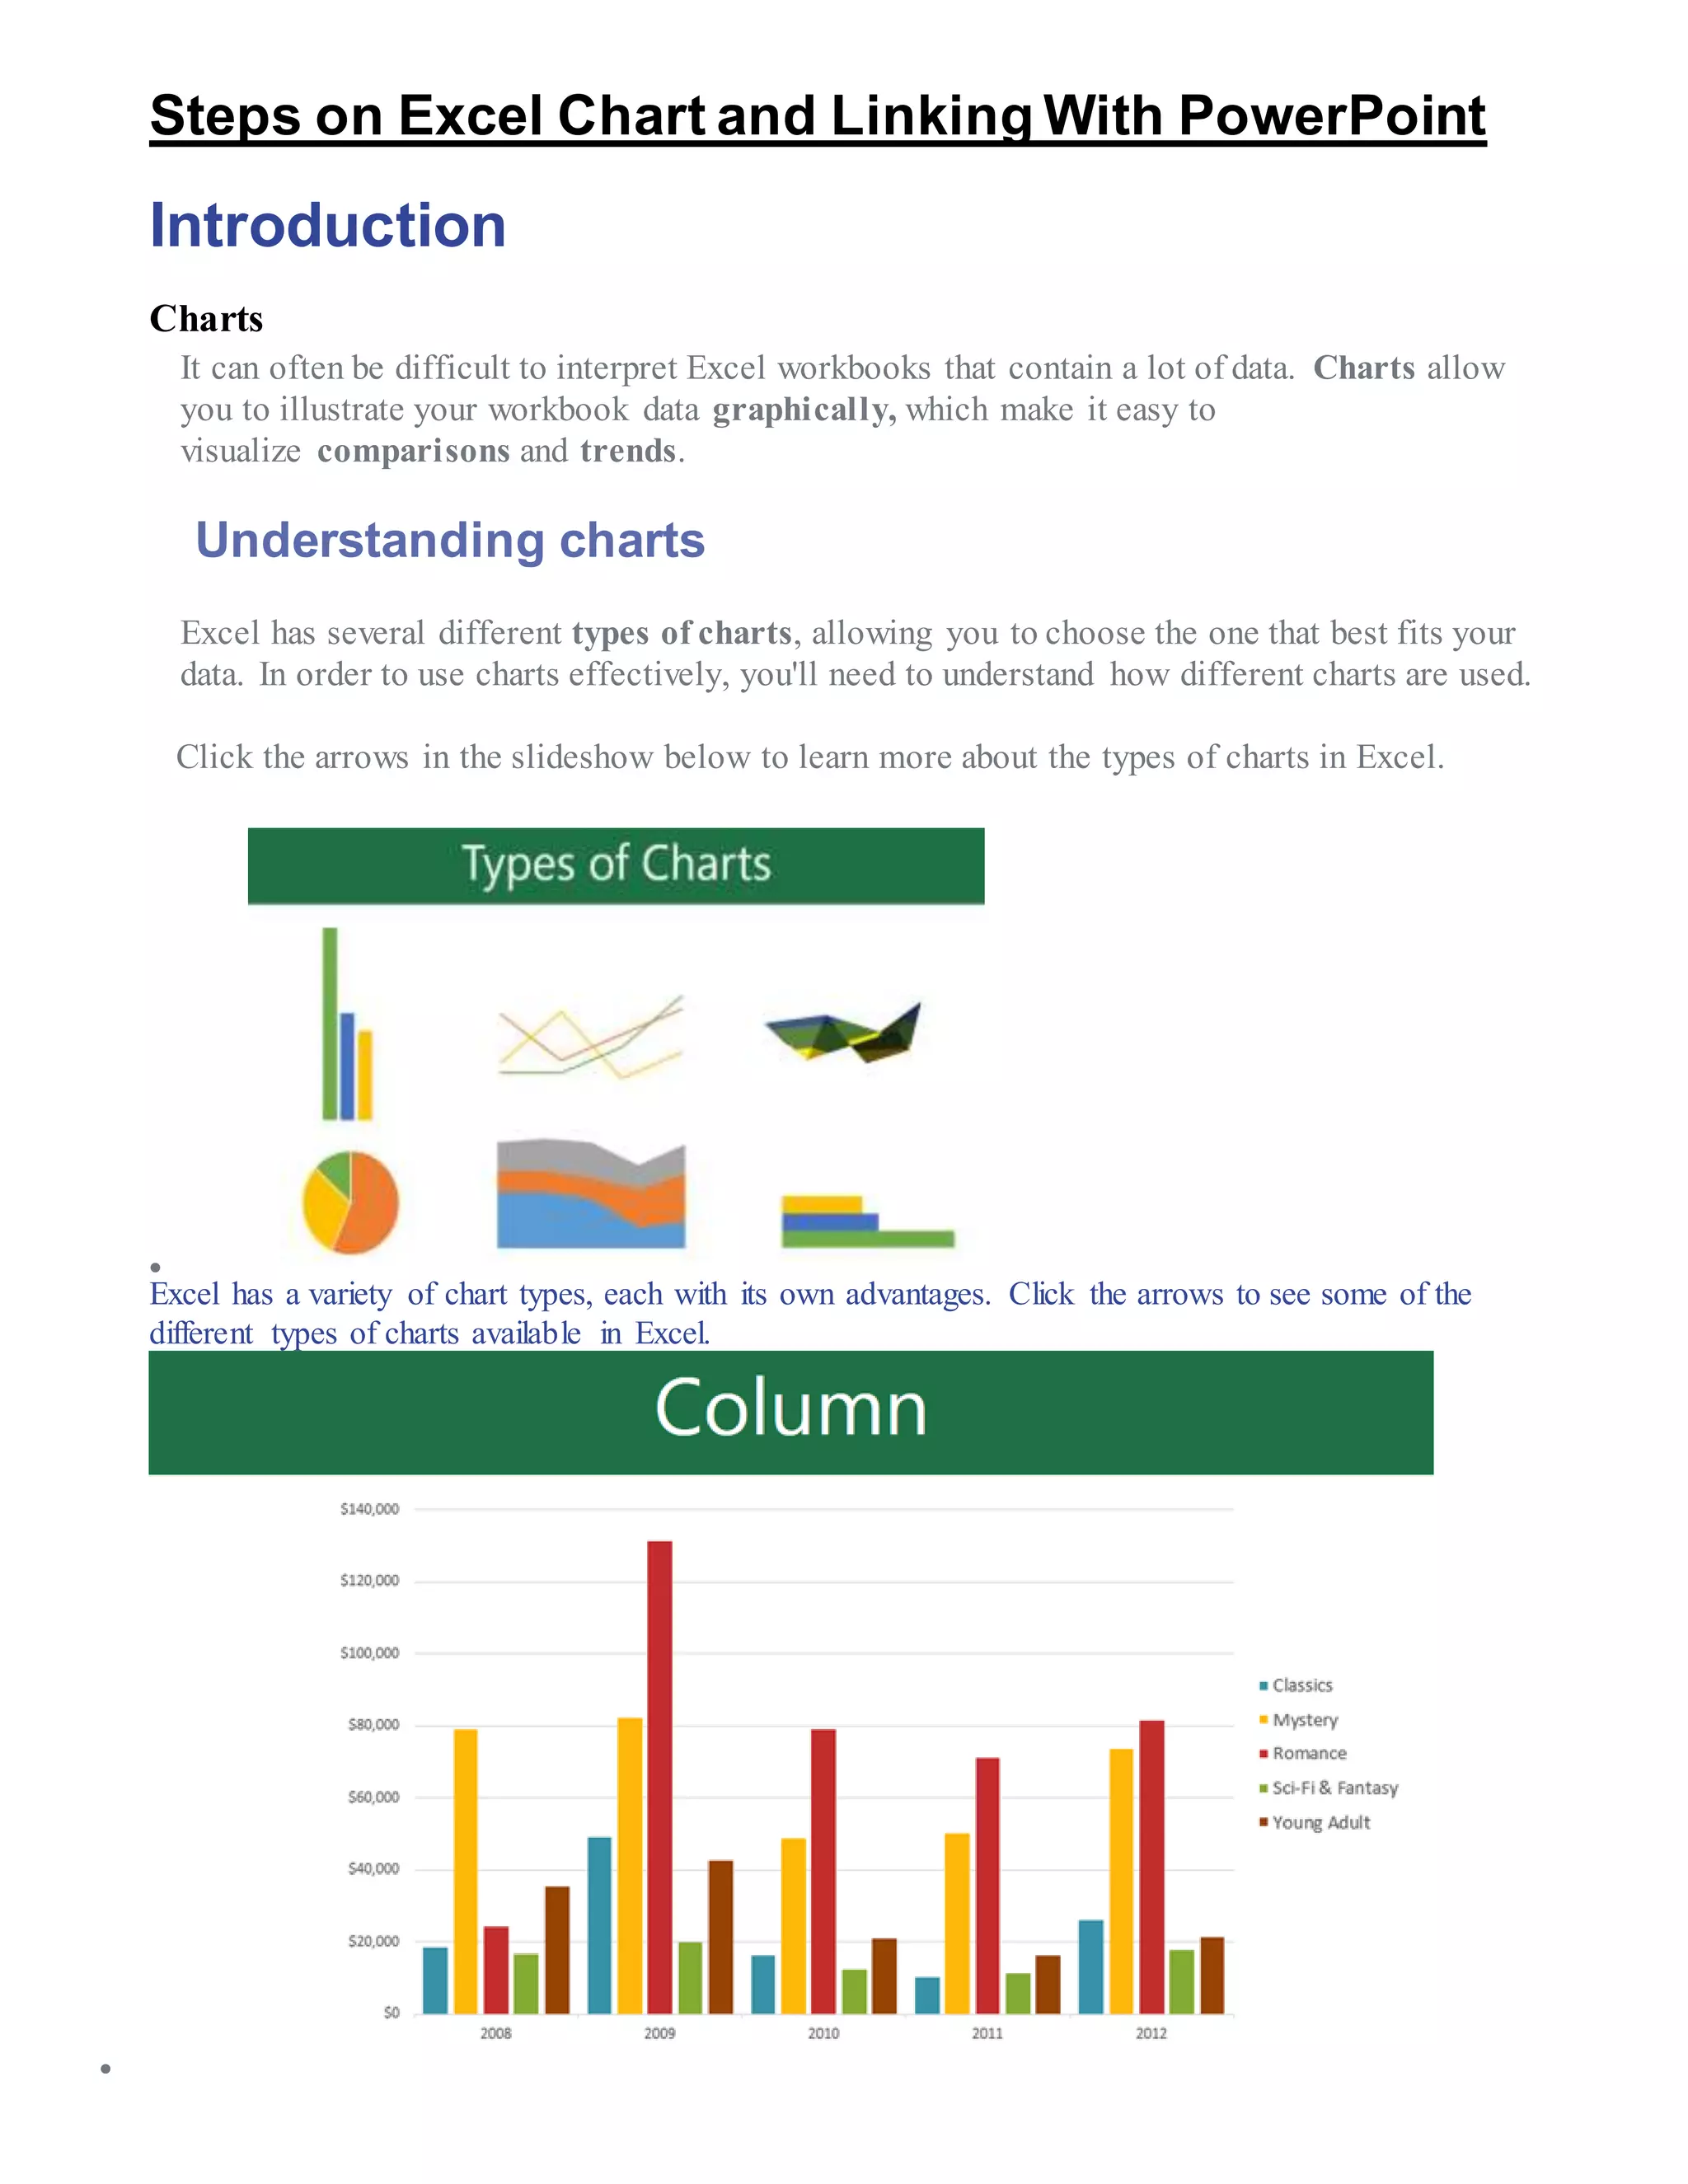
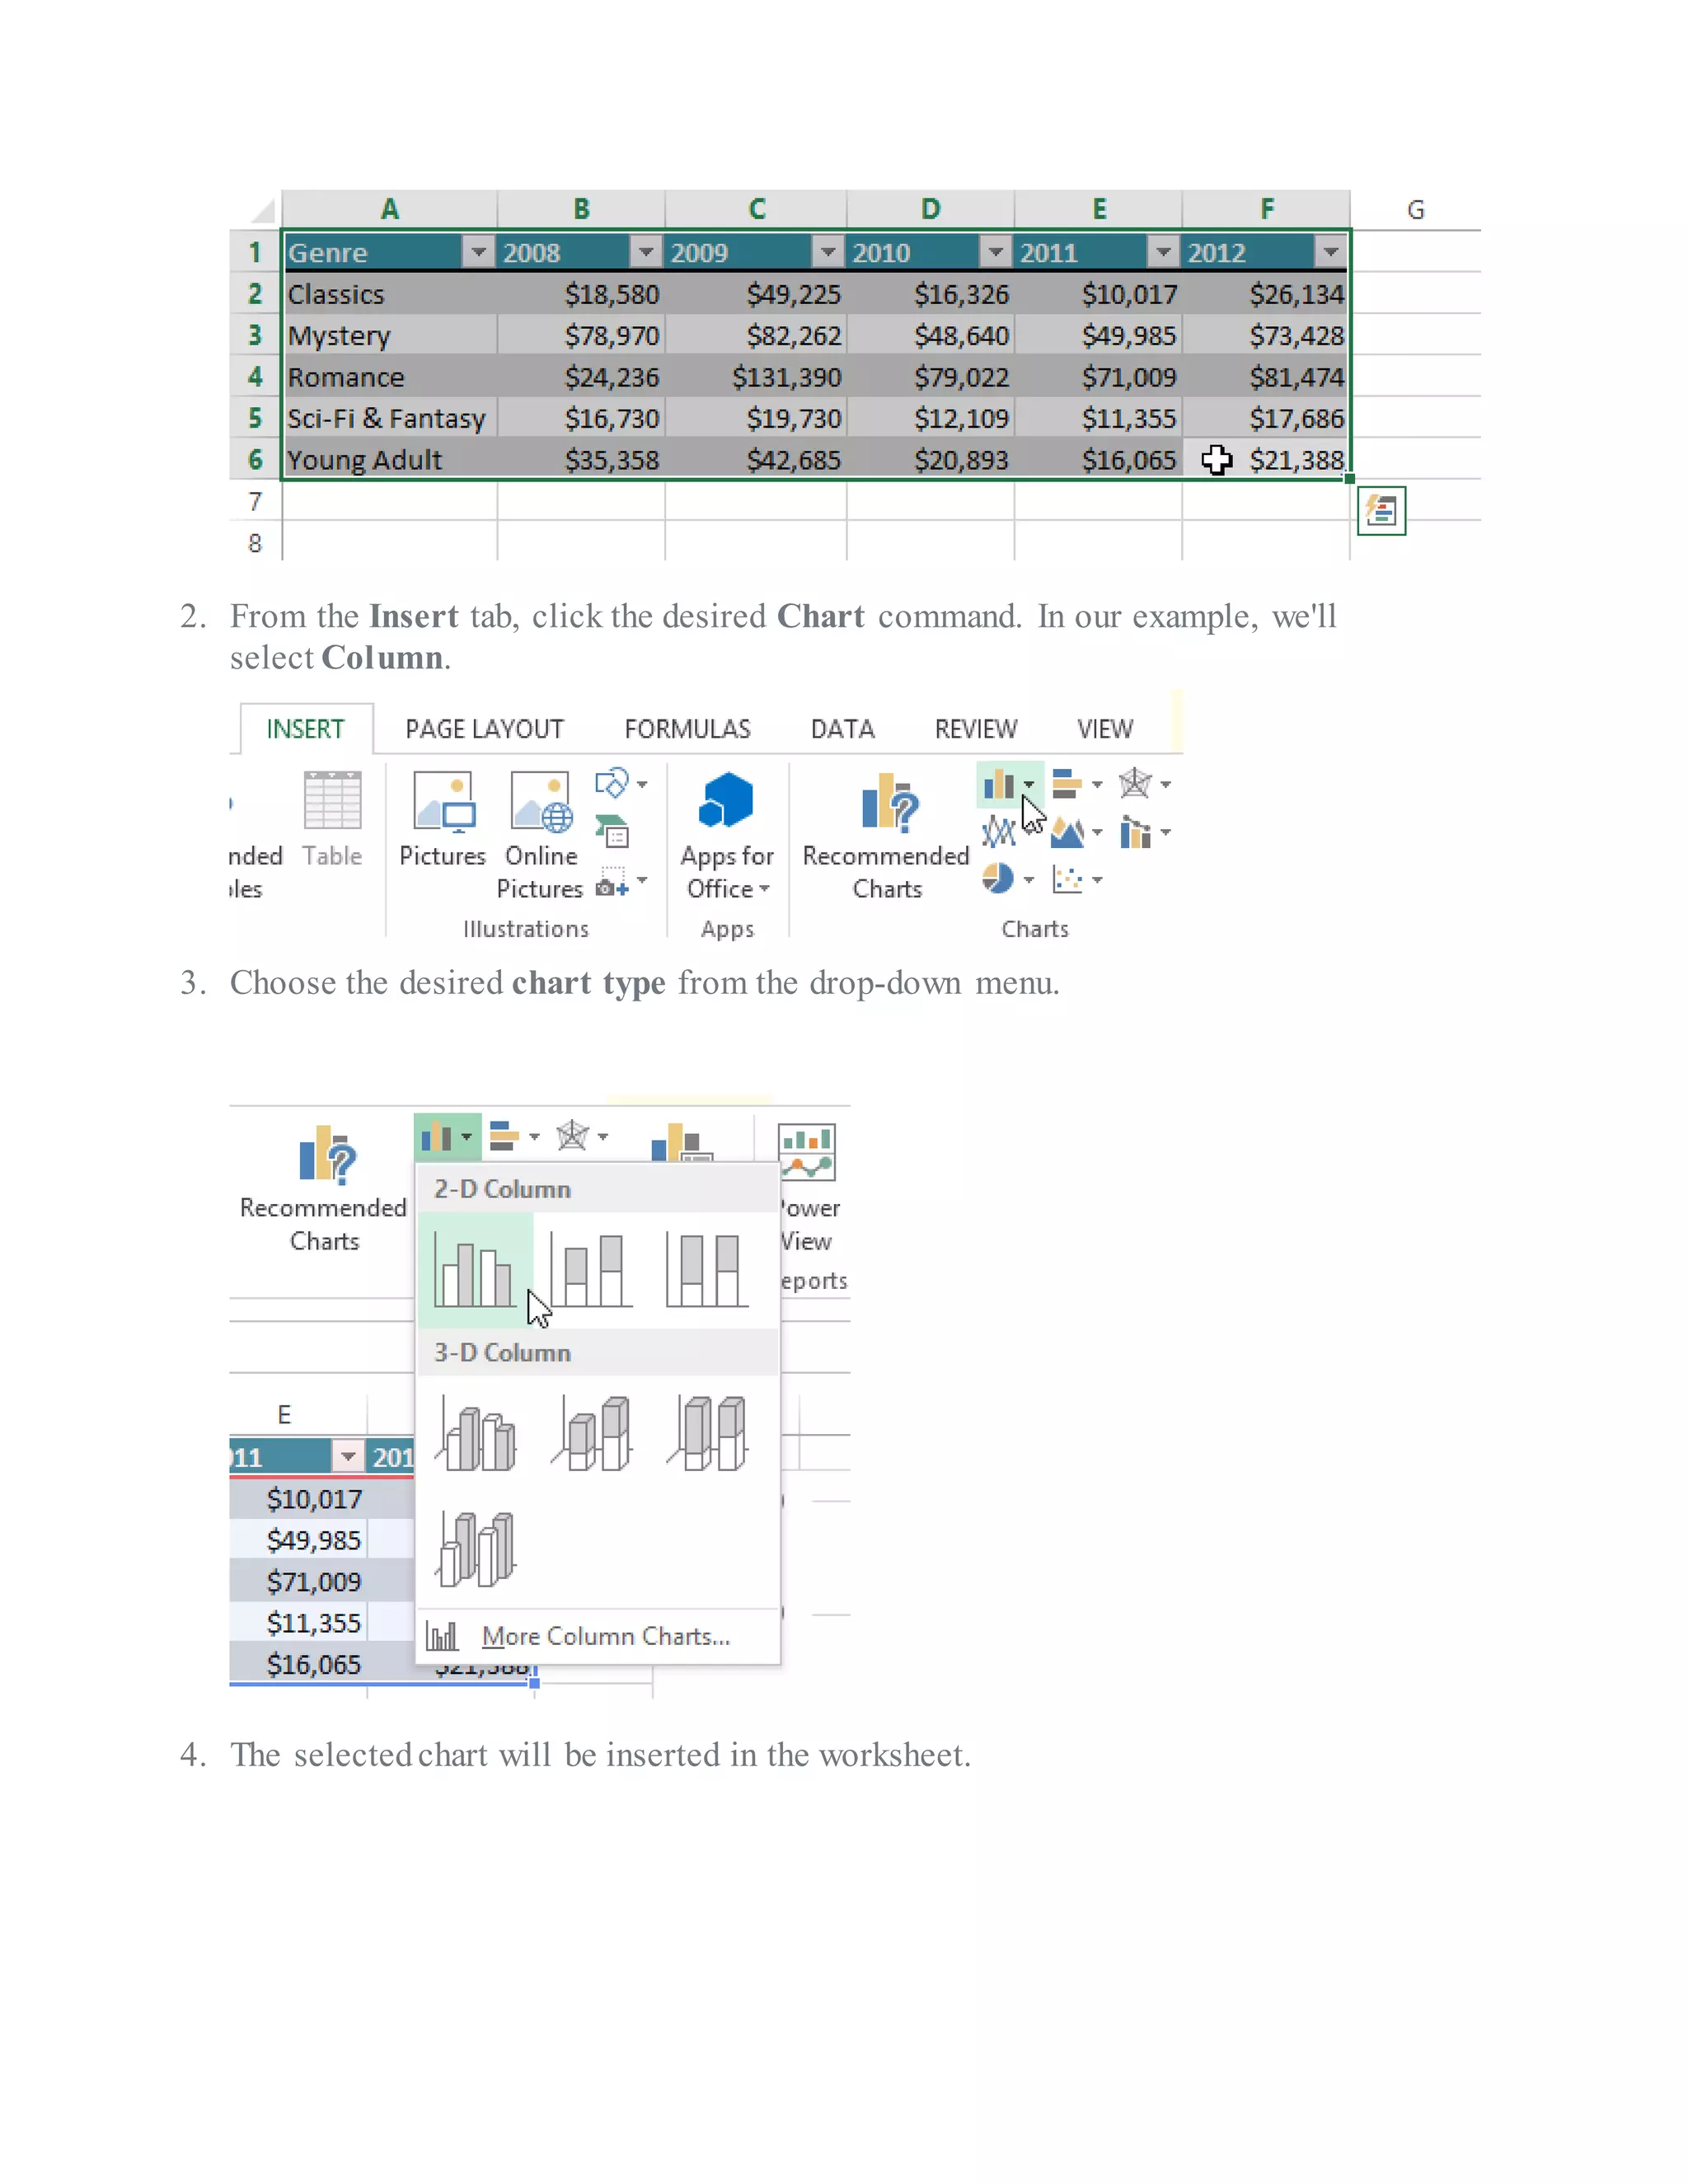
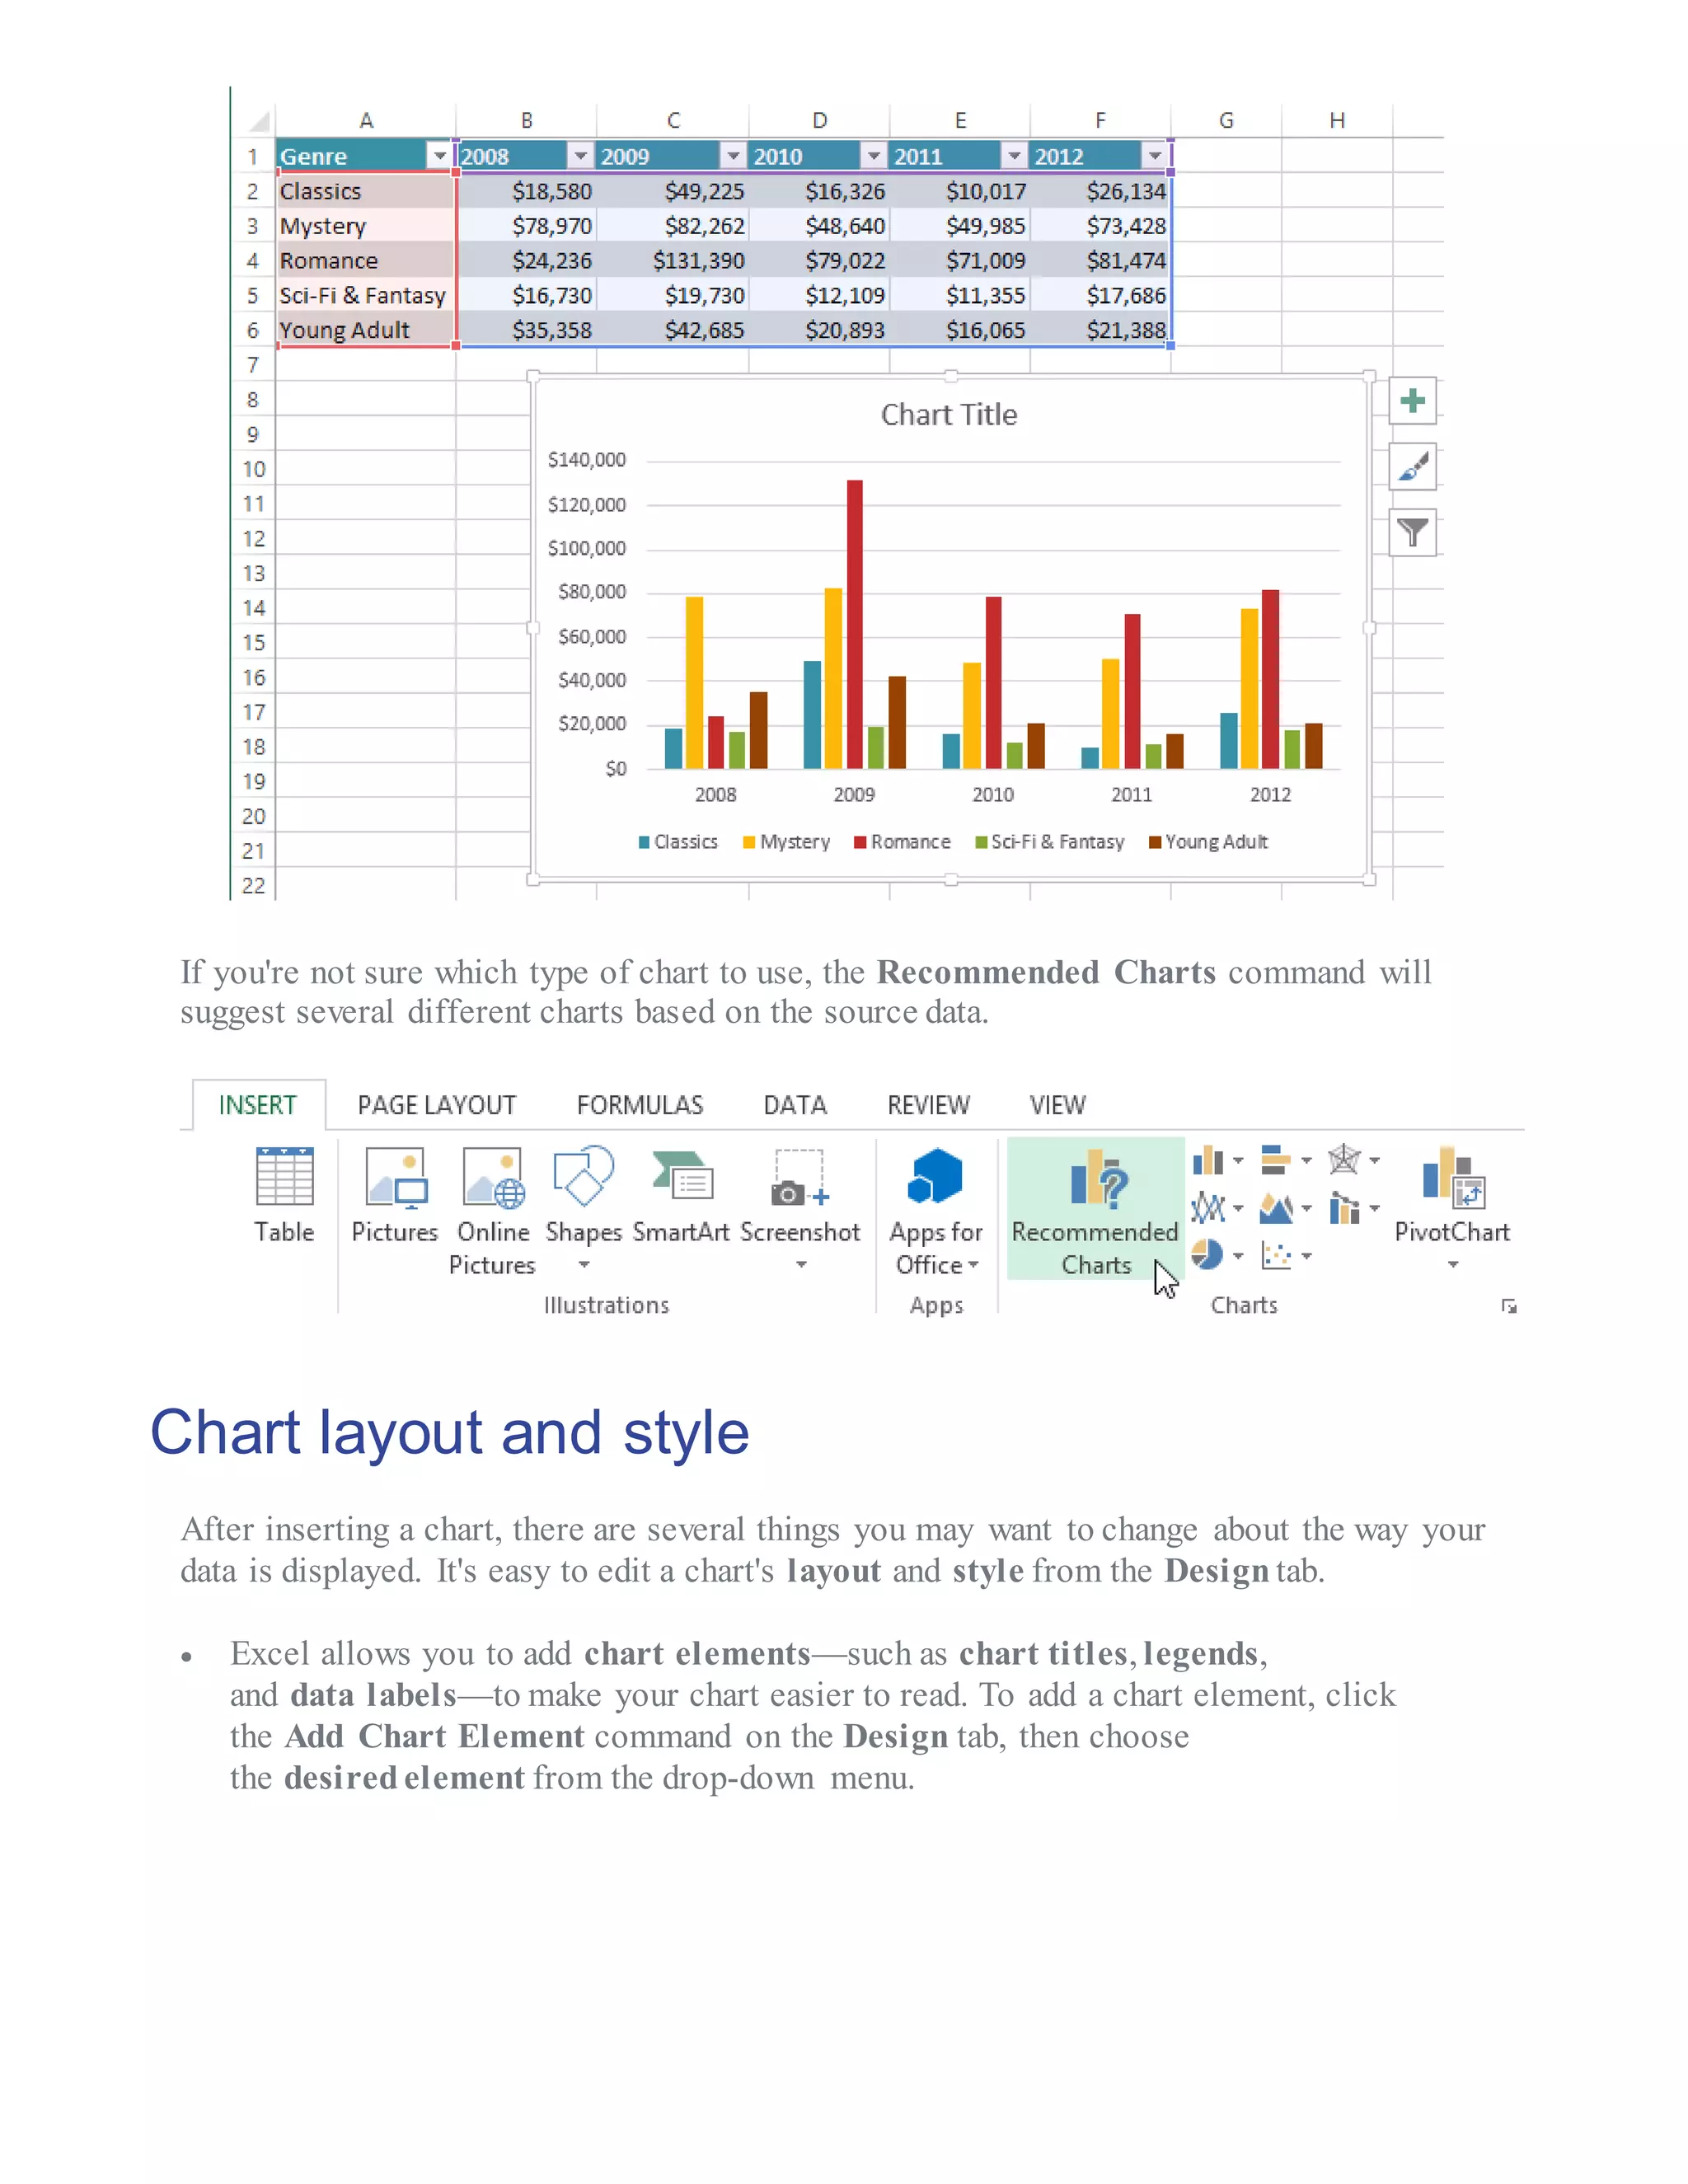
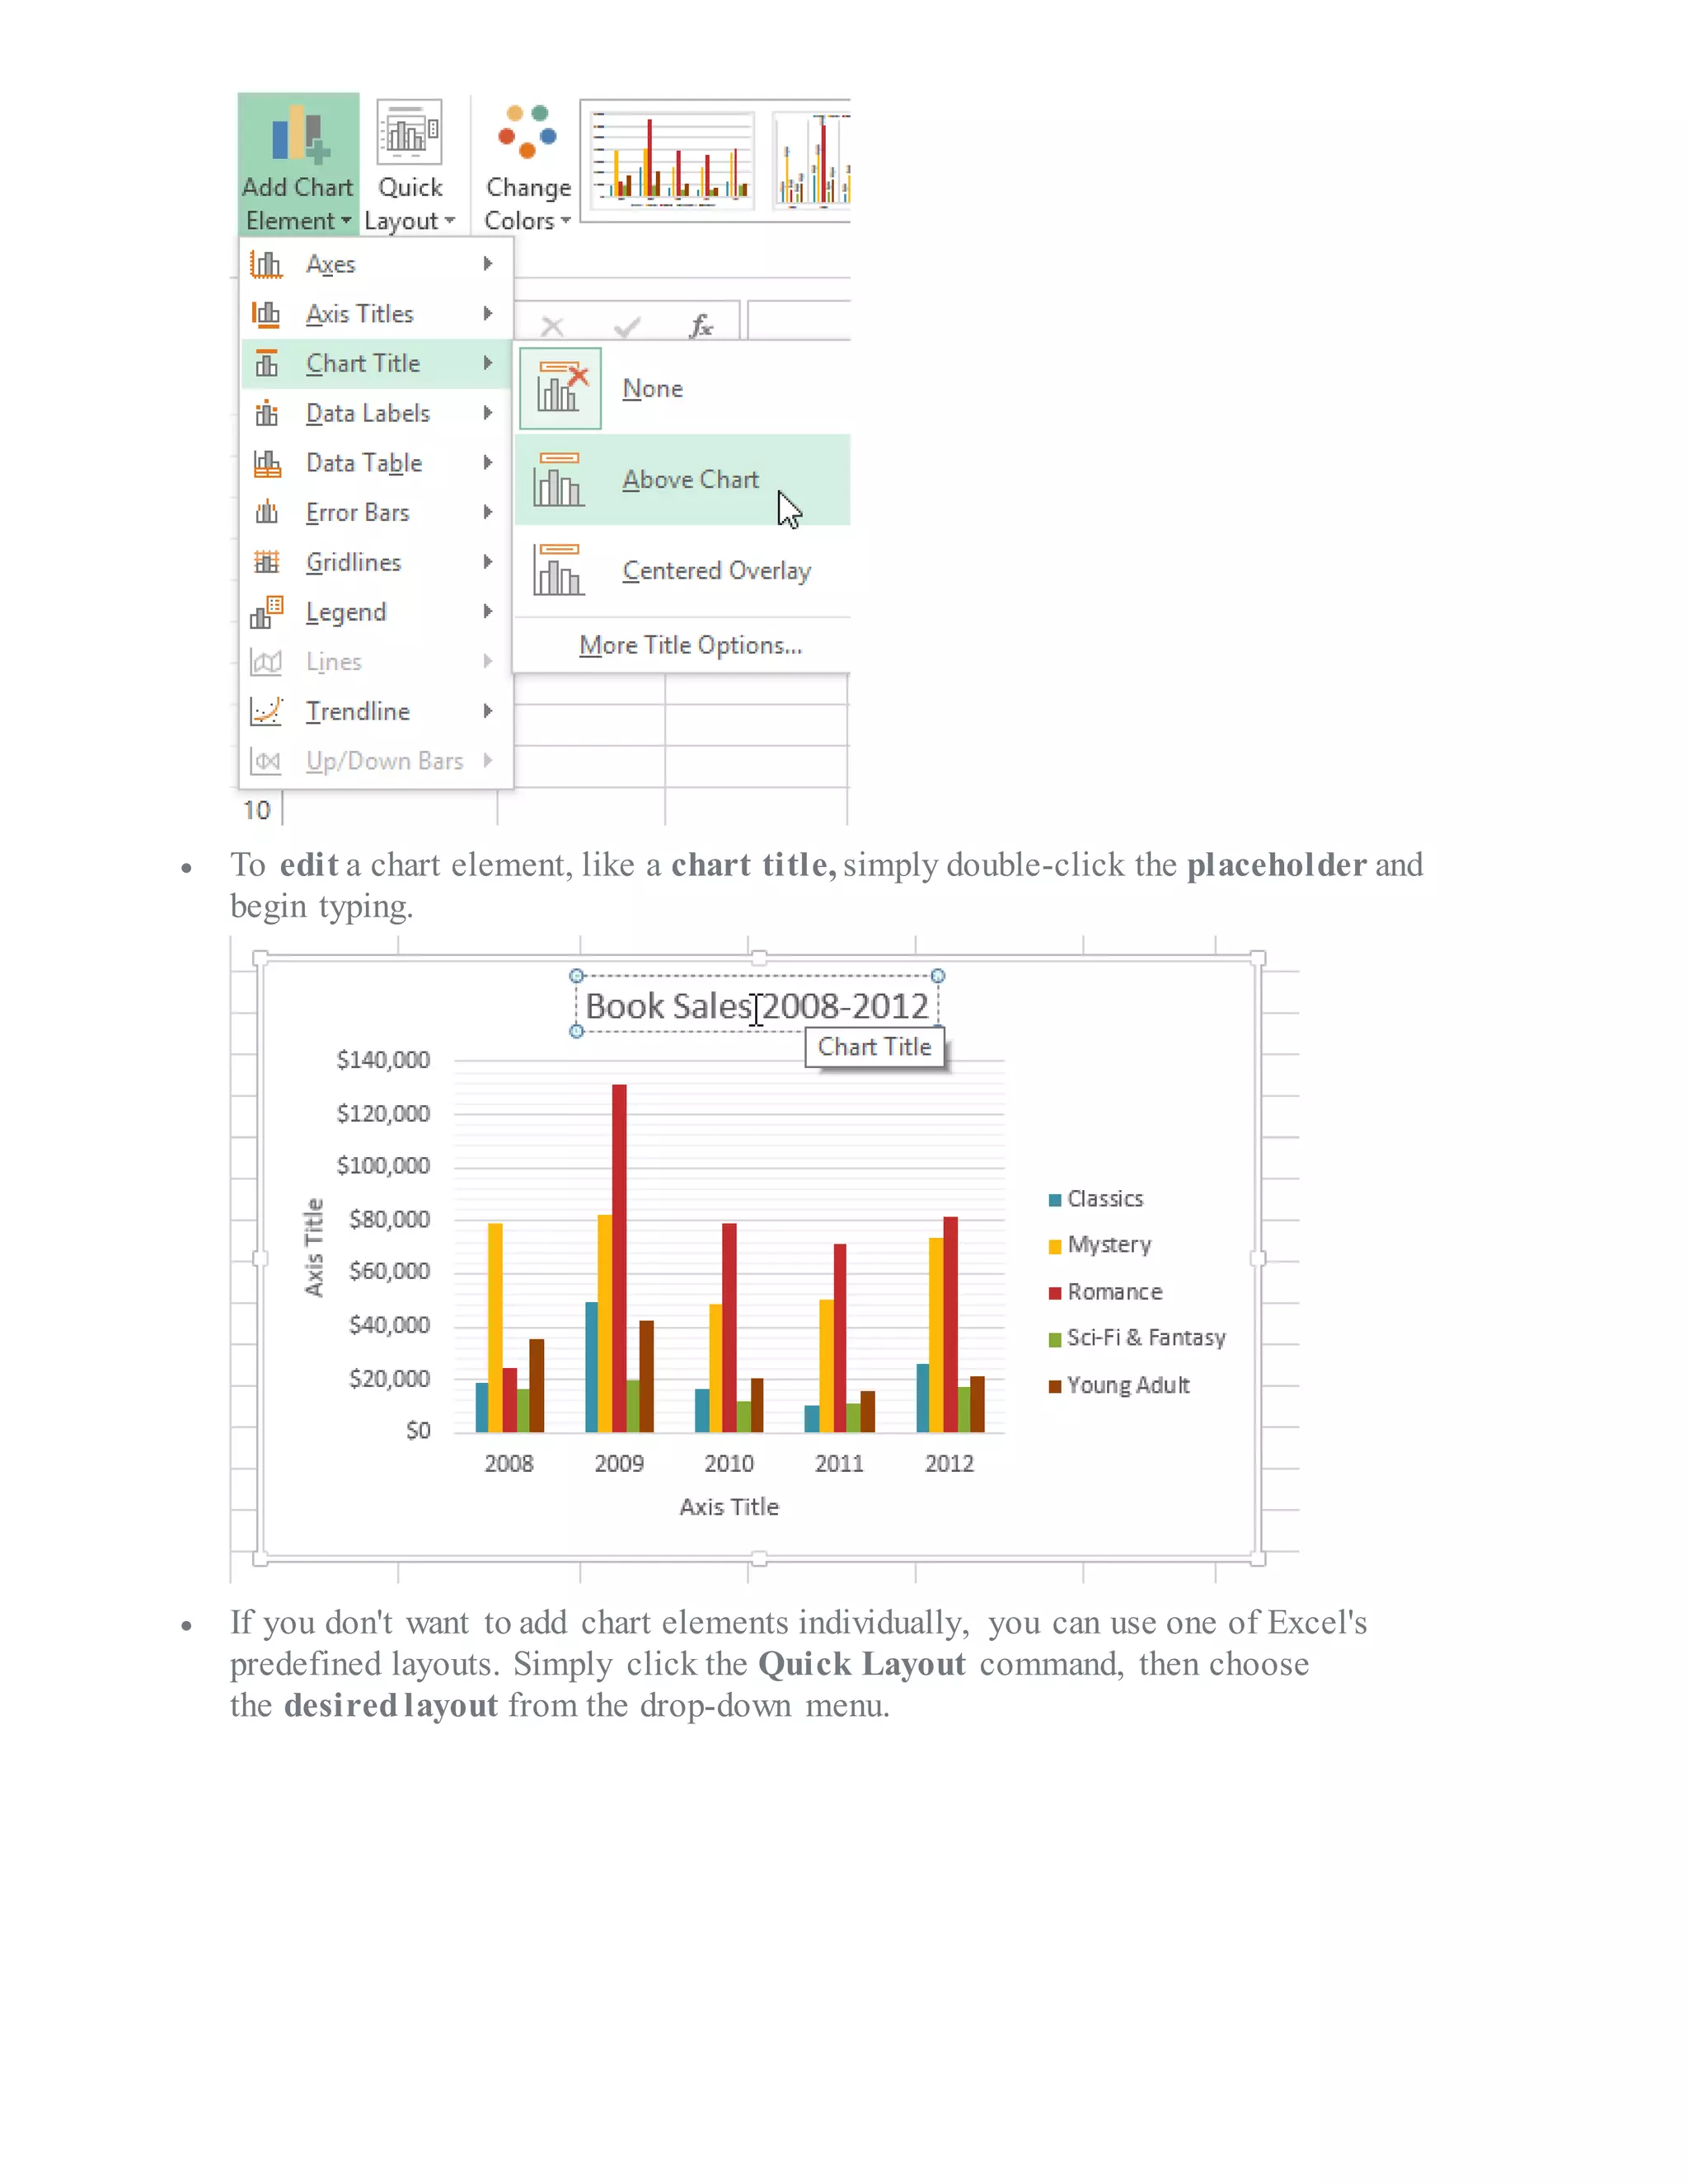
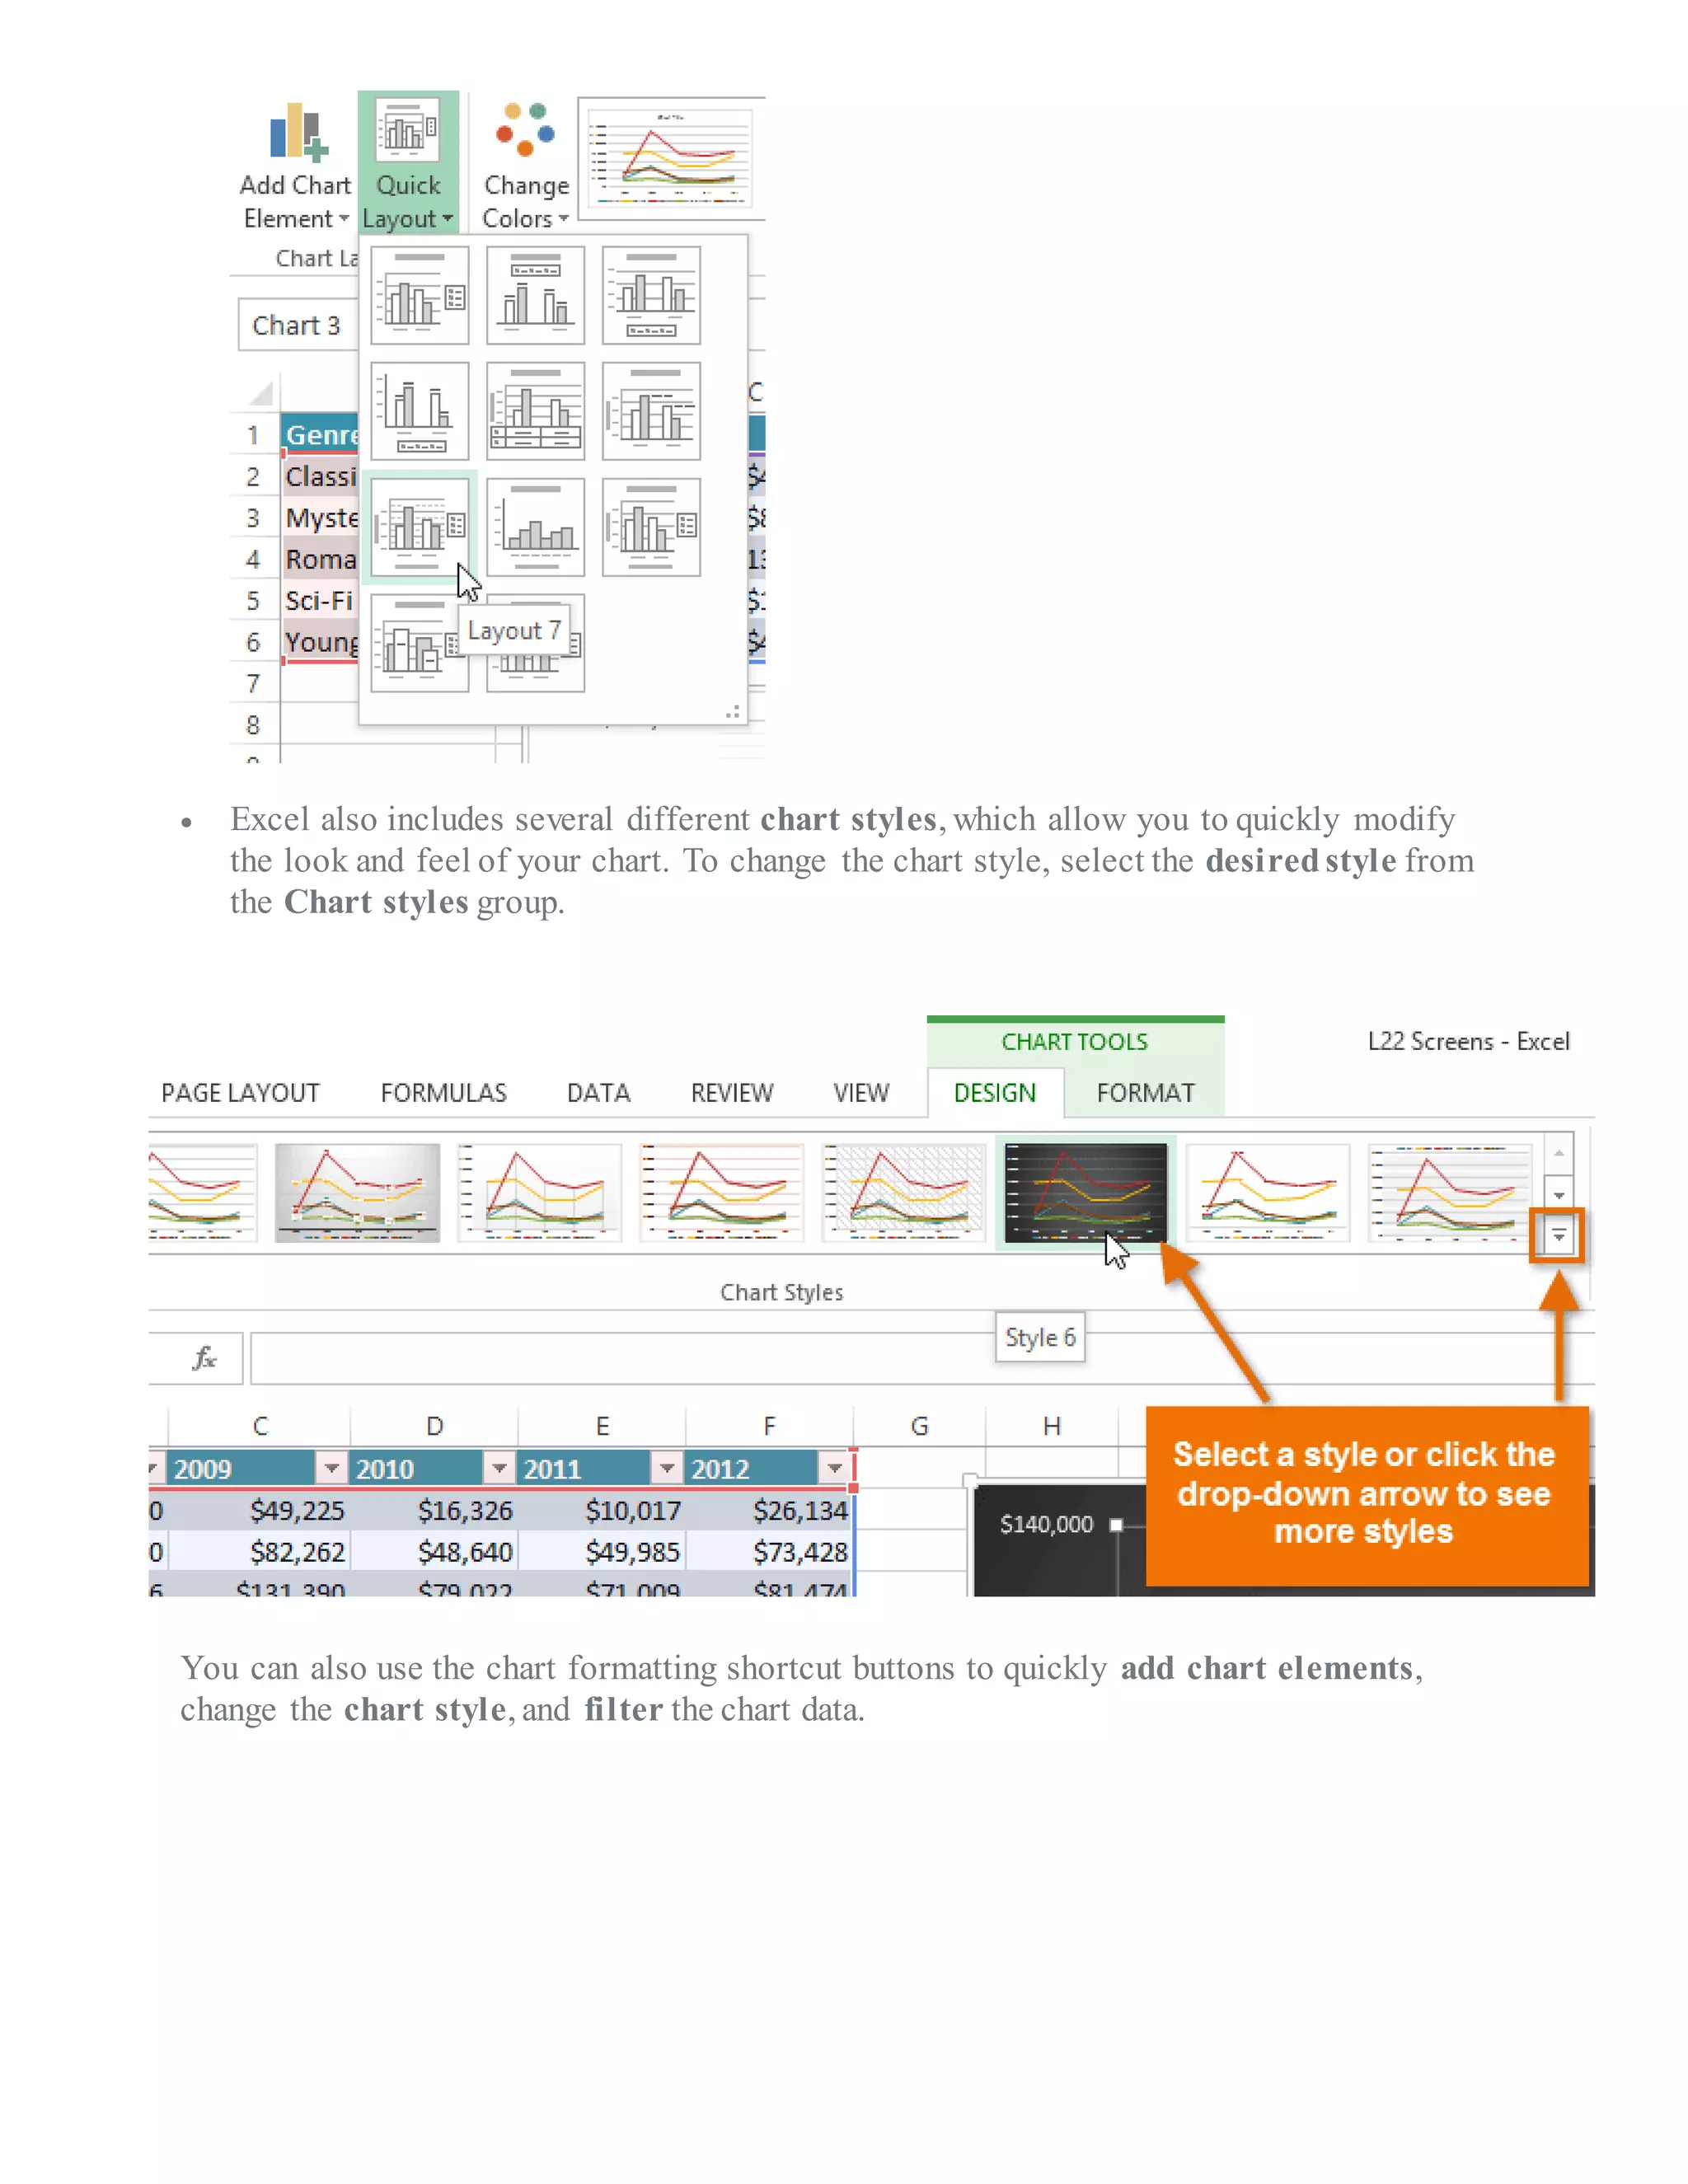
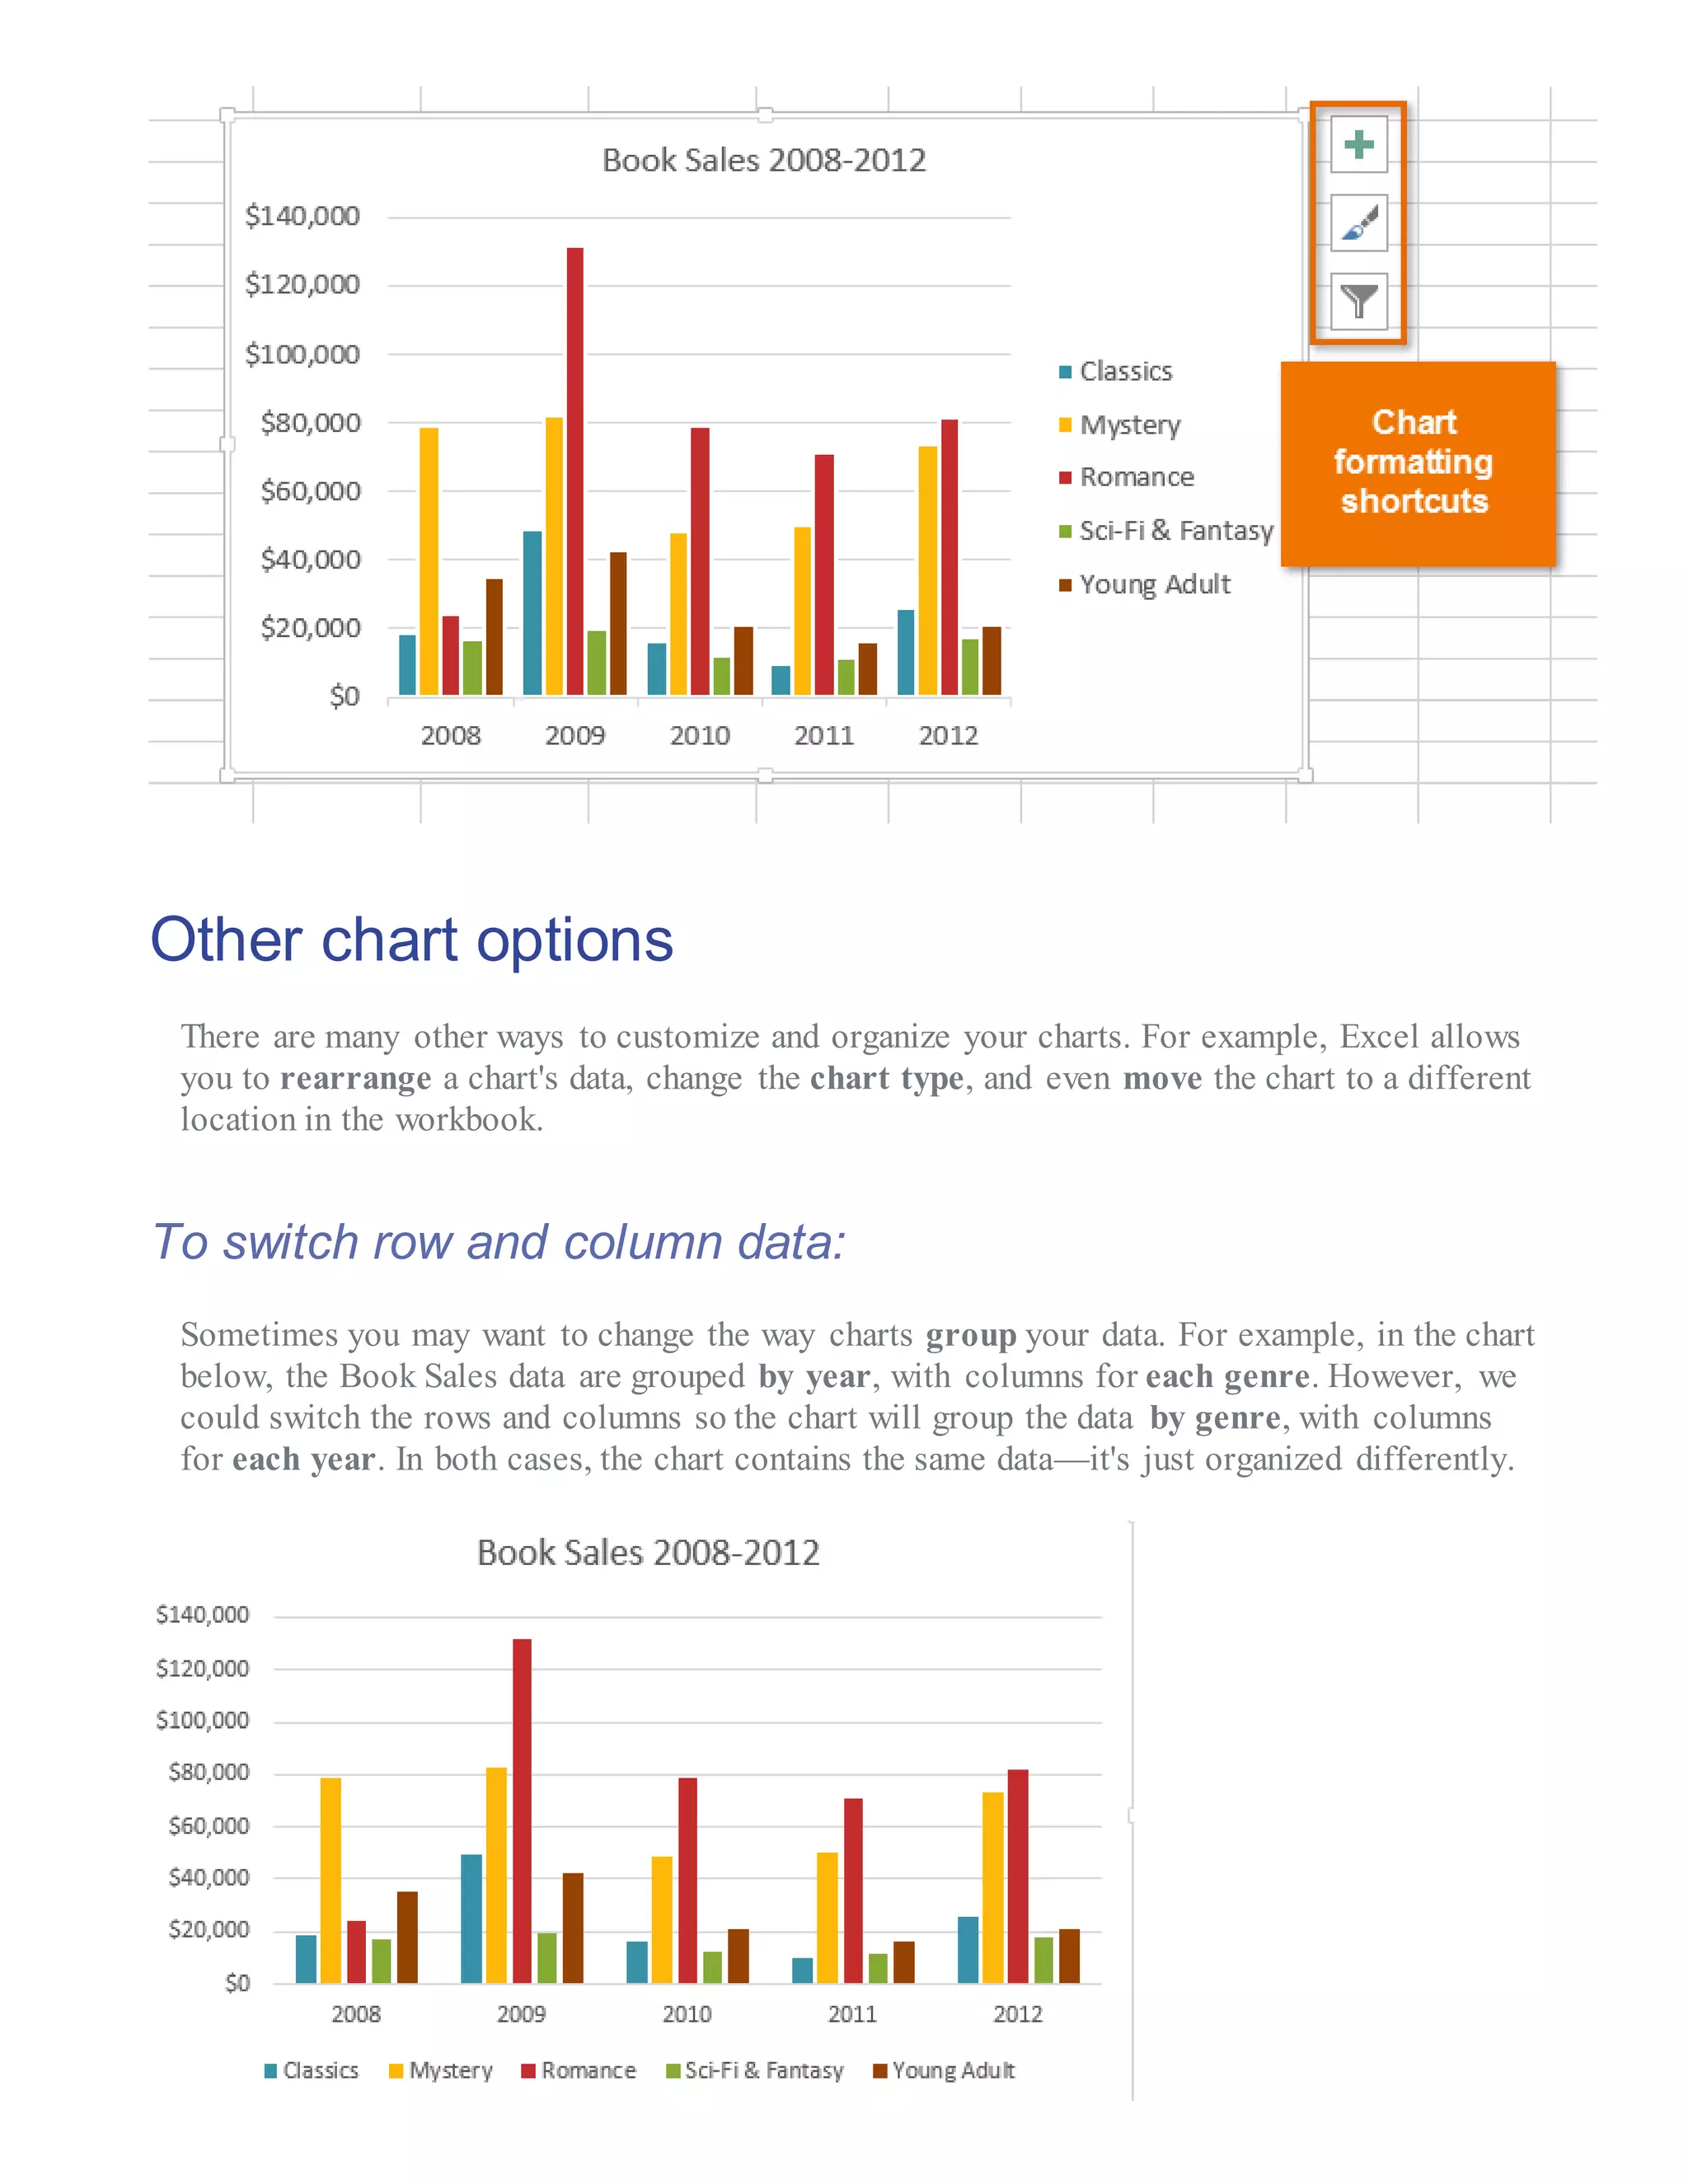
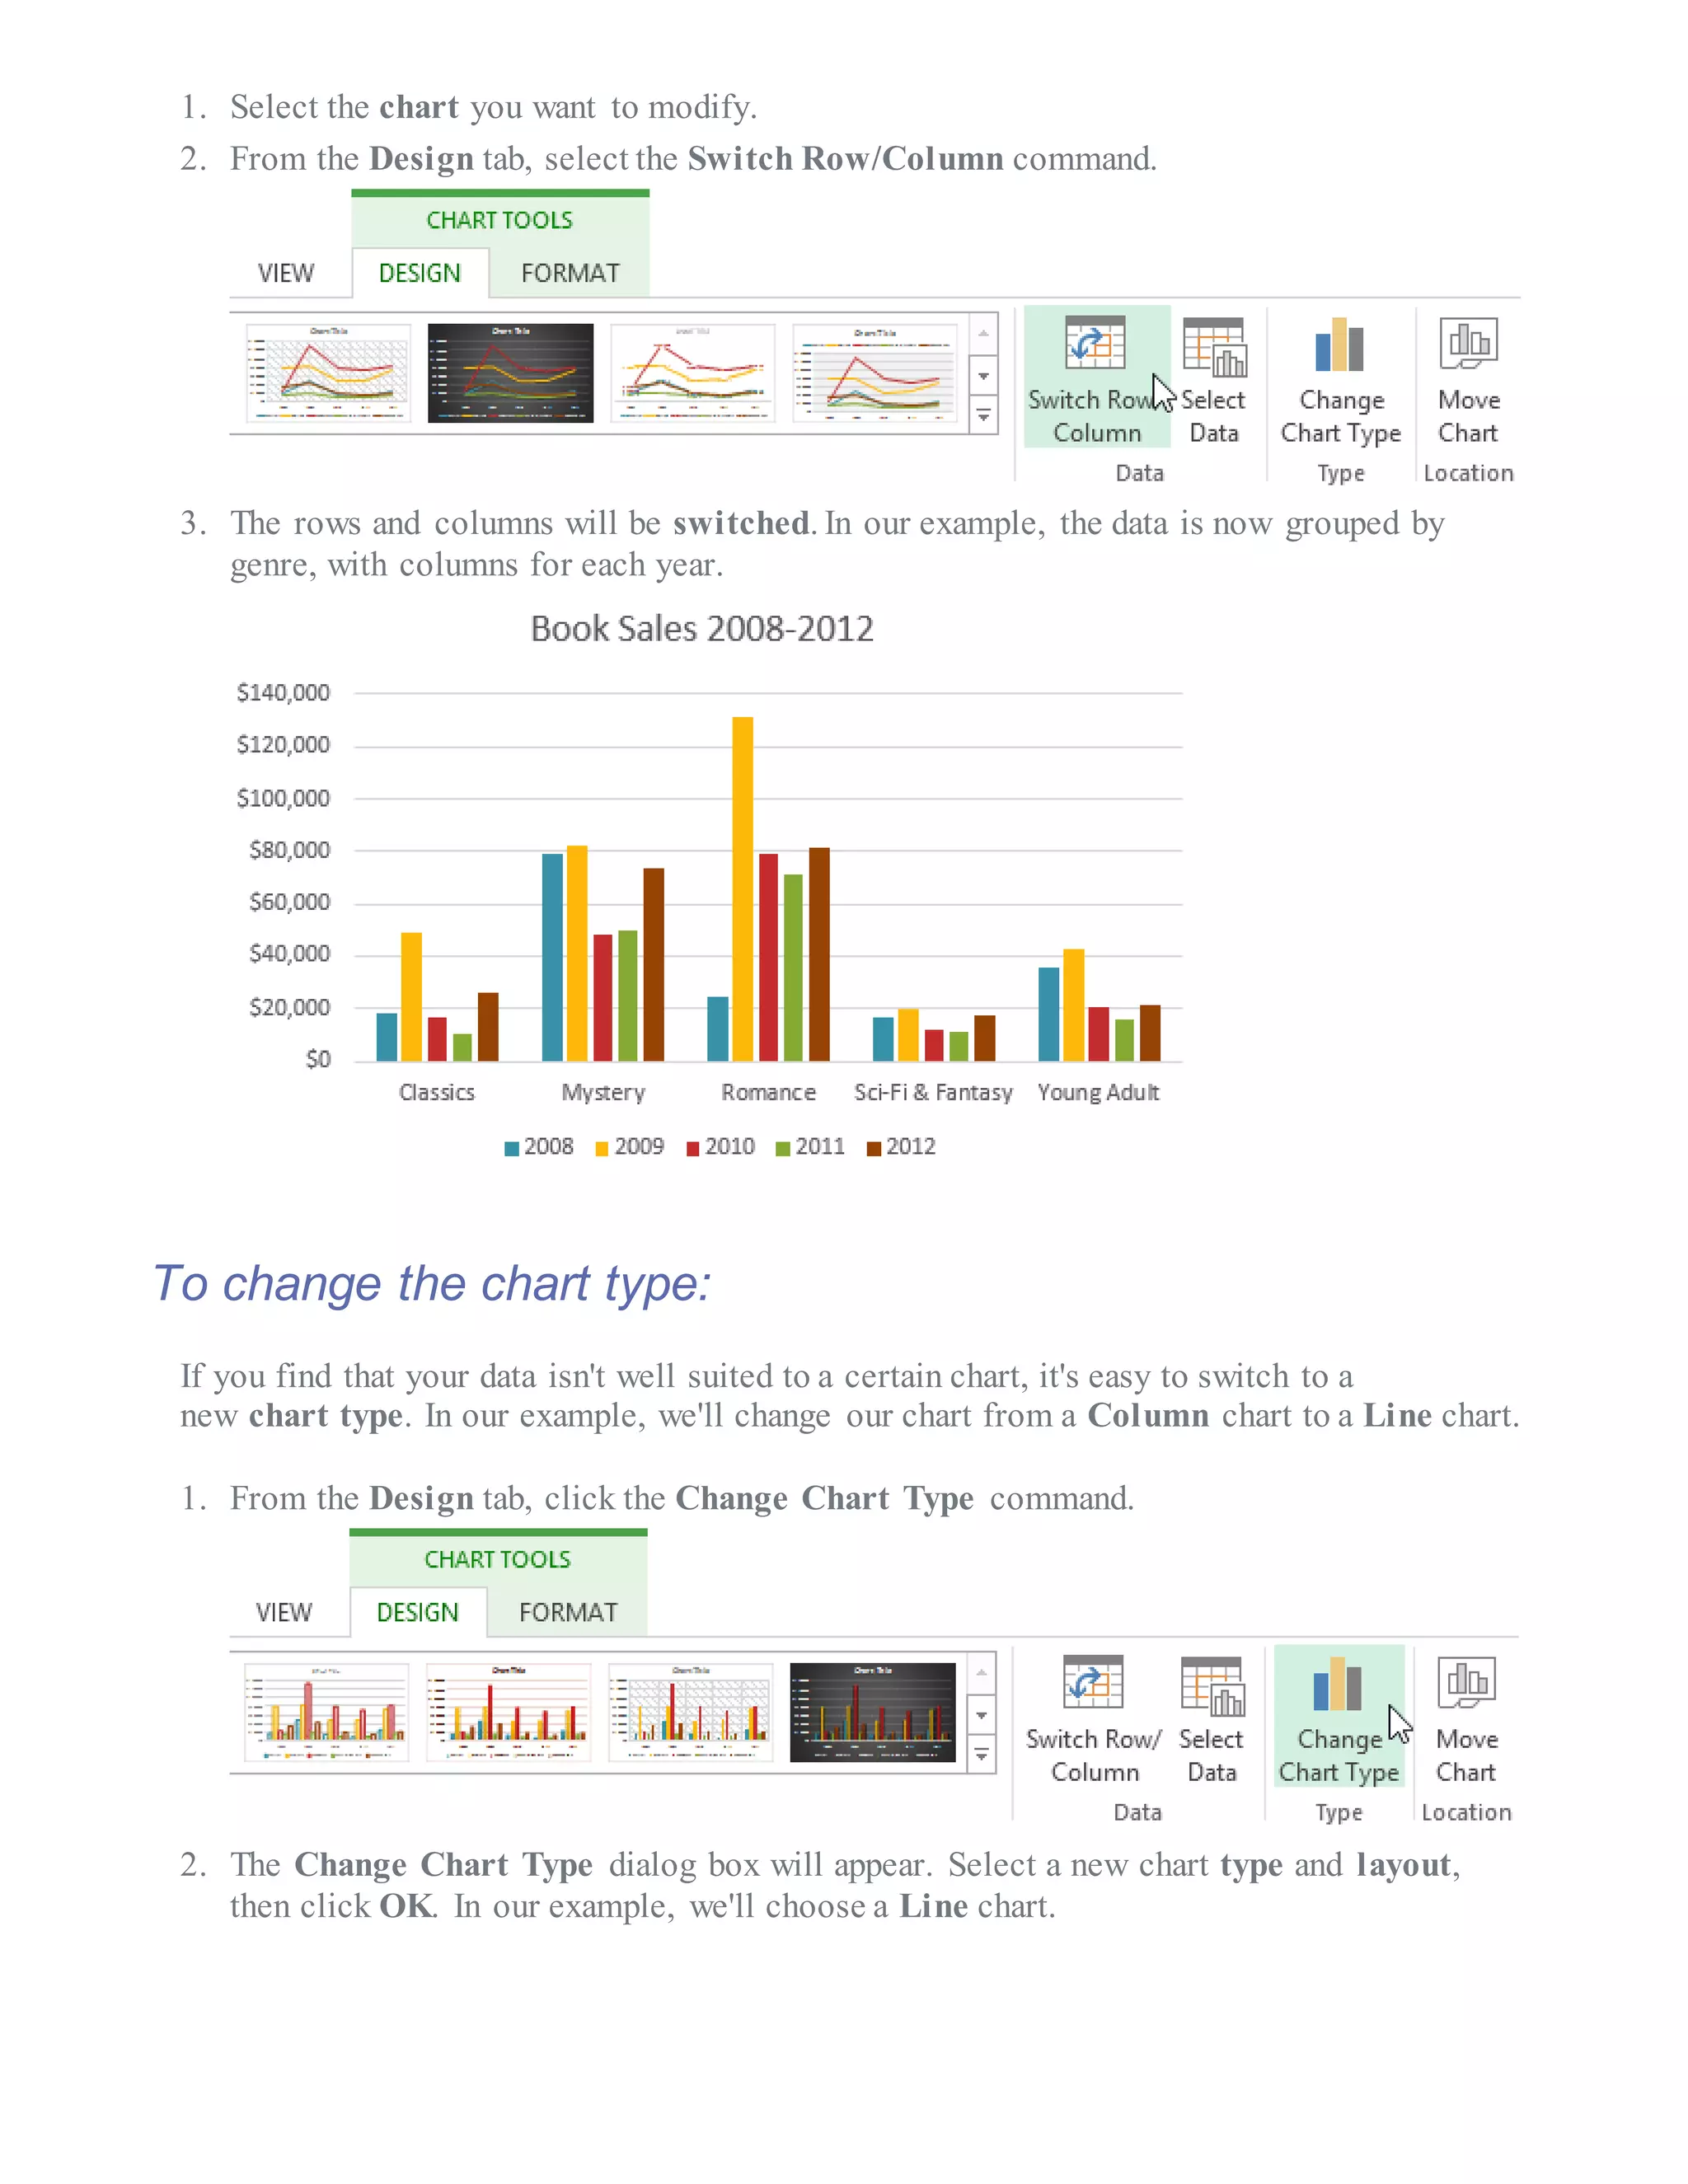
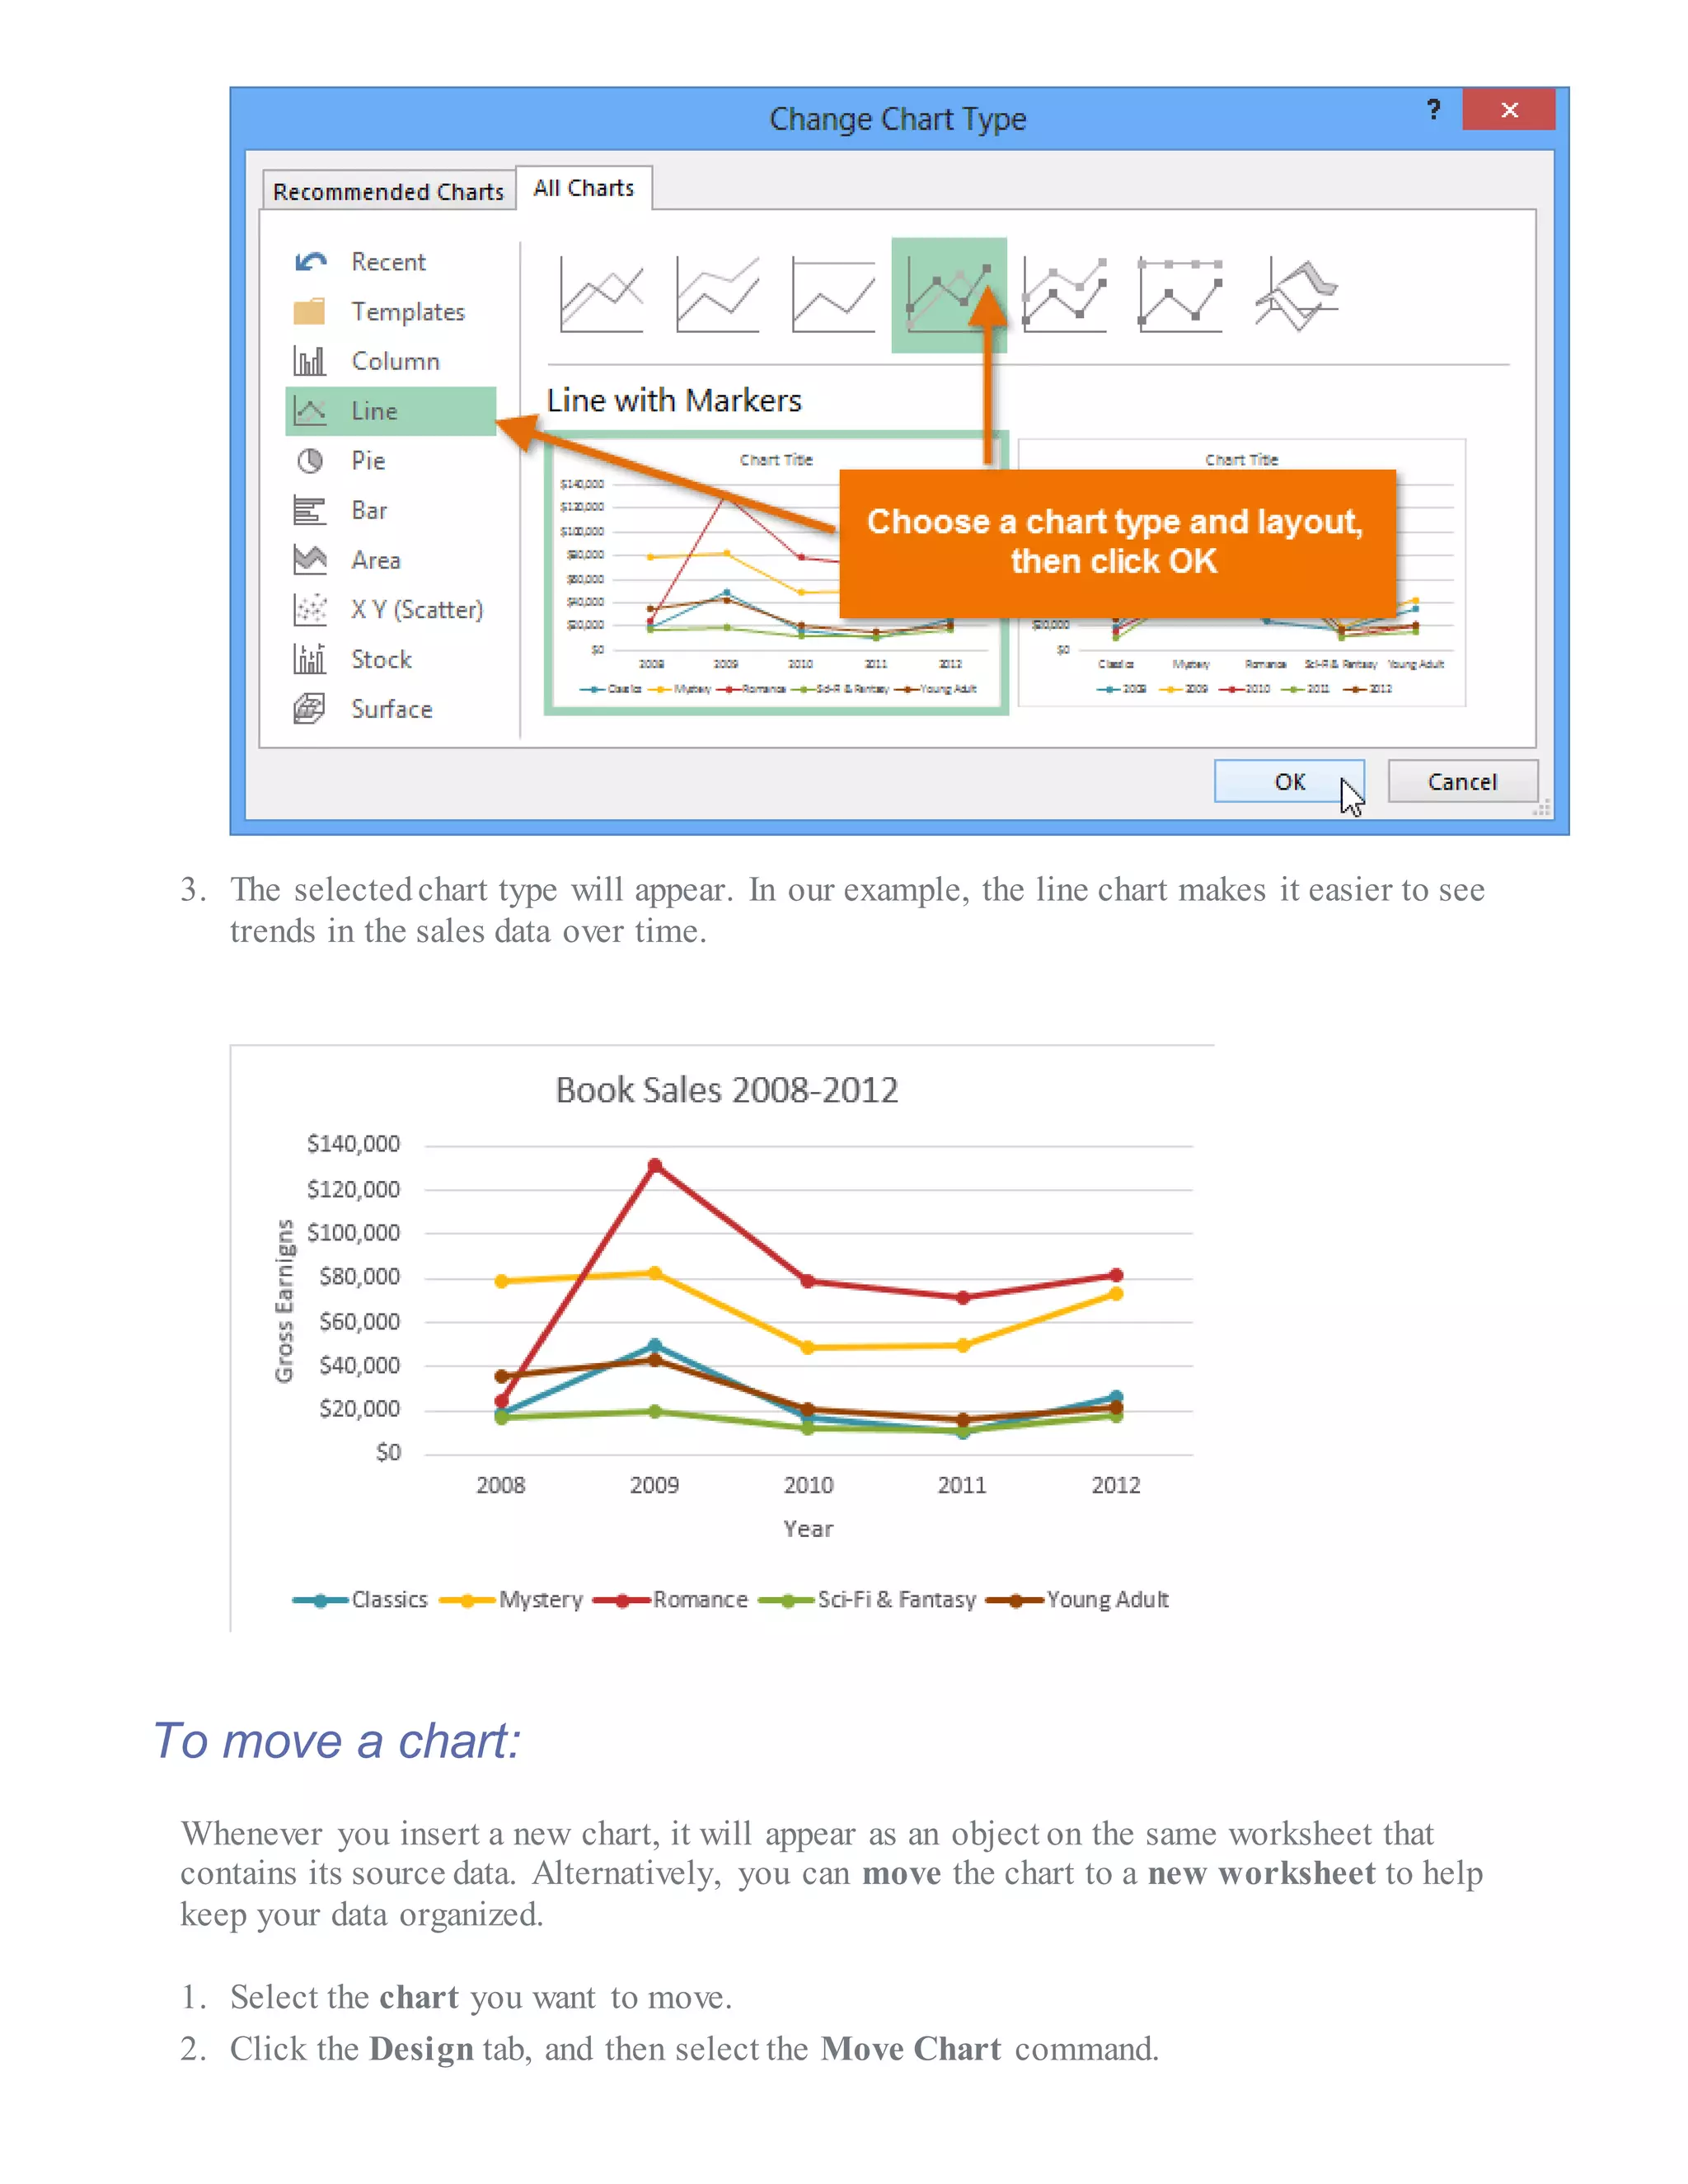
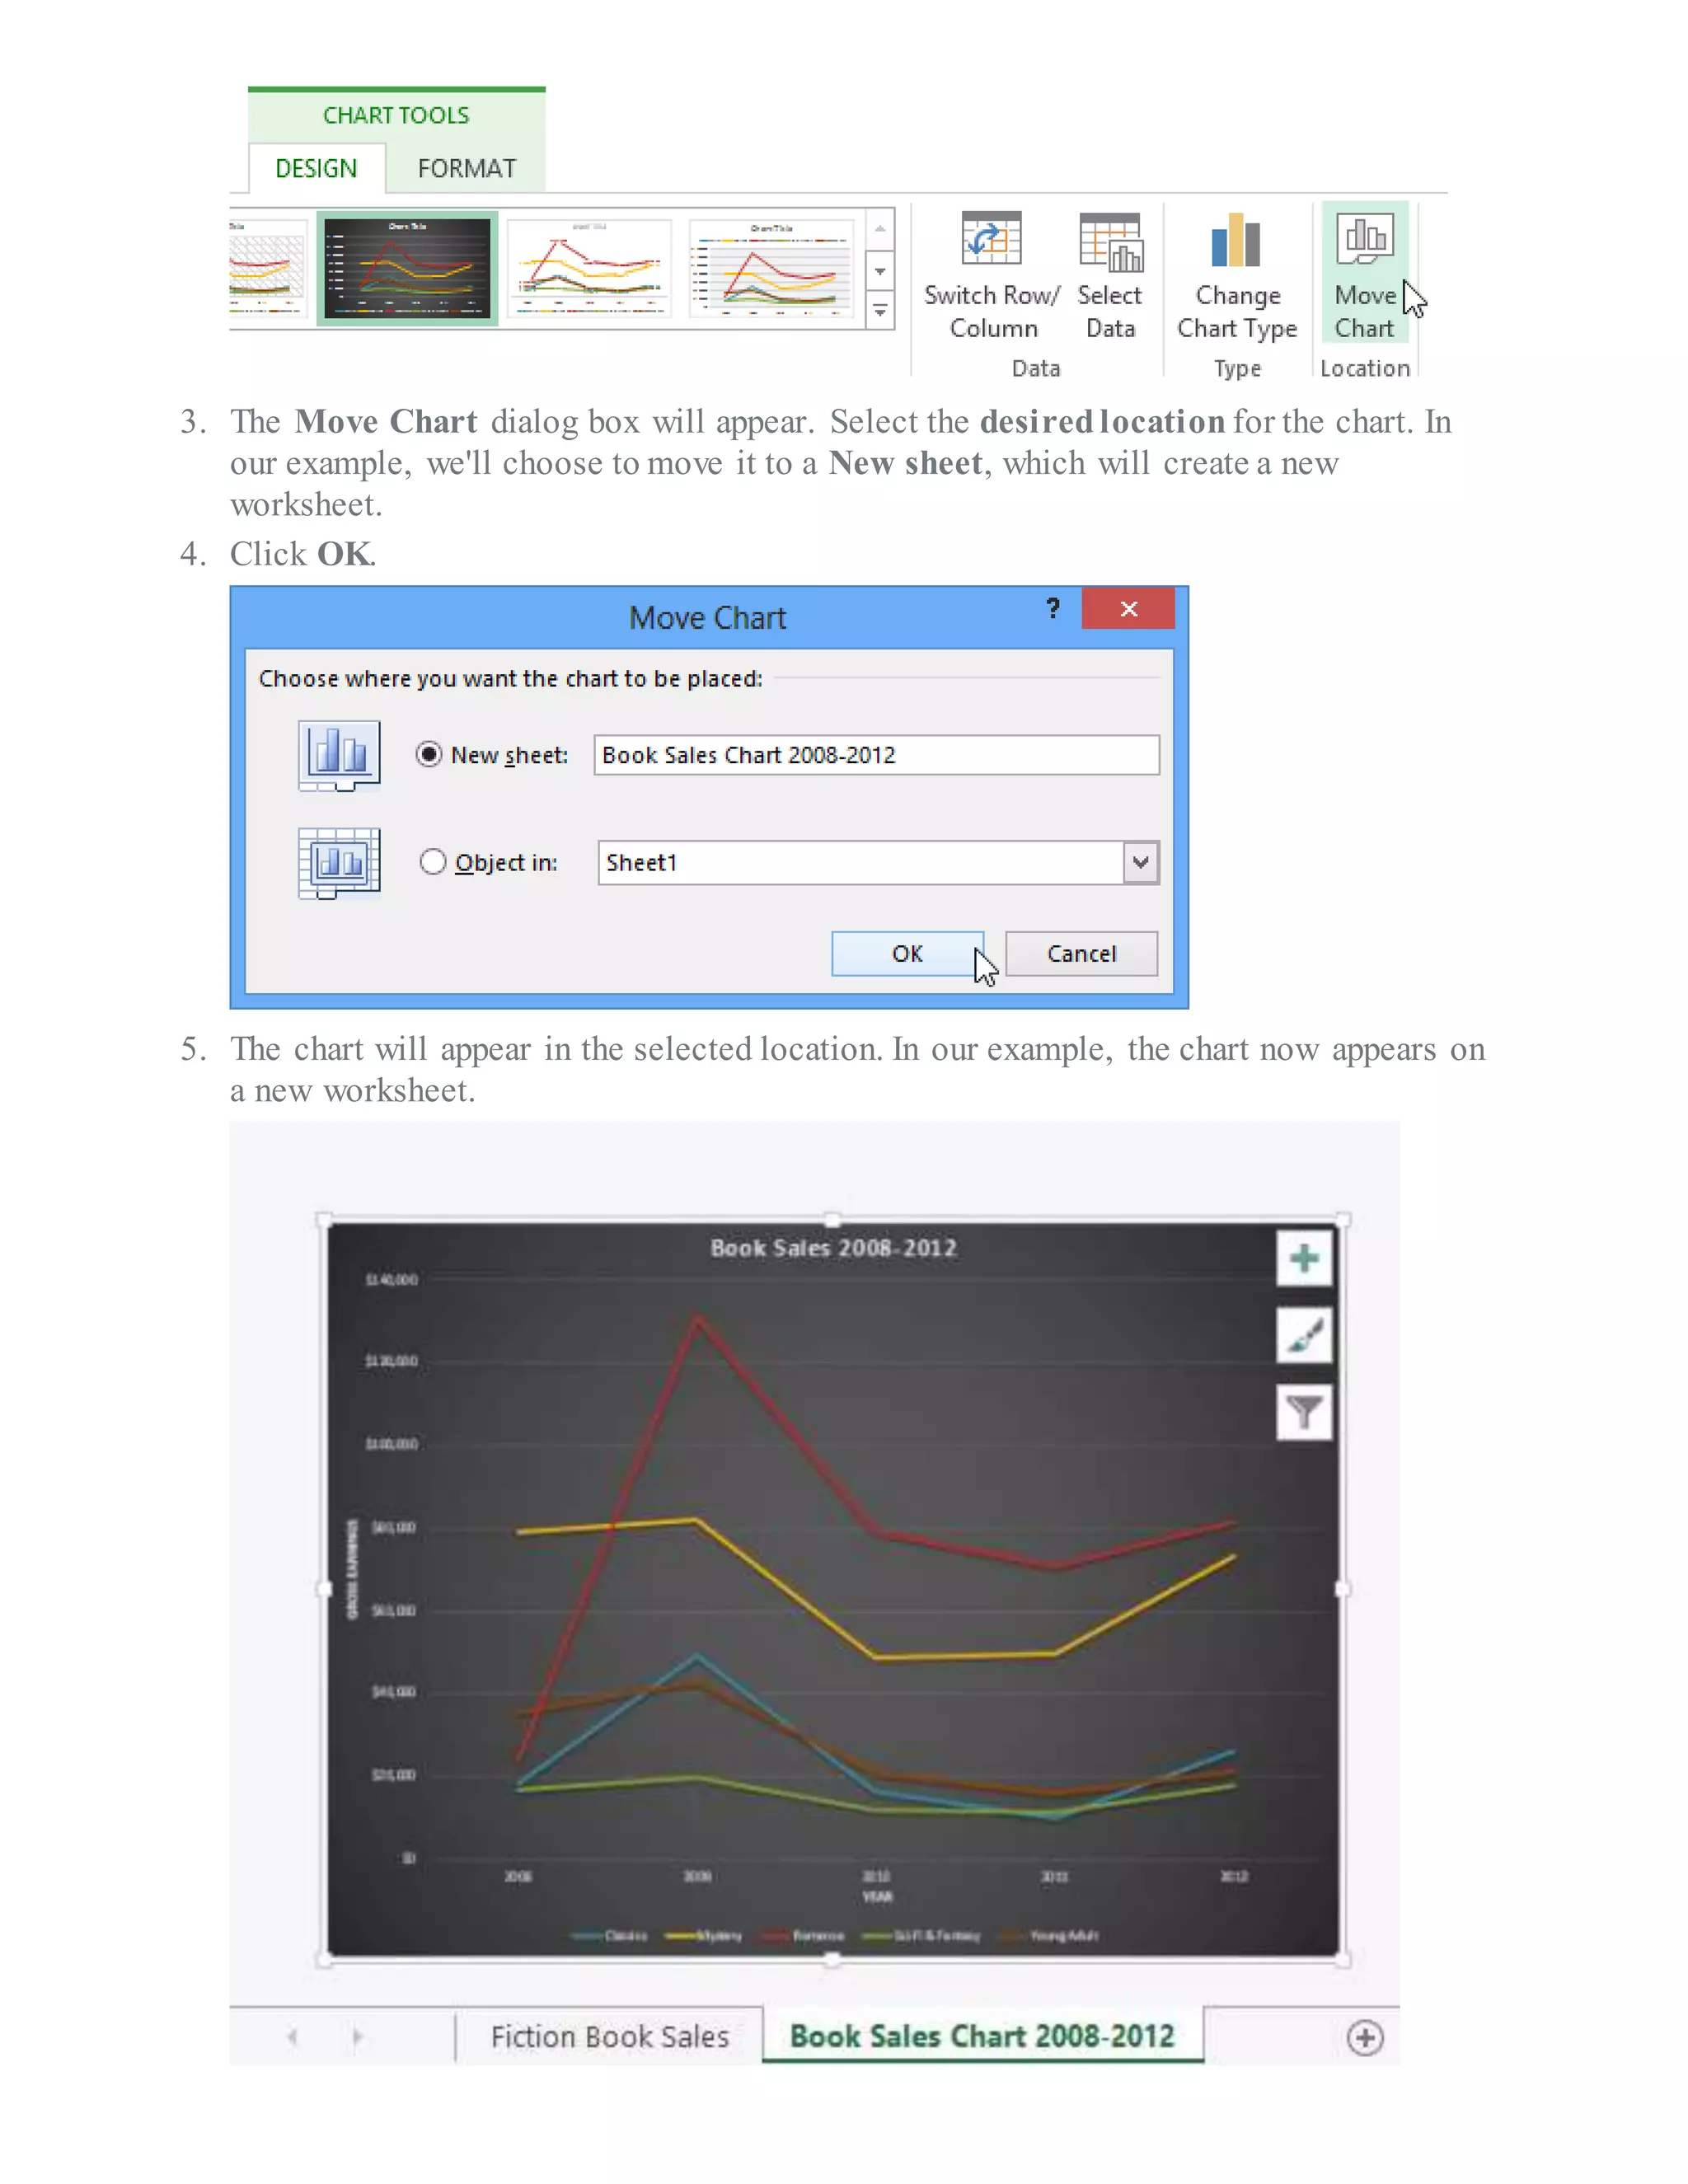
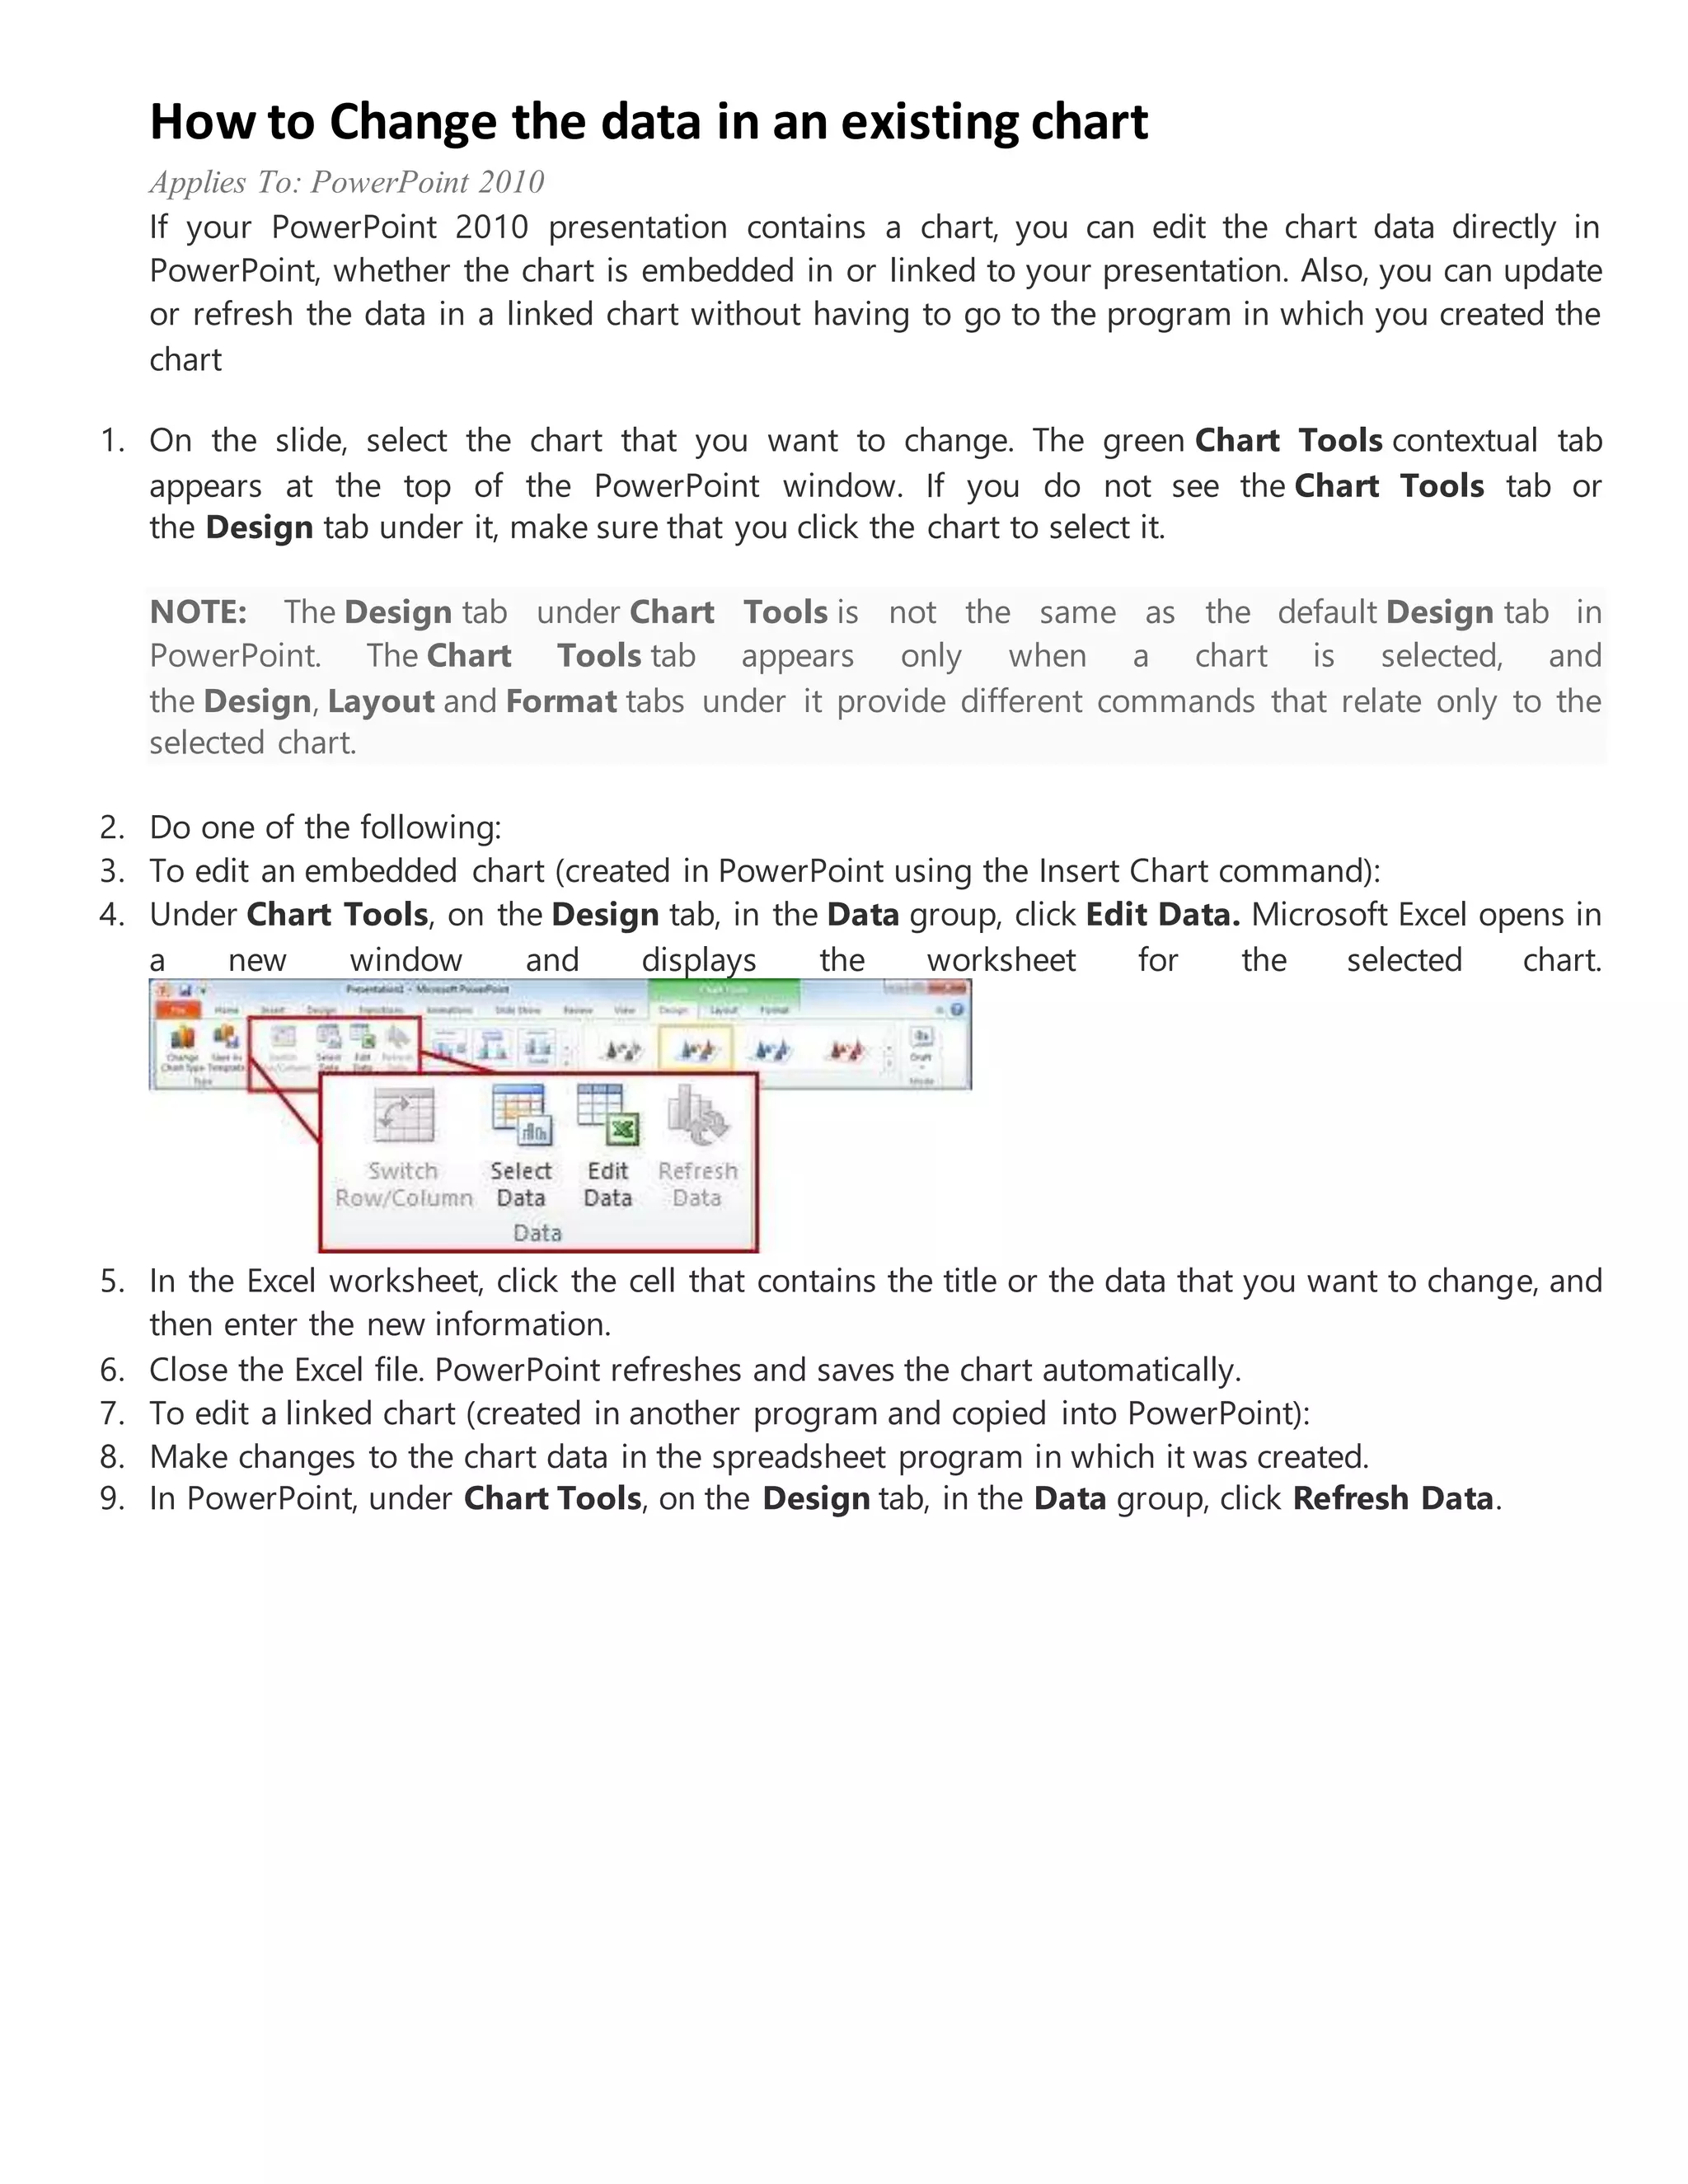

The document provides detailed steps on how to create, customize, and link Excel charts to PowerPoint presentations, highlighting the types of charts available in Excel and how to interpret them. It explains how to modify chart layout and style, switch between rows and columns of data, and move charts between worksheets for better organization. Additionally, it covers linking charts to PowerPoint for dynamic updates and editing data directly within PowerPoint for embedded or linked charts.


