Lec4 computer simulation Modeling and Simulation.pdf
1.
Monté Carlo Simulation
Understand the concept of Monté Carlo
Simulation
Learn how to use Monté Carlo Simulation to make
good decisions
1
2.
What is MonteCarlo Simulation ?
Monte Carlo methods are a widely used class of
computational algorithms for simulating the behavior
of various physical and mathematical systems, and for
other computations.
Monte Carlo algorithm is often a numerical Monte
Carlo method used to find solutions to mathematical
problems (which may have many variables) that cannot
easily be solved, (e.g. integral calculus,…)
Stochastic simulations using the static model are
often called Monte Carlo Simulations.
2
3.
What is MonteCarlo Simulation ?
A Monte Carlo simulation is a statistical
simulation technique that provides approximate
solutions to problems expressed mathematically. It
utilizes a sequence of random numbers to perform
the simulation.
This technique can be used in different domains:
complex integral computations,
economics,
making decisions in specific complex problems, …
3
4.
General Algorithm ofMonte Carlo Simulation
In general, Monte Carlo Simulation is roughly
composed of five steps:
1. Set up probability distributions: what is the probability
distribution that will be considered in the simulation
2. Build cumulative probability distributions
3. Establish an interval of random numbers for each
variable
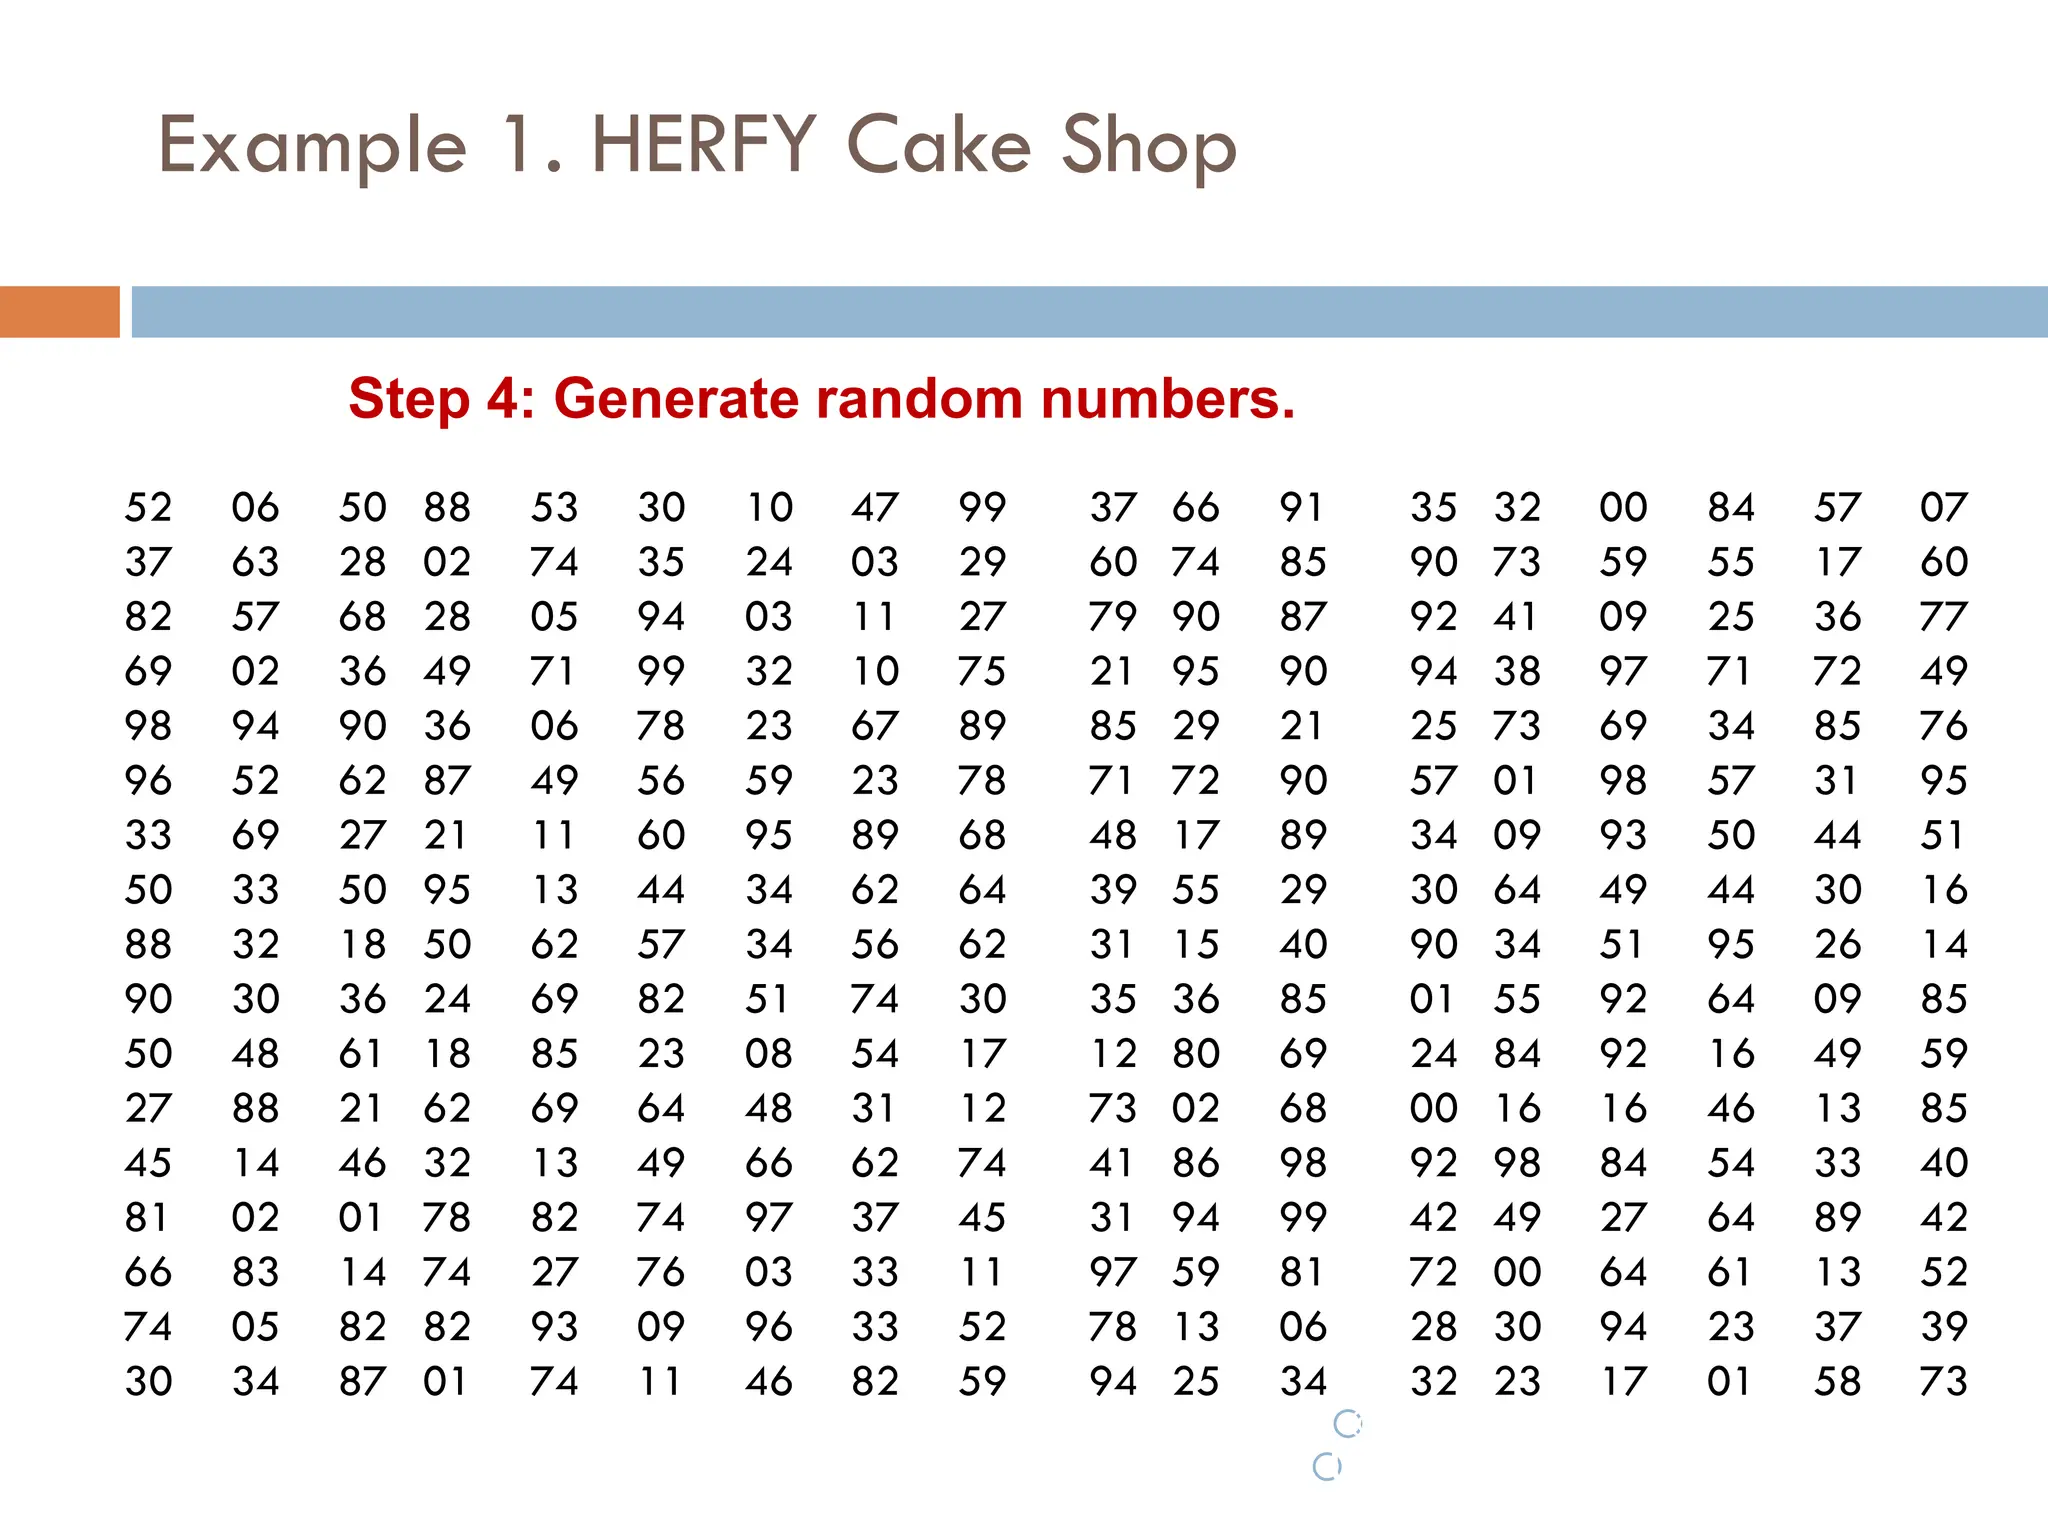
4. Generate random numbers: only accept numbers that
satisfies a given condition.
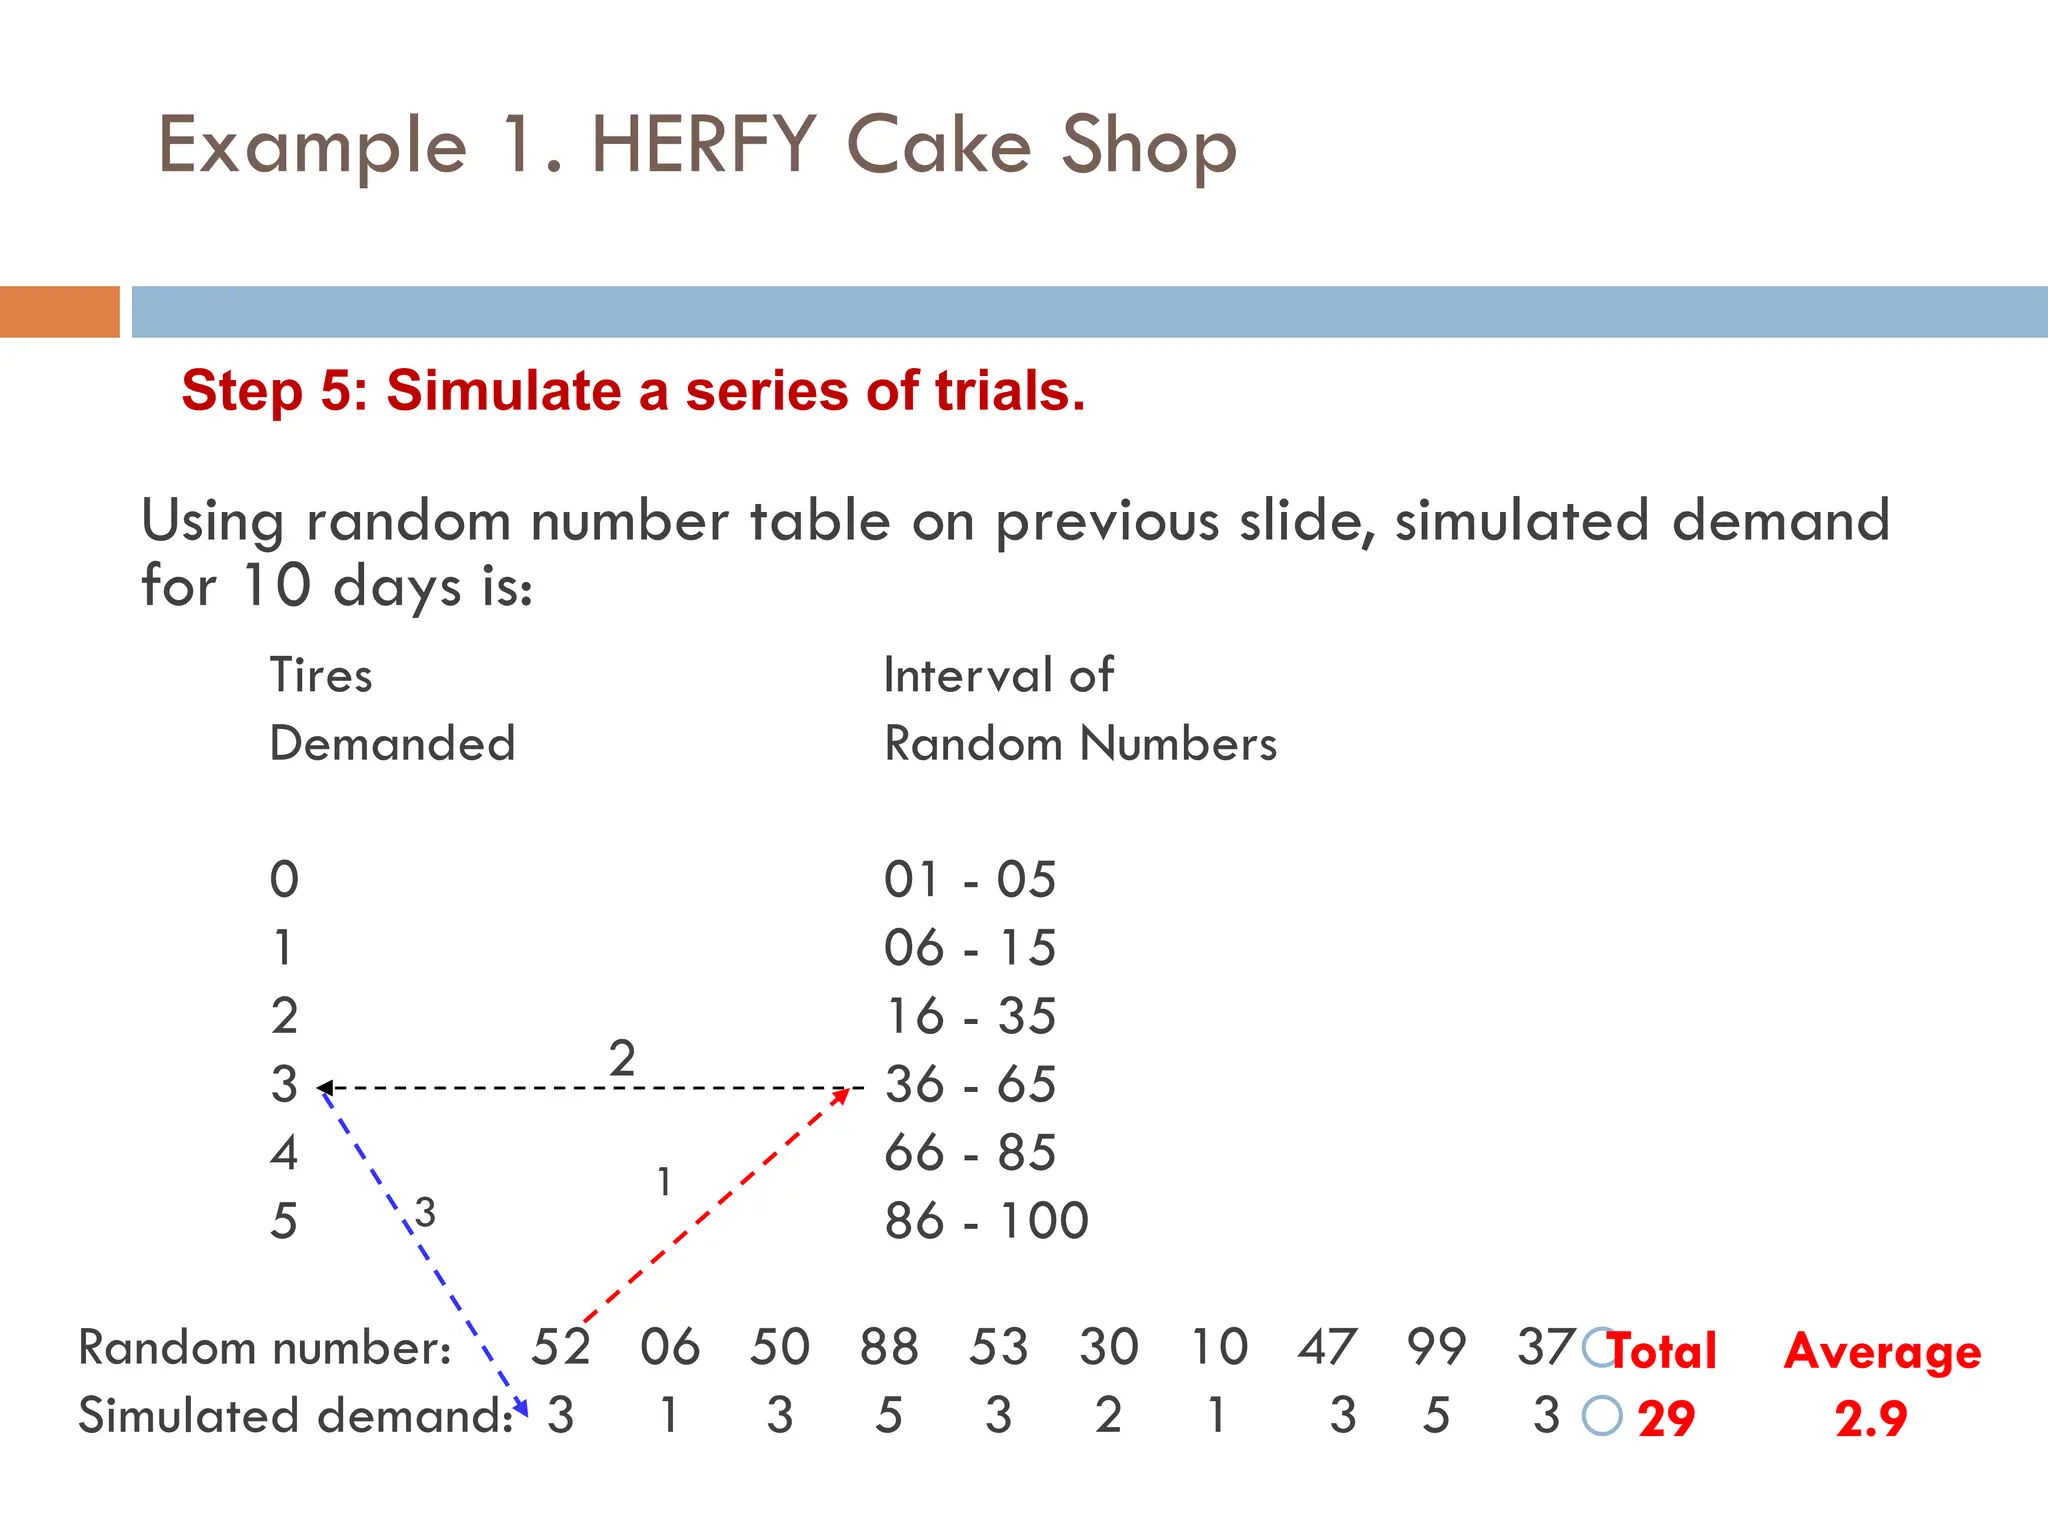
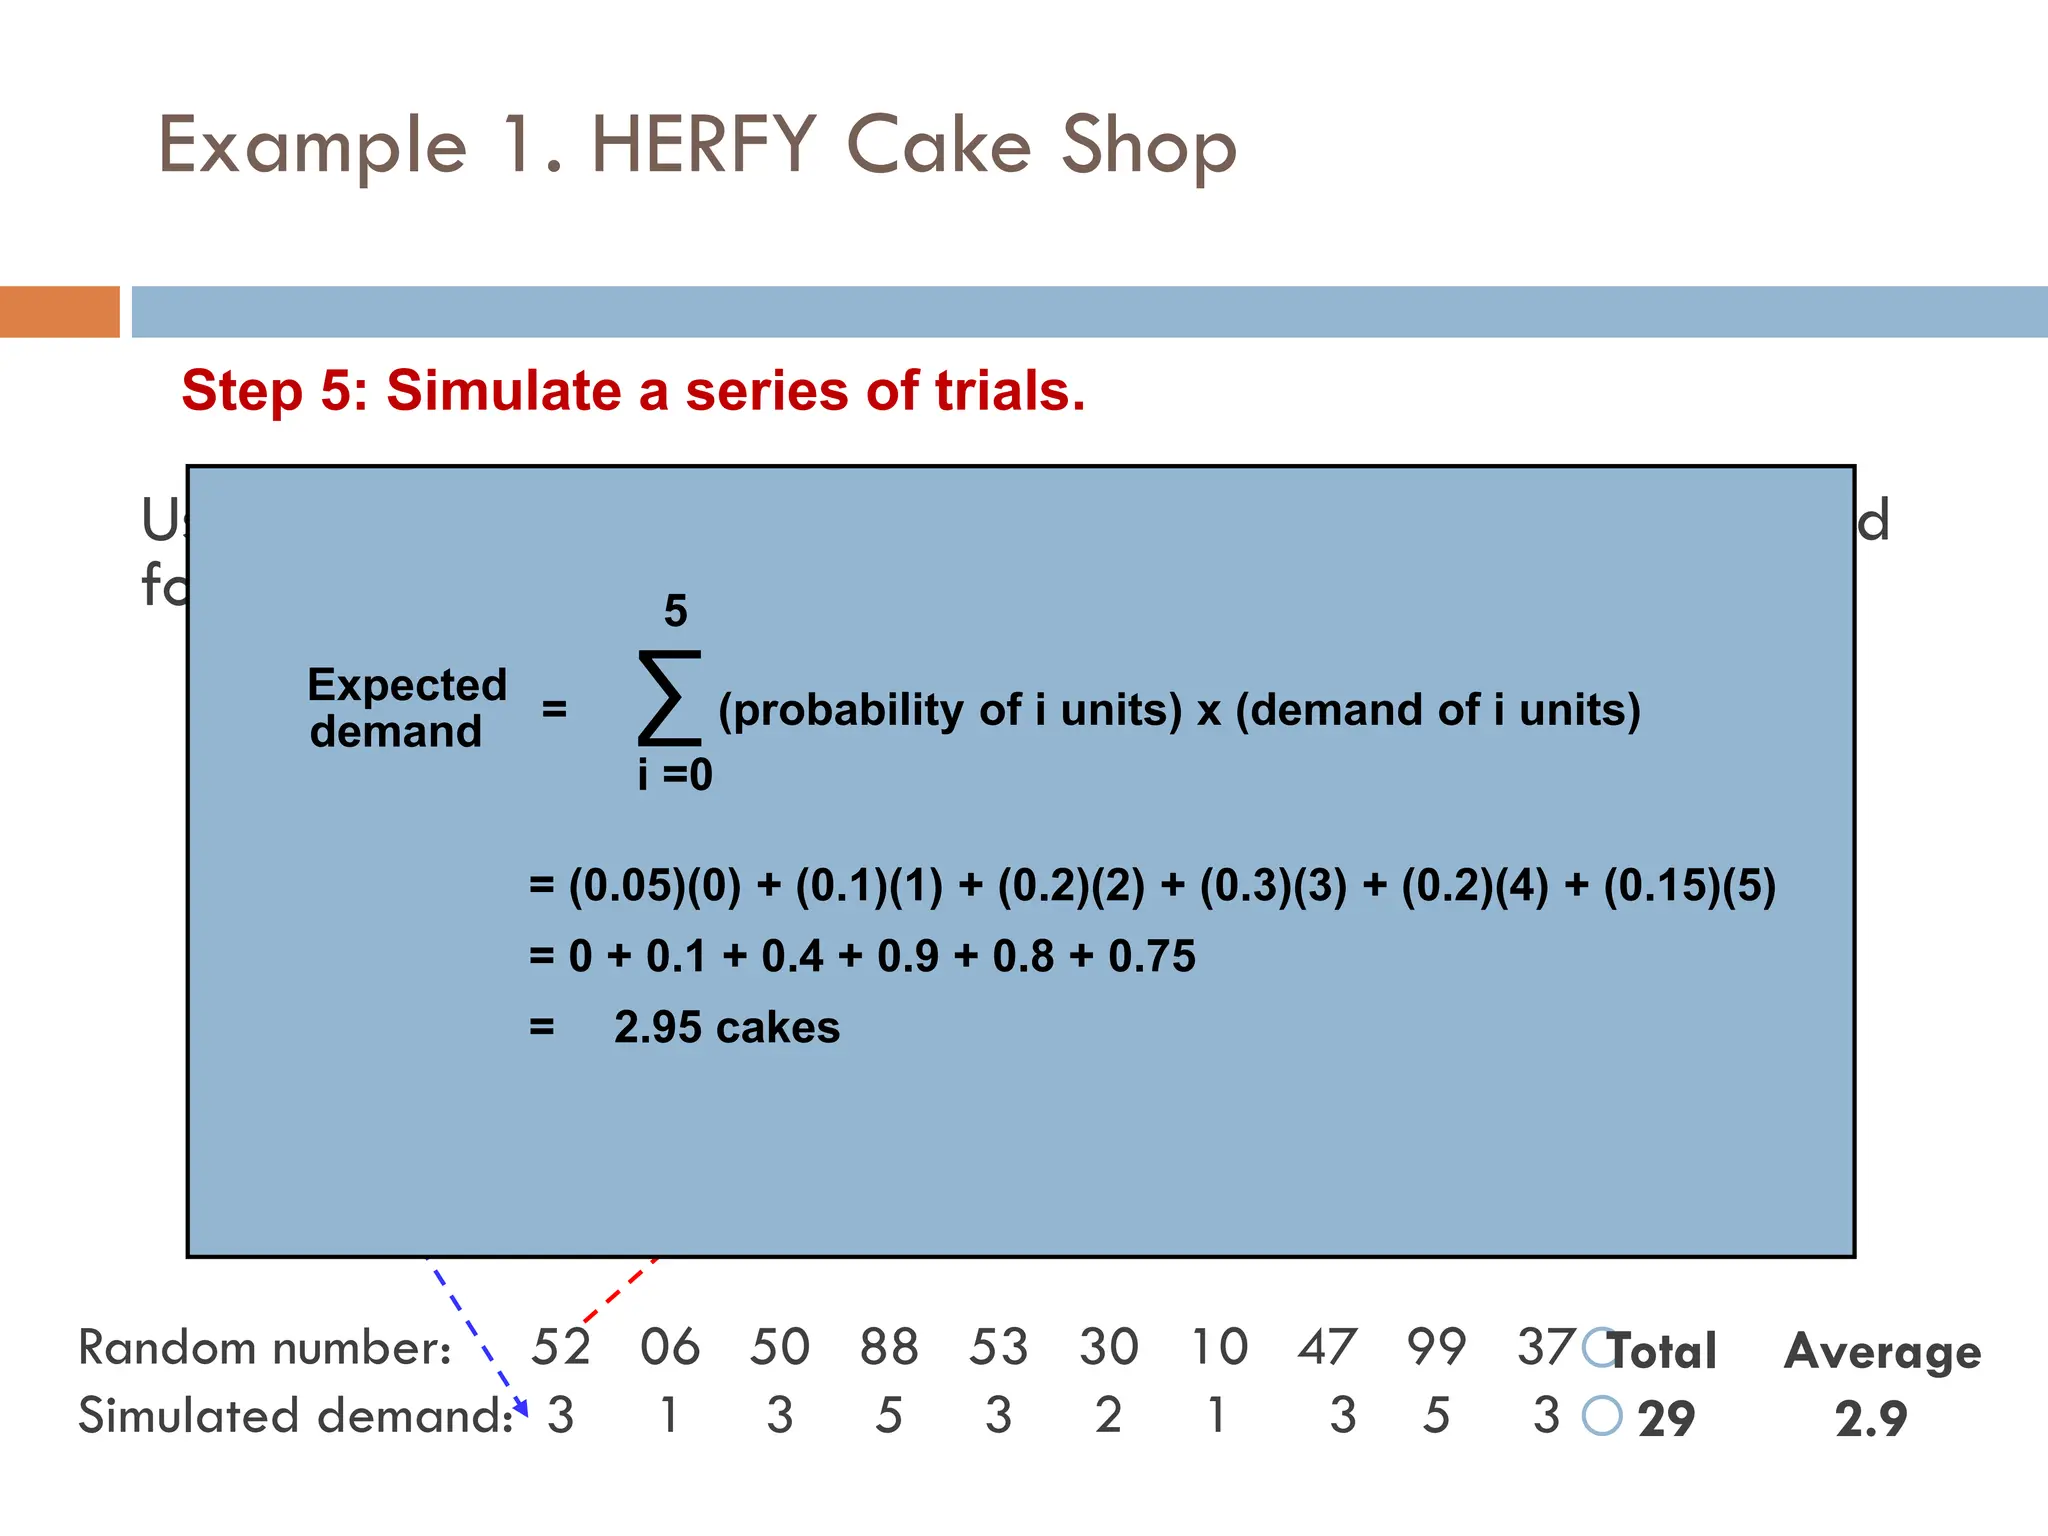
5. Simulate trials
4
5.
Examples
Example 1and Example 2: using Monte
Carlo simulation for the analysis of real
systems
5
Example 1. HERFYCake Shop
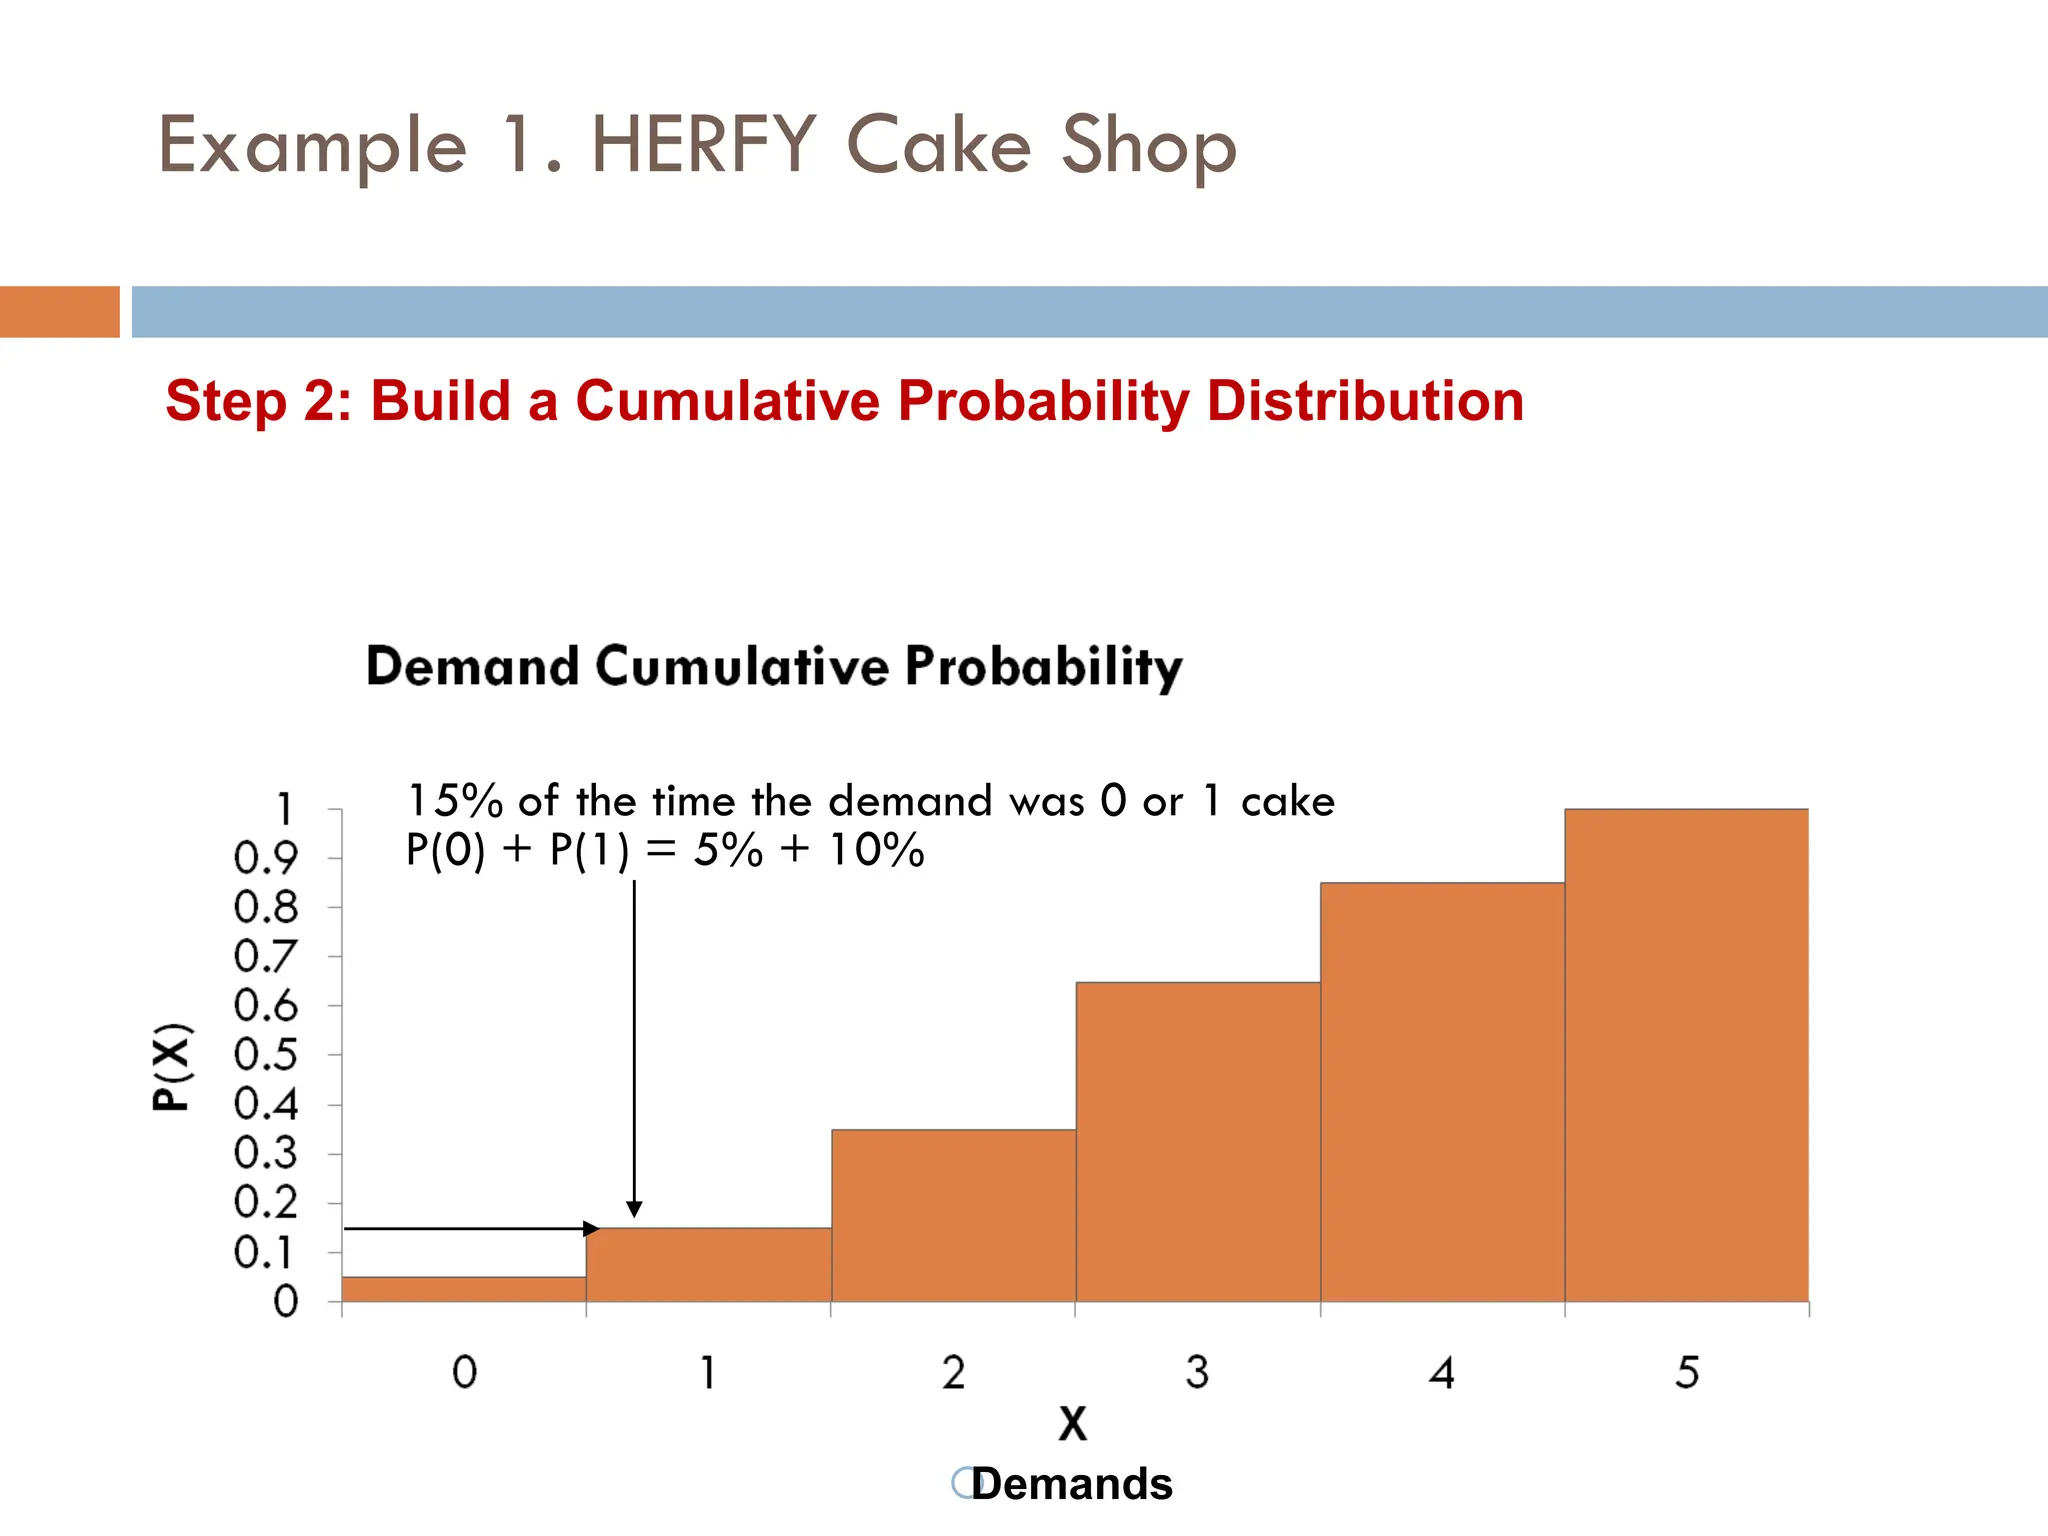
Step 2: Build a Cumulative Probability Distribution
15% of the time the demand was 0 or 1 cake
P(0) + P(1) = 5% + 10%
Demands
10.
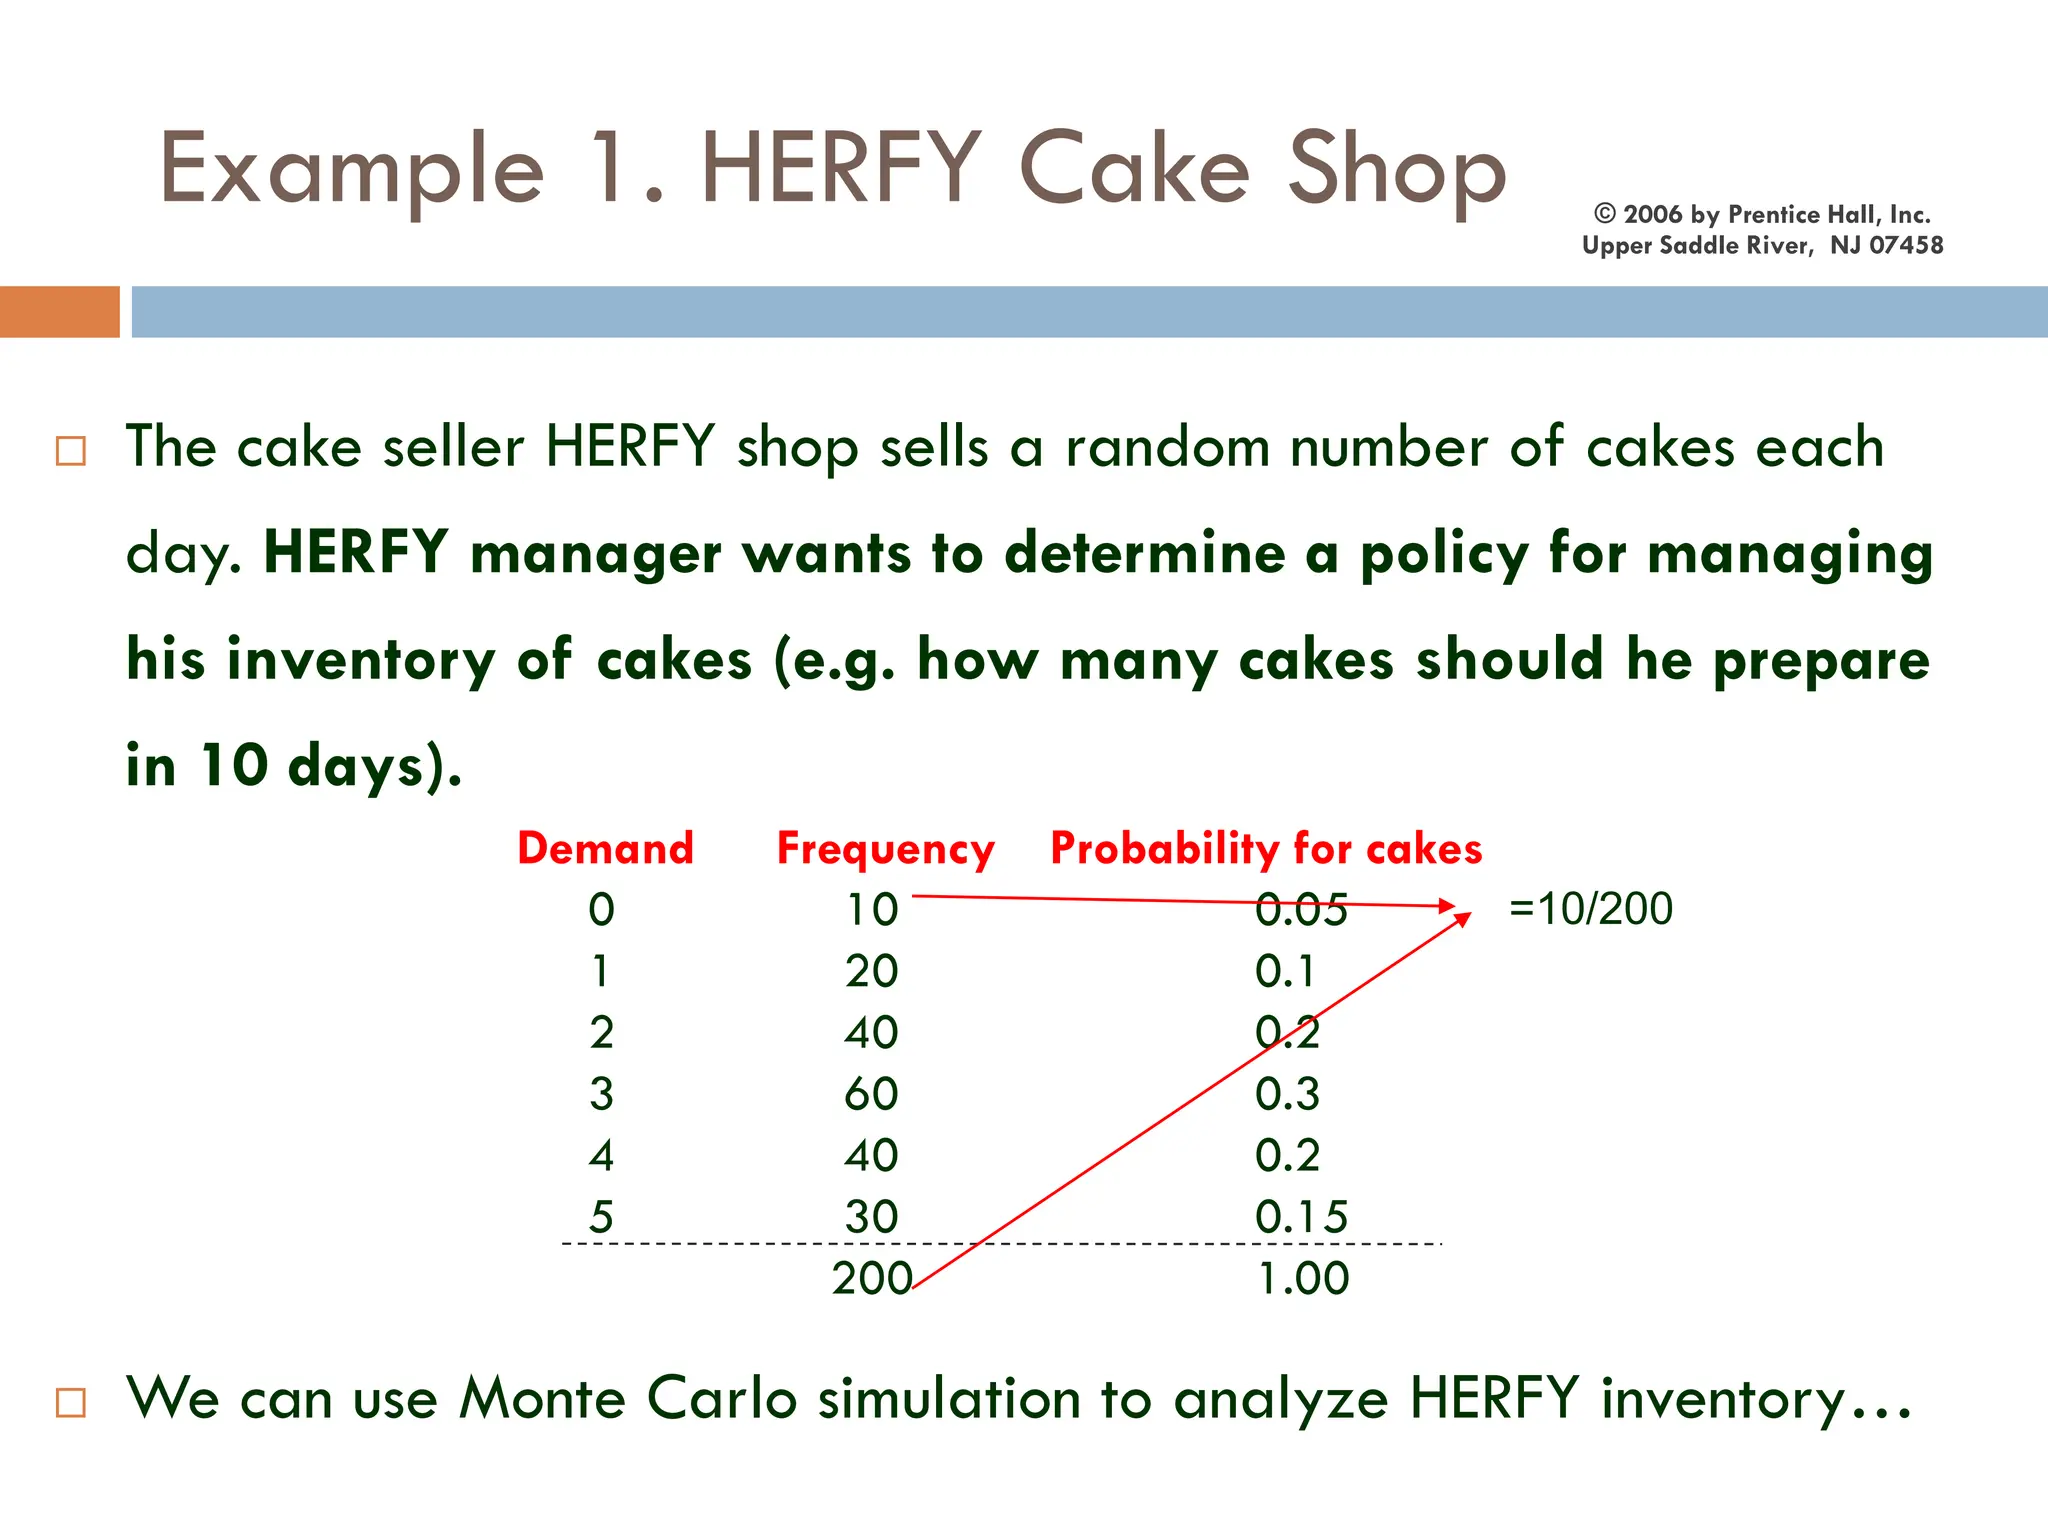
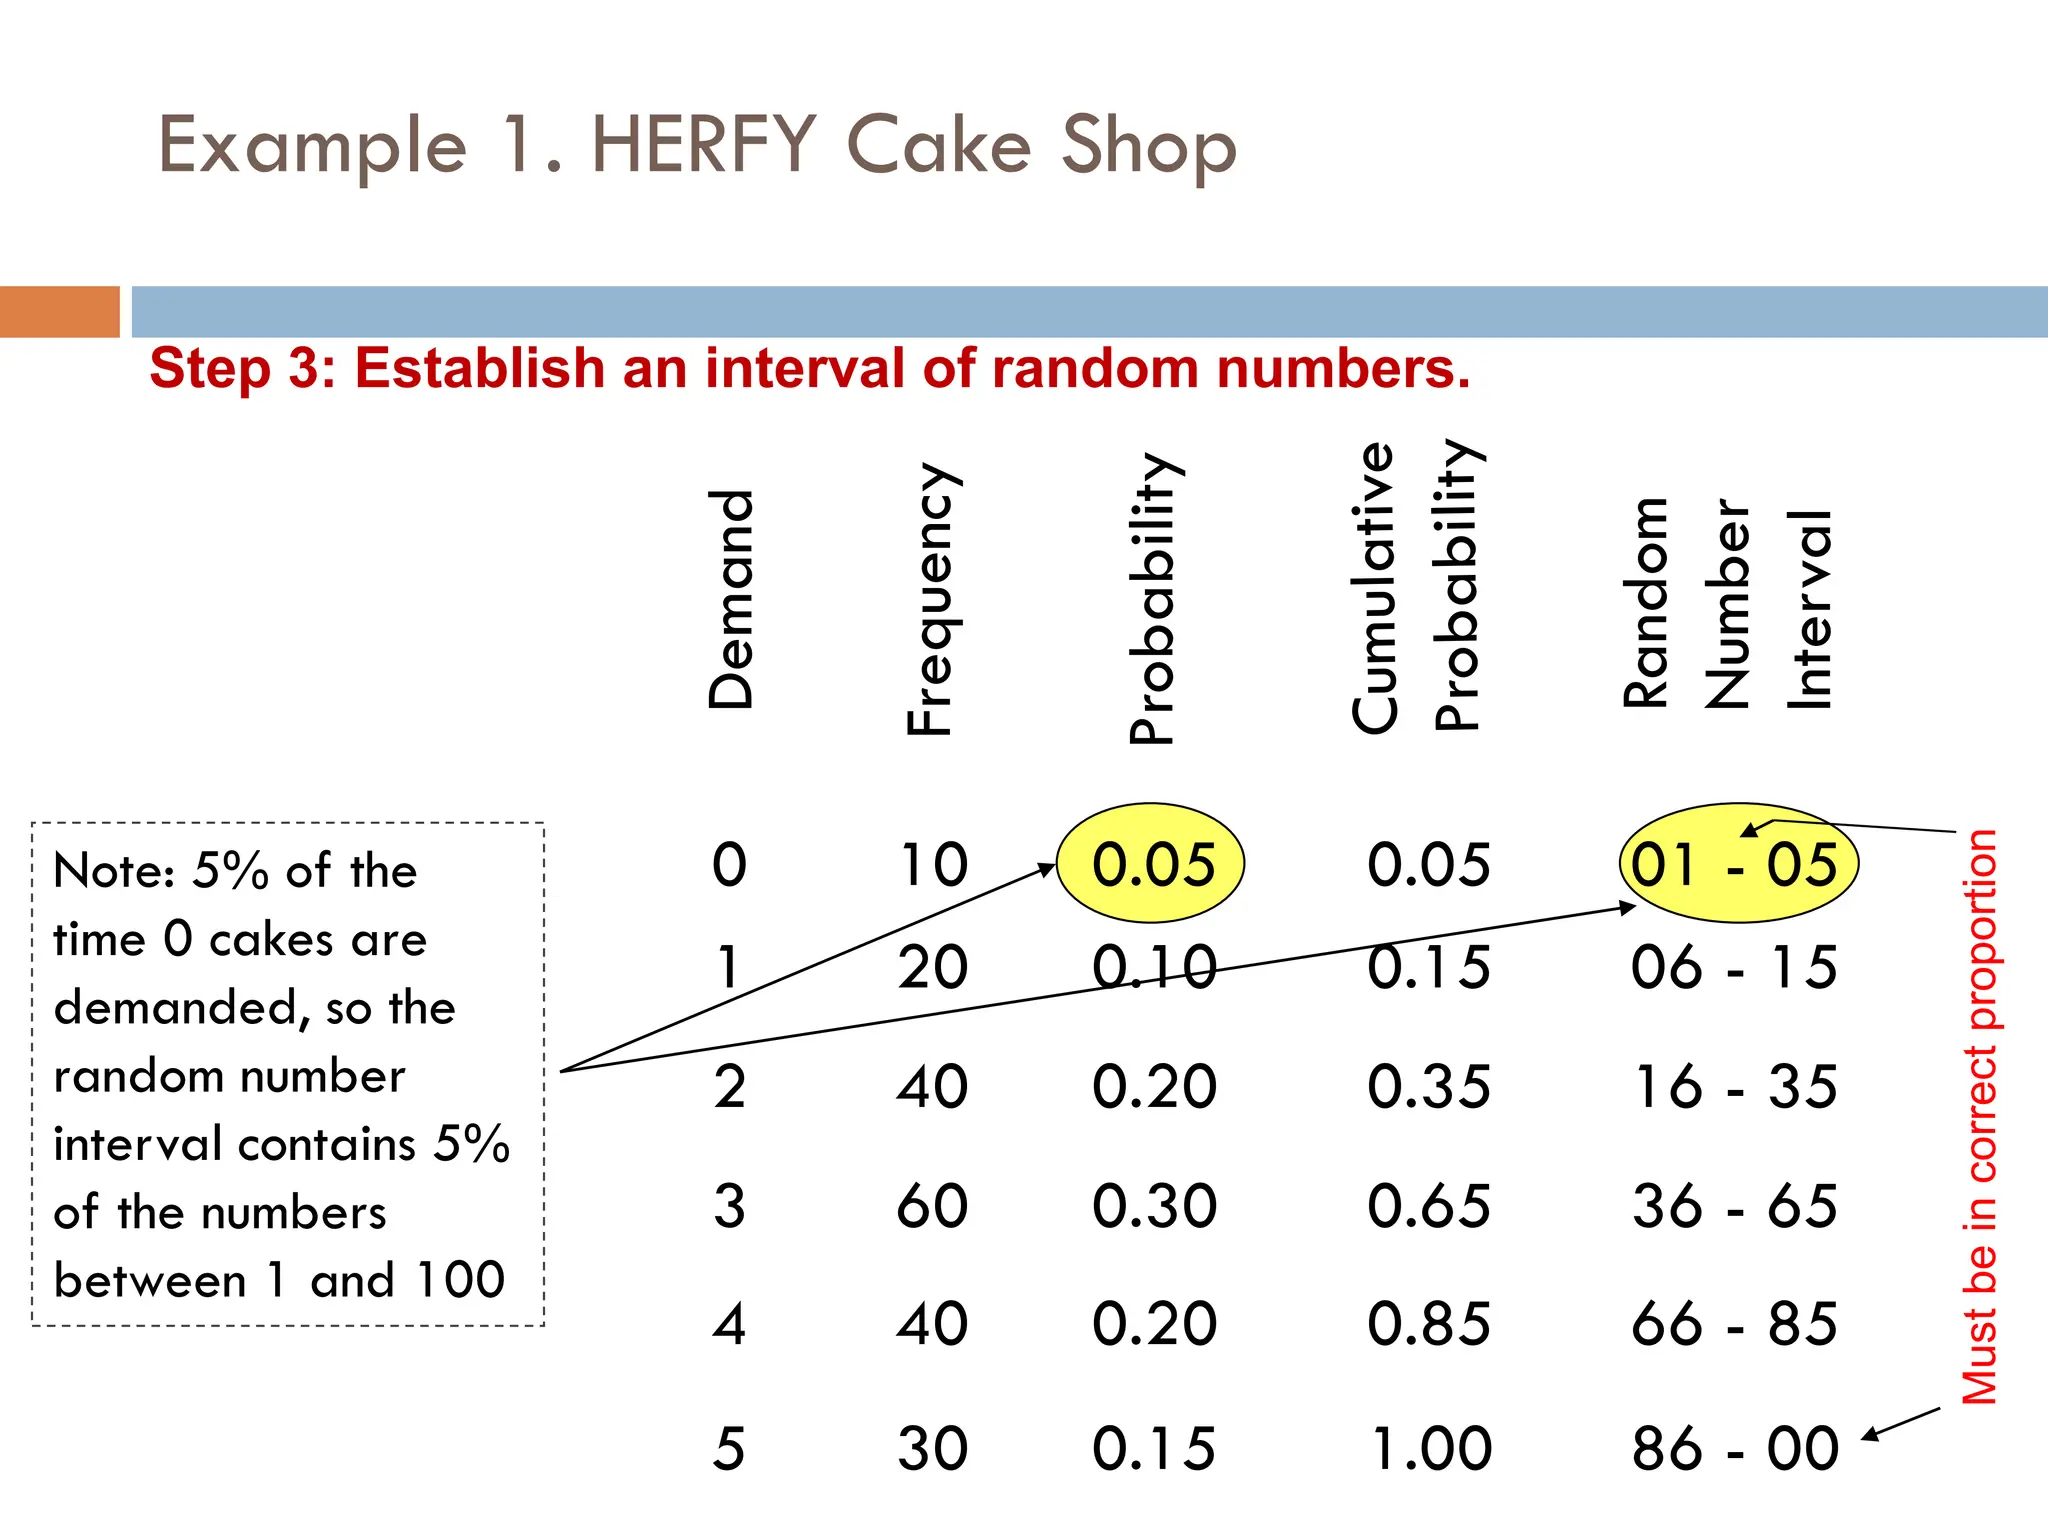
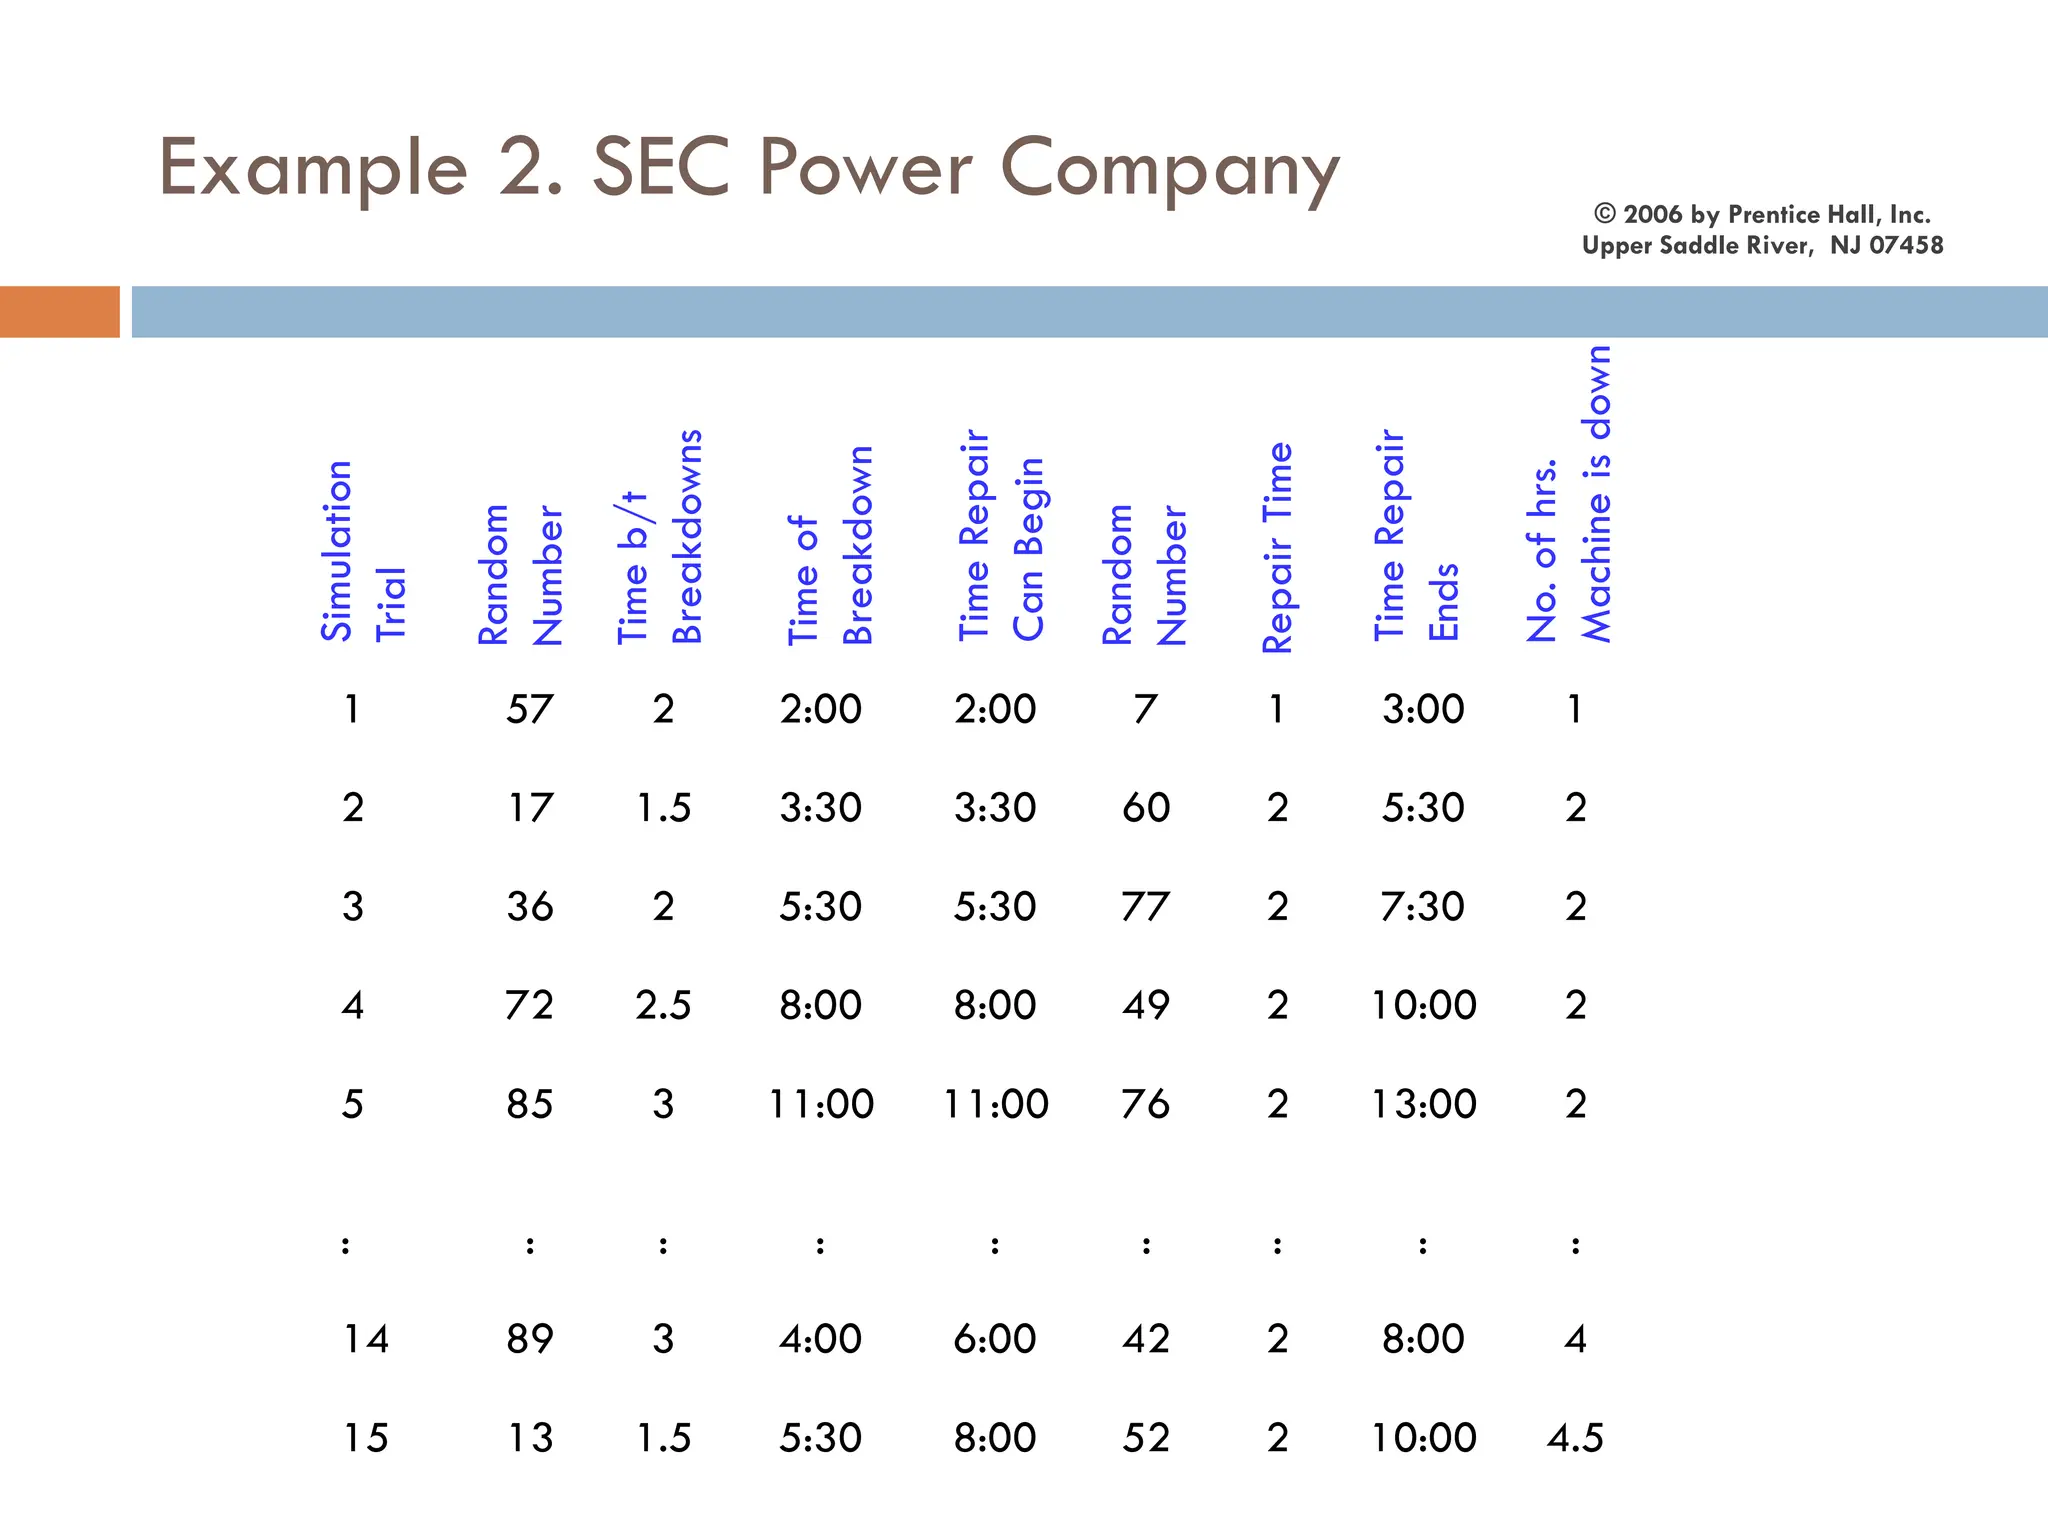
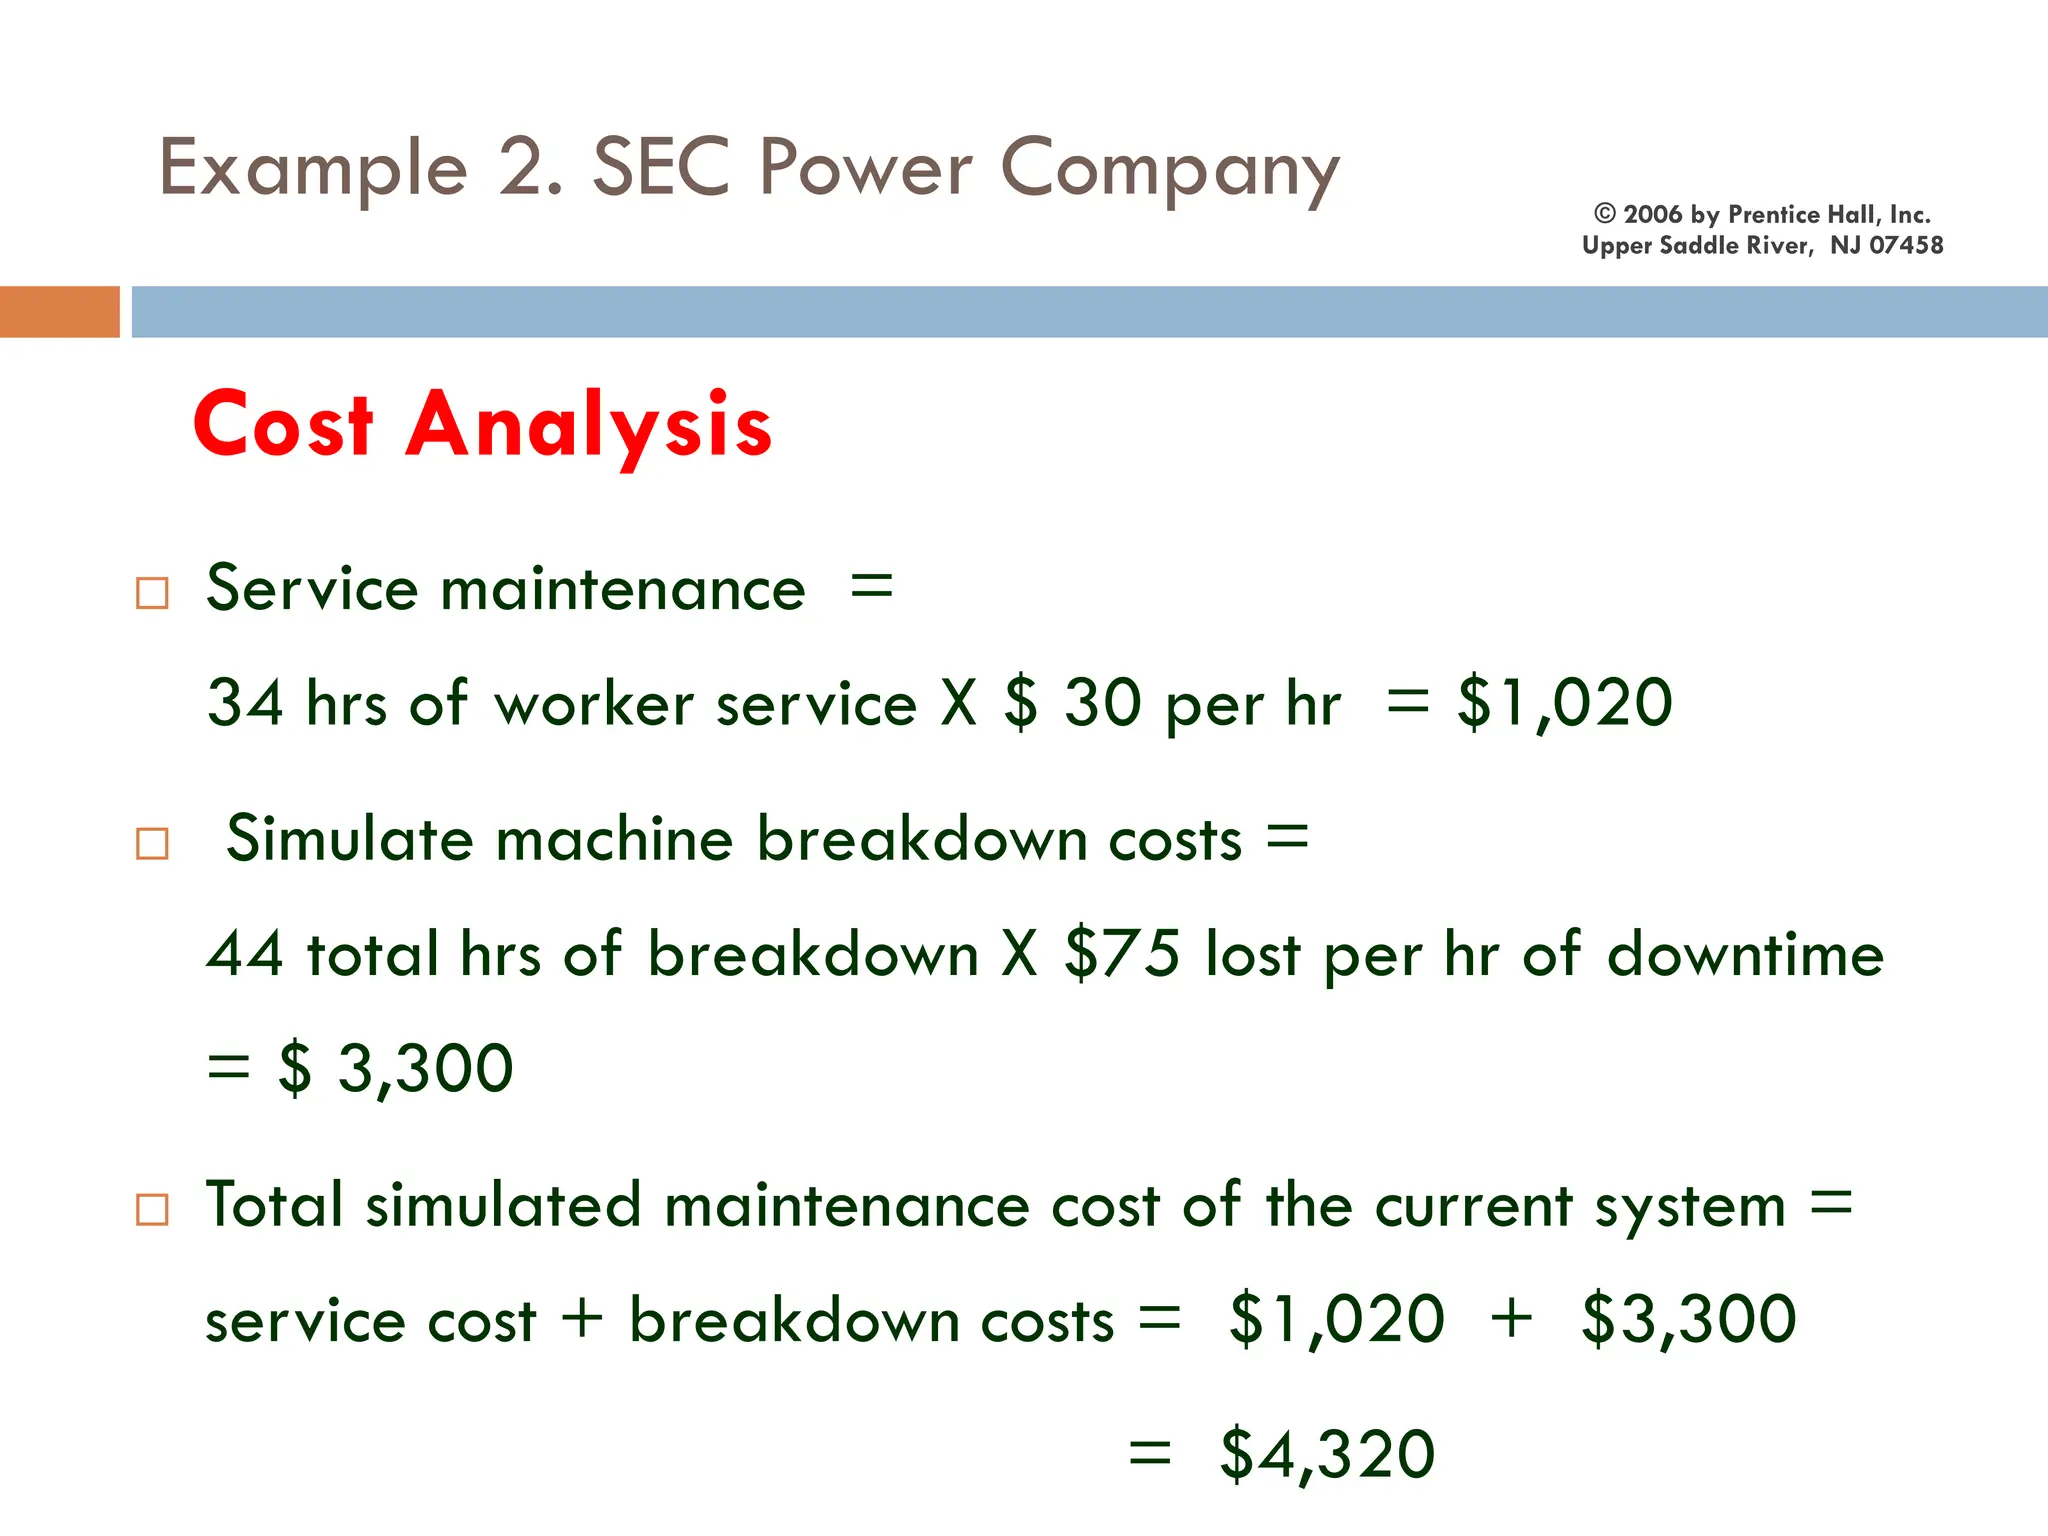
Example 1. HERFYCake Shop
Demand
Probability
Random
Number
Interval
0 10 0.05 0.05 01 - 05
1 20 0.10 0.15 06 - 15
2 40 0.20 0.35 16 - 35
3 60 0.30 0.65 36 - 65
4 40 0.20 0.85 66 - 85
5 30 0.15 1.00 86 - 00
Step 3: Establish an interval of random numbers.
Must
be
in
correct
proportion
Note: 5% of the
time 0 cakes are
demanded, so the
random number
interval contains 5%
of the numbers
between 1 and 100