Download as PDF, PPTX
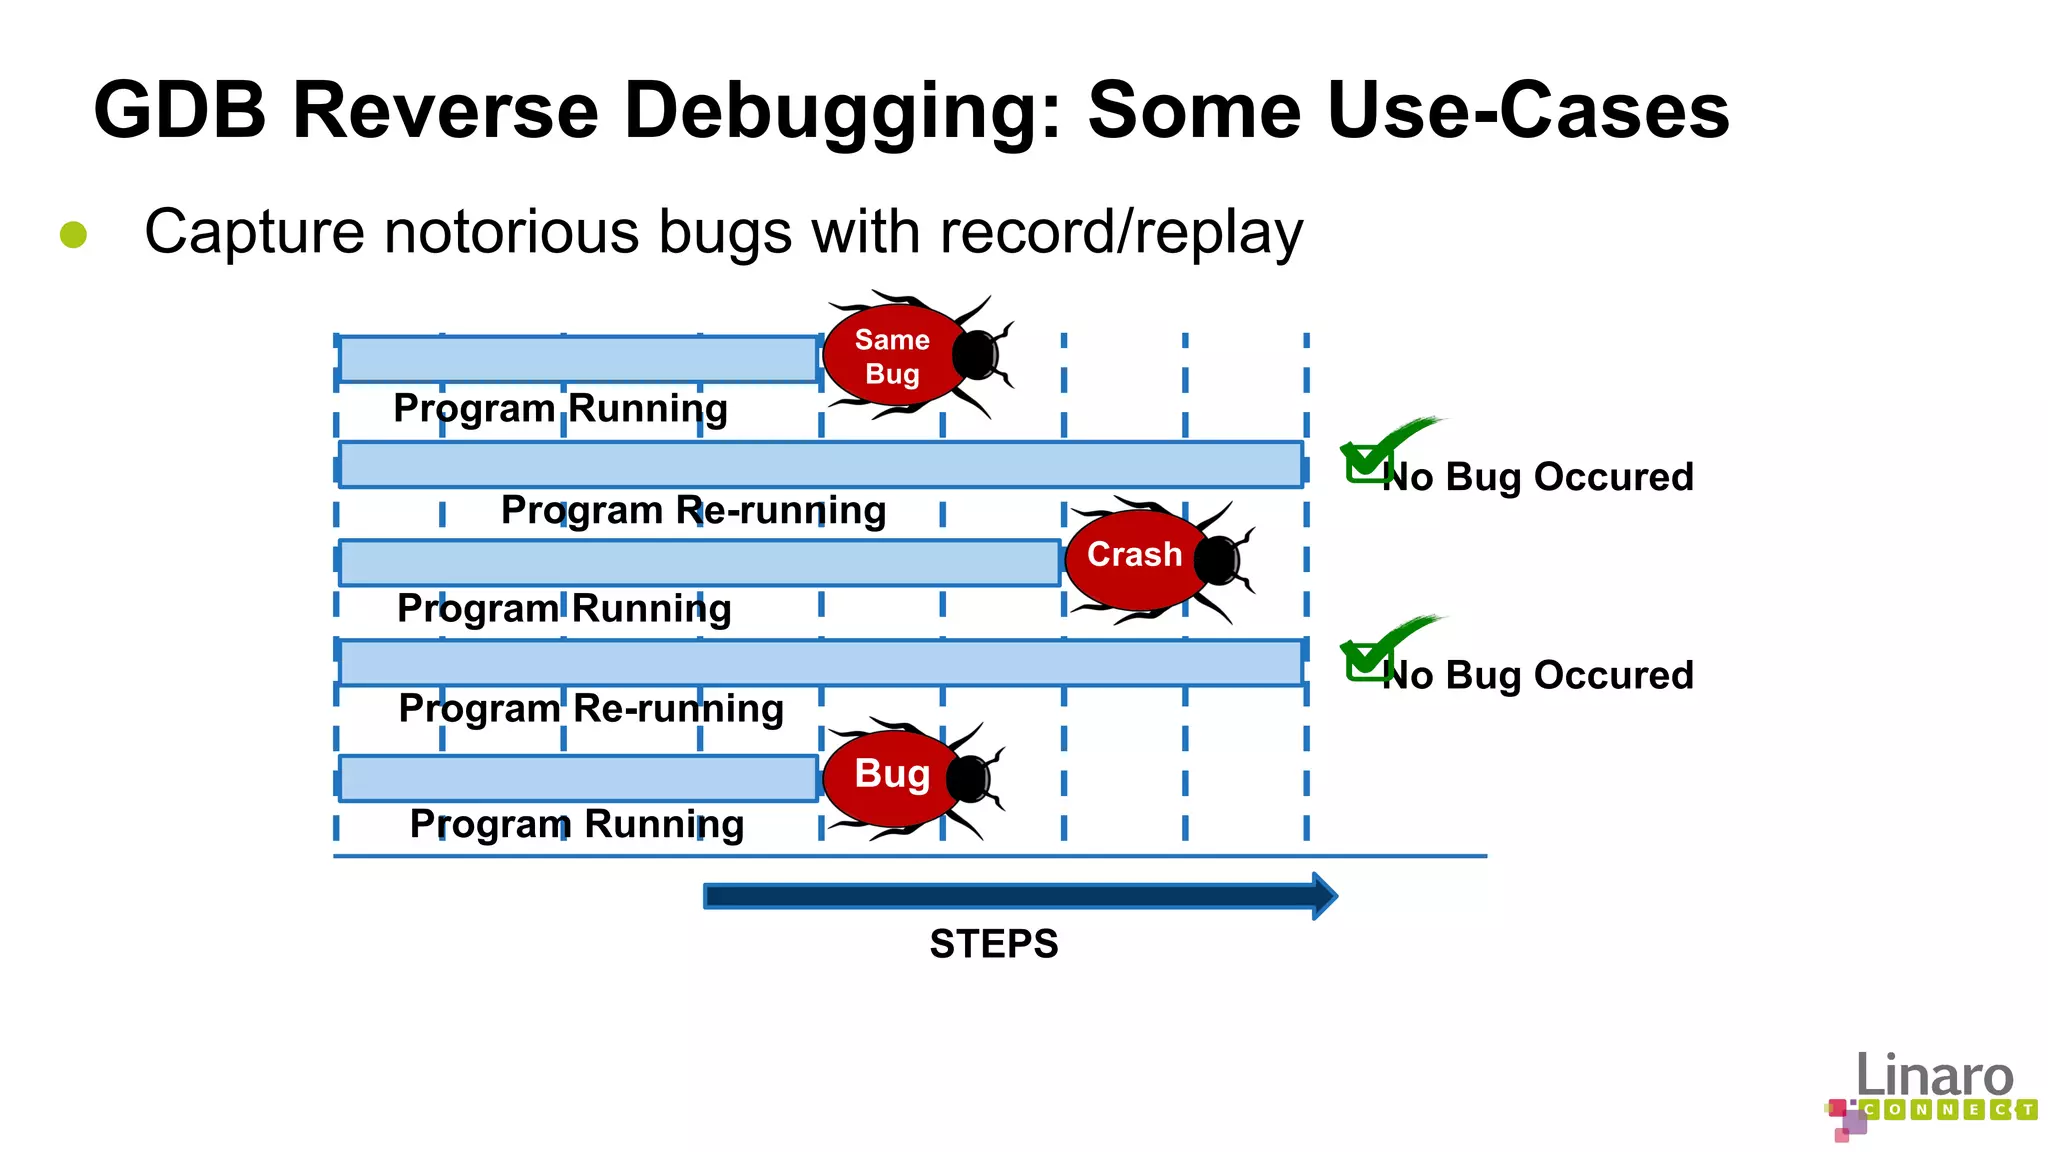
![ASAN: example
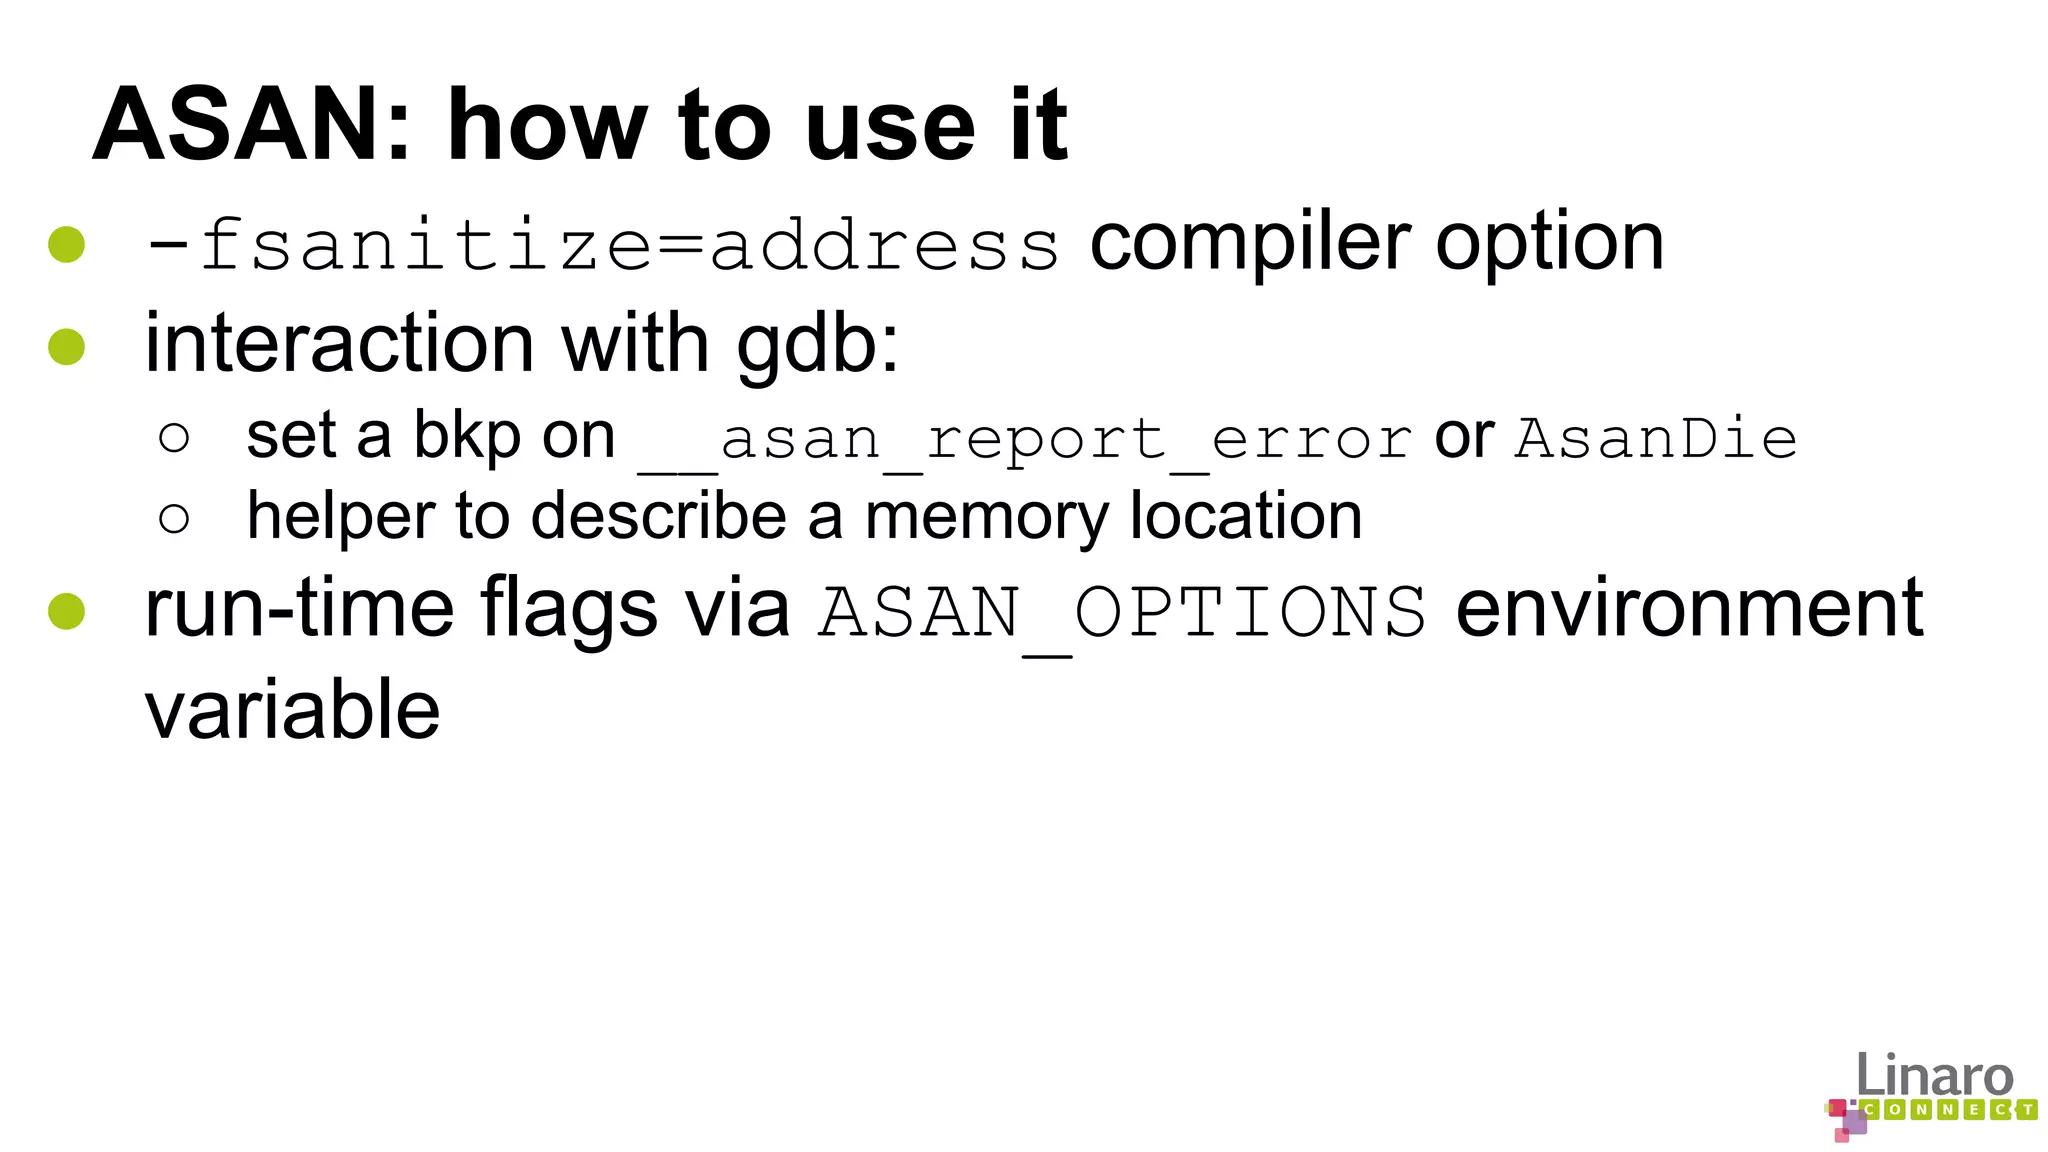
int main(int argc, char **argv) {
int *array = new int[100];
delete [] array;
return array[argc]; // Use after free
}
$ g++ -g -fsanitize=address asan.cc -o asan.exe
$ ./asan.exe
=================================================================
==21981==ERROR: AddressSanitizer: heap-use-after-free on address 0x61400000fe44 at pc 0x400834 bp 0x7fff631c2030 sp
0x7fff631c2028
READ of size 4 at 0x61400000fe44 thread T0
#0 0x400833 in main /tmp/asan.cc:4
#1 0x3a3ae1ecdc in __libc_start_main (/lib64/libc.so.6+0x3a3ae1ecdc)
#2 0x4006b8 (/tmp/asan.exe+0x4006b8)
0x61400000fe44 is located 4 bytes inside of 400-byte region [0x61400000fe40,0x61400000ffd0)
freed by thread T0 here:
#0 0x7fa4b8268617 in operator delete[](void*) (/lib64/libasan.so.1+0x55617)
#1 0x4007e7 in main /tmp/asan.cc:3
#2 0x3a3ae1ecdc in __libc_start_main (/lib64/libc.so.6+0x3a3ae1ecdc)](https://image.slidesharecdn.com/lcu14-201-binaryanalysistools-140912162414-phpapp02/75/LCU14-201-Binary-Analysis-Tools-7-2048.jpg)
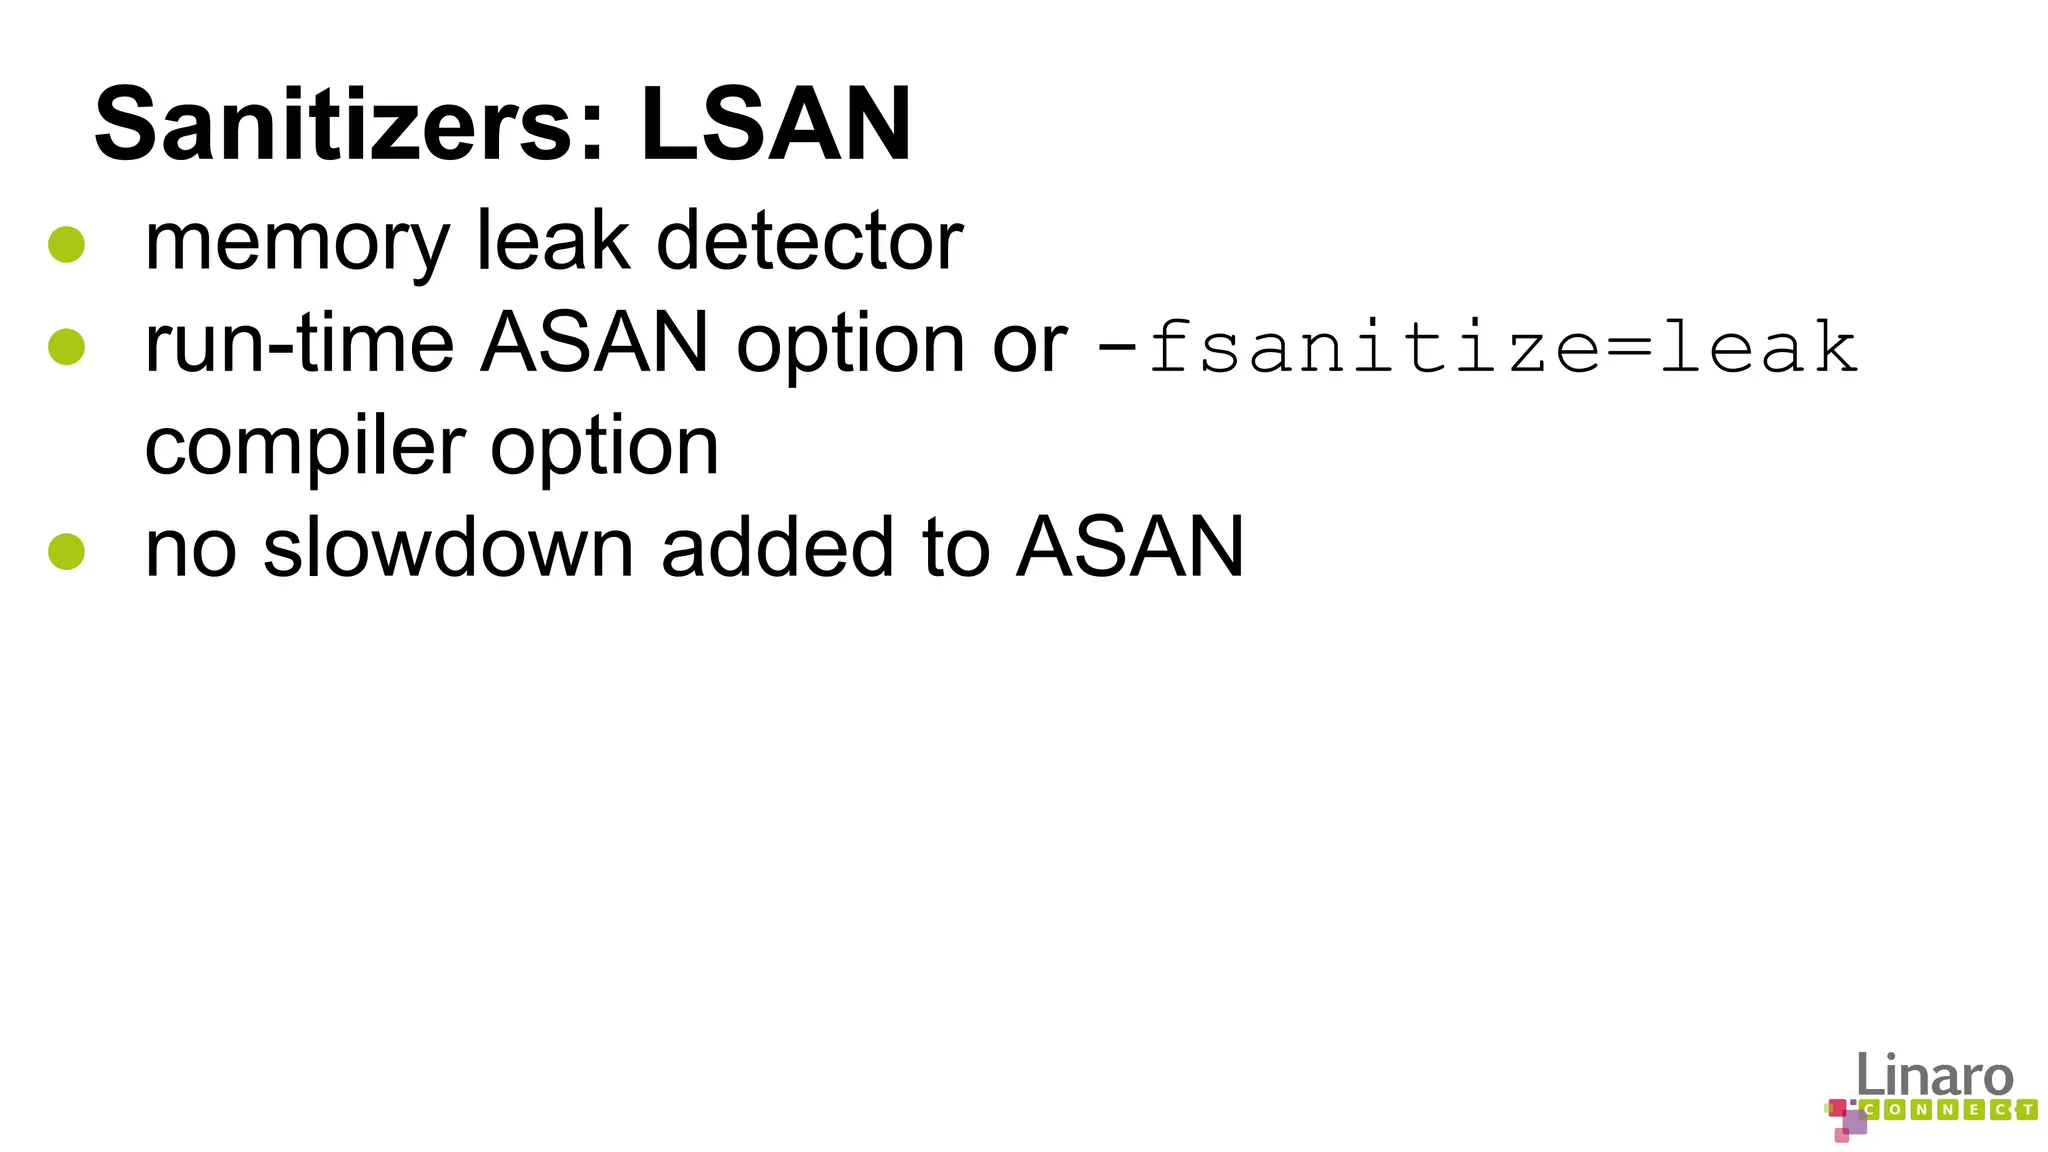
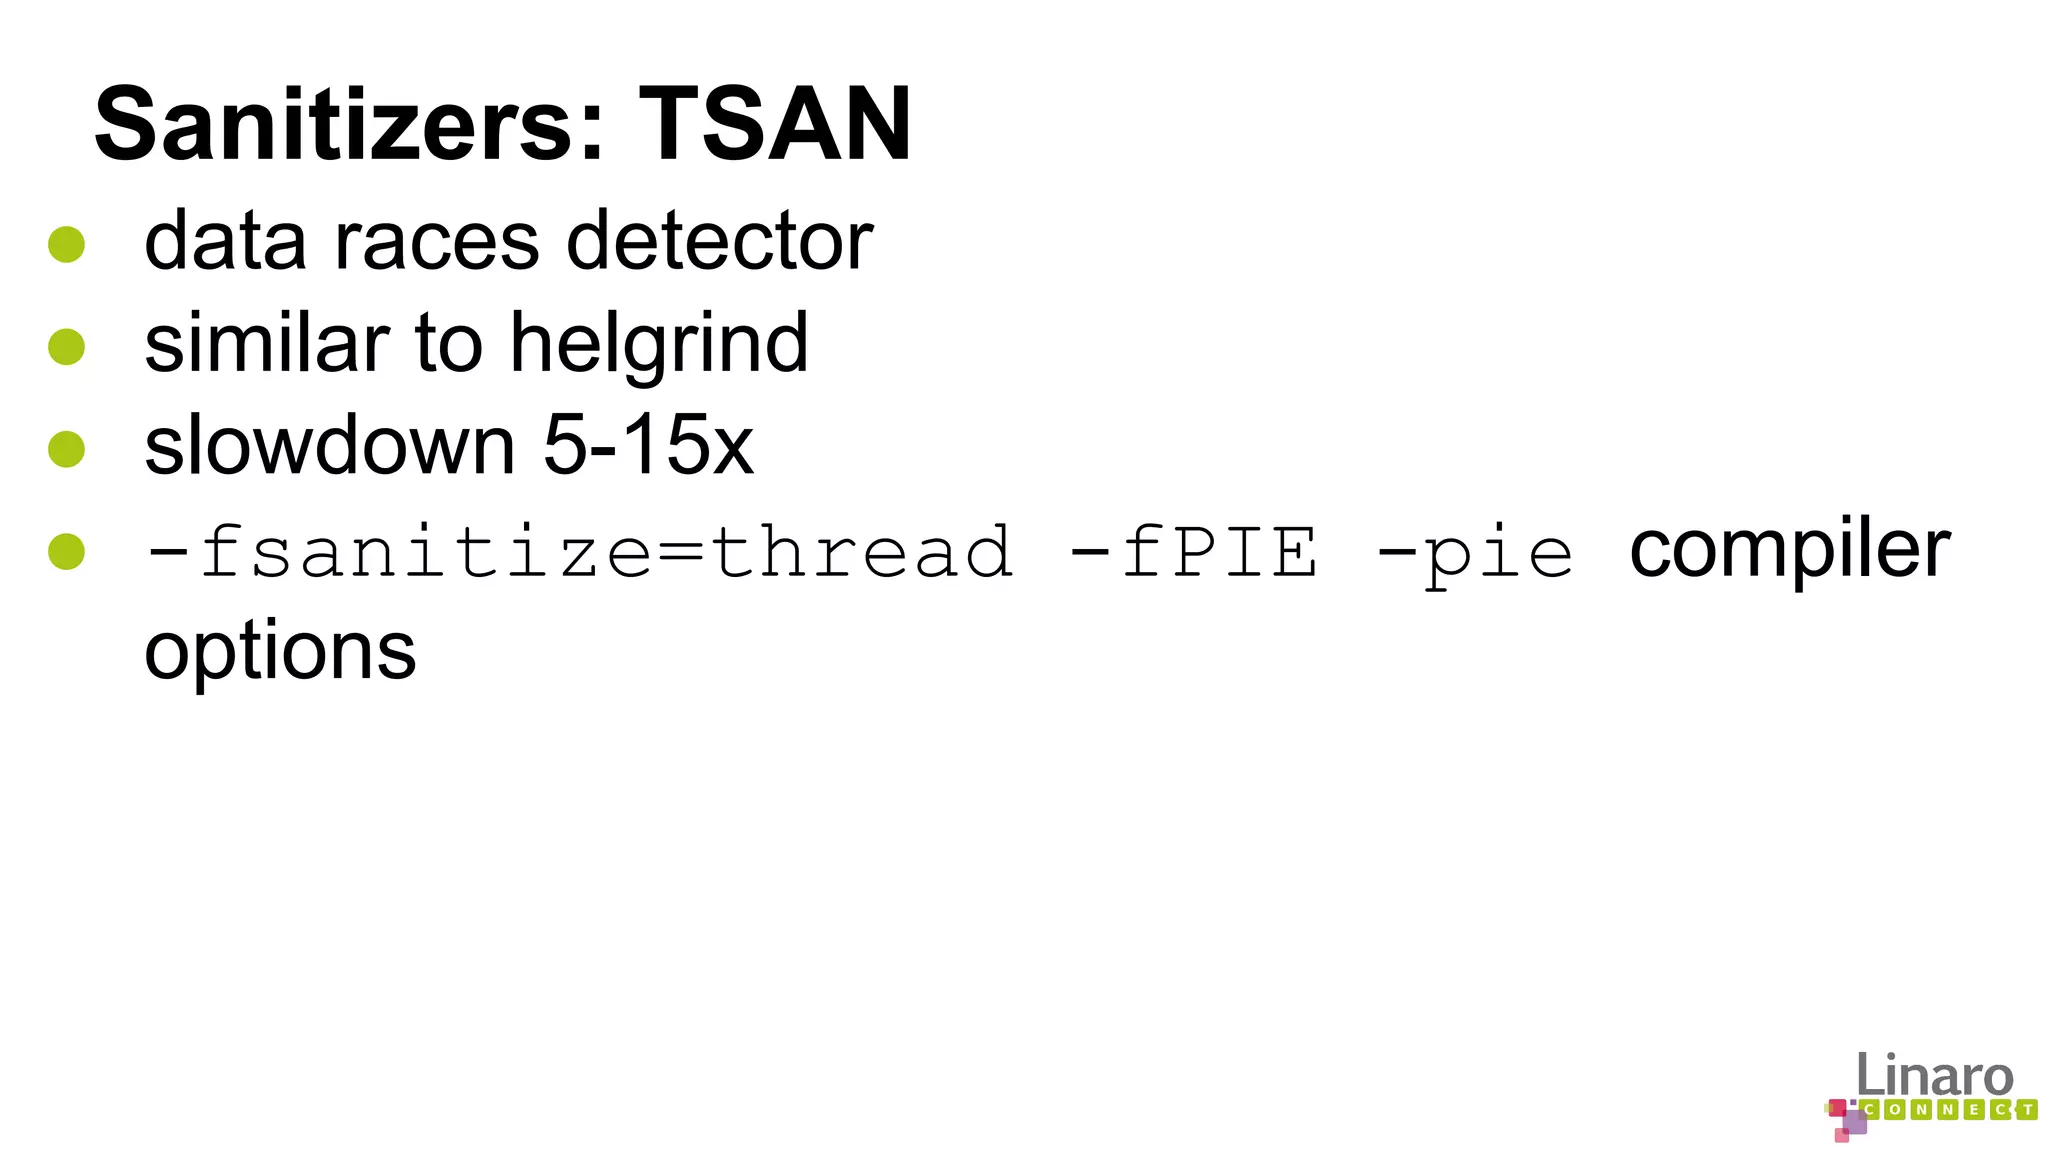
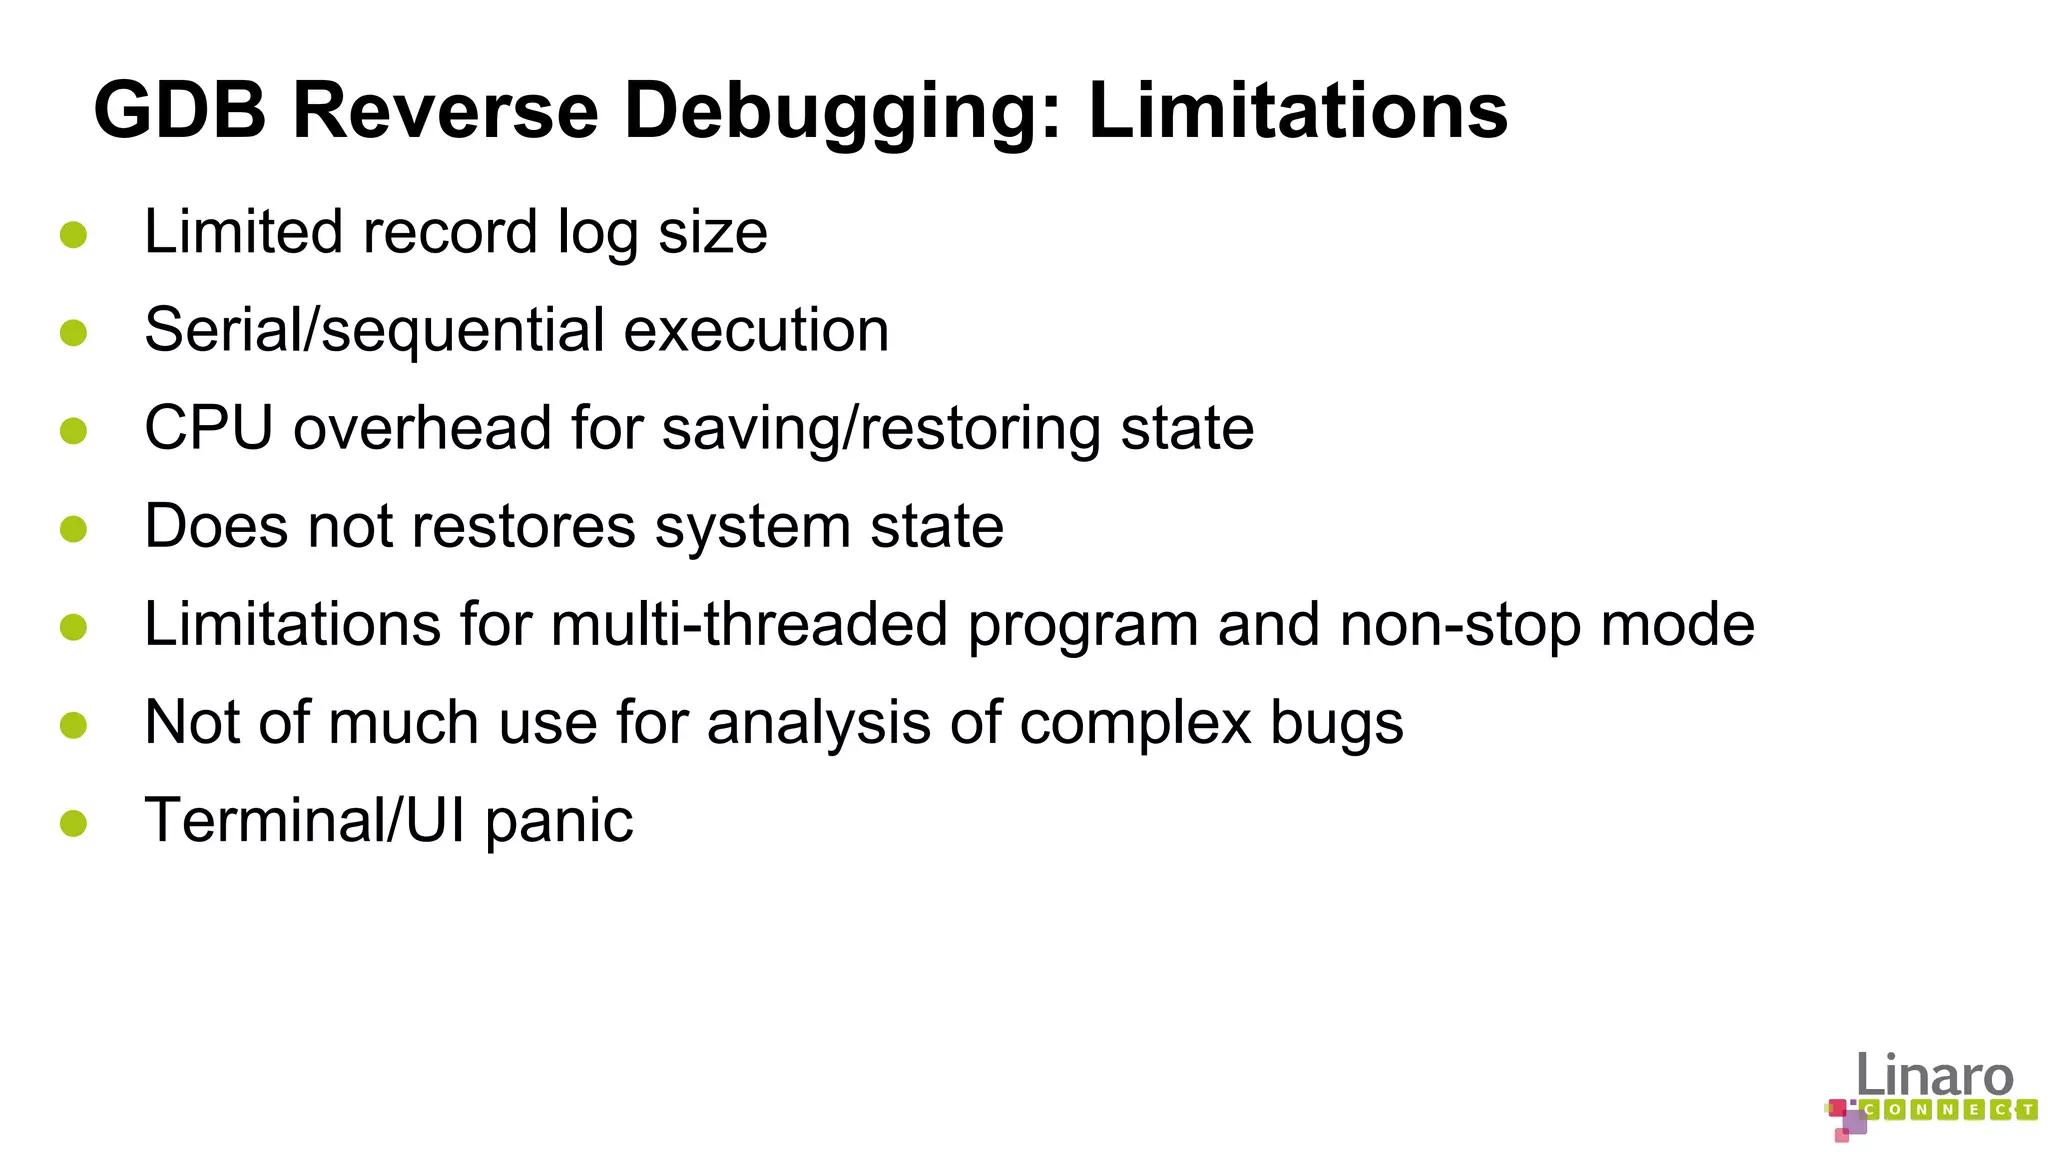
![TSAN: example #include <pthread.h>
#include <stdio.h>
#include <string>
#include <map>
typedef std::map<std::string,
std::string> map_t;
void *threadfunc(void *p)
{
map_t& m = *(map_t*)p;
m["foo"] = "bar";
return 0;
}
$ g++ -g -fsanitize=thread tsan.cc -o tsan.exe -pie -fPIE
$ ./tsan.exe
foo=
==================
WARNING: ThreadSanitizer: data race (pid=24197)
Read of size 1 at 0x7d080000efd8 by thread T1:
int main() {
map_t m;
pthread_t t;
pthread_create(&t, 0, threadfunc, &m);
printf("foo=%sn", m["foo"].c_str());
pthread_join(t, 0);
}
#0 memcmp <null>:0 (libtsan.so.0+0x000000048e7d)
#1 std::string::compare(std::string const&) const <null>:0 (libstdc++.so.6+0x0000000bd9a2)
#2 std::less<std::string>::operator()(std::string const&, std::string const&) const /include/c++/4.9.0
/bits/stl_function.h:367 (tsan.exe+0x0000000018e3)
#3 std::_Rb_tree<std::string, std::pair<std::string const, std::string>, std::_Select1st<std::pair<std::string
const, std::string> >, std::less<std::string>, std::allocator<std::pair<std::string const, std::string> > >::
_M_lower_bound(std::_Rb_tree_node<std::pair<std::string const, std::string> >*, std::_Rb_tree_node<std::pair<std::](https://image.slidesharecdn.com/lcu14-201-binaryanalysistools-140912162414-phpapp02/75/LCU14-201-Binary-Analysis-Tools-11-2048.jpg)
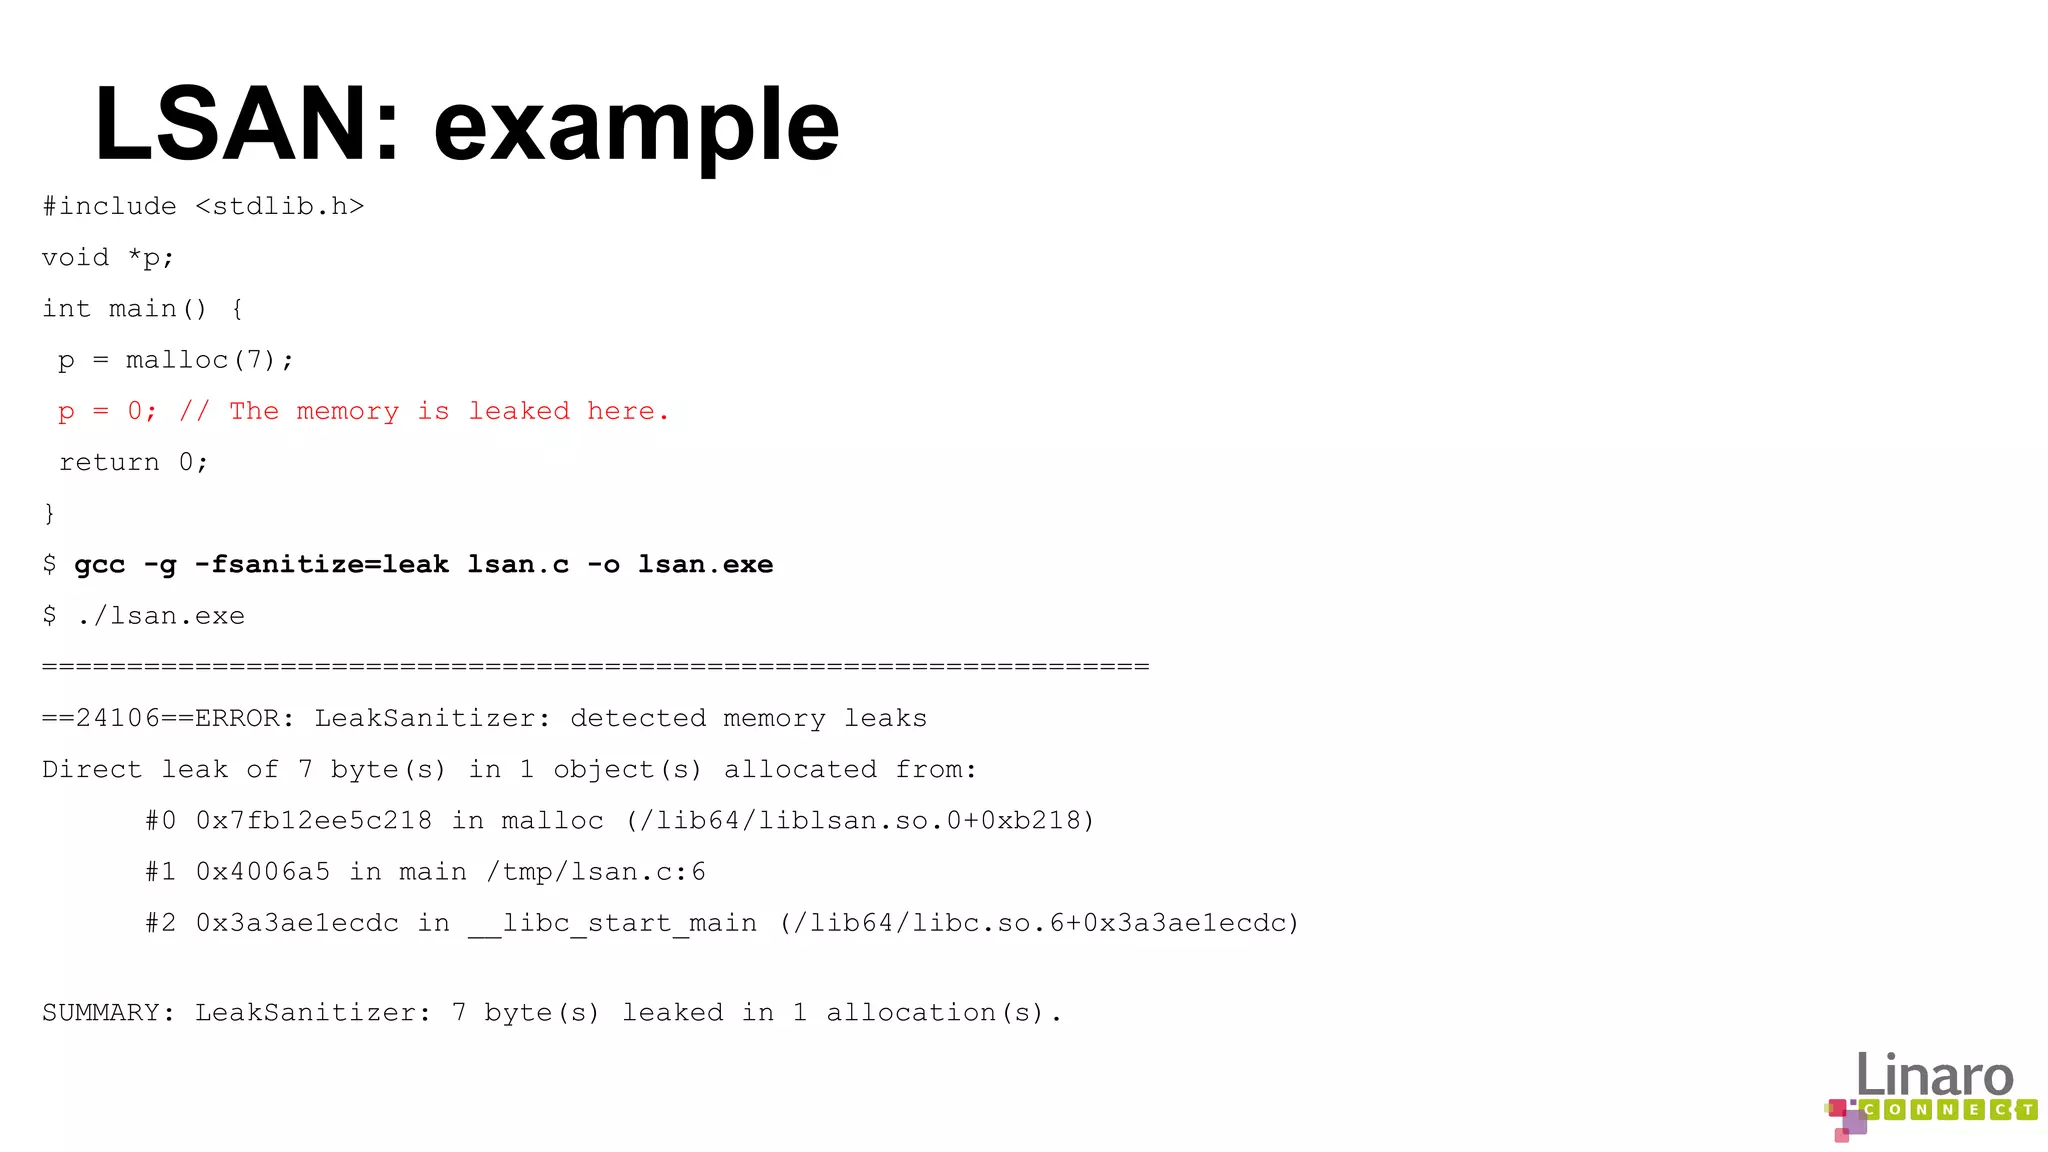
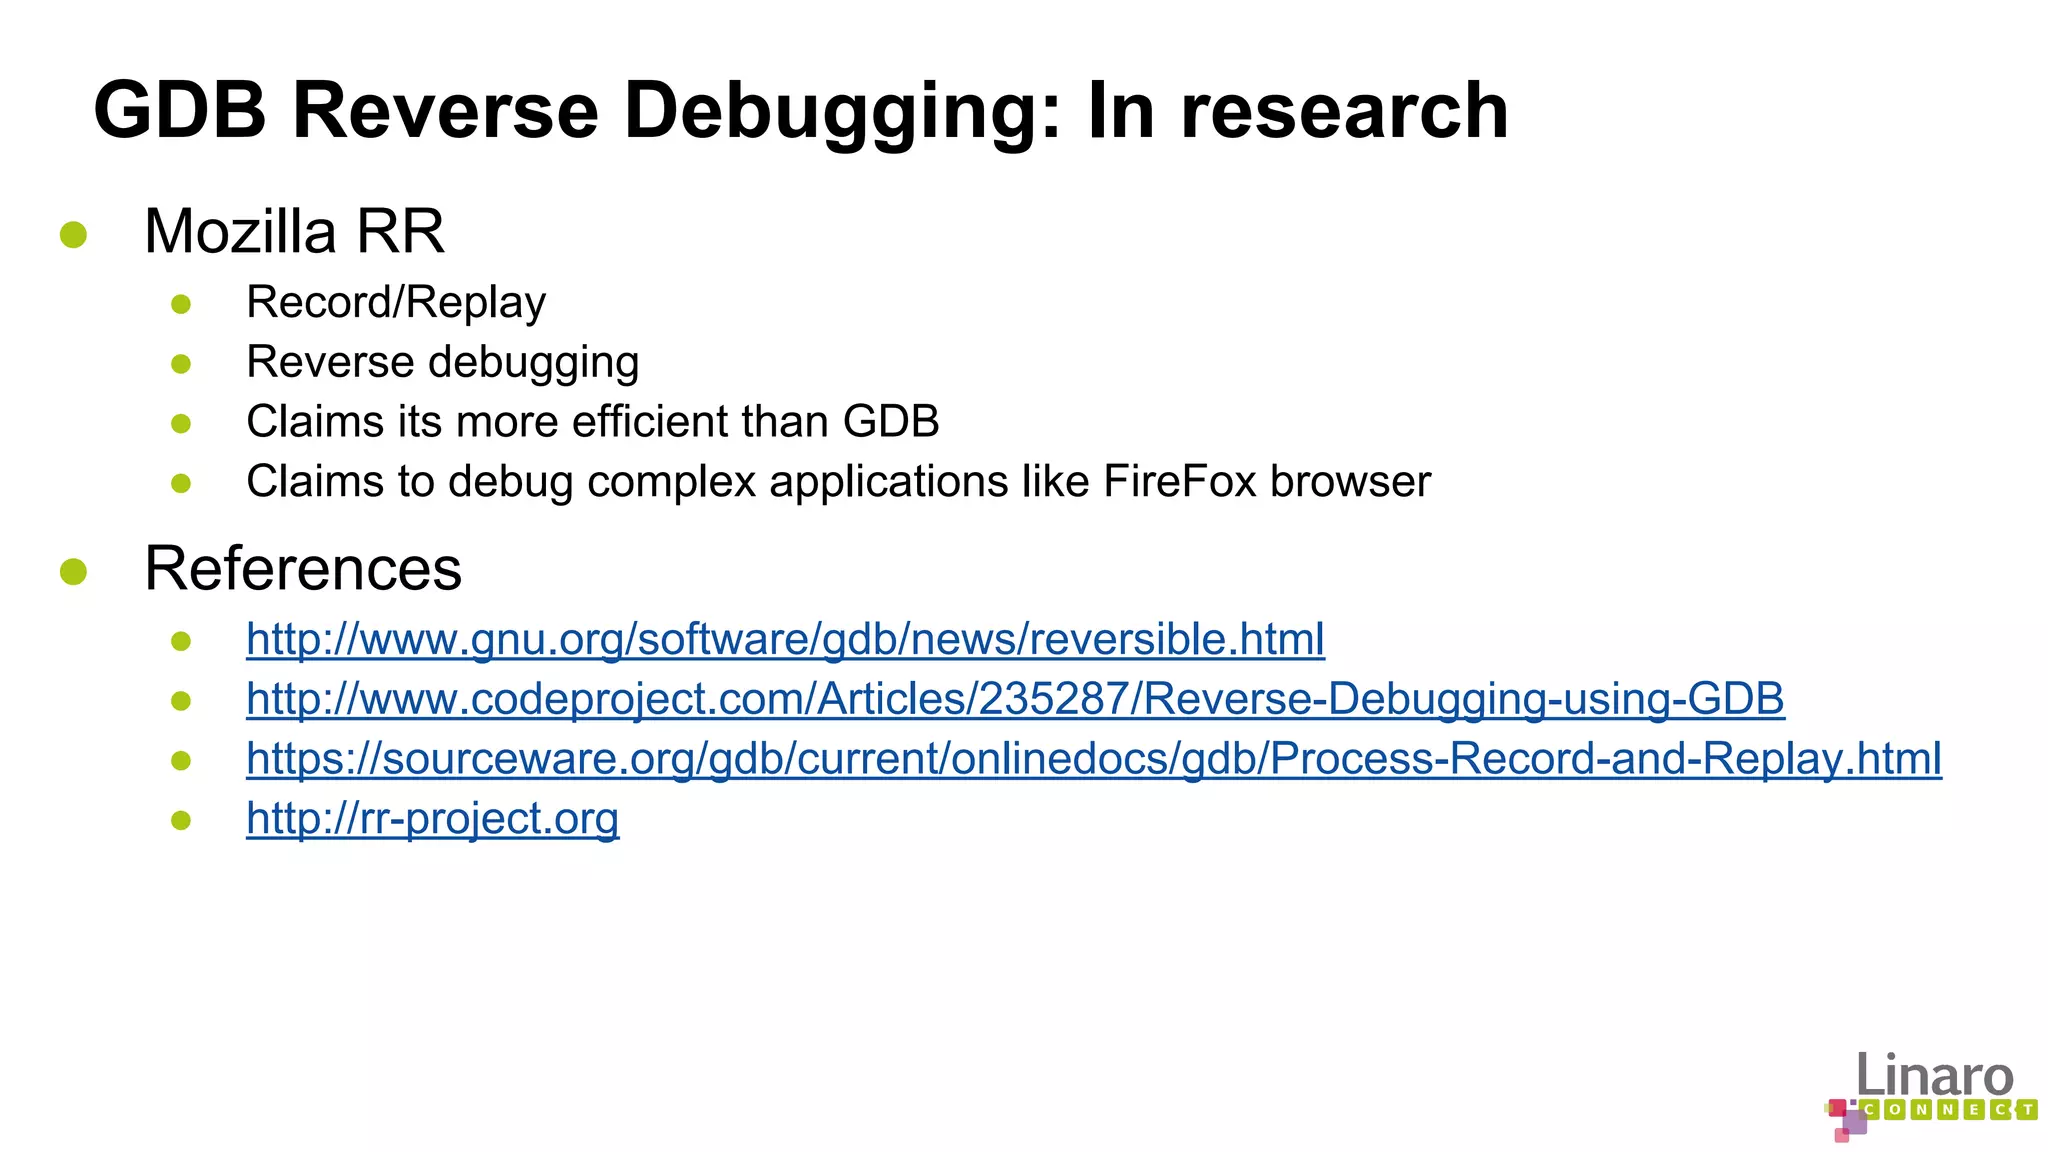
![Sanitizers: availability in GCC
ASAN LSAN TSAN UBSAN
i686 YES NO NO YES
x86_64 YES YES YES YES
AArch32 YES WONT[1] YES
AArch64 YES[2] YES[2]
MSAN is not available in GCC yet
LLVW has more options available than GCC
[1] TSAN requires 64 bit pointers
[2] ASAN/UBSAN enablement patch on AArch64 submitted b/o September](https://image.slidesharecdn.com/lcu14-201-binaryanalysistools-140912162414-phpapp02/75/LCU14-201-Binary-Analysis-Tools-16-2048.jpg)


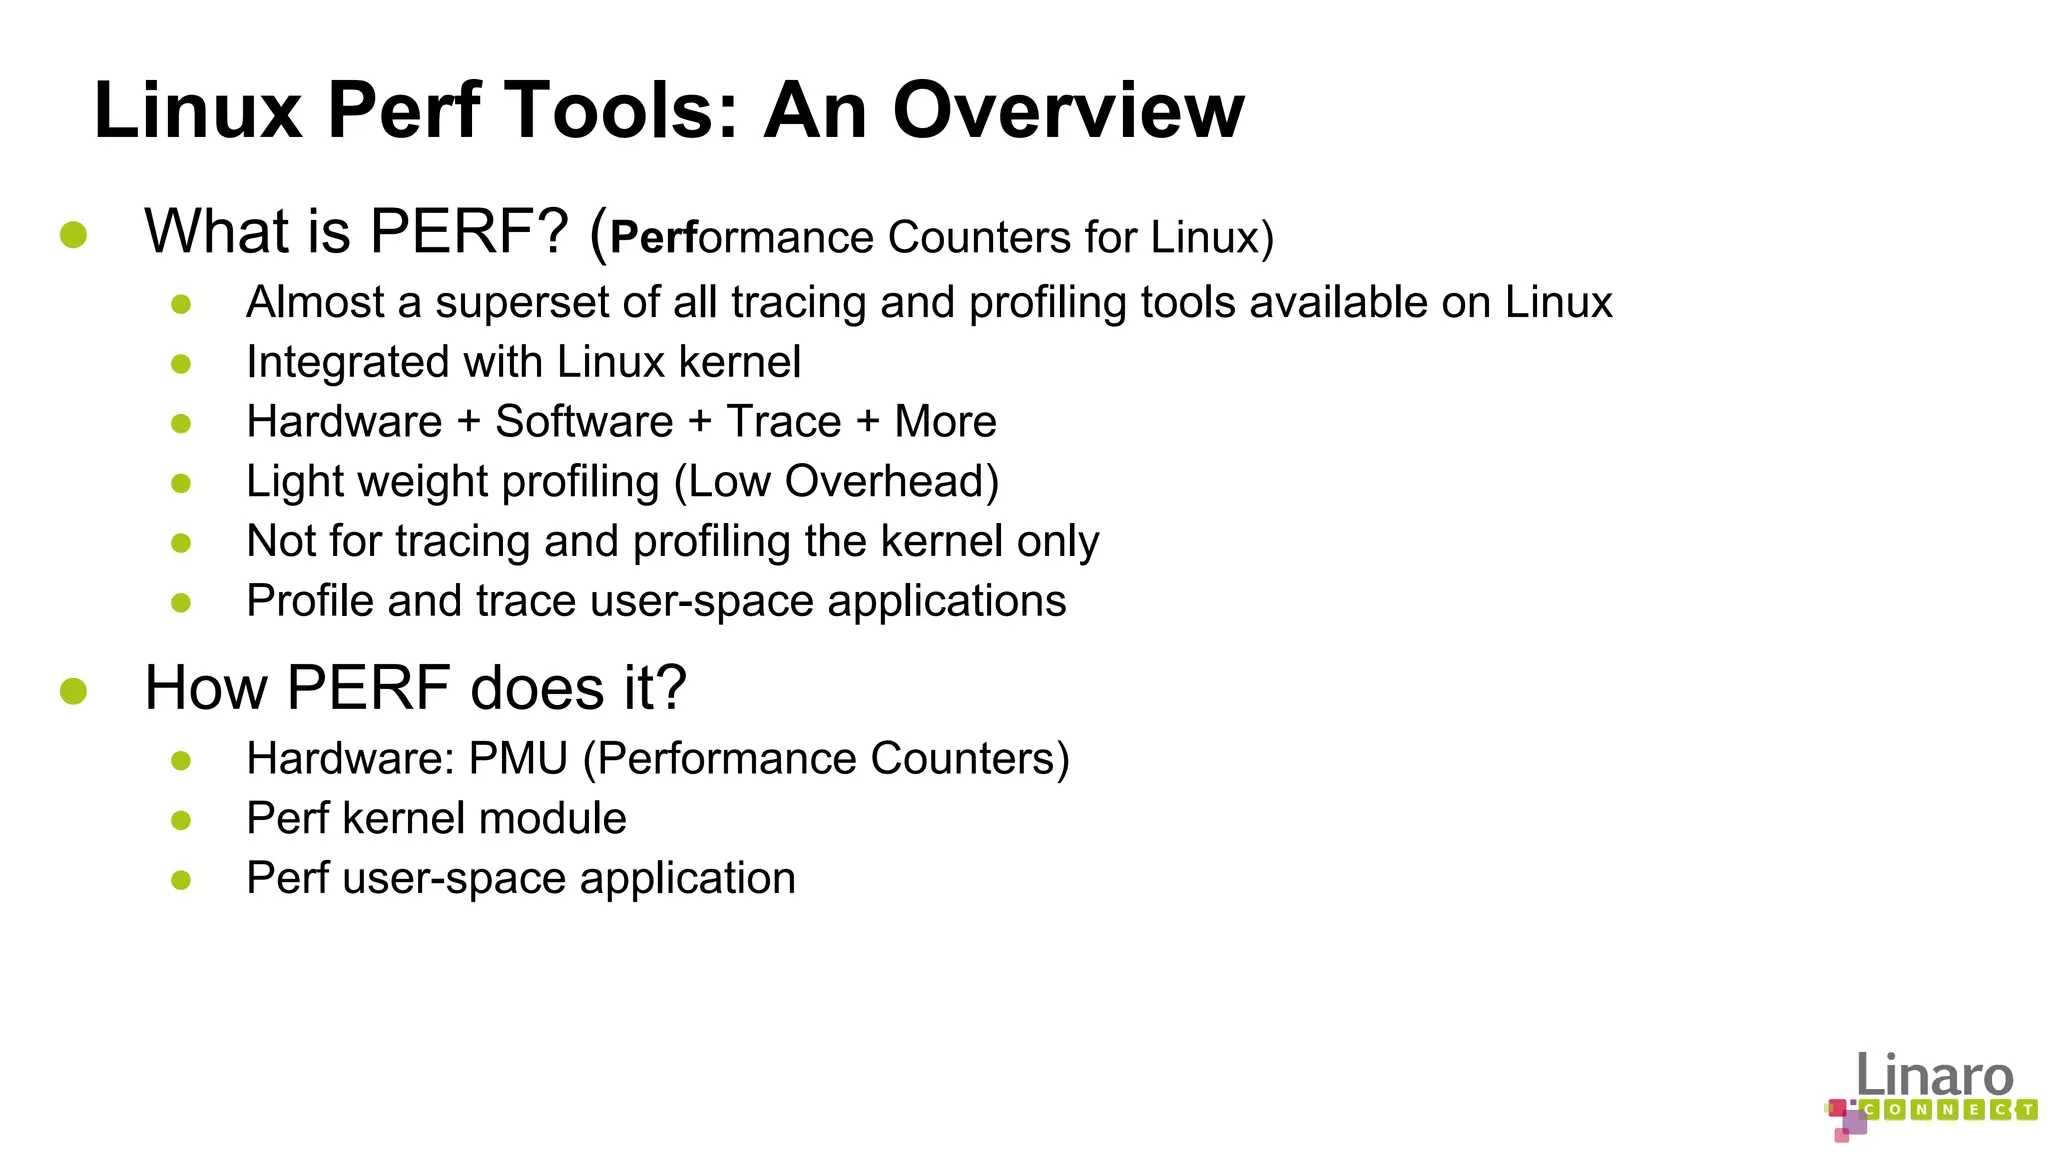
![Linux Perf Tools: Sampling and analysis
● perf record
● perf record [options] [commandline] [arguments]
● Generates an output file called perf.data
● perf report
● reads perf.data
● generates a concise execution profile
● perf annotate
● Performs source level analysis
● Binary should be compiled with debug info
● List all raw events
● perf script (from perf.data by default)](https://image.slidesharecdn.com/lcu14-201-binaryanalysistools-140912162414-phpapp02/75/LCU14-201-Binary-Analysis-Tools-35-2048.jpg)
![Linux Perf Tools: Monitoring
● Counting events
● perf stat [application] [argument]
● Keeps a event count during process execution
● Displays a common list of events by default
● Can count specific events
● Both user and kernel level code
● Real-time monitoring: Perf Top
● “perf top” prints sampled functions in real time
● Configurable but shows all CPUs by default
● Shows user-level as well as kernel functions
● Show system calls by process, refreshing every 2 seconds
● perf top -e raw_syscalls:sys_enter -ns comm](https://image.slidesharecdn.com/lcu14-201-binaryanalysistools-140912162414-phpapp02/75/LCU14-201-Binary-Analysis-Tools-36-2048.jpg)

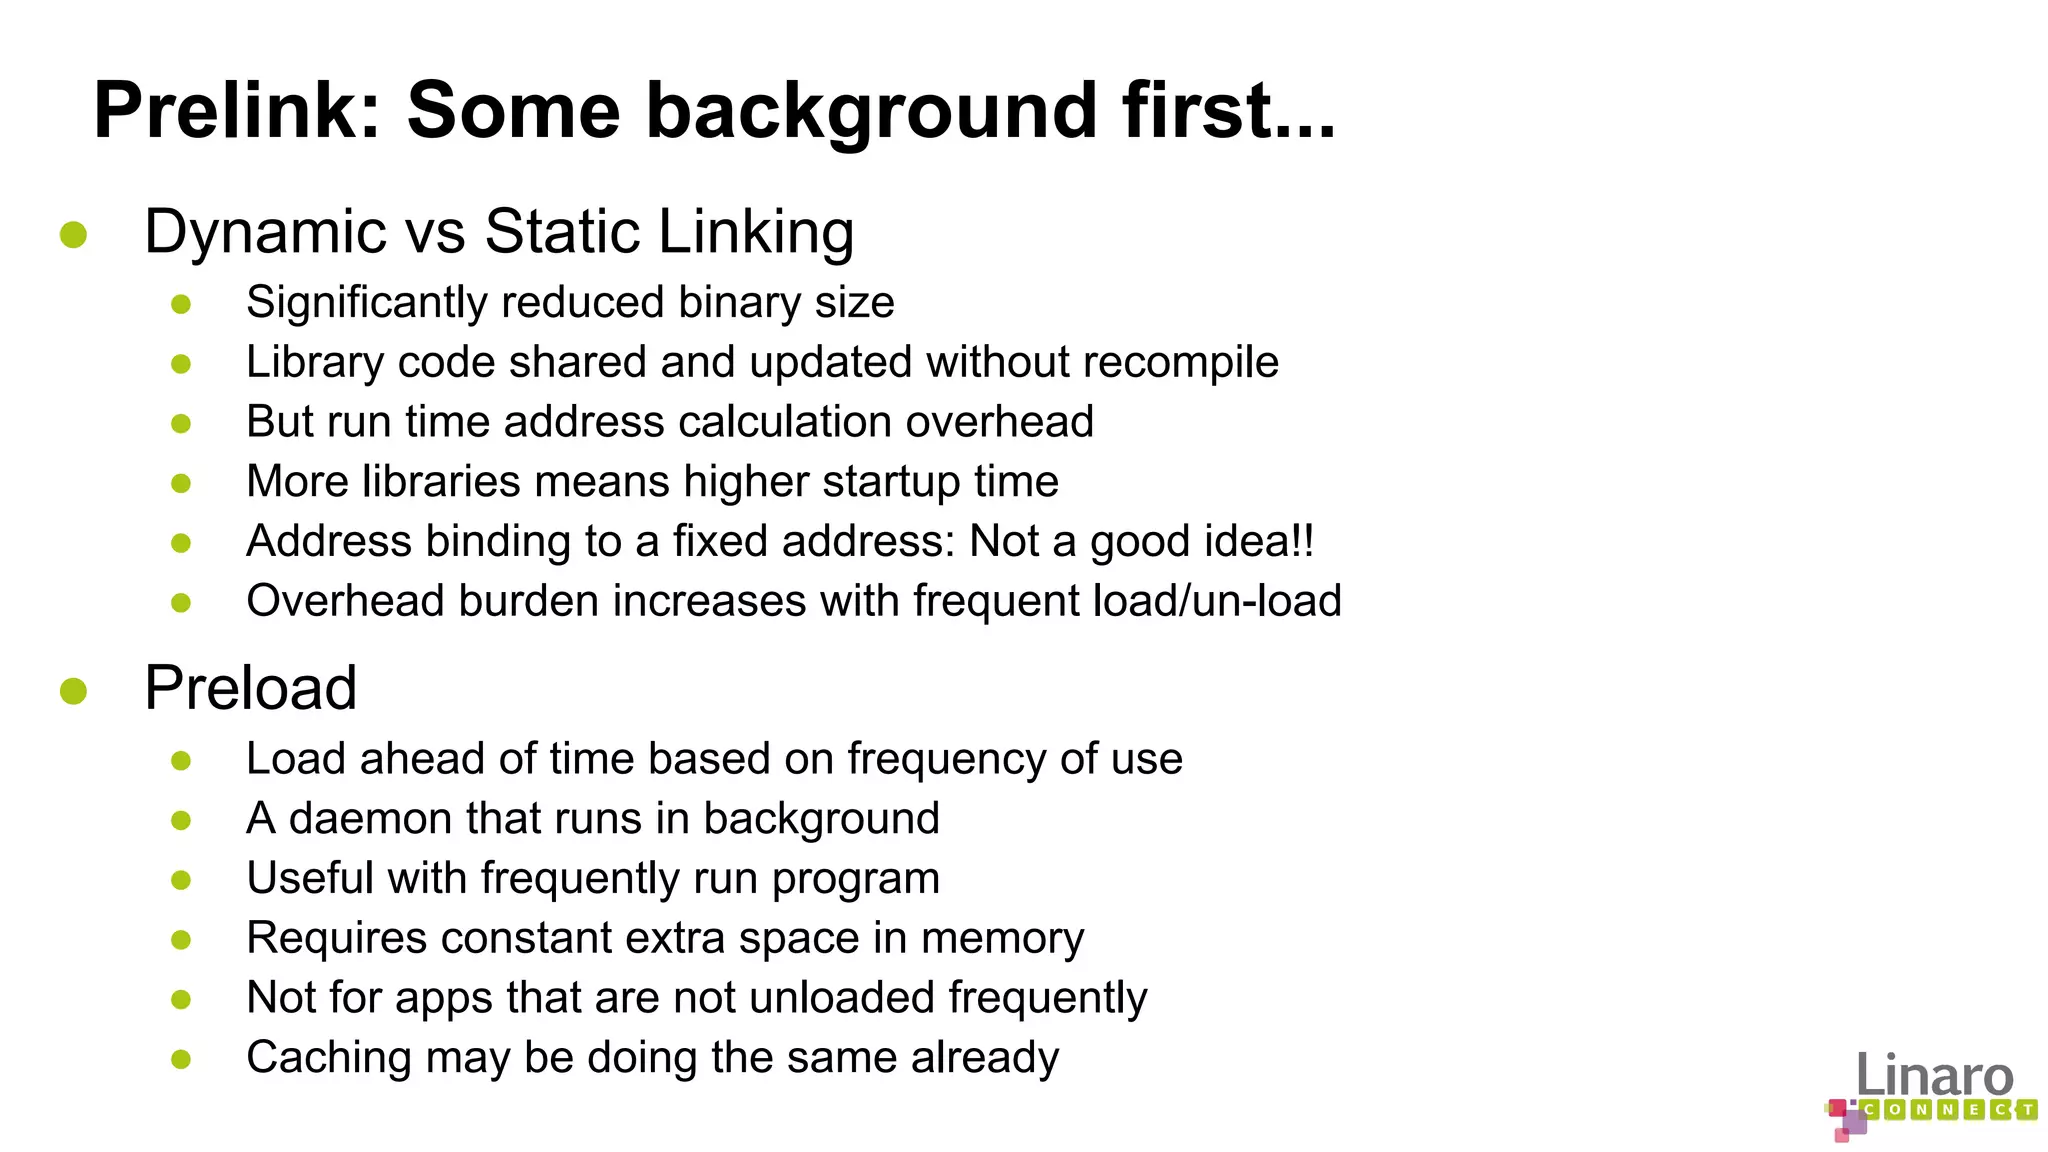


The document discusses various binary analysis tools including sanitizers for debugging, performance profiling tools like Linux perf, and GDB for reverse debugging. It covers the functionalities and example usages of sanitizers such as AddressSanitizer, LeakSanitizer, ThreadSanitizer, MemorySanitizer, and UndefinedBehaviorSanitizer. Additionally, it describes the prelink method to improve application load times by pre-calculating library dependencies.