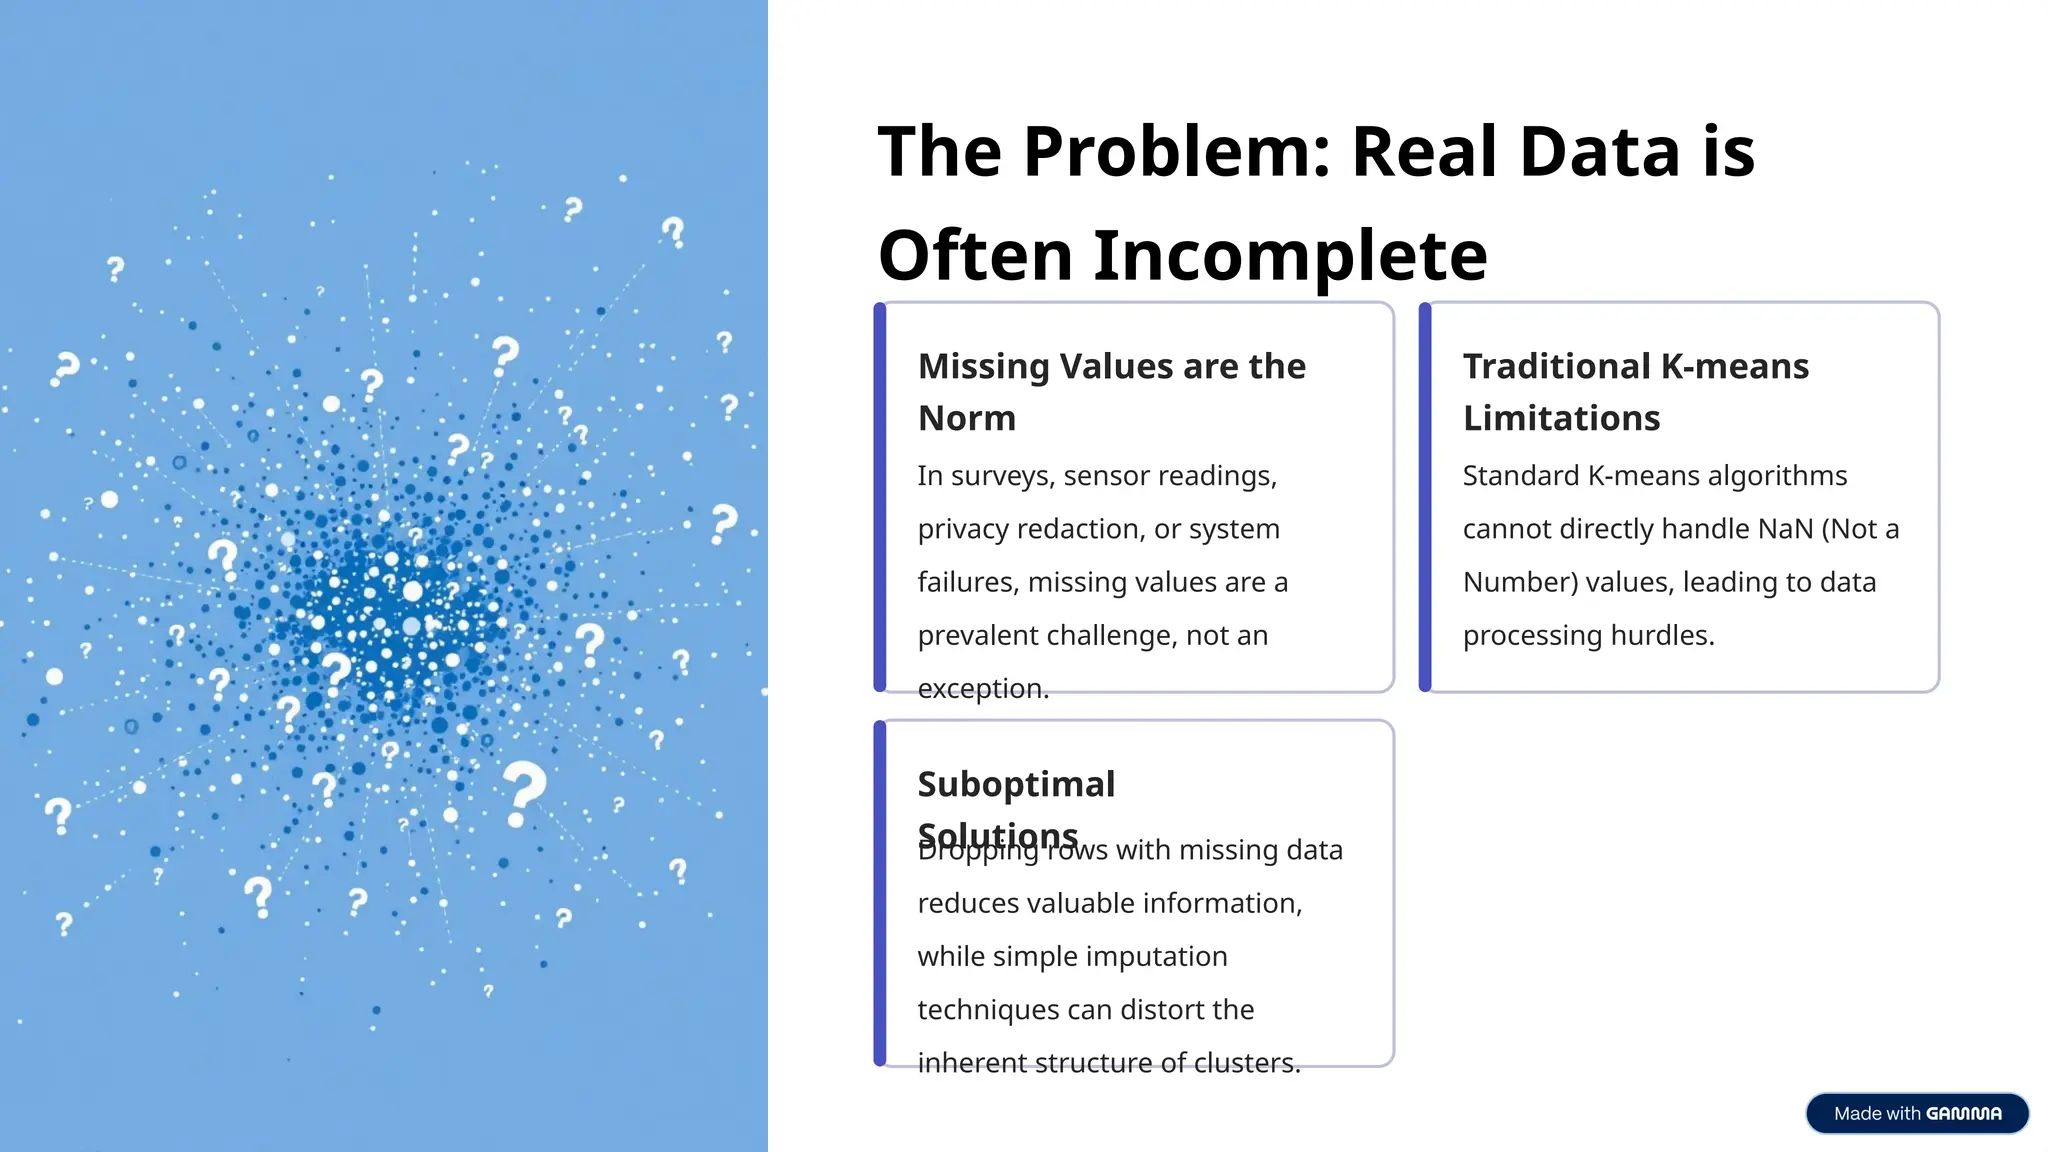
The Problem: RealData is
Often Incomplete
Missing Values are the
Norm
In surveys, sensor readings,
privacy redaction, or system
failures, missing values are a
prevalent challenge, not an
exception.
Traditional K-means
Limitations
Standard K-means algorithms
cannot directly handle NaN (Not a
Number) values, leading to data
processing hurdles.
Suboptimal
Solutions
Dropping rows with missing data
reduces valuable information,
while simple imputation
techniques can distort the
inherent structure of clusters.
3.
The Standard Approach:Limitations and Consequences
Typical Workflow
Impute Missing
Values
Estimate and fill in absent data points using various
statistical methods.
Run K-means Clustering
Apply the K-means algorithm, typically with Euclidean
distance, to the now complete dataset.
Interpret Clusters
Analyze the resulting clusters to derive insights and
patterns.
Inherent Issues
Distorted Data
Geometry
Imputation methods can subtly (or significantly) alter the original
geometric relationships within the data.
Spherical Cluster Assumption
Euclidean distance inherently assumes clusters are spherical, which
often doesn't hold true for real-world data.
Ignoring Feature
Correlation
The standard approach fails to account for the covariance and
correlation between different features, leading to misrepresentative
clusters.
4.
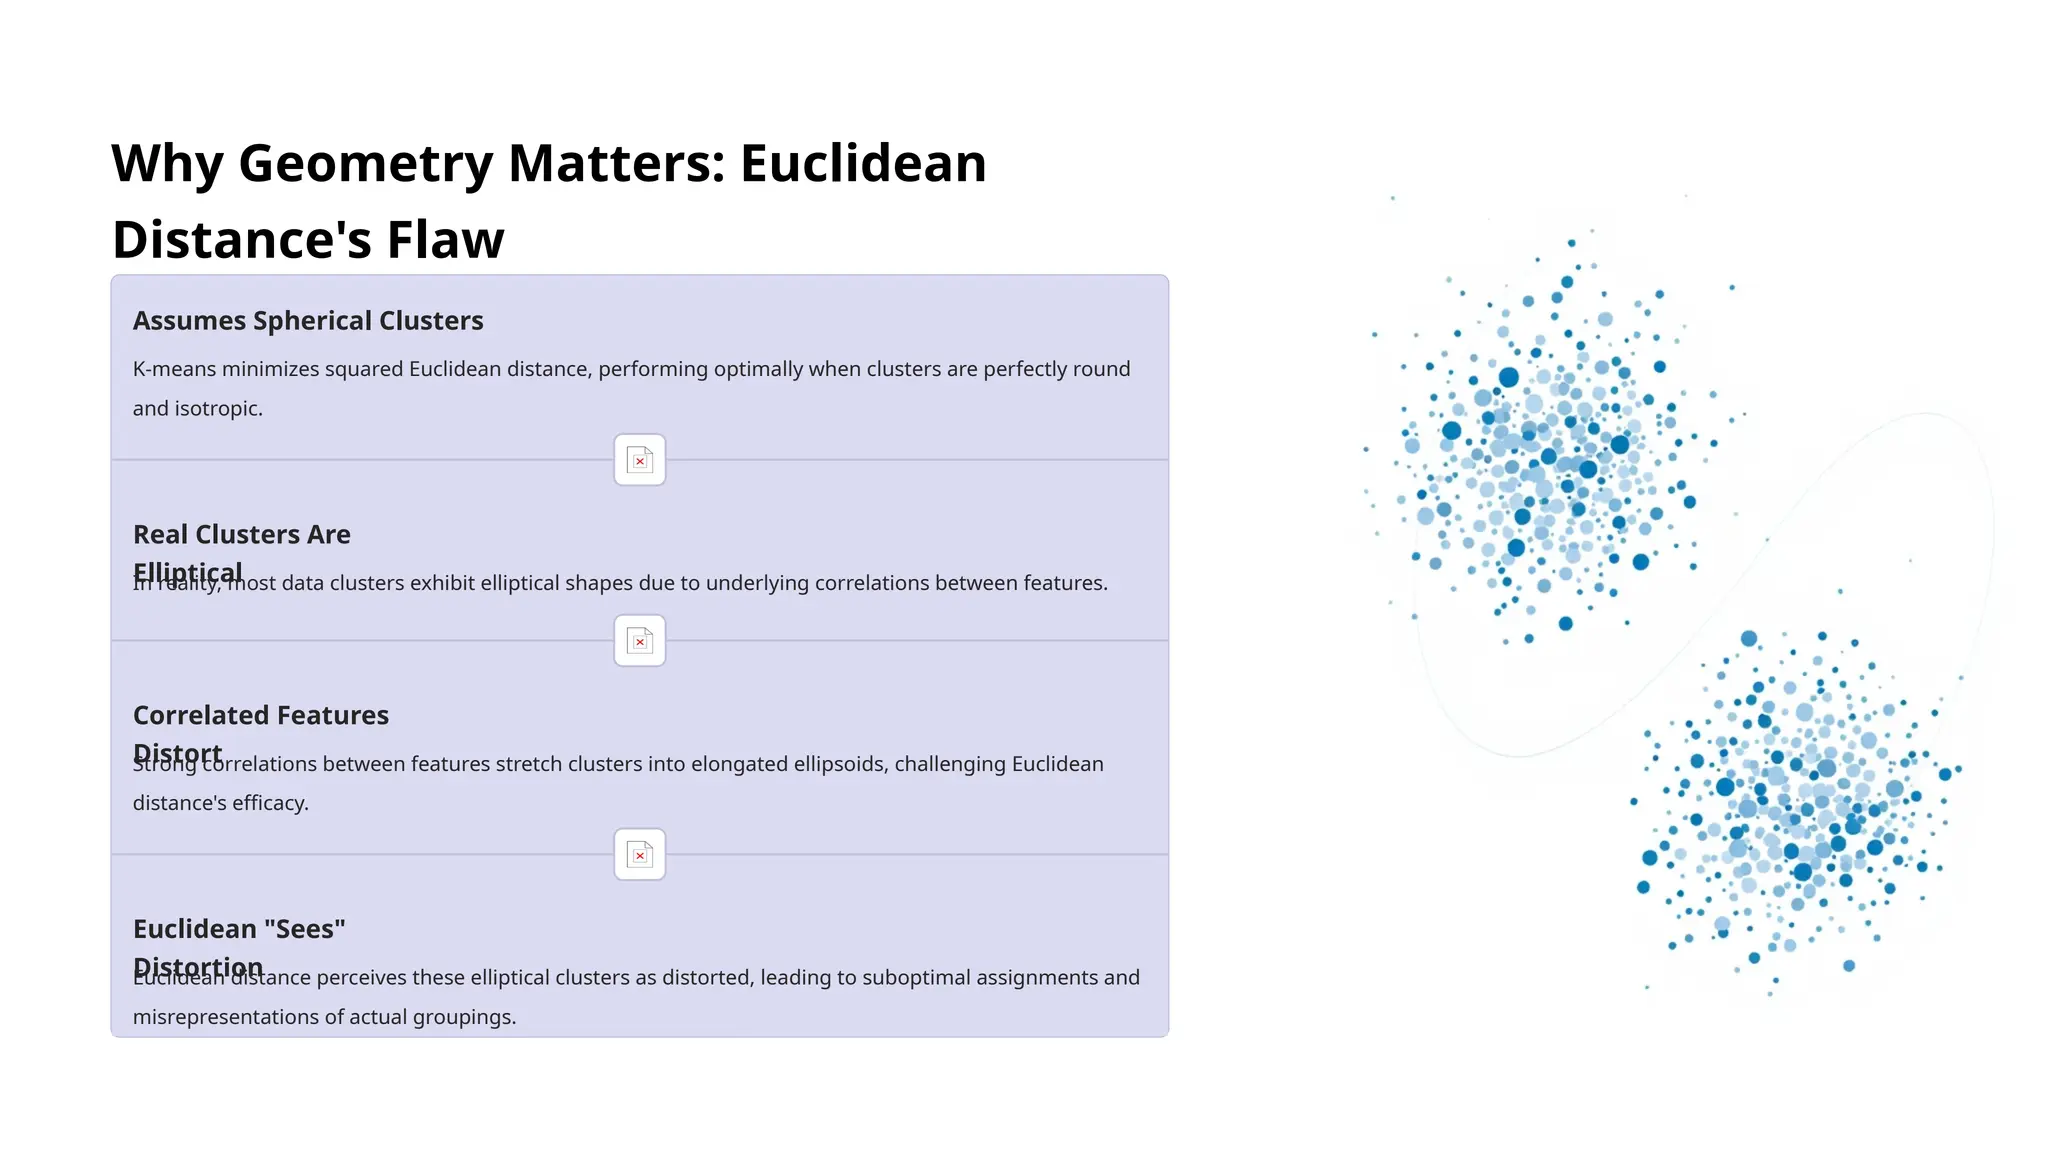
Why Geometry Matters:Euclidean
Distance's Flaw
Assumes Spherical Clusters
K-means minimizes squared Euclidean distance, performing optimally when clusters are perfectly round
and isotropic.
Real Clusters Are
Elliptical
In reality, most data clusters exhibit elliptical shapes due to underlying correlations between features.
Correlated Features
Distort
Strong correlations between features stretch clusters into elongated ellipsoids, challenging Euclidean
distance's efficacy.
Euclidean "Sees"
Distortion
Euclidean distance perceives these elliptical clusters as distorted, leading to suboptimal assignments and
misrepresentations of actual groupings.
5.
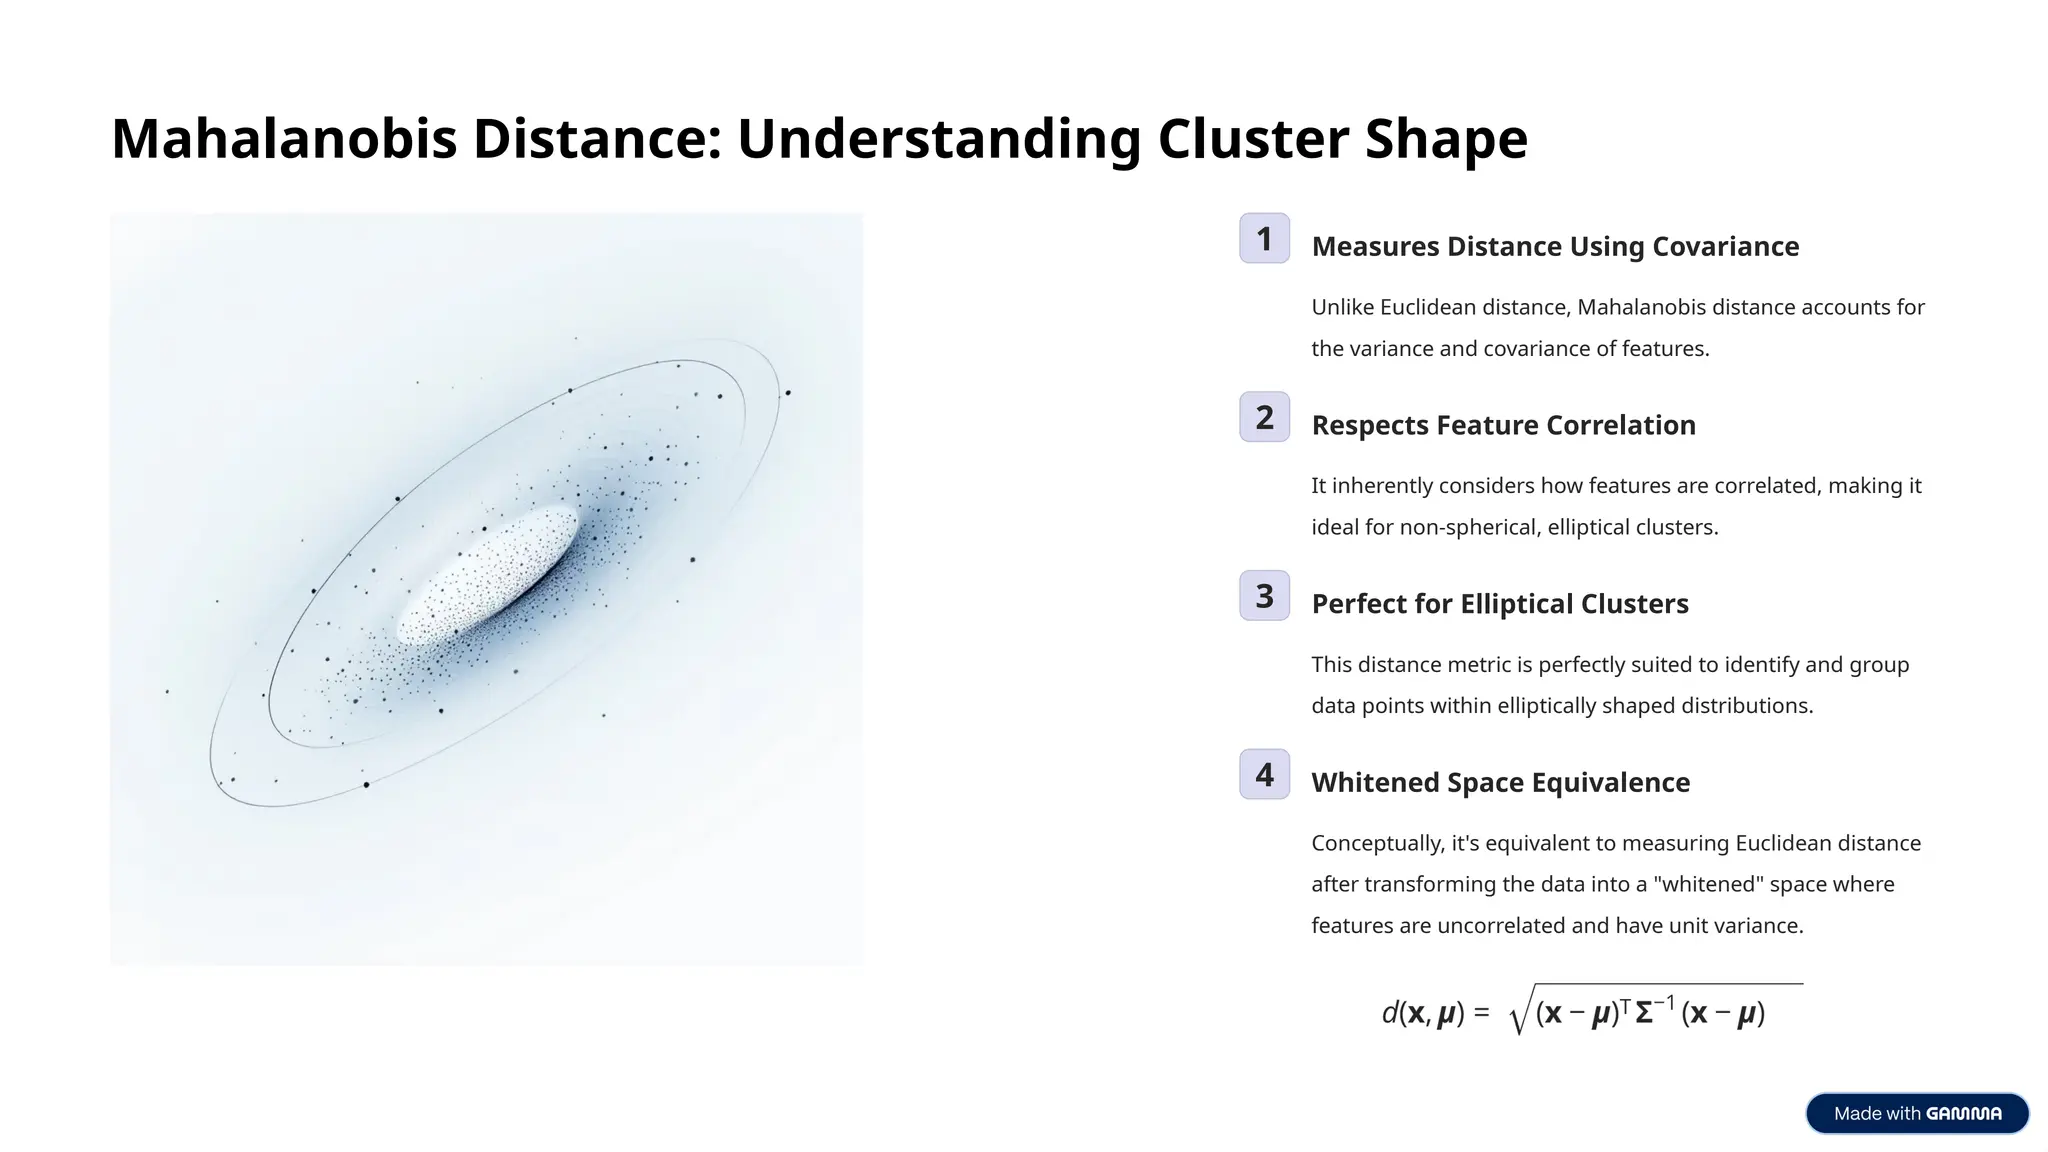
Mahalanobis Distance: UnderstandingCluster Shape
1 Measures Distance Using Covariance
Unlike Euclidean distance, Mahalanobis distance accounts for
the variance and covariance of features.
2 Respects Feature Correlation
It inherently considers how features are correlated, making it
ideal for non-spherical, elliptical clusters.
3 Perfect for Elliptical Clusters
This distance metric is perfectly suited to identify and group
data points within elliptically shaped distributions.
4 Whitened Space Equivalence
Conceptually, it's equivalent to measuring Euclidean distance
after transforming the data into a "whitened" space where
features are uncorrelated and have unit variance.
6.
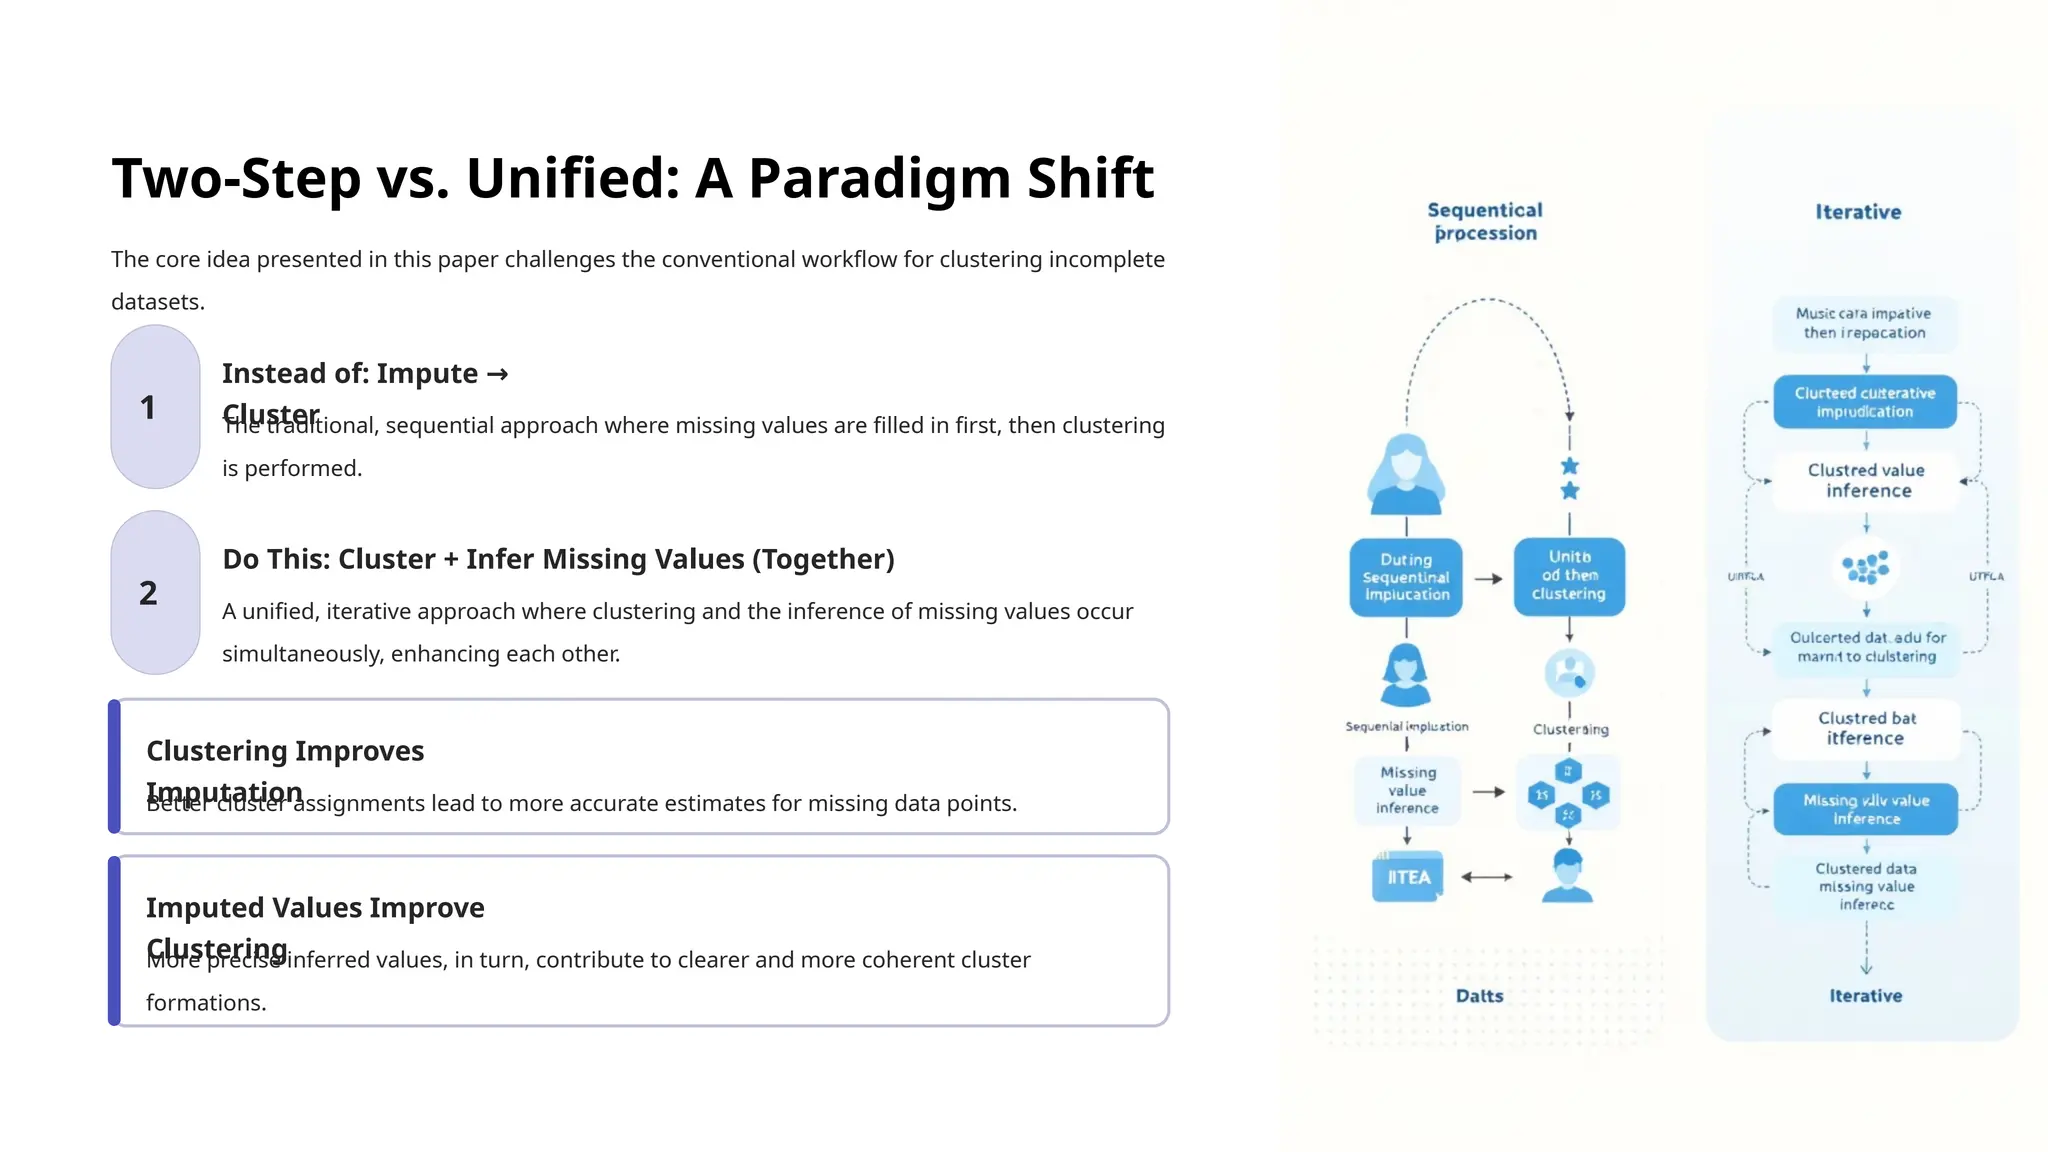
Two-Step vs. Unified:A Paradigm Shift
The core idea presented in this paper challenges the conventional workflow for clustering incomplete
datasets.
1
Instead of: Impute →
Cluster
The traditional, sequential approach where missing values are filled in first, then clustering
is performed.
2
Do This: Cluster + Infer Missing Values (Together)
A unified, iterative approach where clustering and the inference of missing values occur
simultaneously, enhancing each other.
Clustering Improves
Imputation
Better cluster assignments lead to more accurate estimates for missing data points.
Imputed Values Improve
Clustering
More precise inferred values, in turn, contribute to clearer and more coherent cluster
formations.
7.
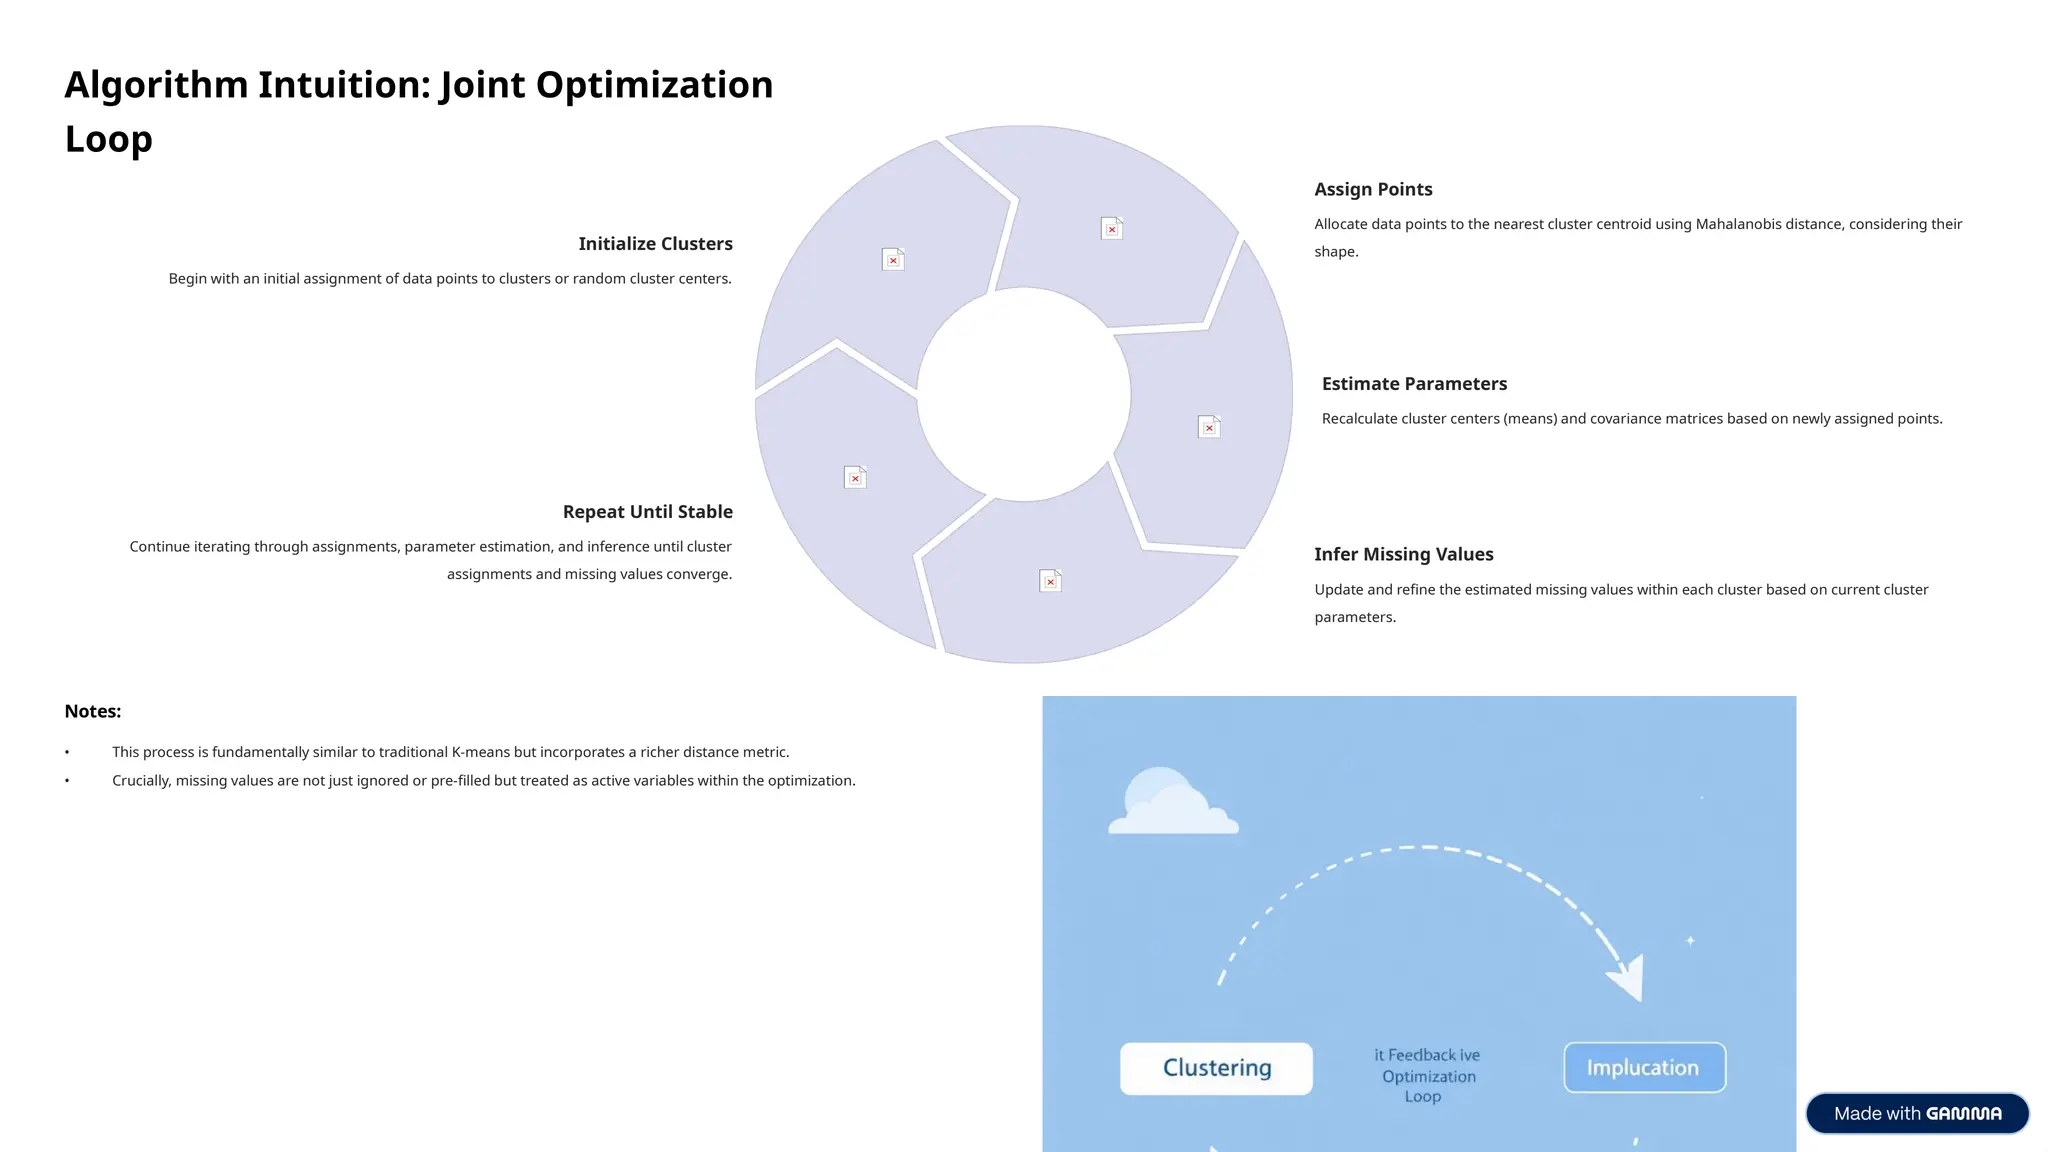
Algorithm Intuition: JointOptimization
Loop
Initialize Clusters
Begin with an initial assignment of data points to clusters or random cluster centers.
Assign Points
Allocate data points to the nearest cluster centroid using Mahalanobis distance, considering their
shape.
Estimate Parameters
Recalculate cluster centers (means) and covariance matrices based on newly assigned points.
Infer Missing Values
Update and refine the estimated missing values within each cluster based on current cluster
parameters.
Repeat Until Stable
Continue iterating through assignments, parameter estimation, and inference until cluster
assignments and missing values converge.
Notes:
• This process is fundamentally similar to traditional K-means but incorporates a richer distance metric.
• Crucially, missing values are not just ignored or pre-filled but treated as active variables within the optimization.
8.
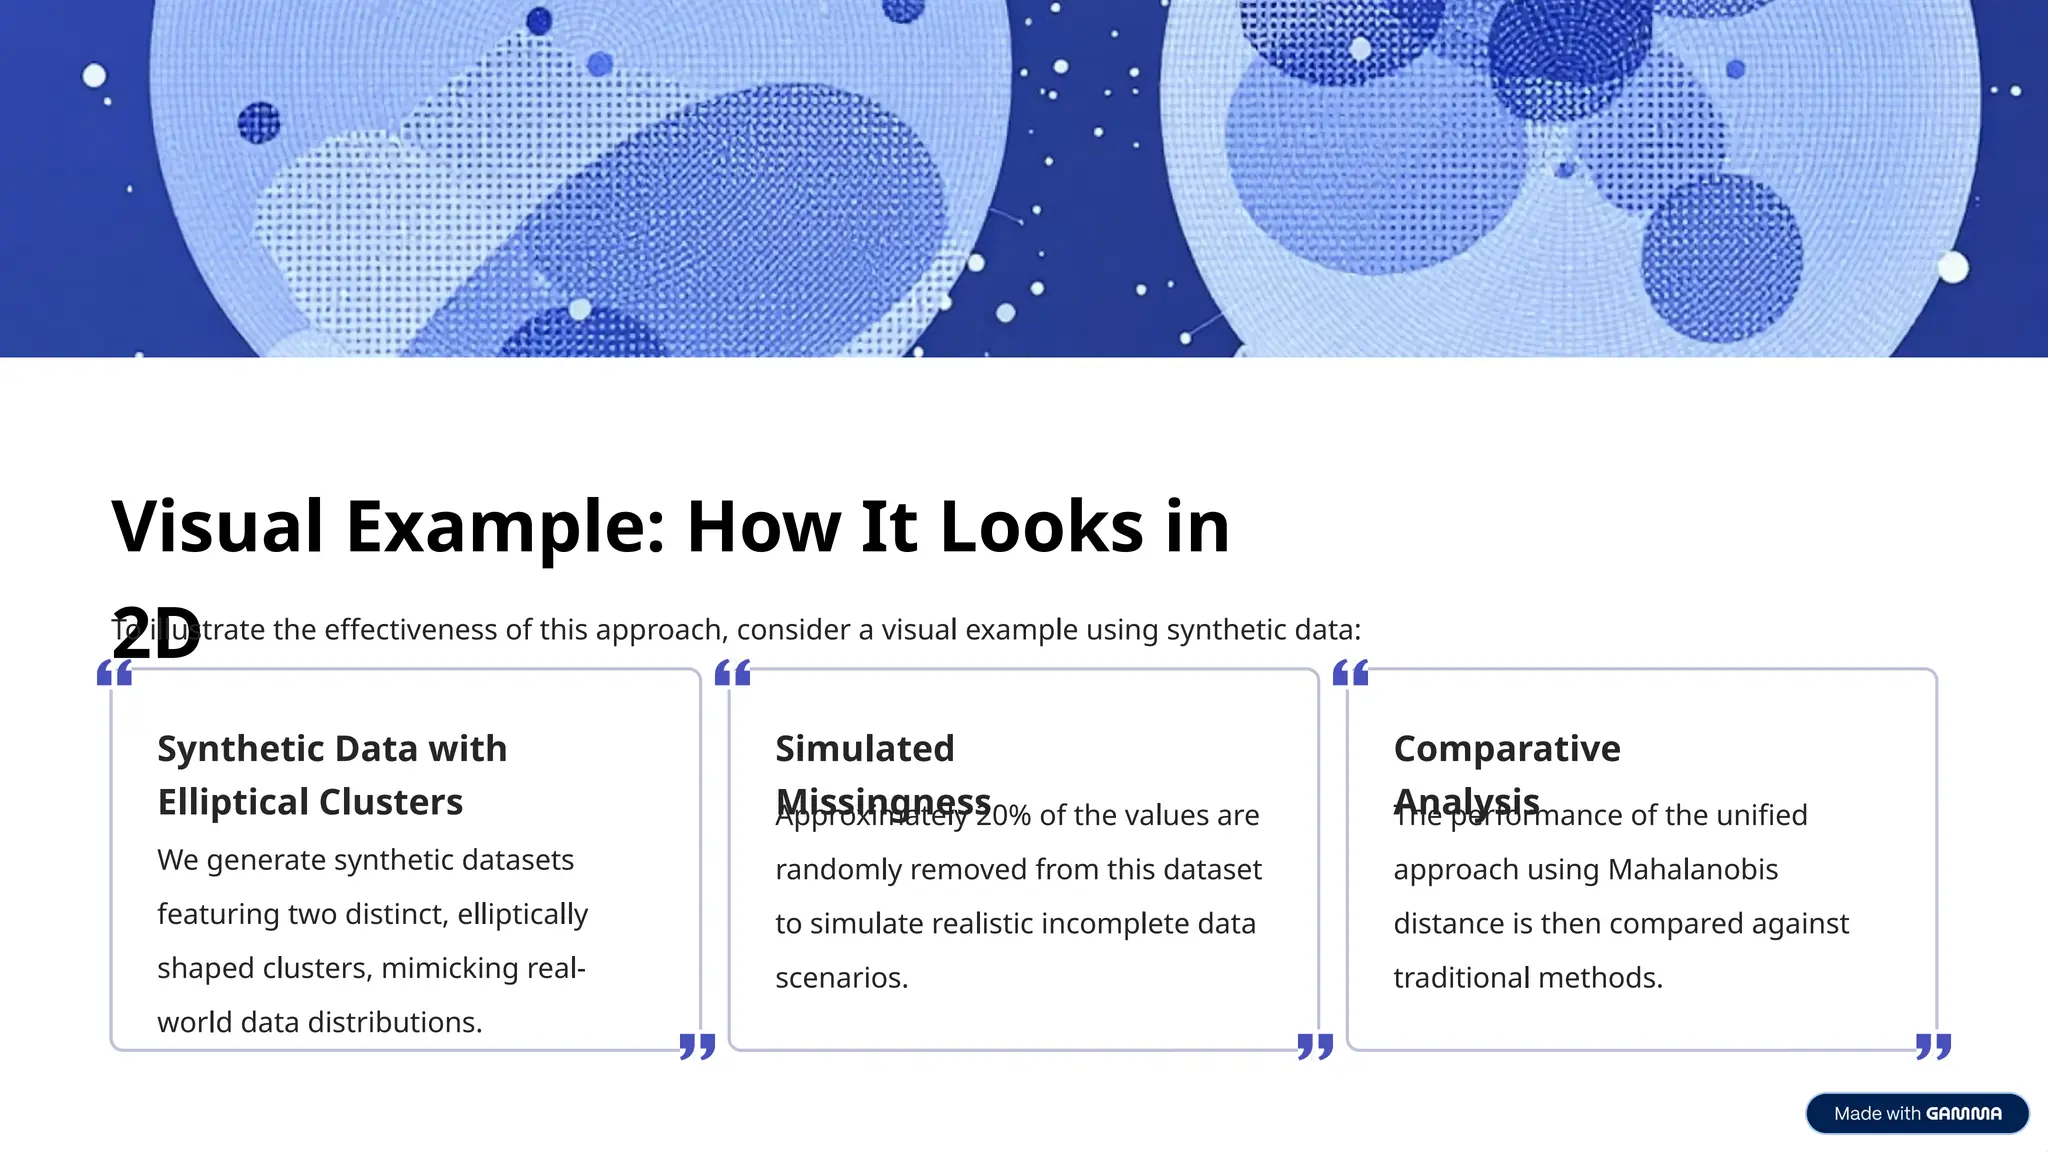
Visual Example: HowIt Looks in
2D
To illustrate the effectiveness of this approach, consider a visual example using synthetic data:
Synthetic Data with
Elliptical Clusters
We generate synthetic datasets
featuring two distinct, elliptically
shaped clusters, mimicking real-
world data distributions.
Simulated
Missingness
Approximately 20% of the values are
randomly removed from this dataset
to simulate realistic incomplete data
scenarios.
Comparative
Analysis
The performance of the unified
approach using Mahalanobis
distance is then compared against
traditional methods.
9.
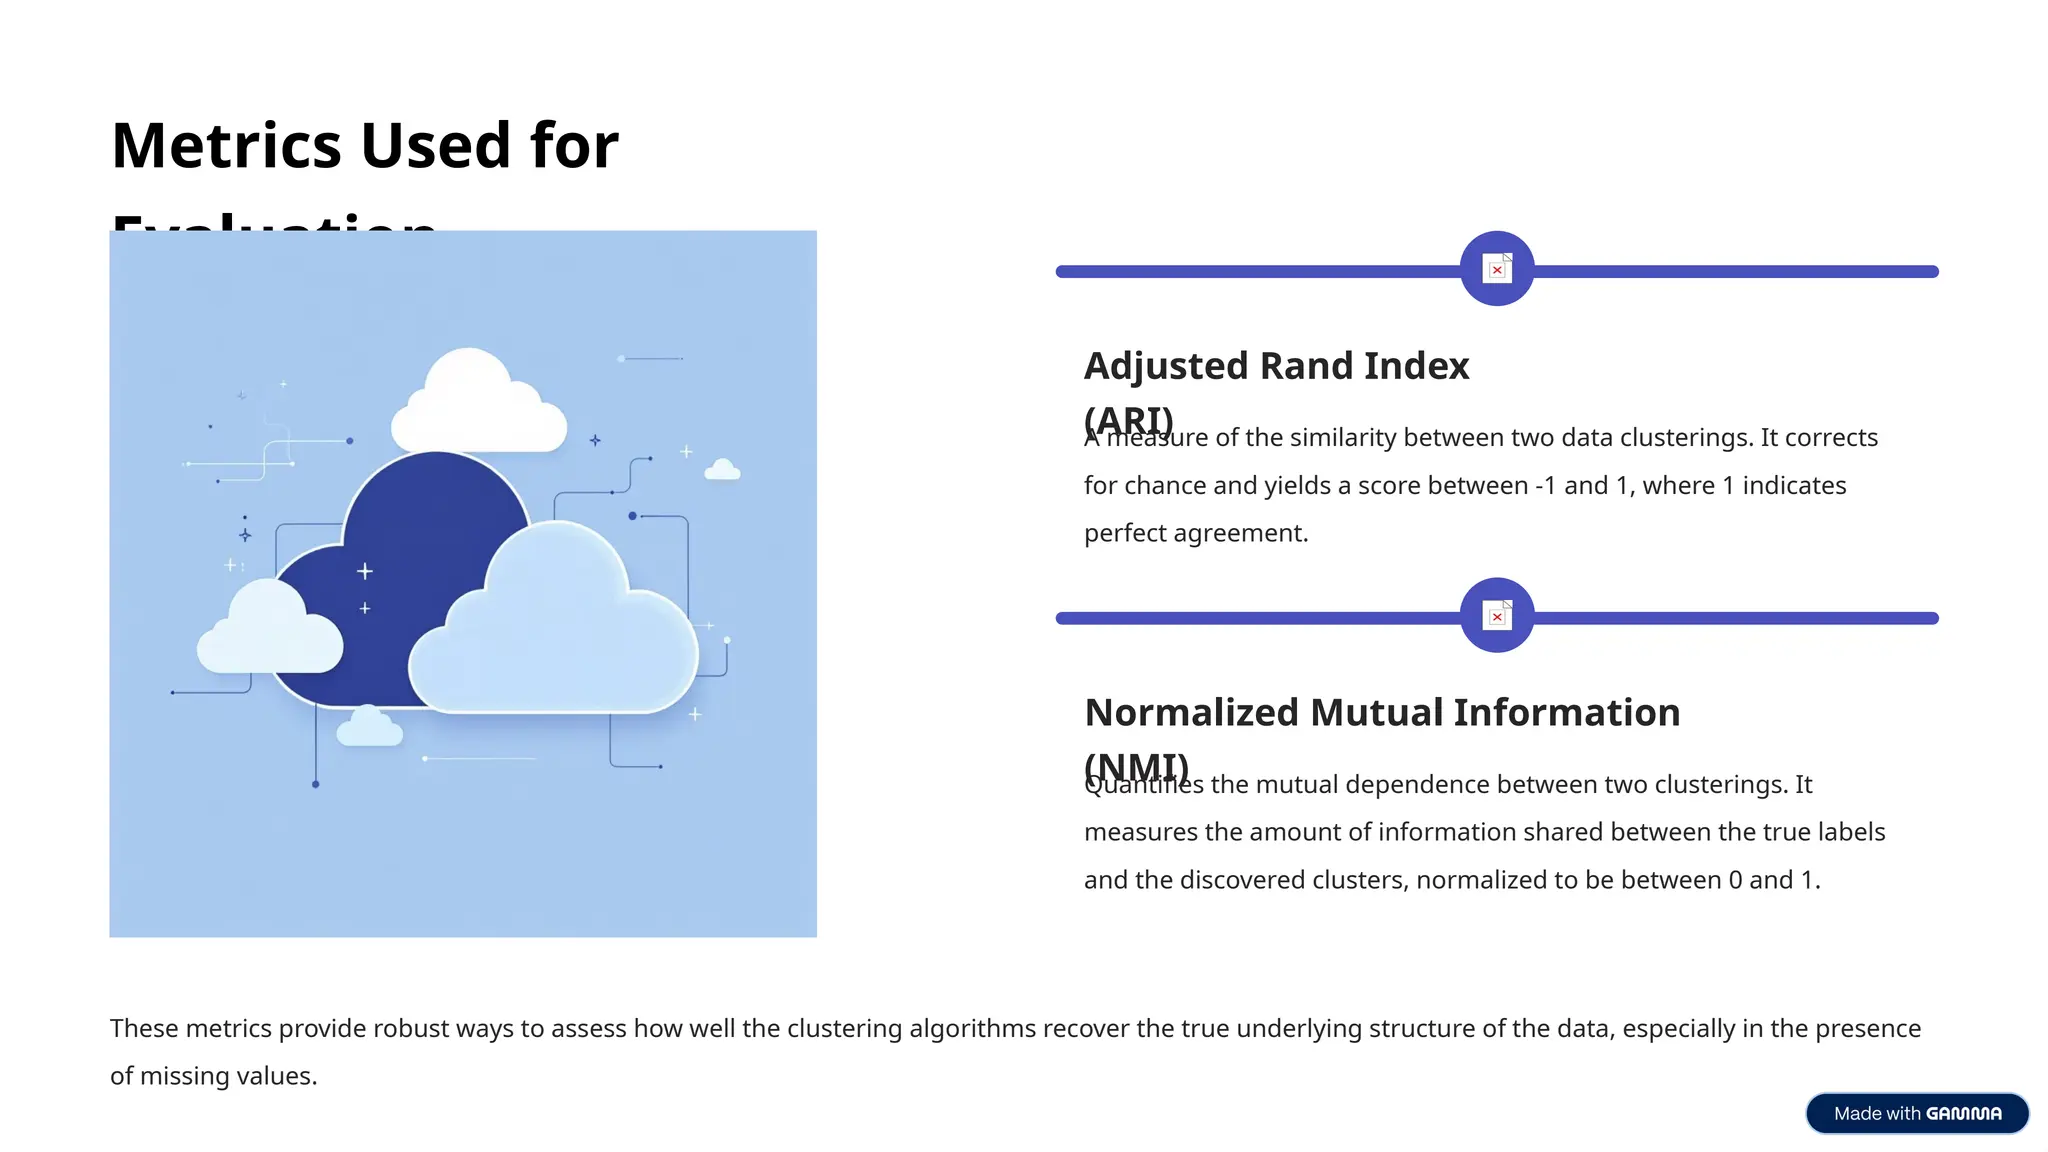
Metrics Used for
Evaluation
AdjustedRand Index
(ARI)
A measure of the similarity between two data clusterings. It corrects
for chance and yields a score between -1 and 1, where 1 indicates
perfect agreement.
Normalized Mutual Information
(NMI)
Quantifies the mutual dependence between two clusterings. It
measures the amount of information shared between the true labels
and the discovered clusters, normalized to be between 0 and 1.
These metrics provide robust ways to assess how well the clustering algorithms recover the true underlying structure of the data, especially in the presence
of missing values.
10.
Experimental Setup
Datasets Used
1
SyntheticDatasets
Generated with varying
complexities, including up to
10 distinct elliptical clusters,
allowing for controlled
experimentation of algorithm
performance.
2
IRIS Dataset
A classic benchmark dataset,
augmented with artificially
introduced missing values to
simulate real-world data
incompleteness.
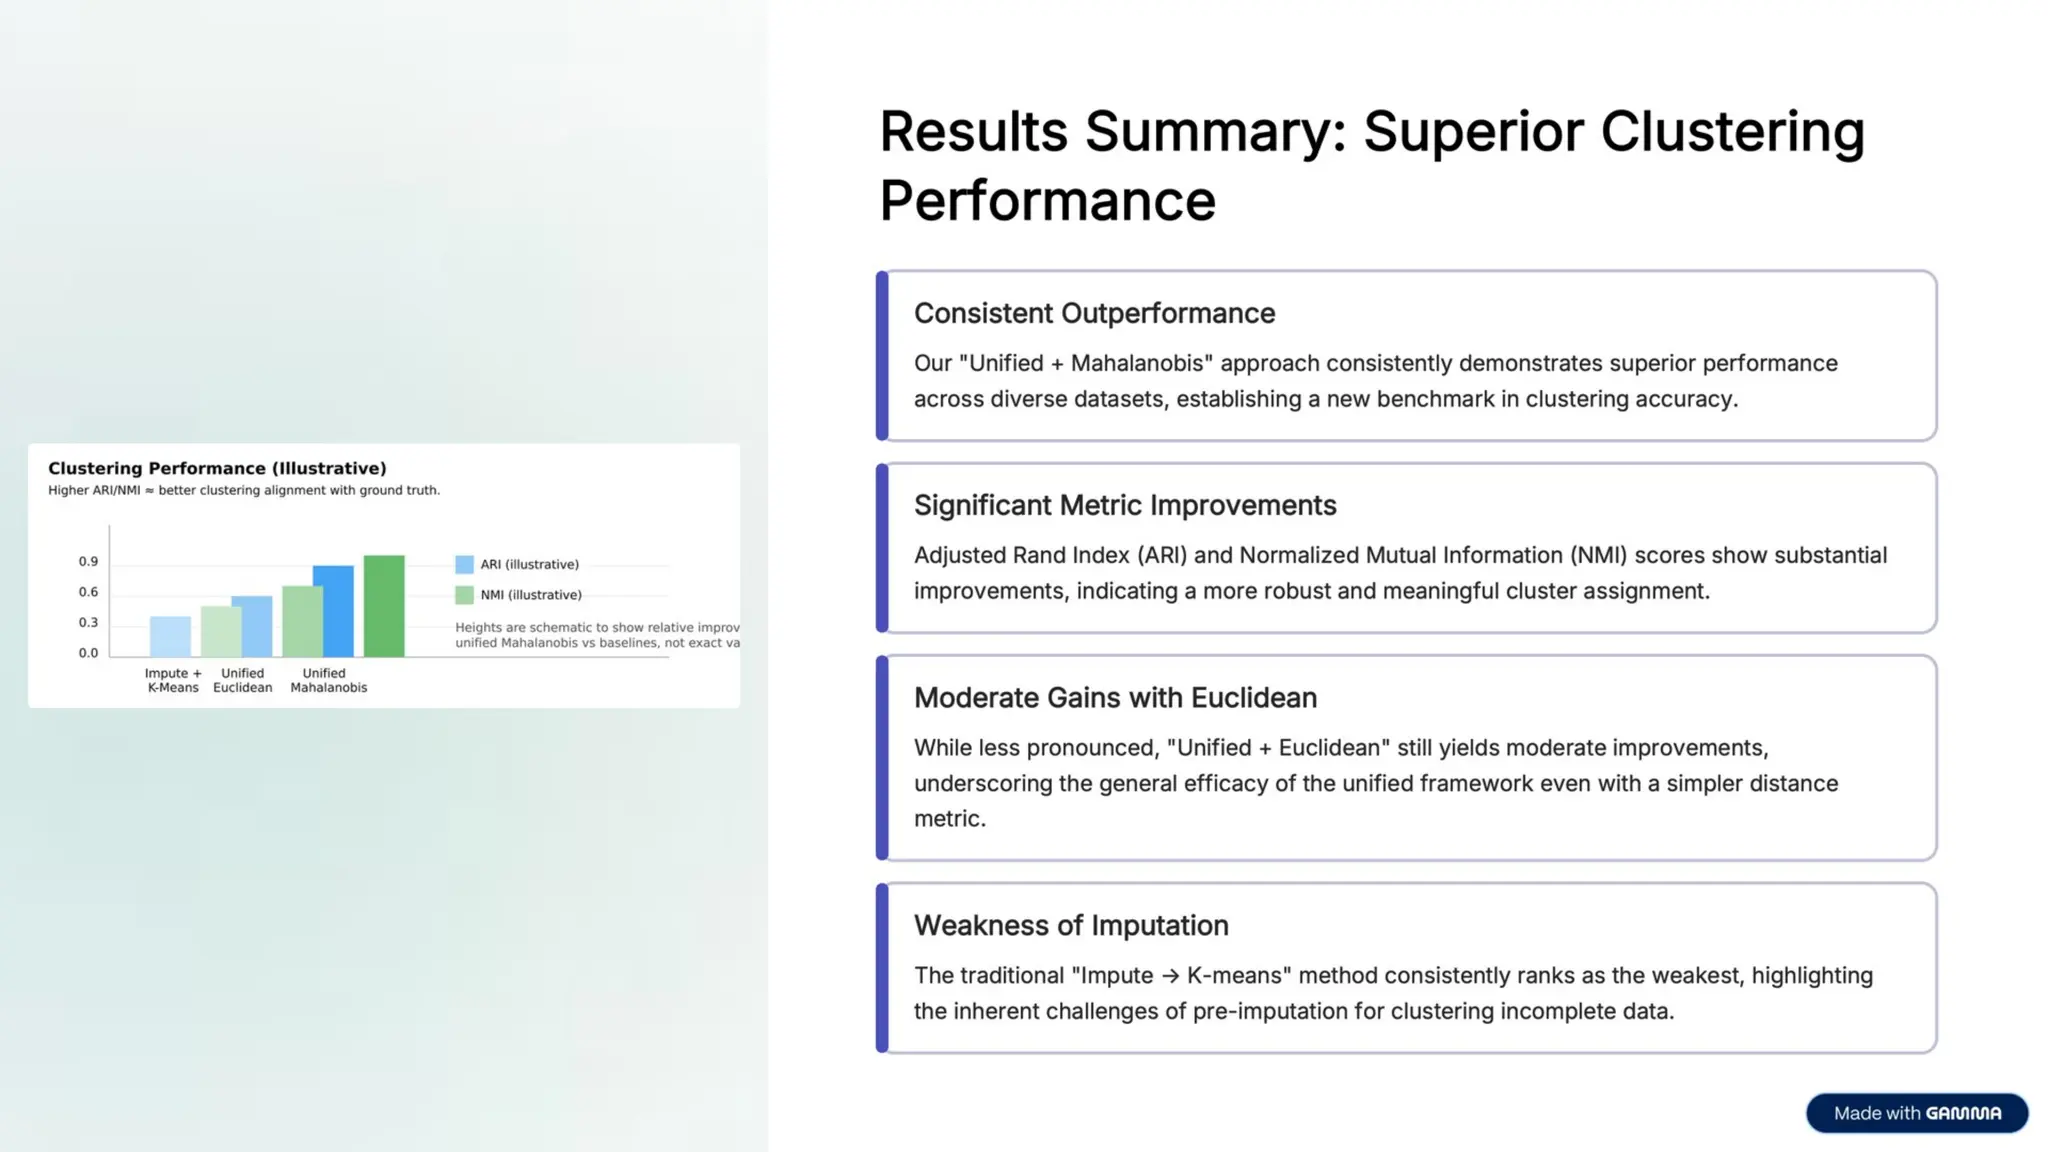
Methods Compared
Impute K-means
→
(Euclidean)
The traditional two-step approach with
Euclidean distance.
Unified Approach (Euclidean)
The iterative clustering and imputation, but
using Euclidean distance.
Unified Approach
(Mahalanobis)
The novel iterative method incorporating
Mahalanobis distance.