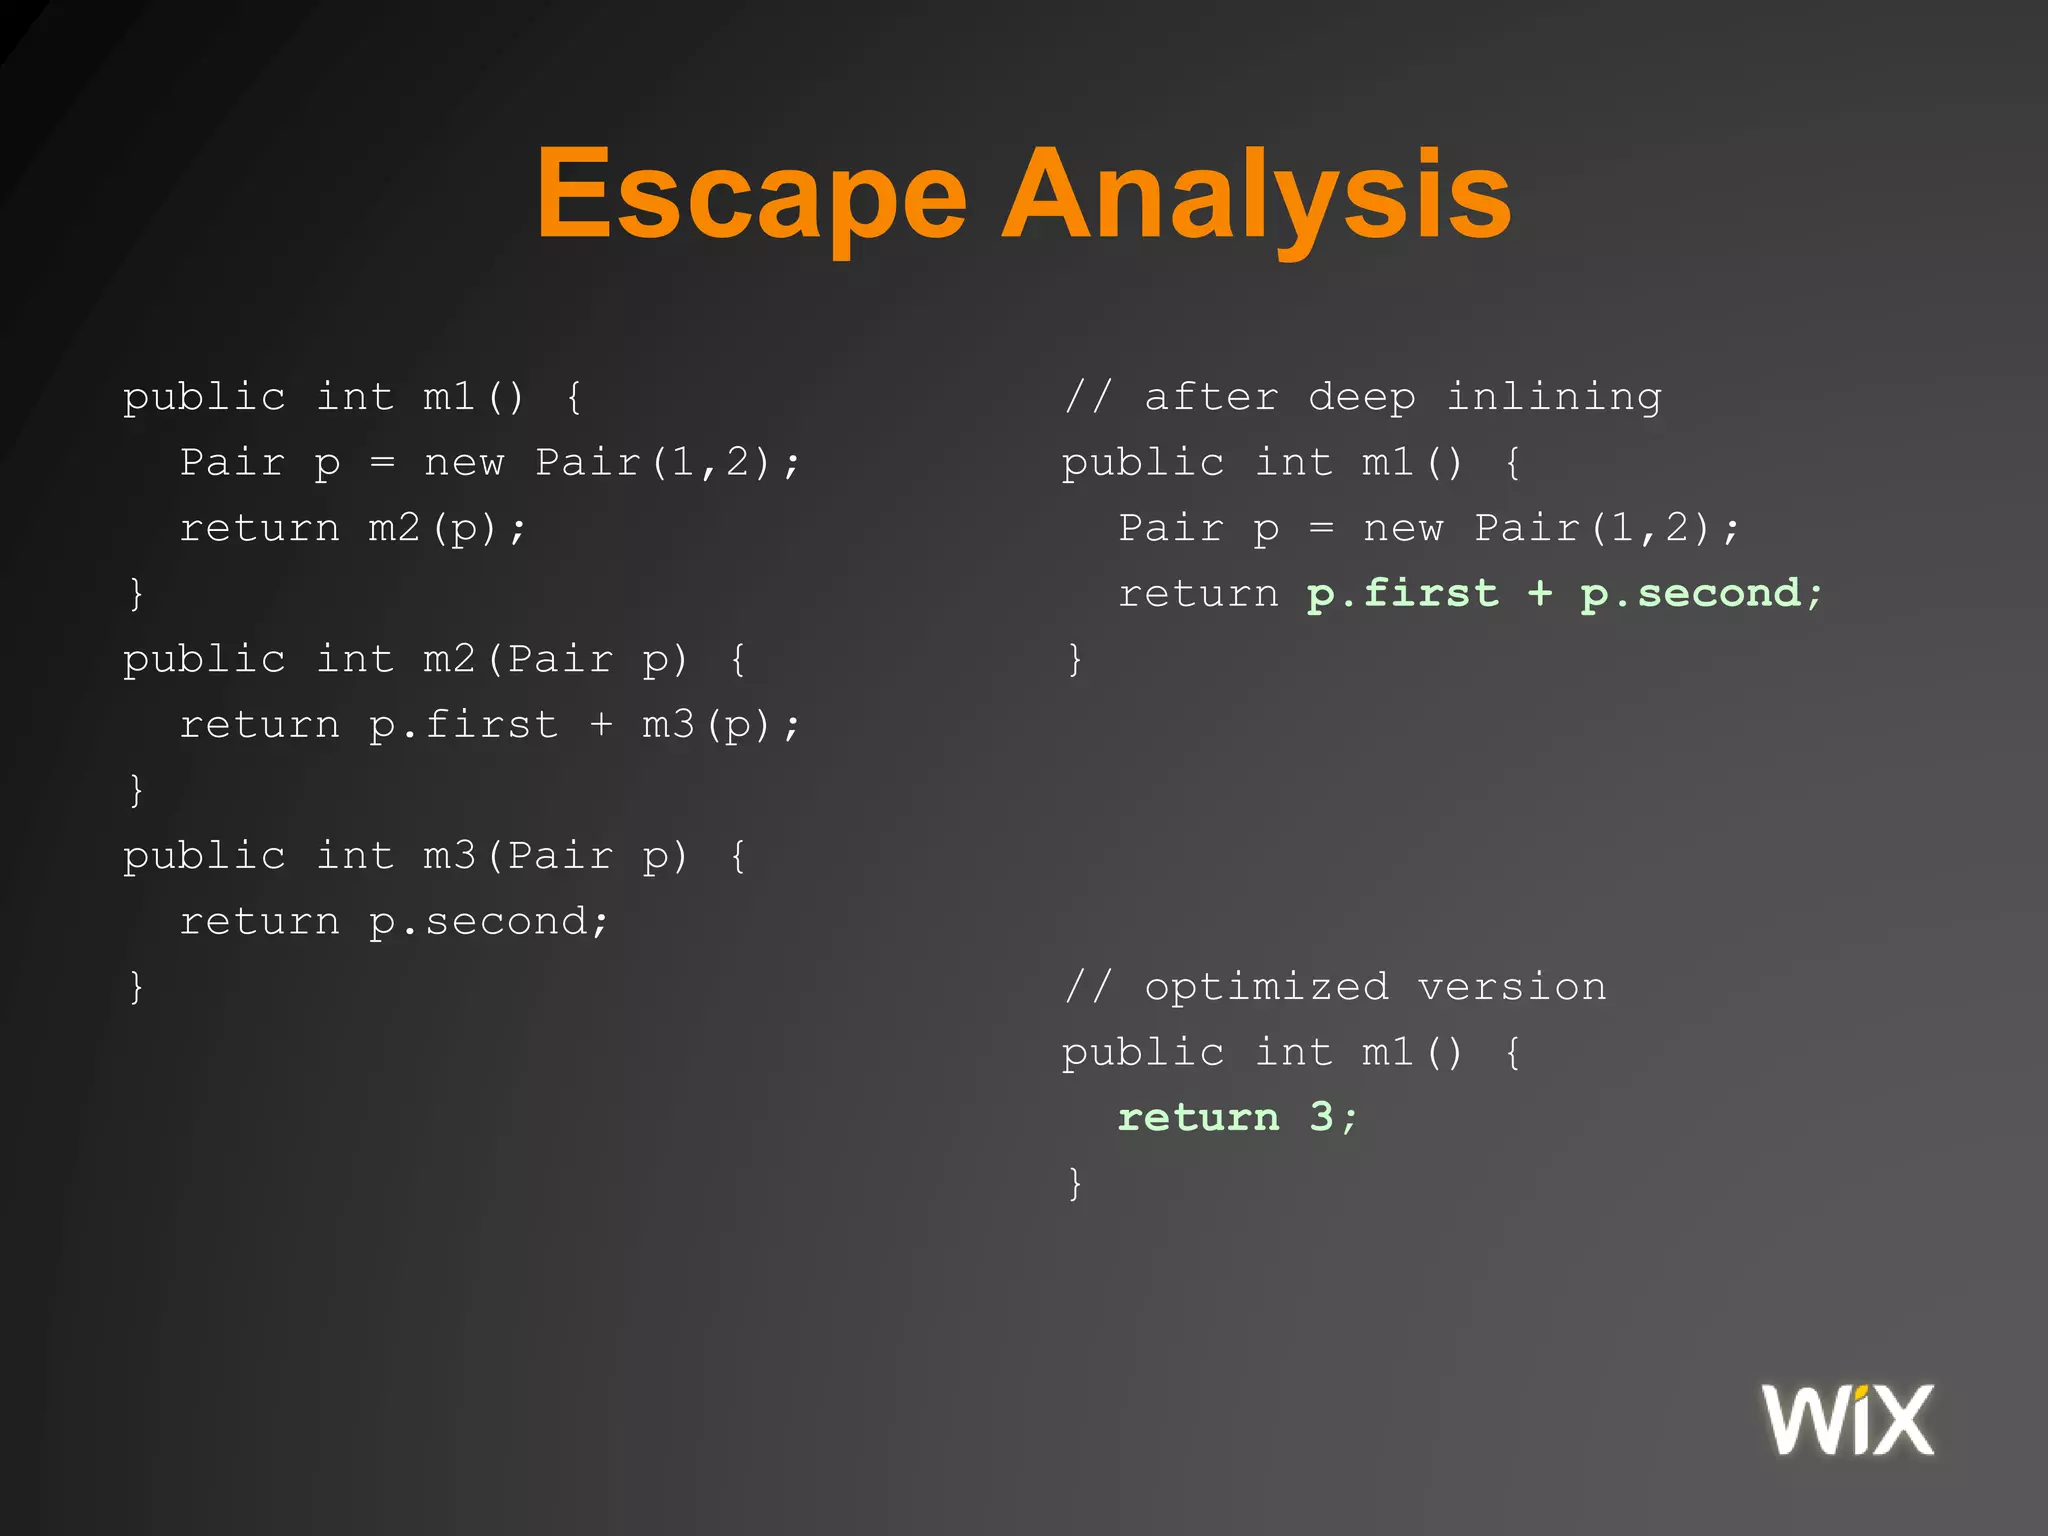
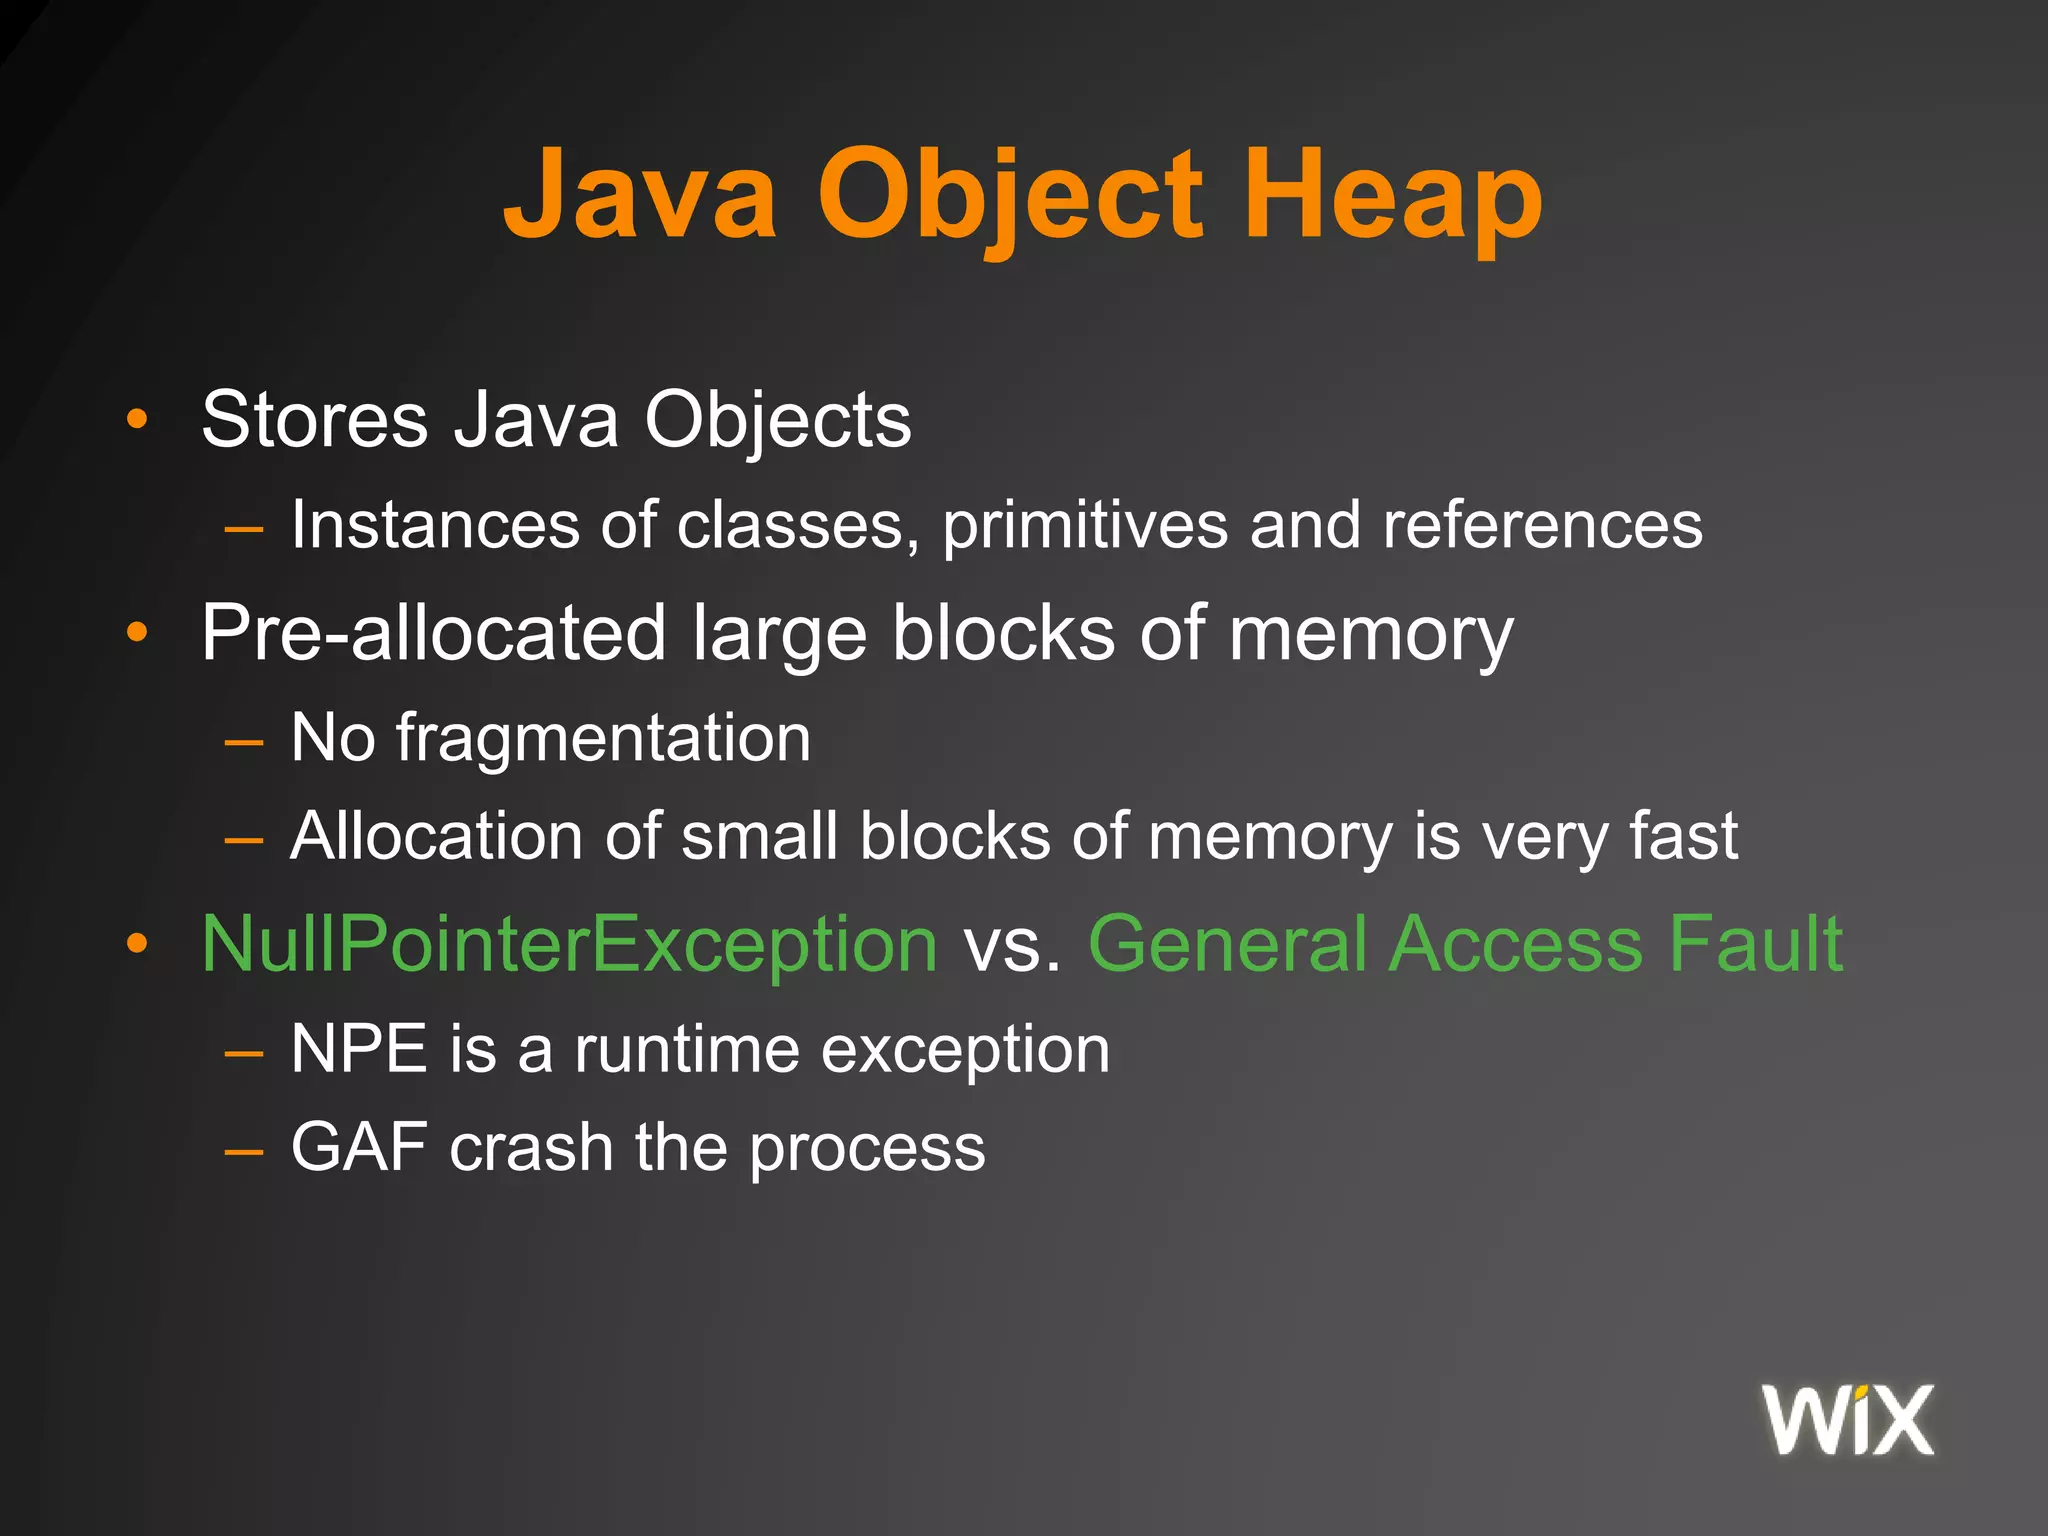
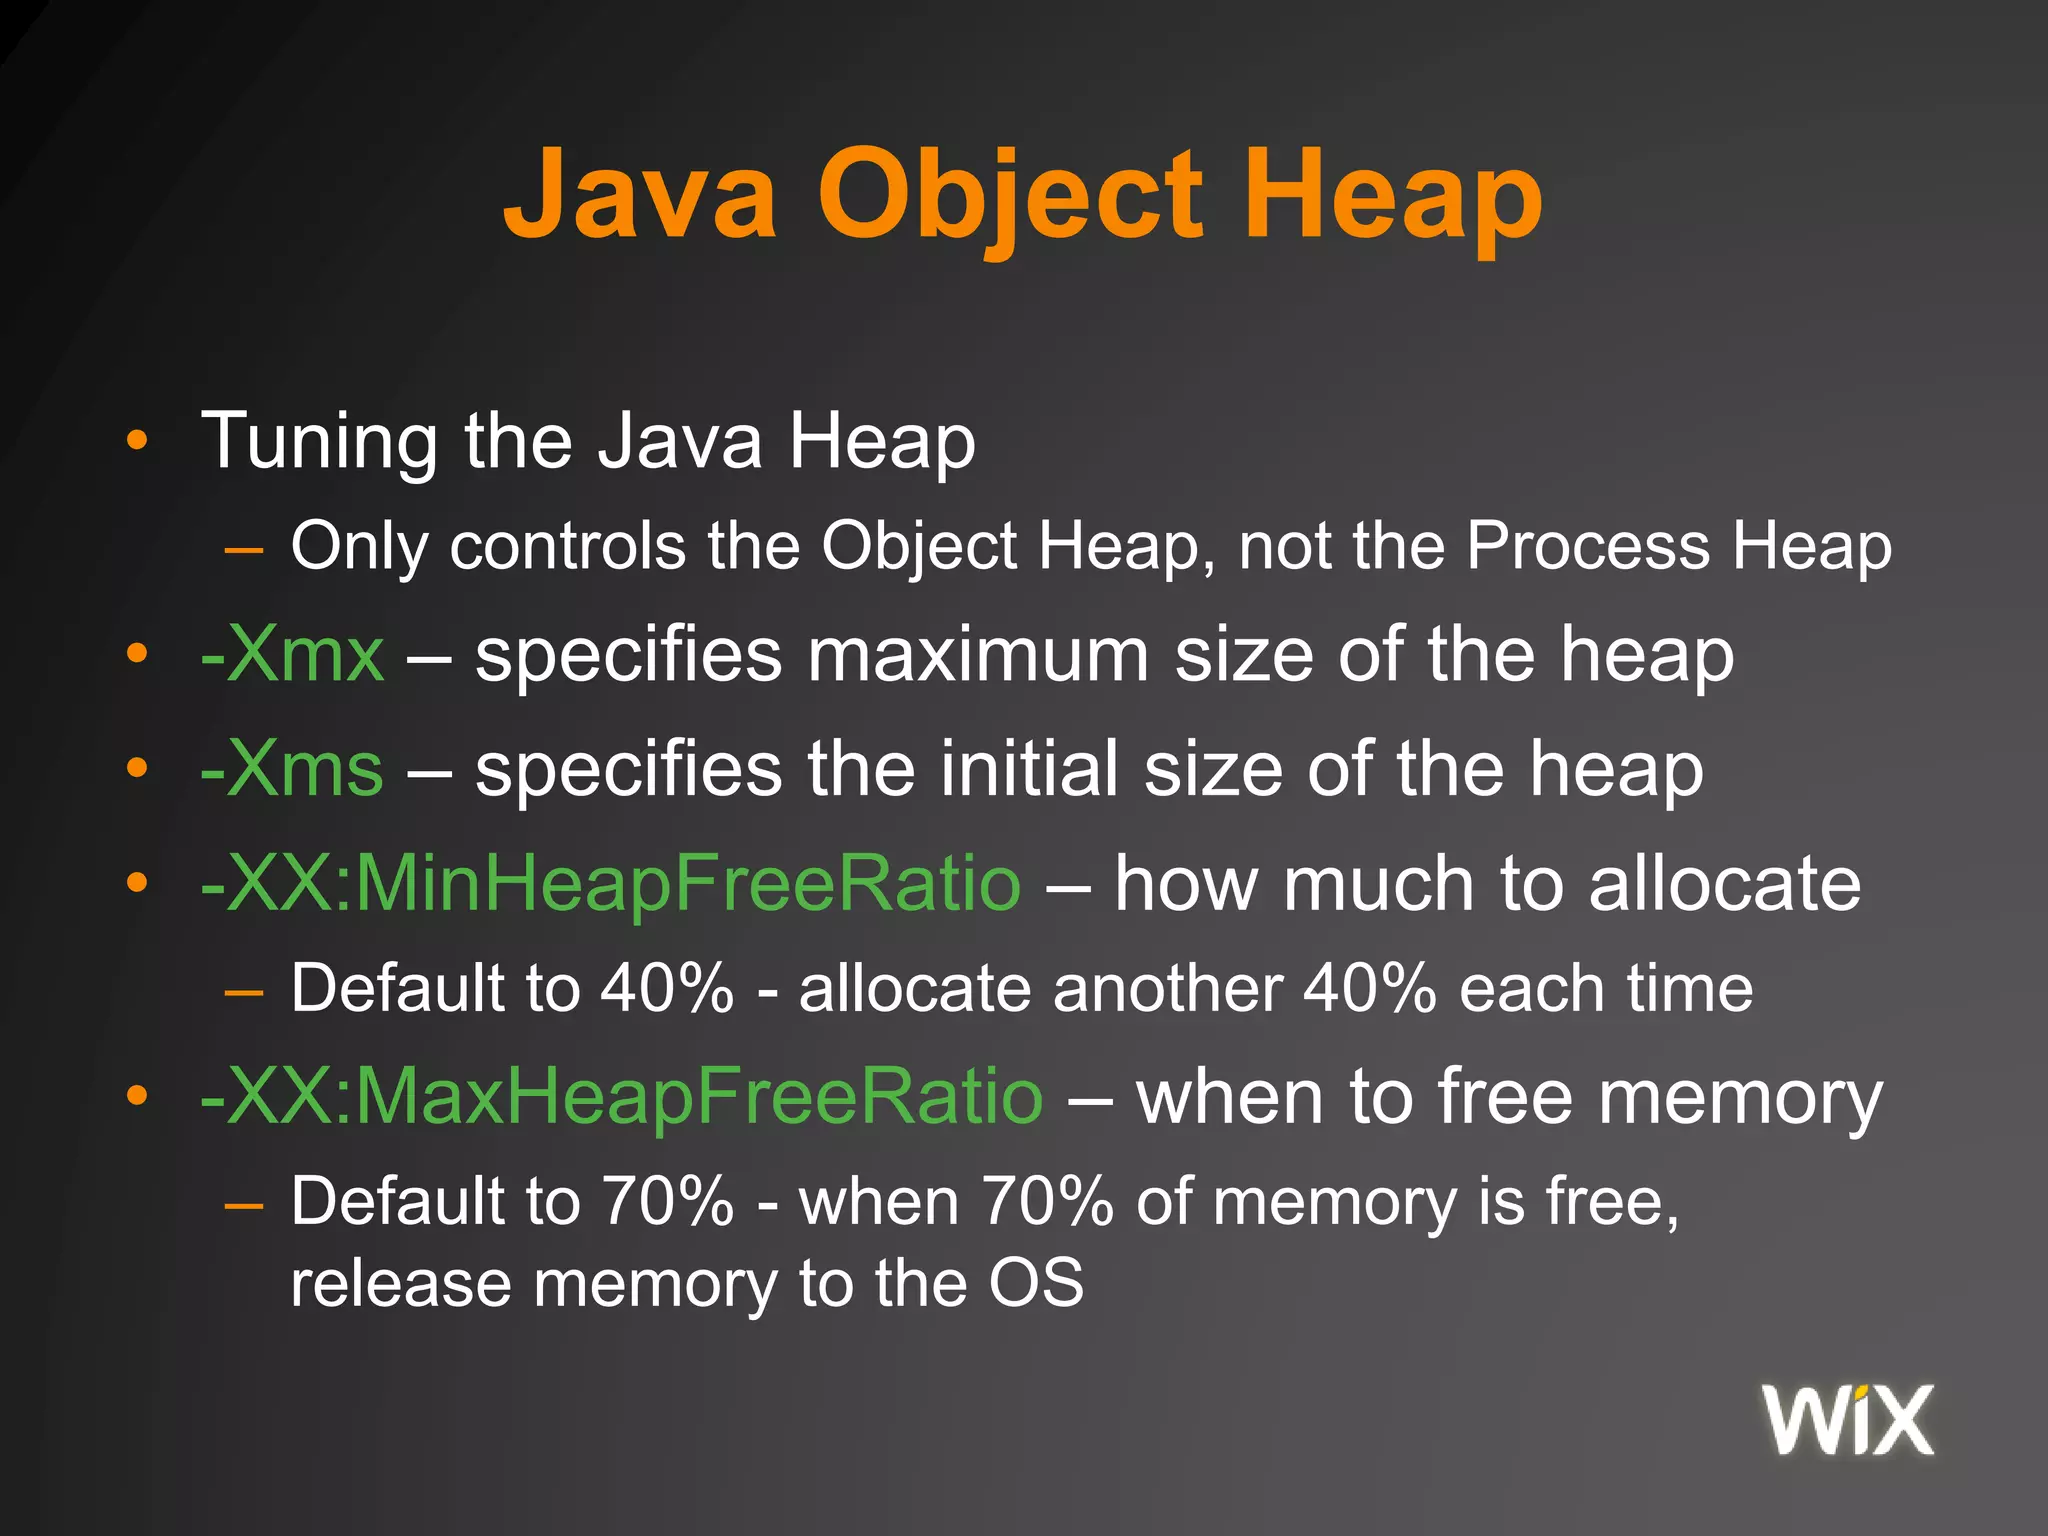
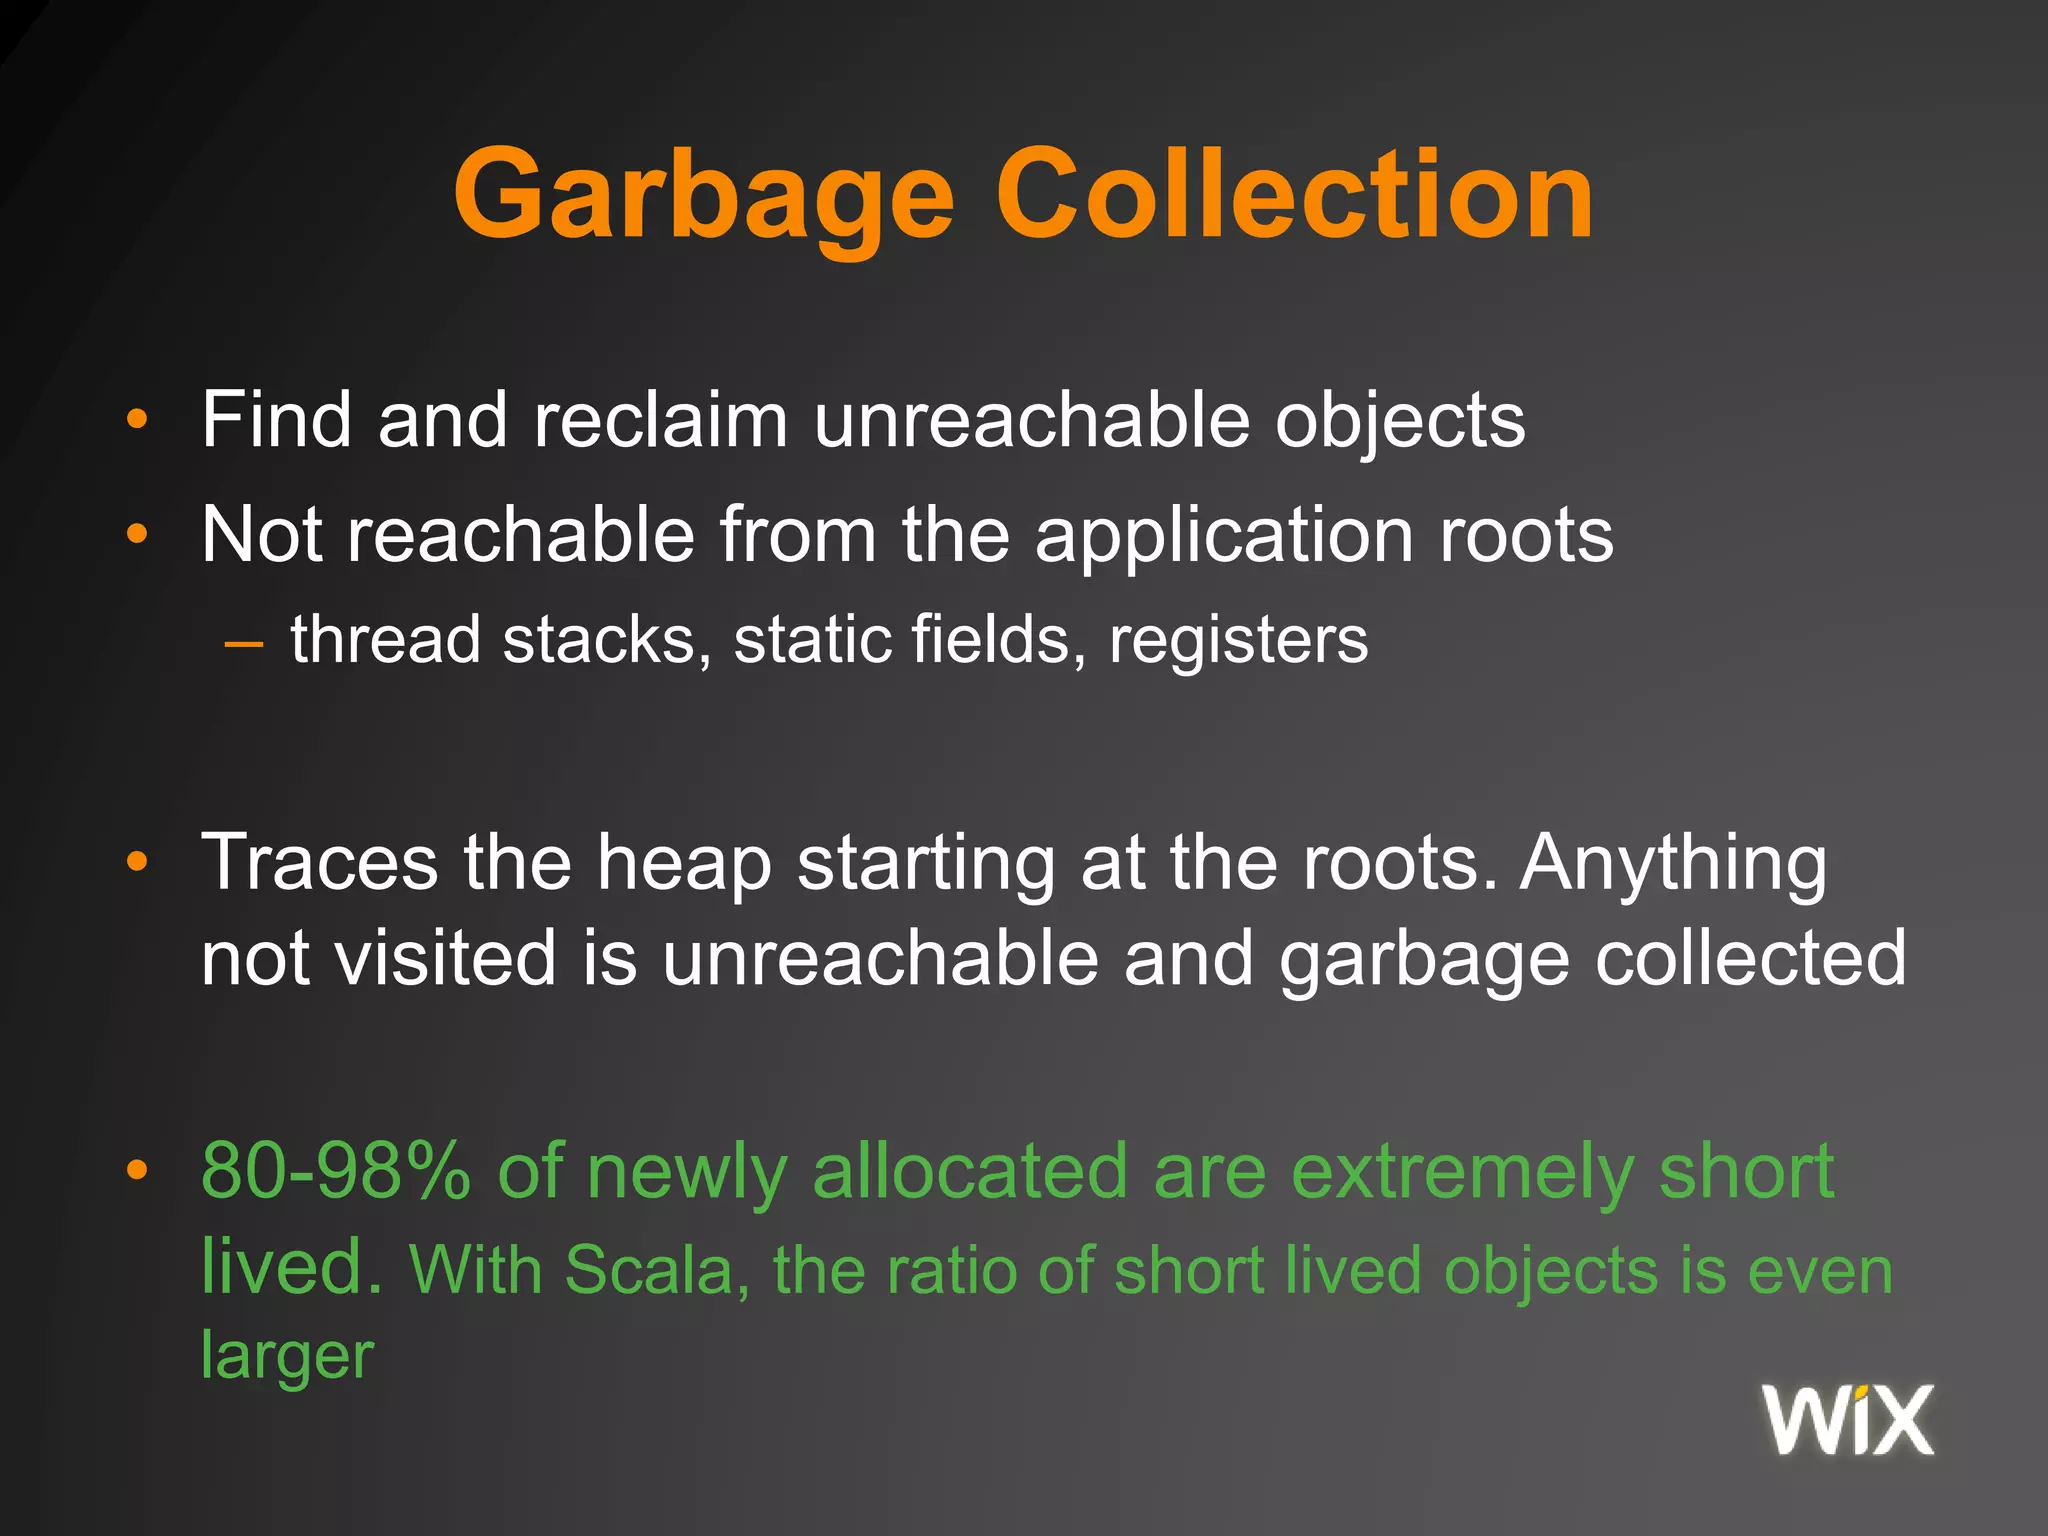
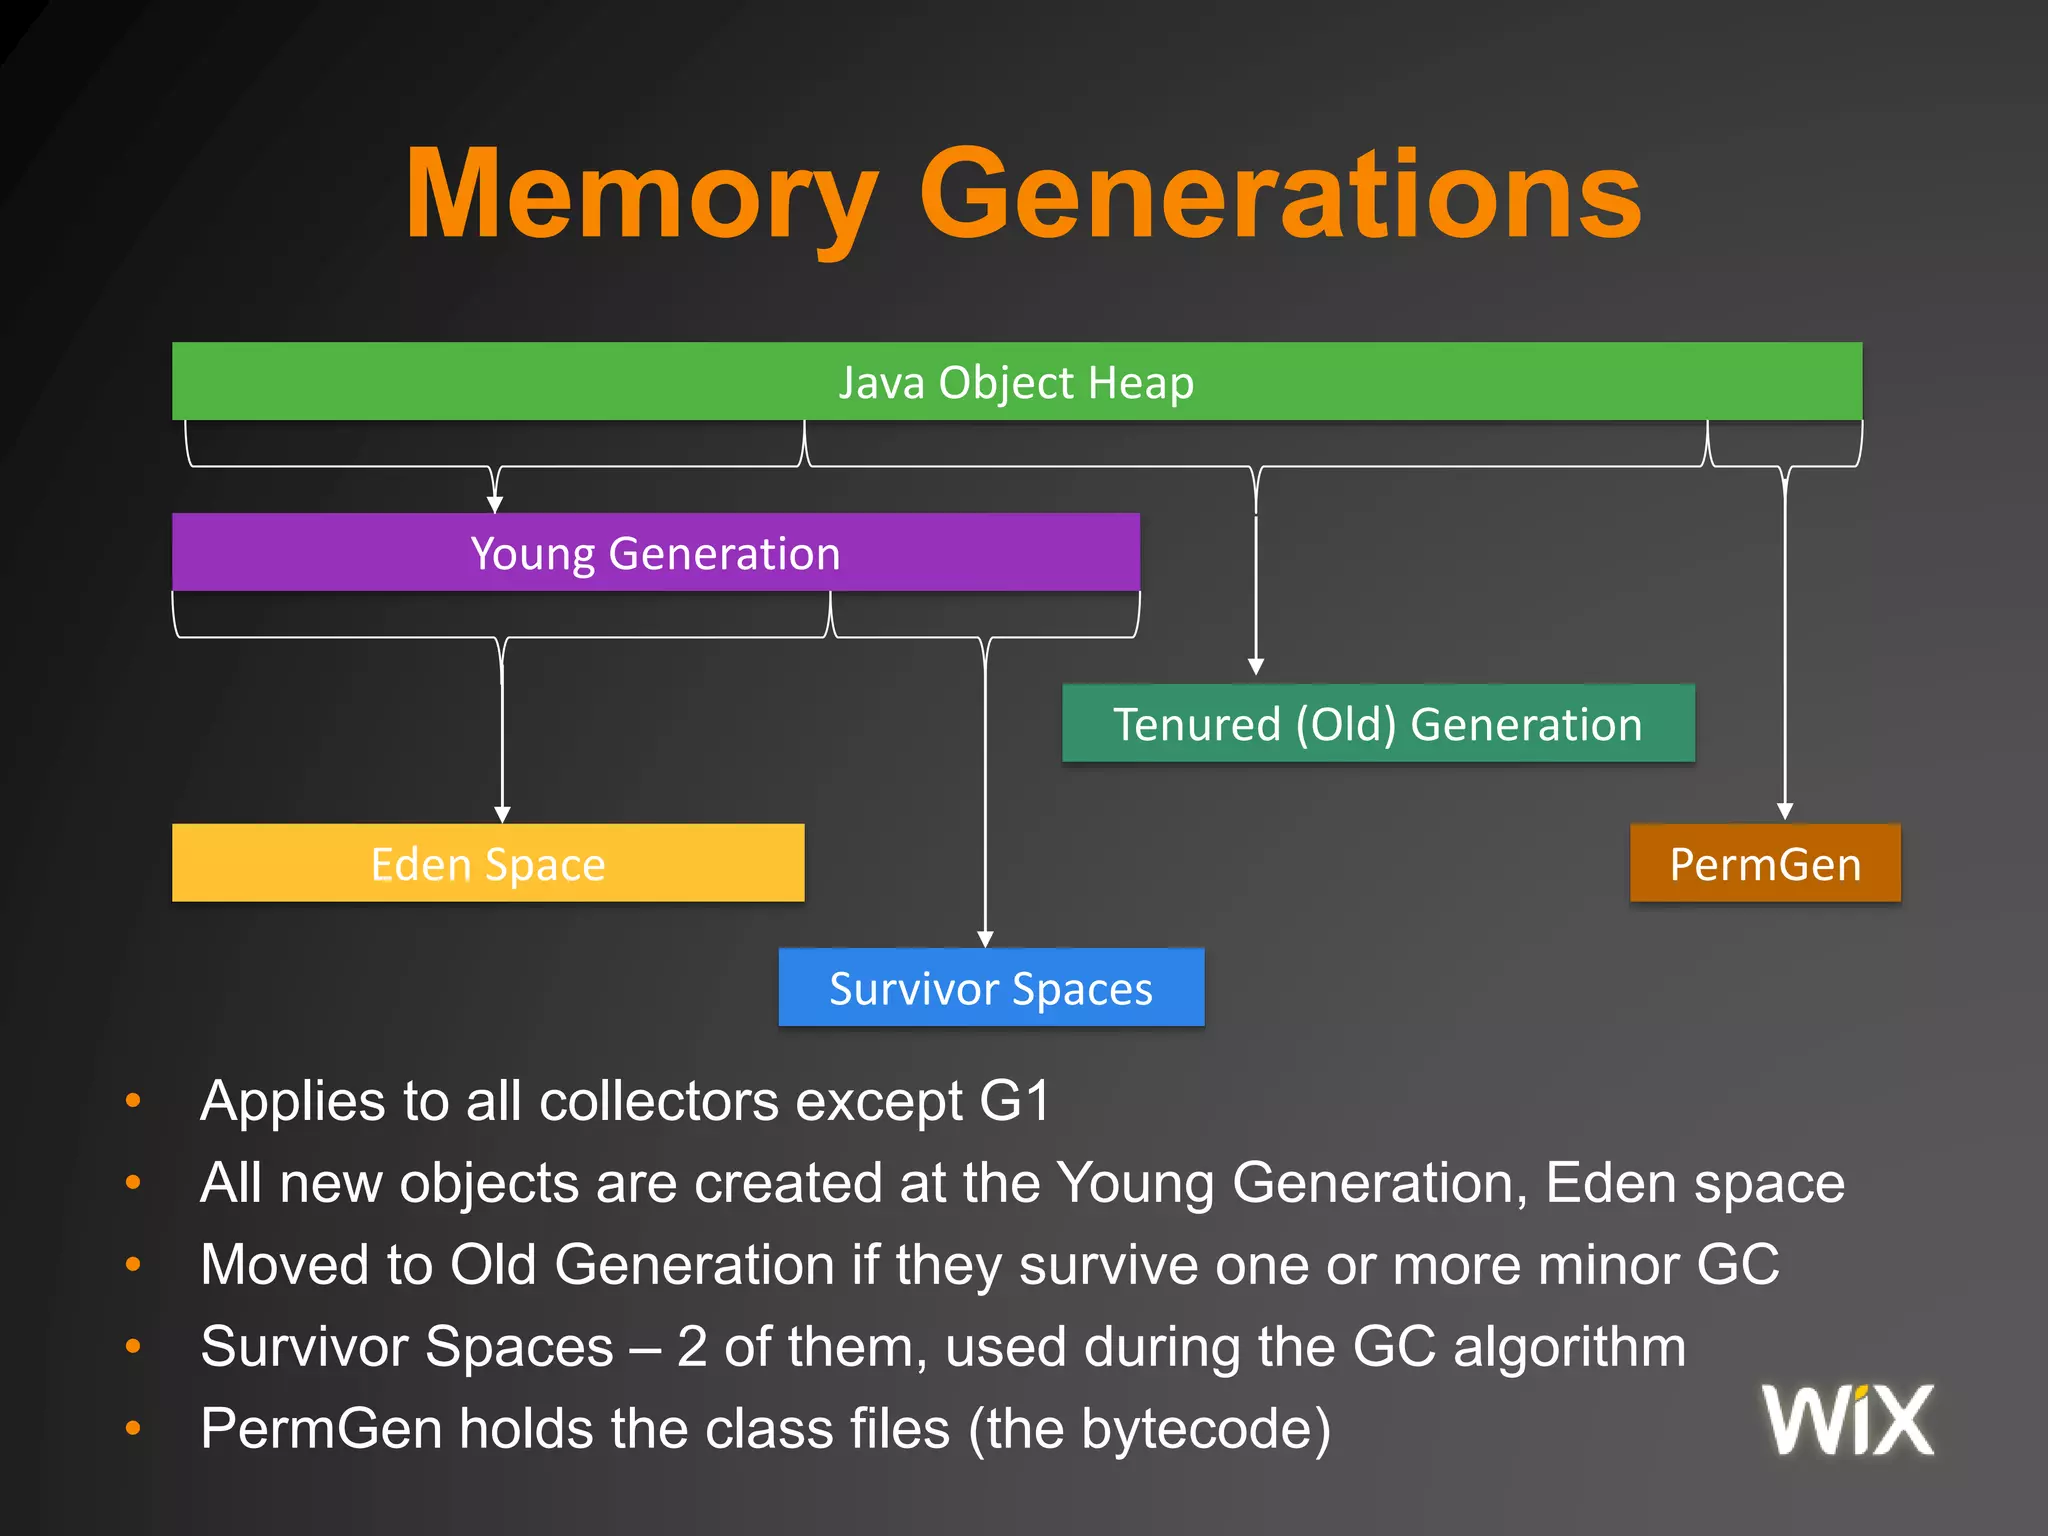
Downloaded 26 times


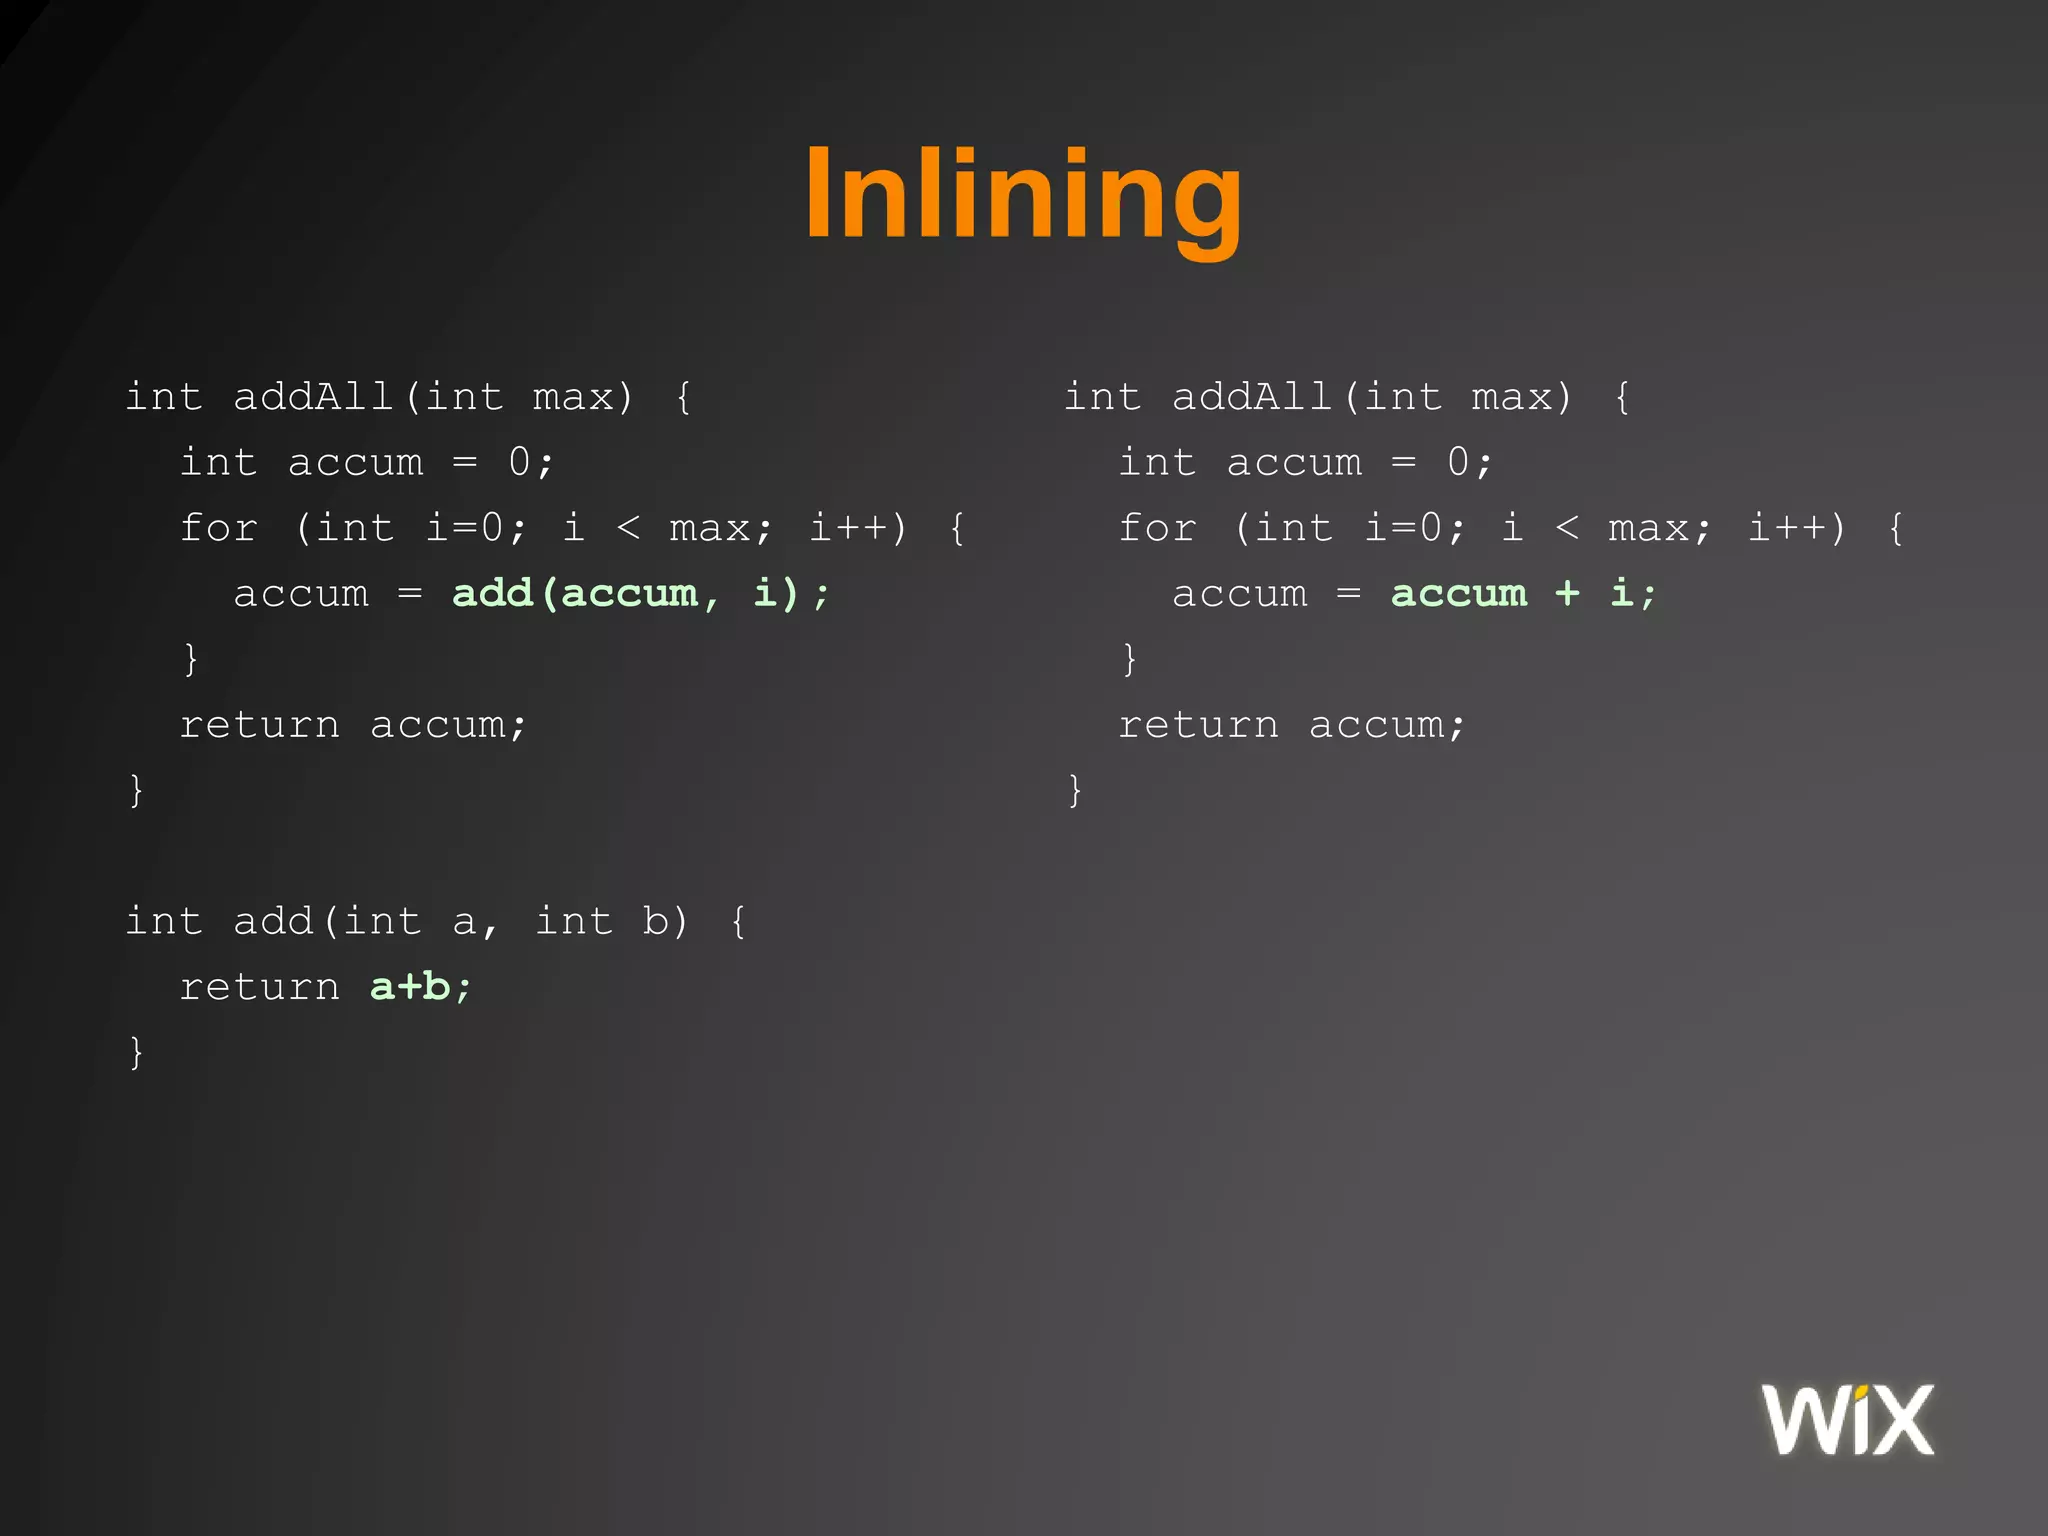
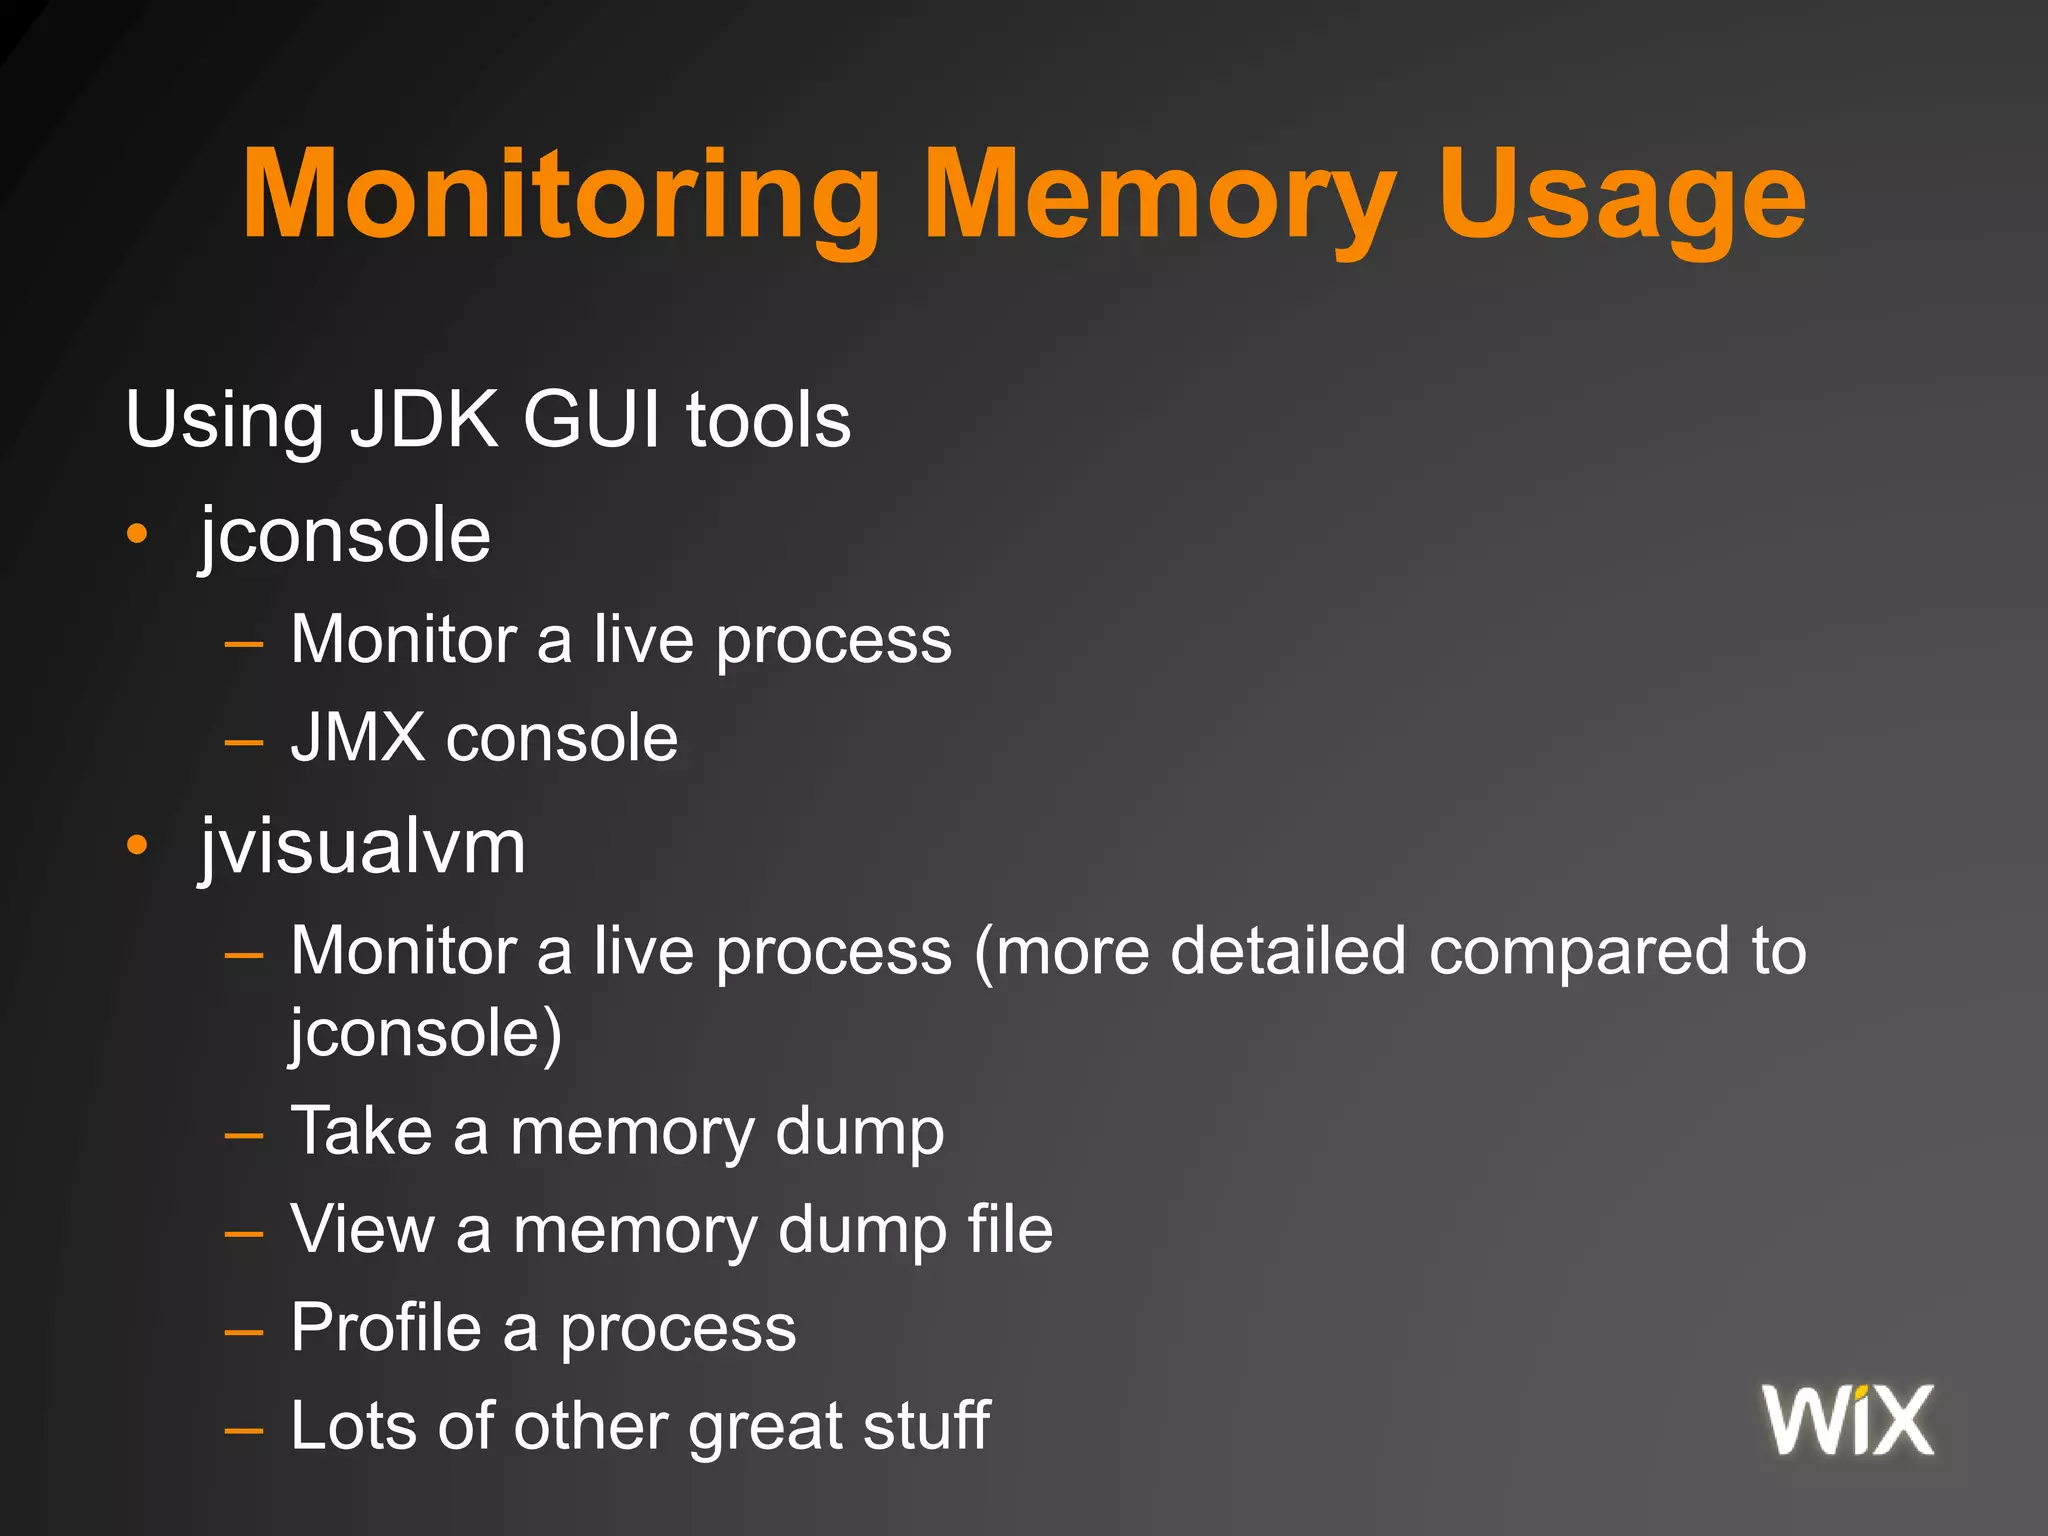
![Loop unrolling
public void foo(int[] arr, int a) {
for (int i=0; i<arr.length; i++) {
arr[i] += a;
}
}
public void foo(int[] arr, int a) {
int limit = arr.length / 4;
for (int i=0; i<limit ; i++){
arr[4*i] += a; arr[4*i+1] += a;
arr[4*i+2] += a; arr[4*i+3] += a;
}
for (int i=limit*4; i<arr.length; i++) {
arr[i] += a;
}
}](https://image.slidesharecdn.com/jvmmemorymodel-150927124203-lva1-app6891/75/Jvm-memory-model-11-2048.jpg)
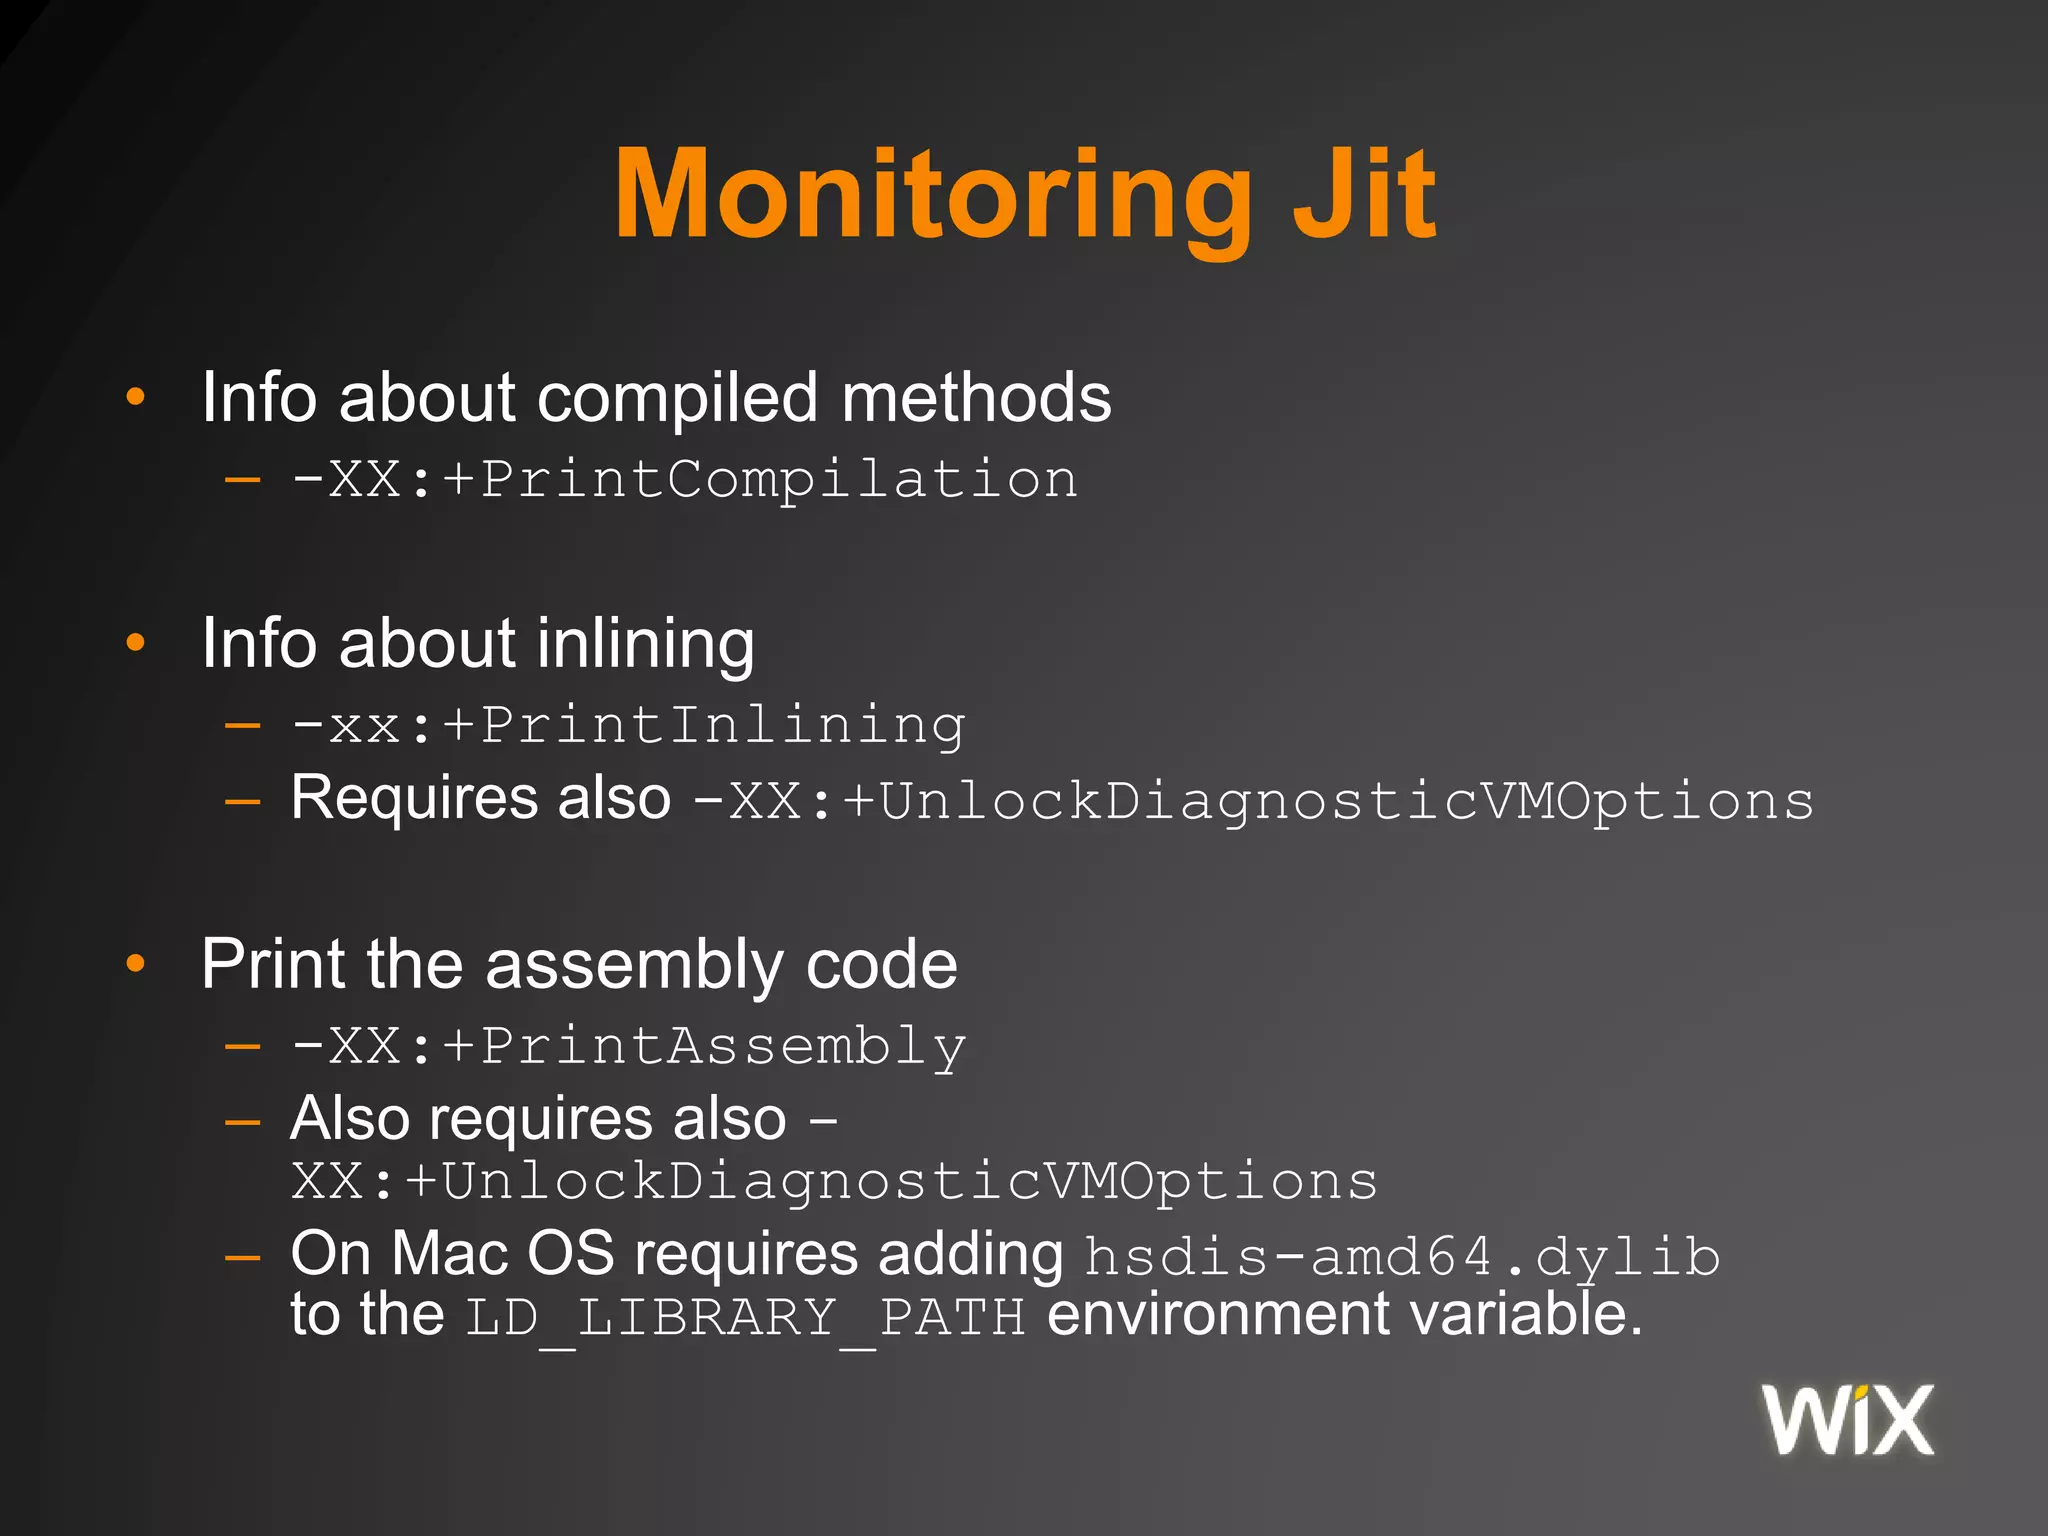

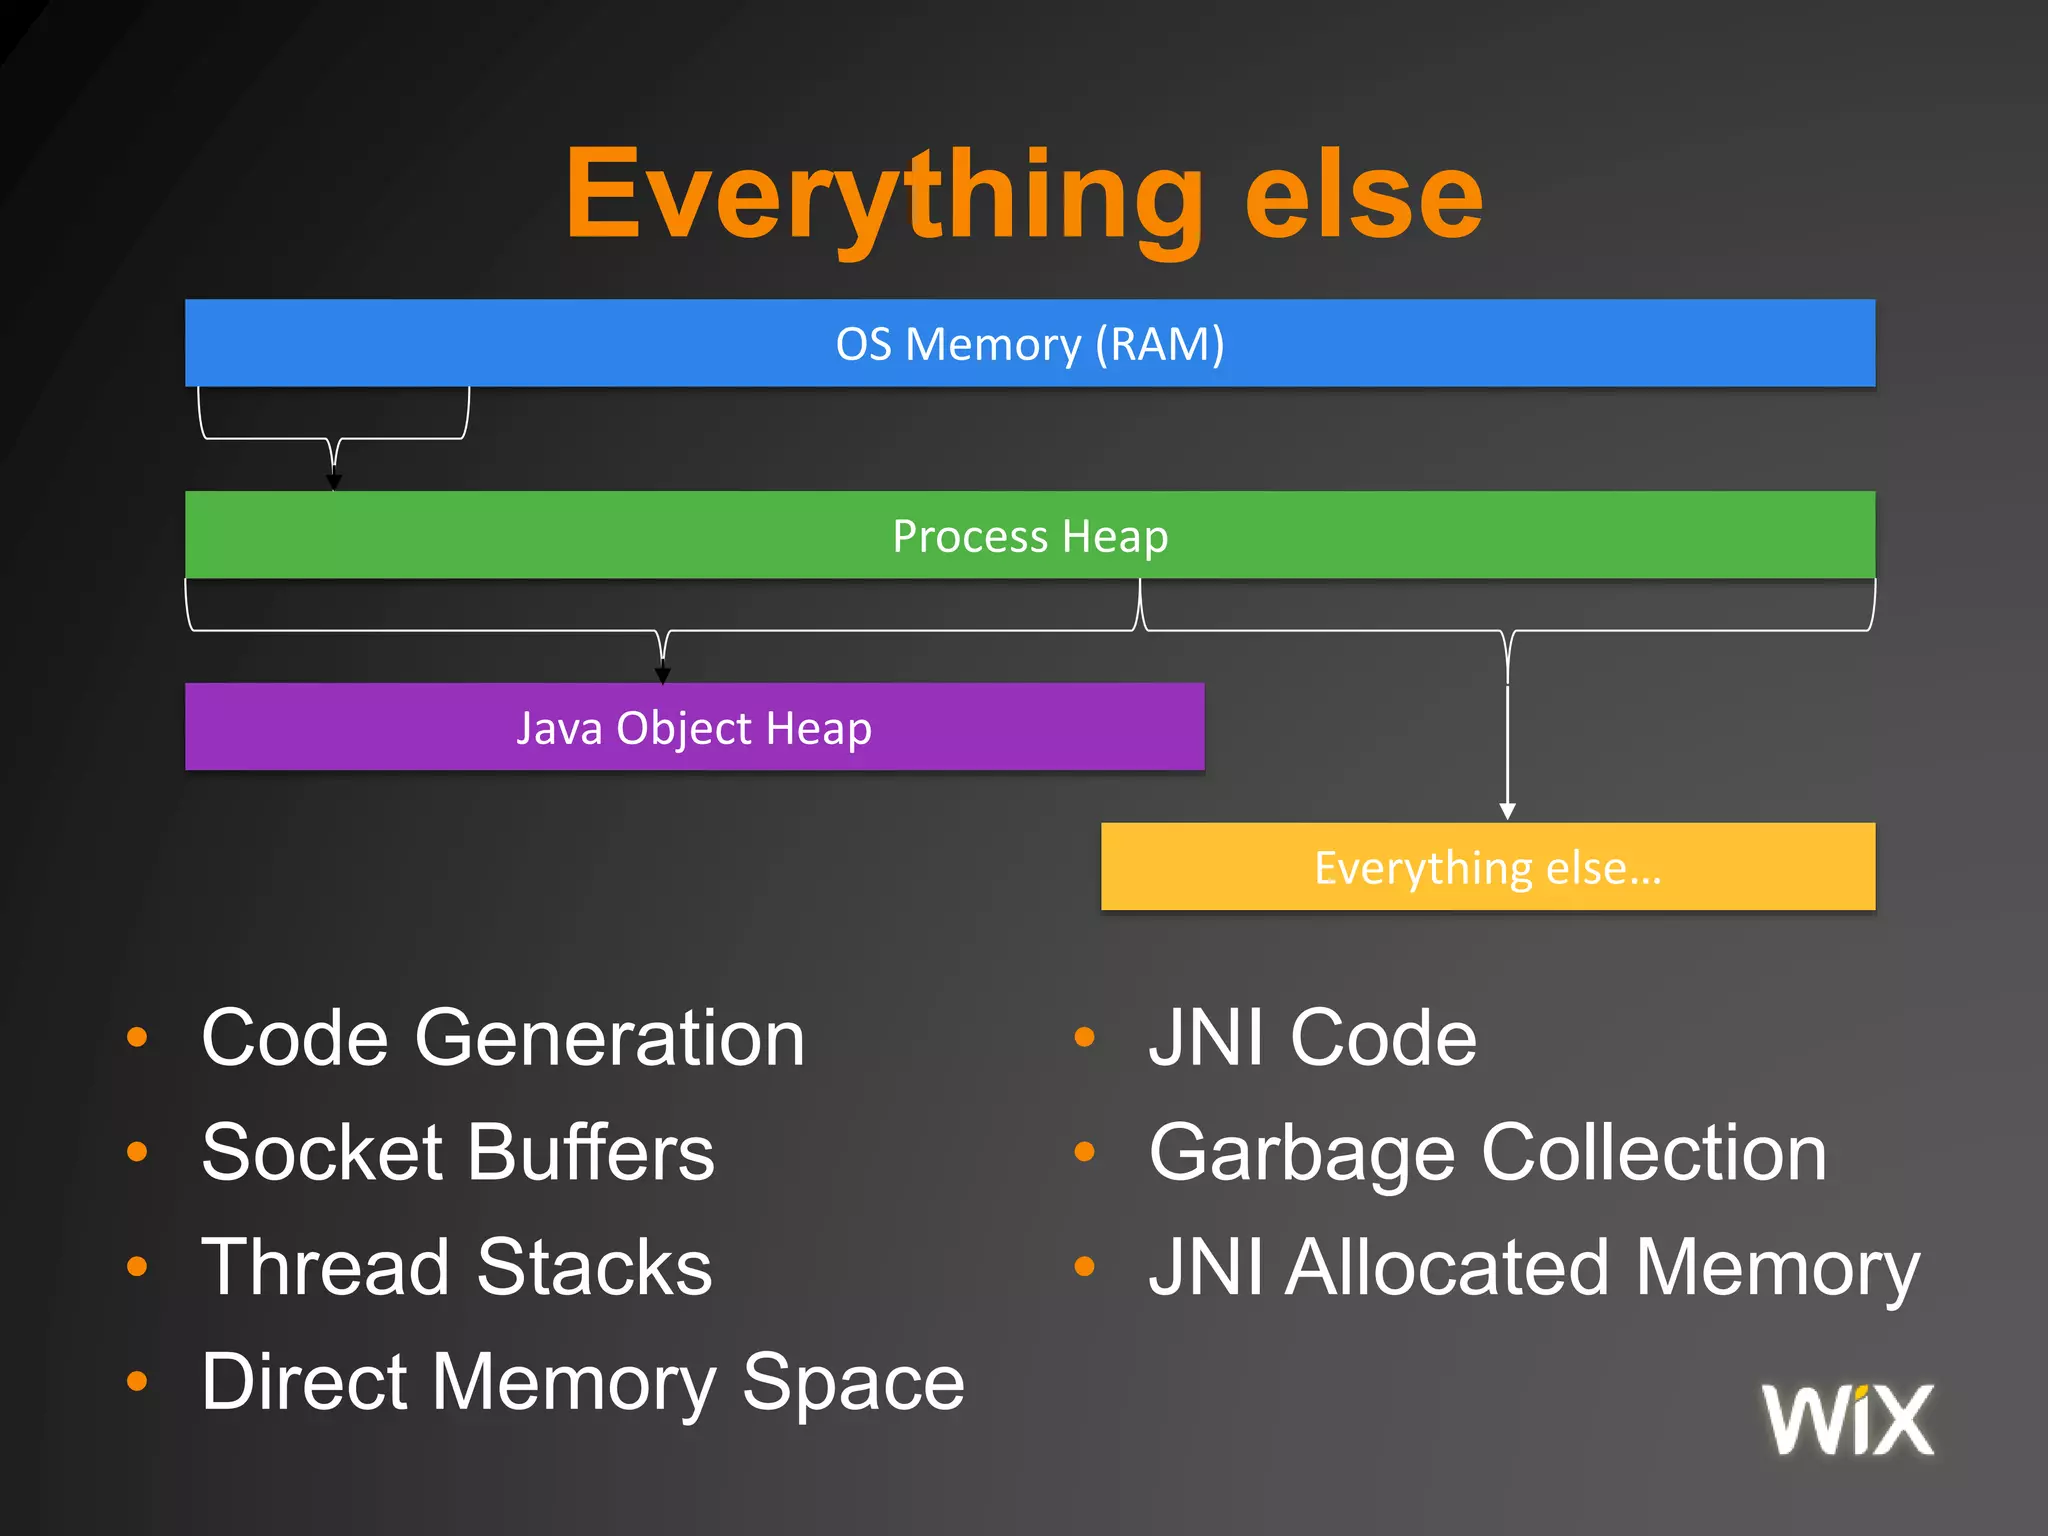
![Classic Memory Leak in C
• User does the memory management
void service(int n, char** names) {
for (int i = 0; i < n; i++) {
char* buf = (char*) malloc(strlen(names[i]));
strncpy(buf, names[i], strlen(names[i]));
}
// memory leaked here
}
• User is responsible for calling free()
• User is vulnerable to
– Dangling pointers
– Double frees](https://image.slidesharecdn.com/jvmmemorymodel-150927124203-lva1-app6891/75/Jvm-memory-model-43-2048.jpg)


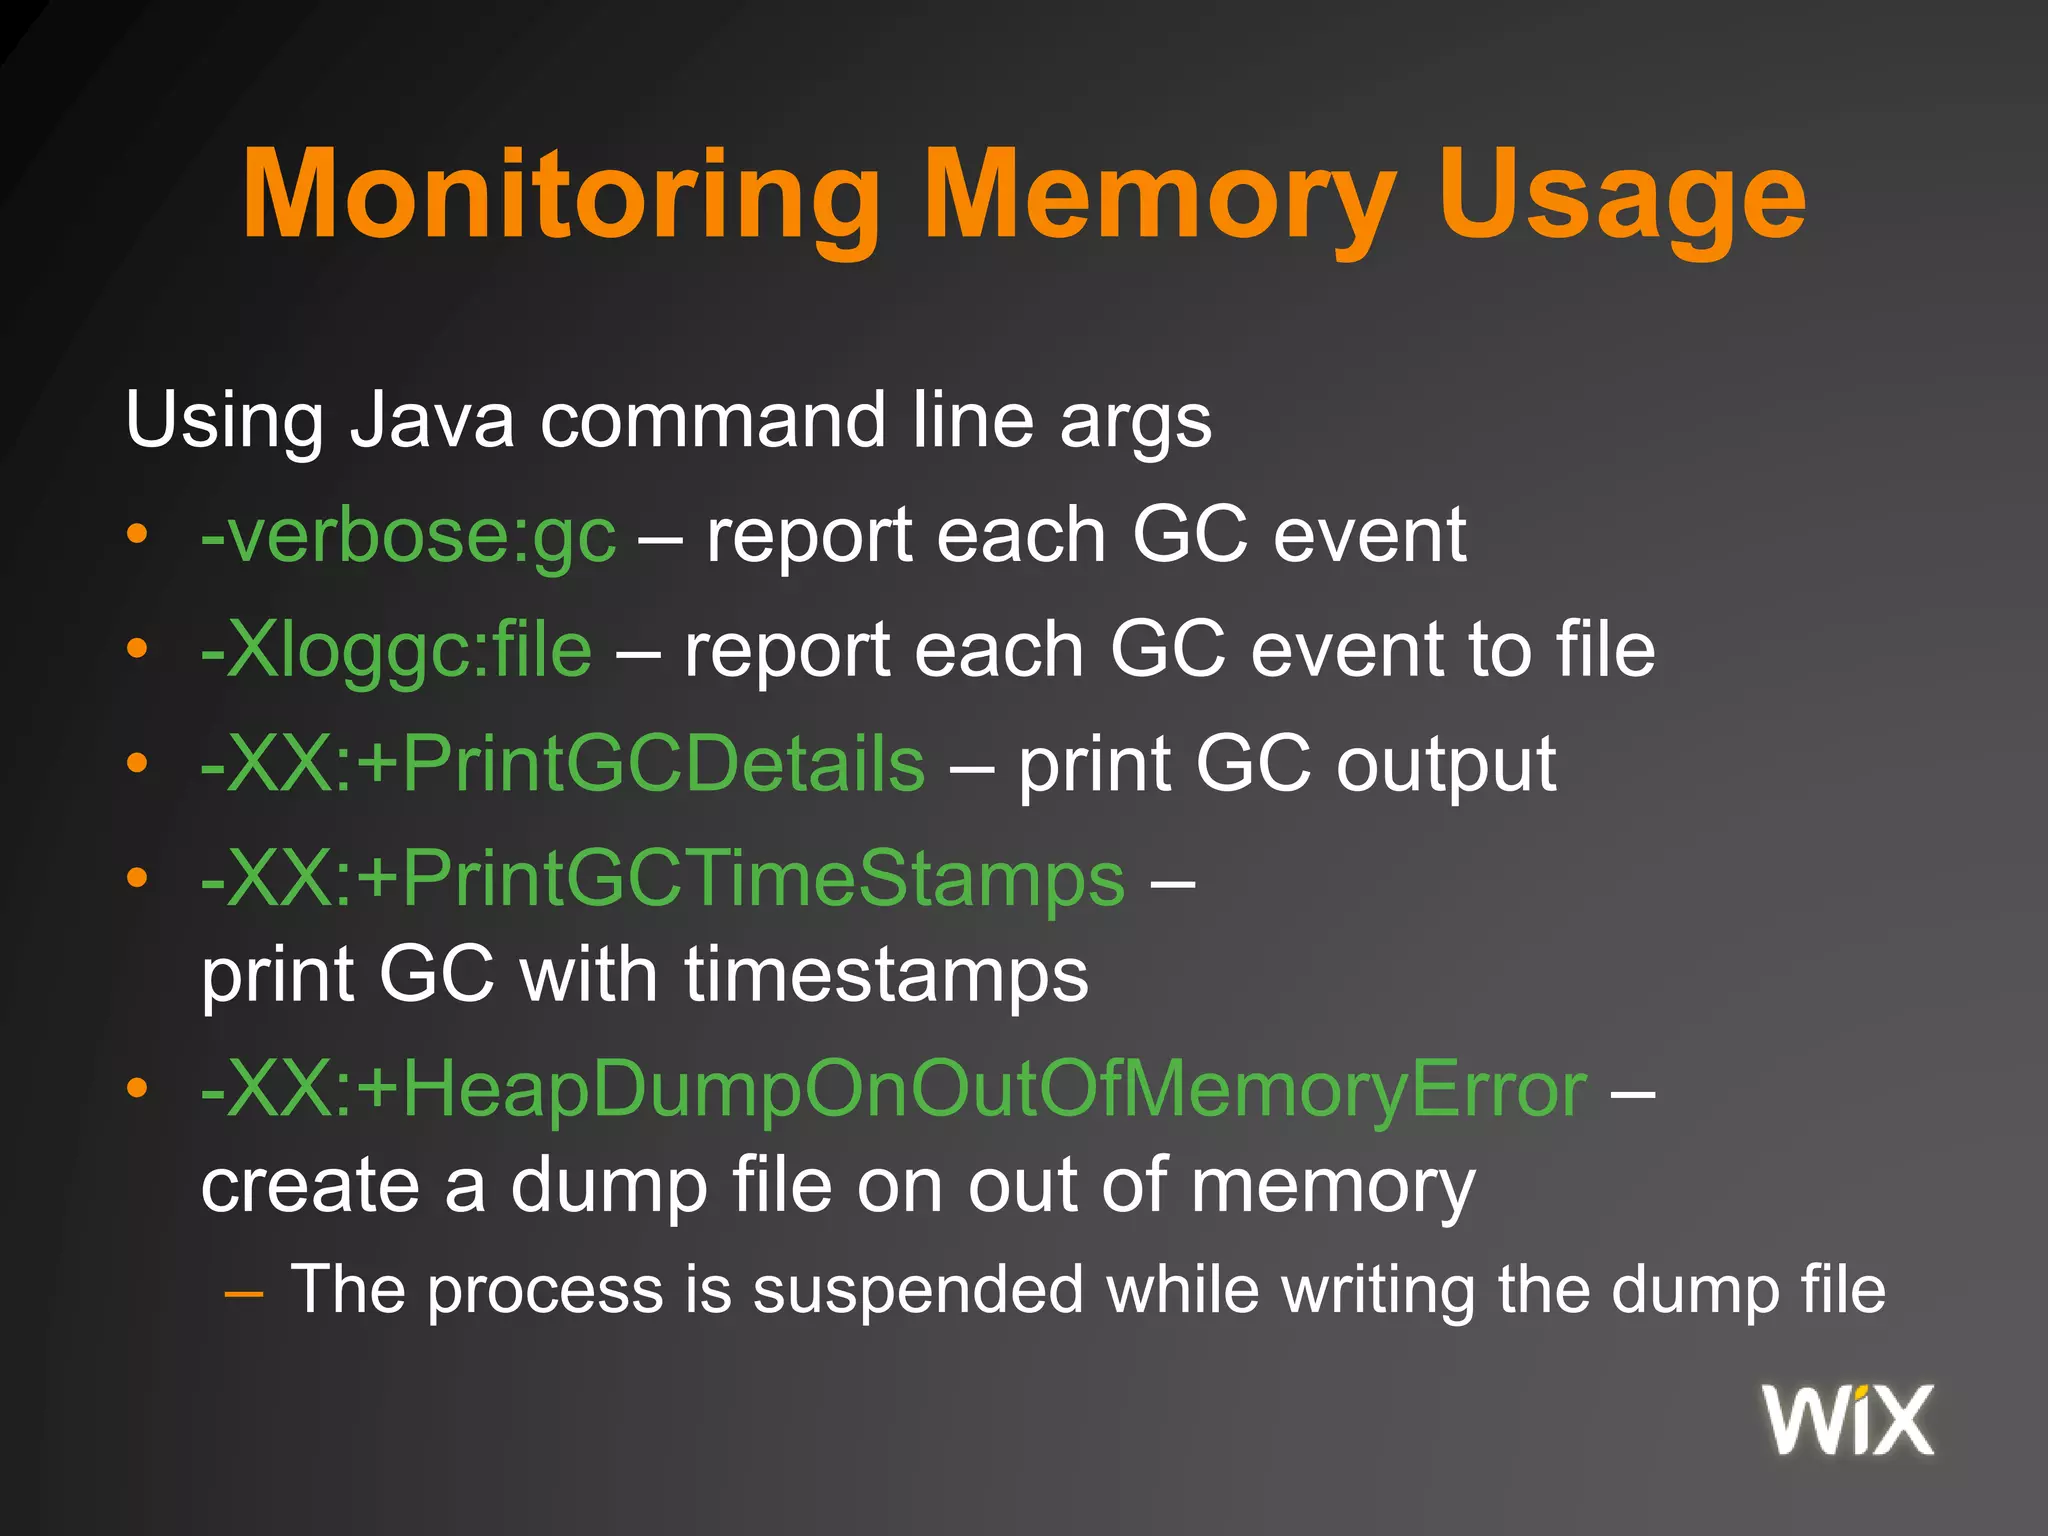
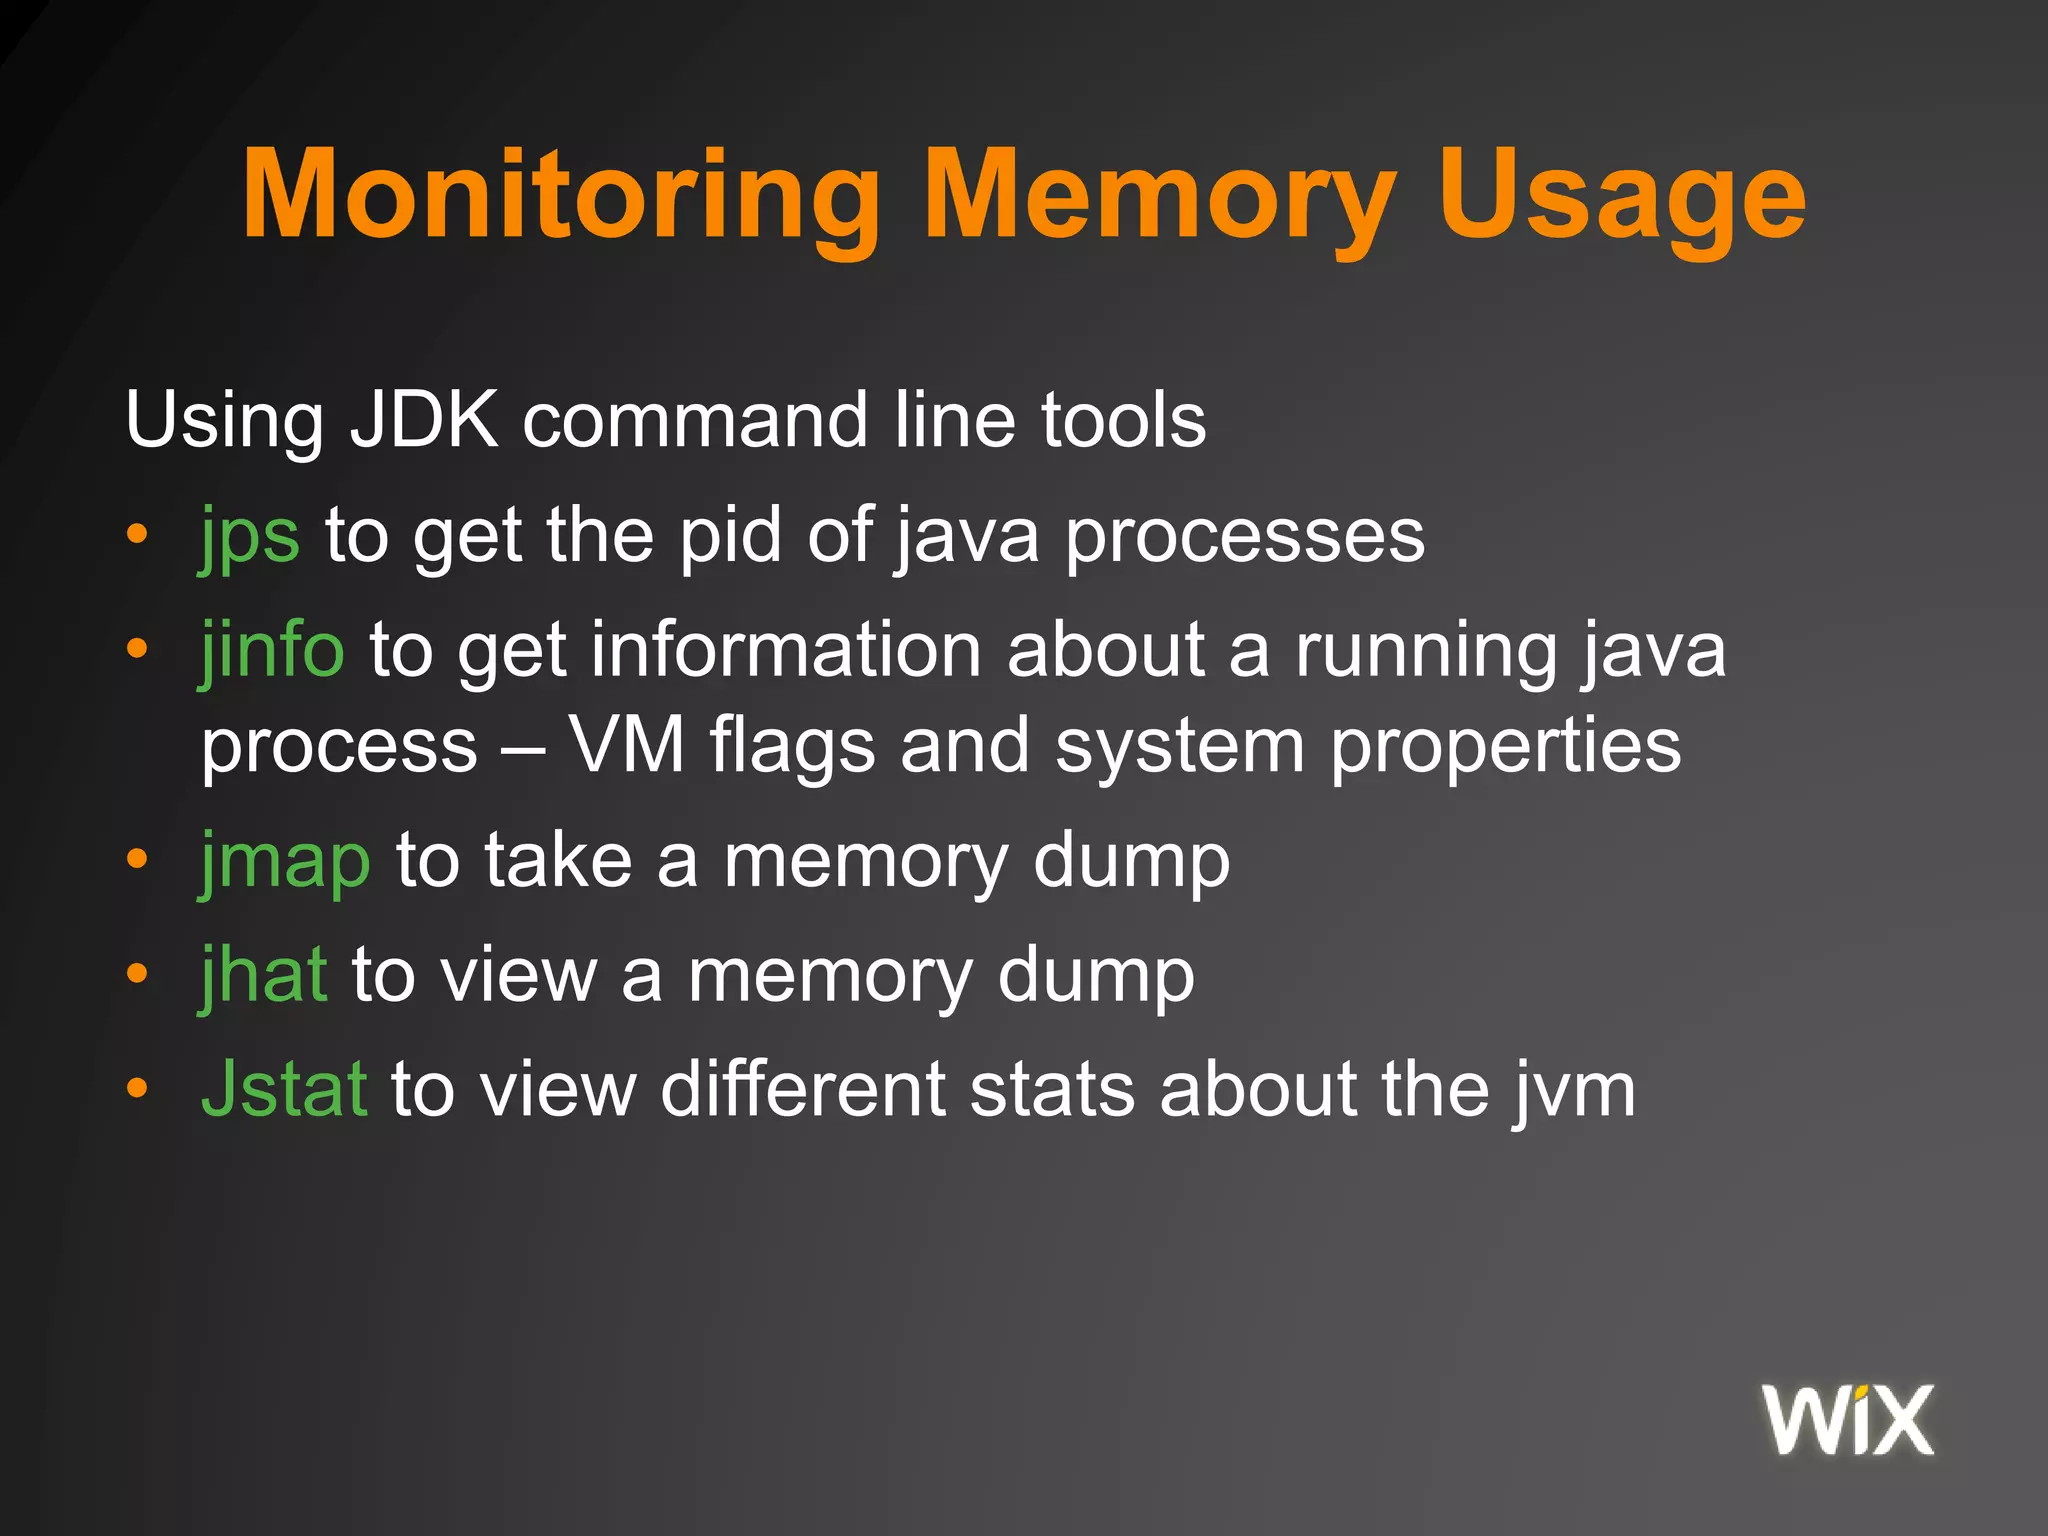


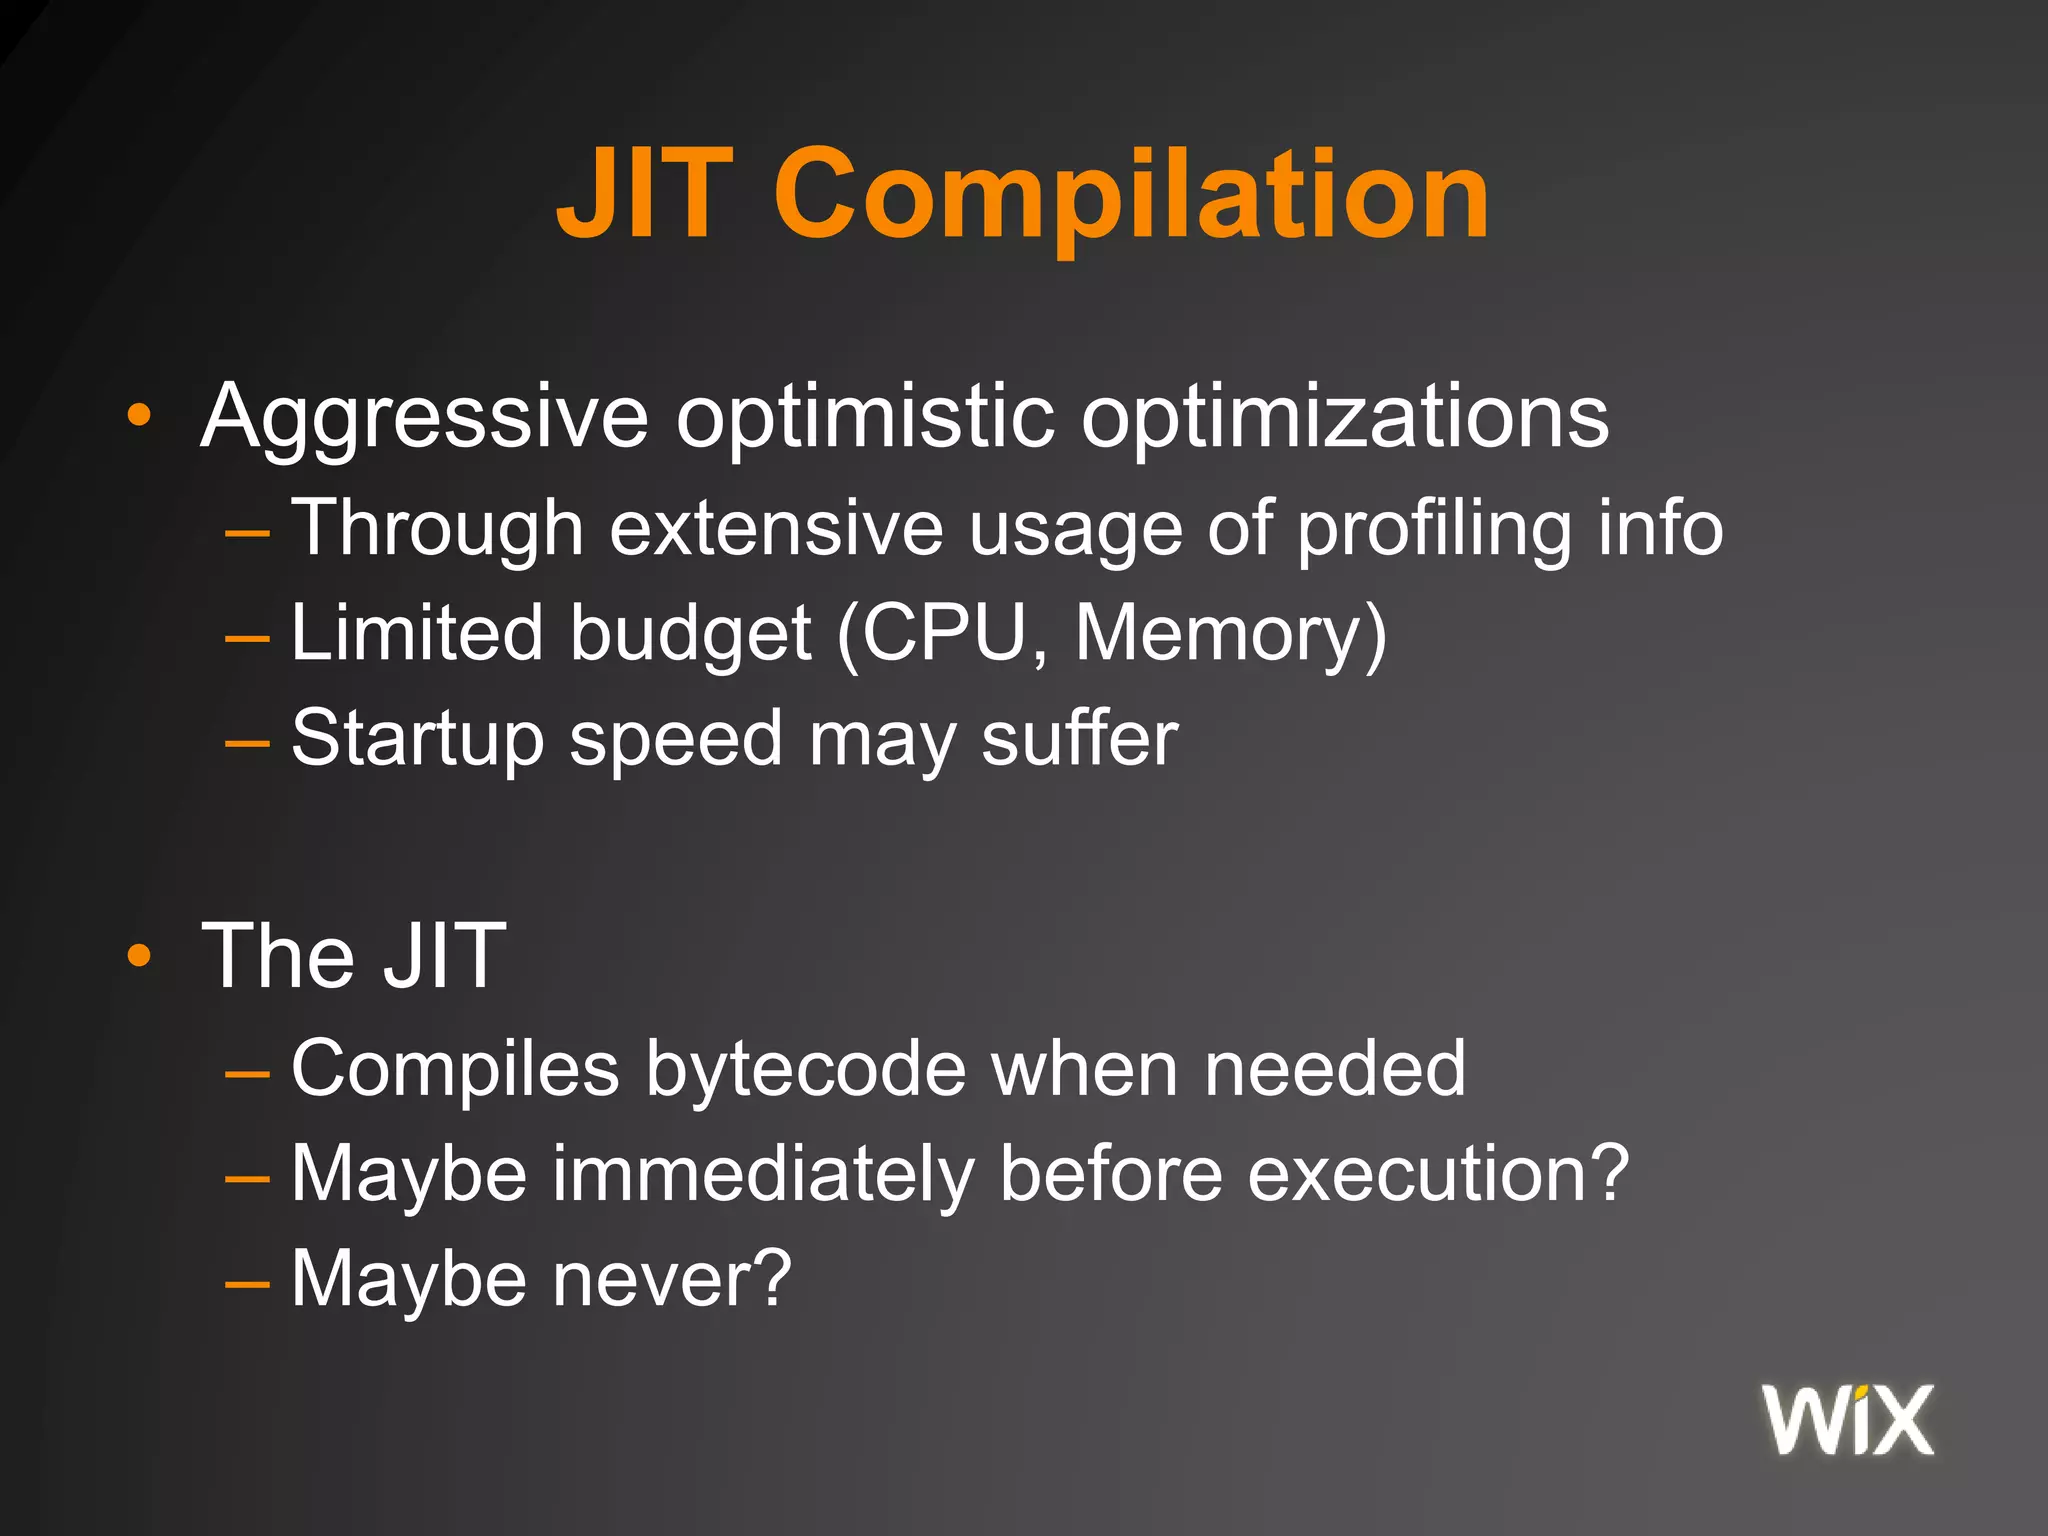
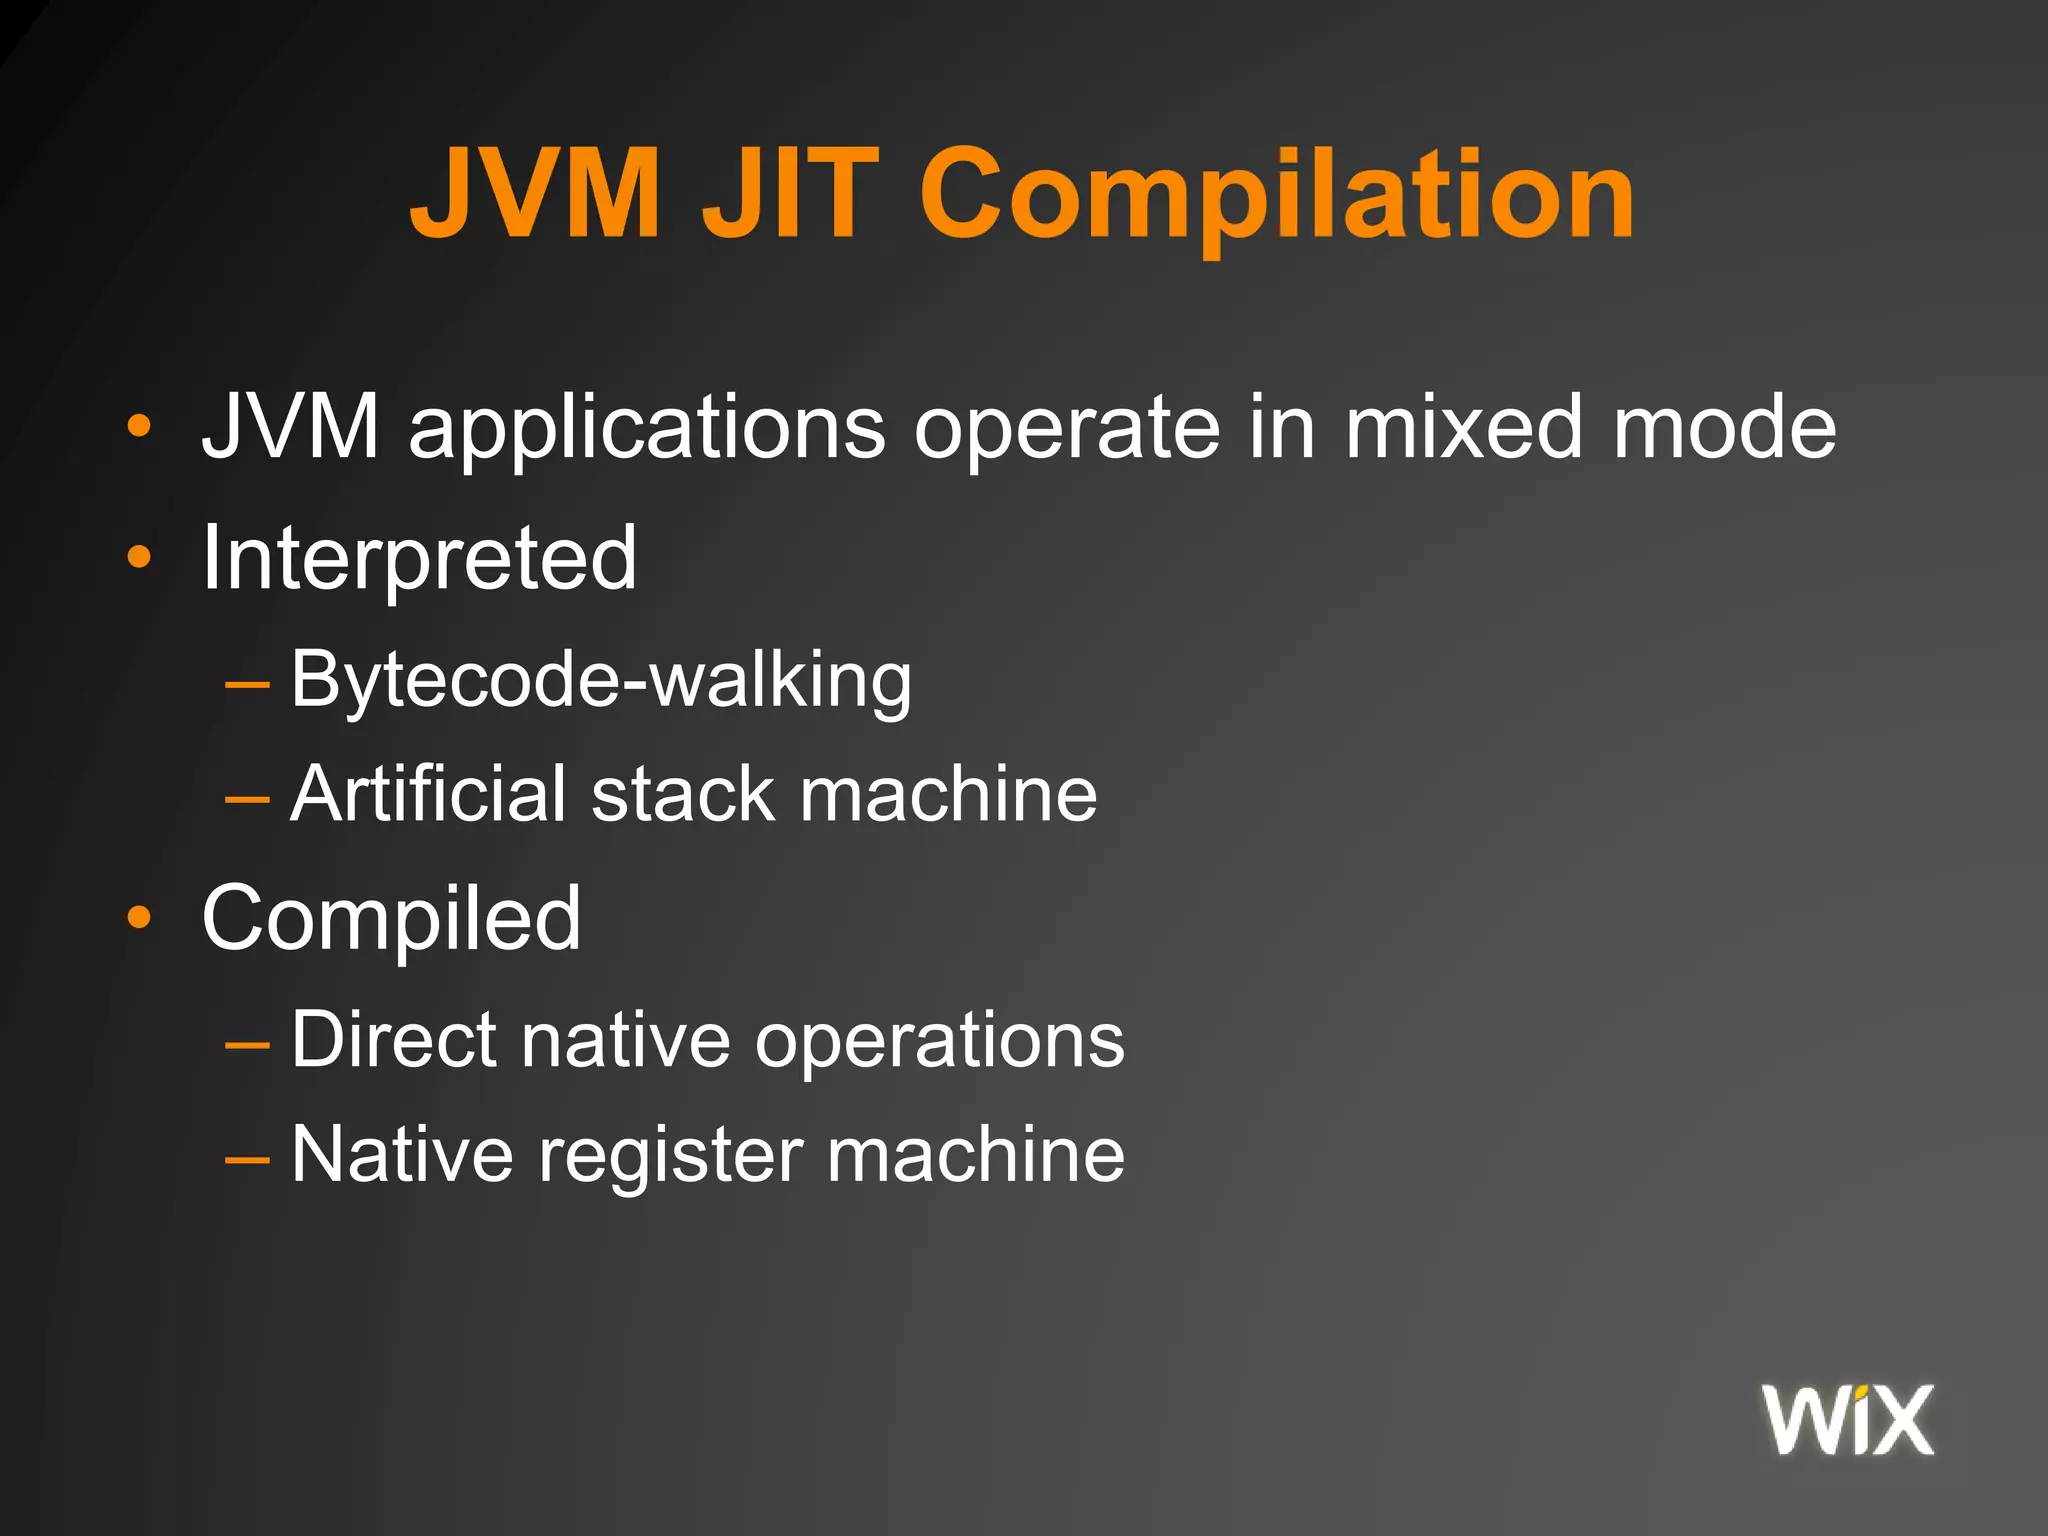
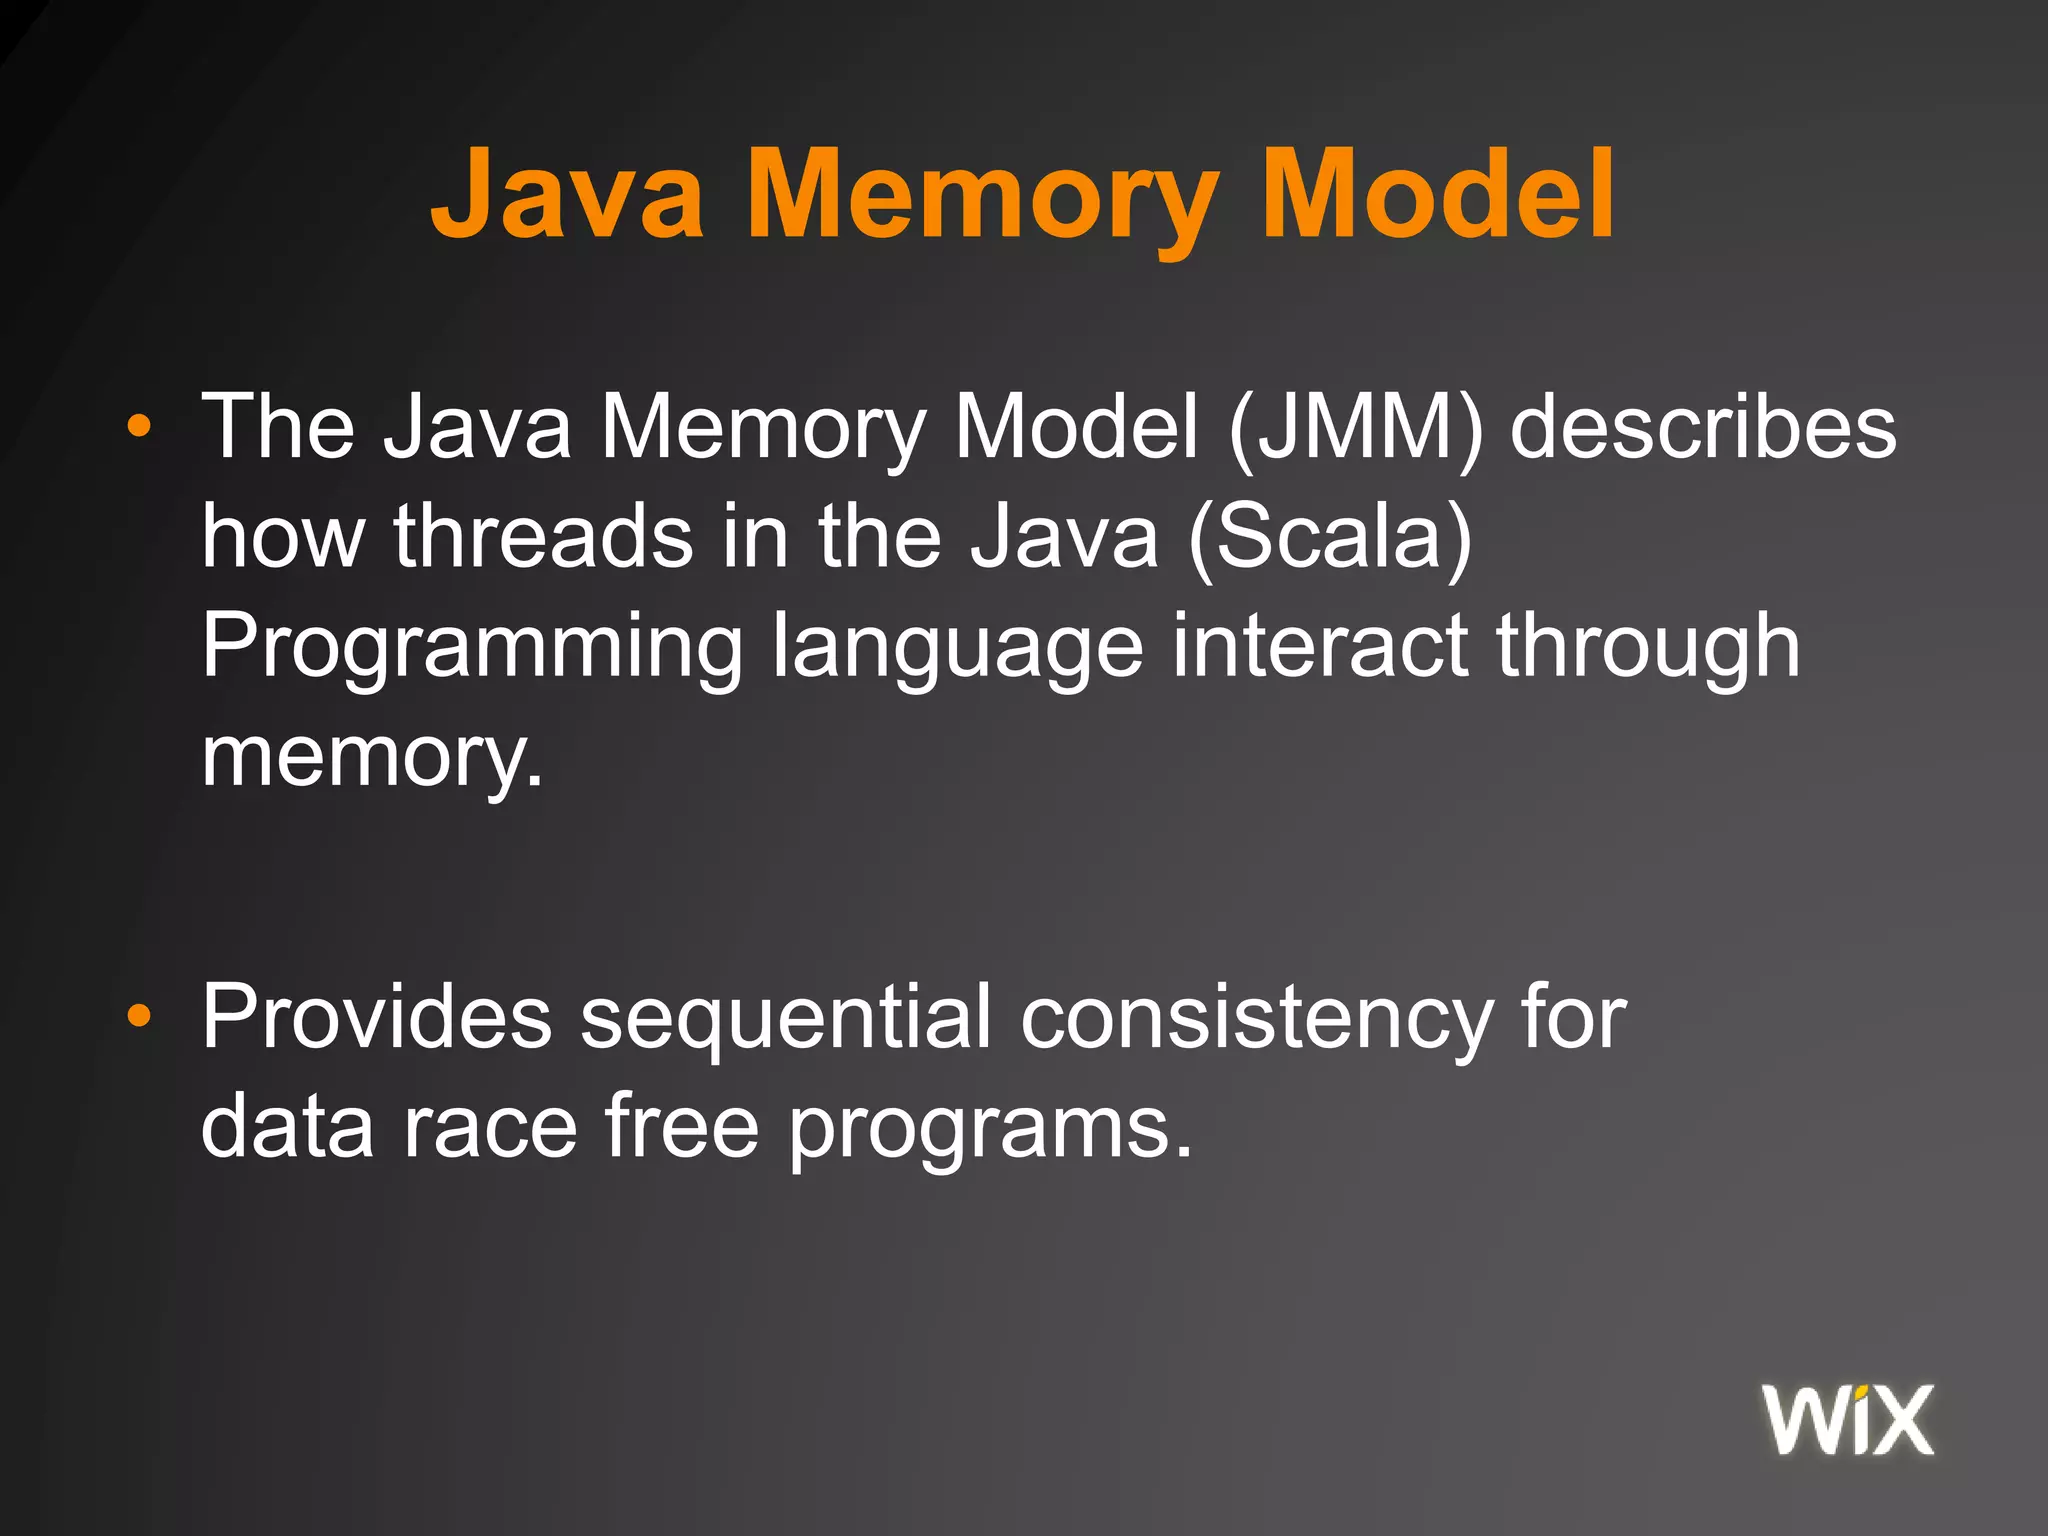
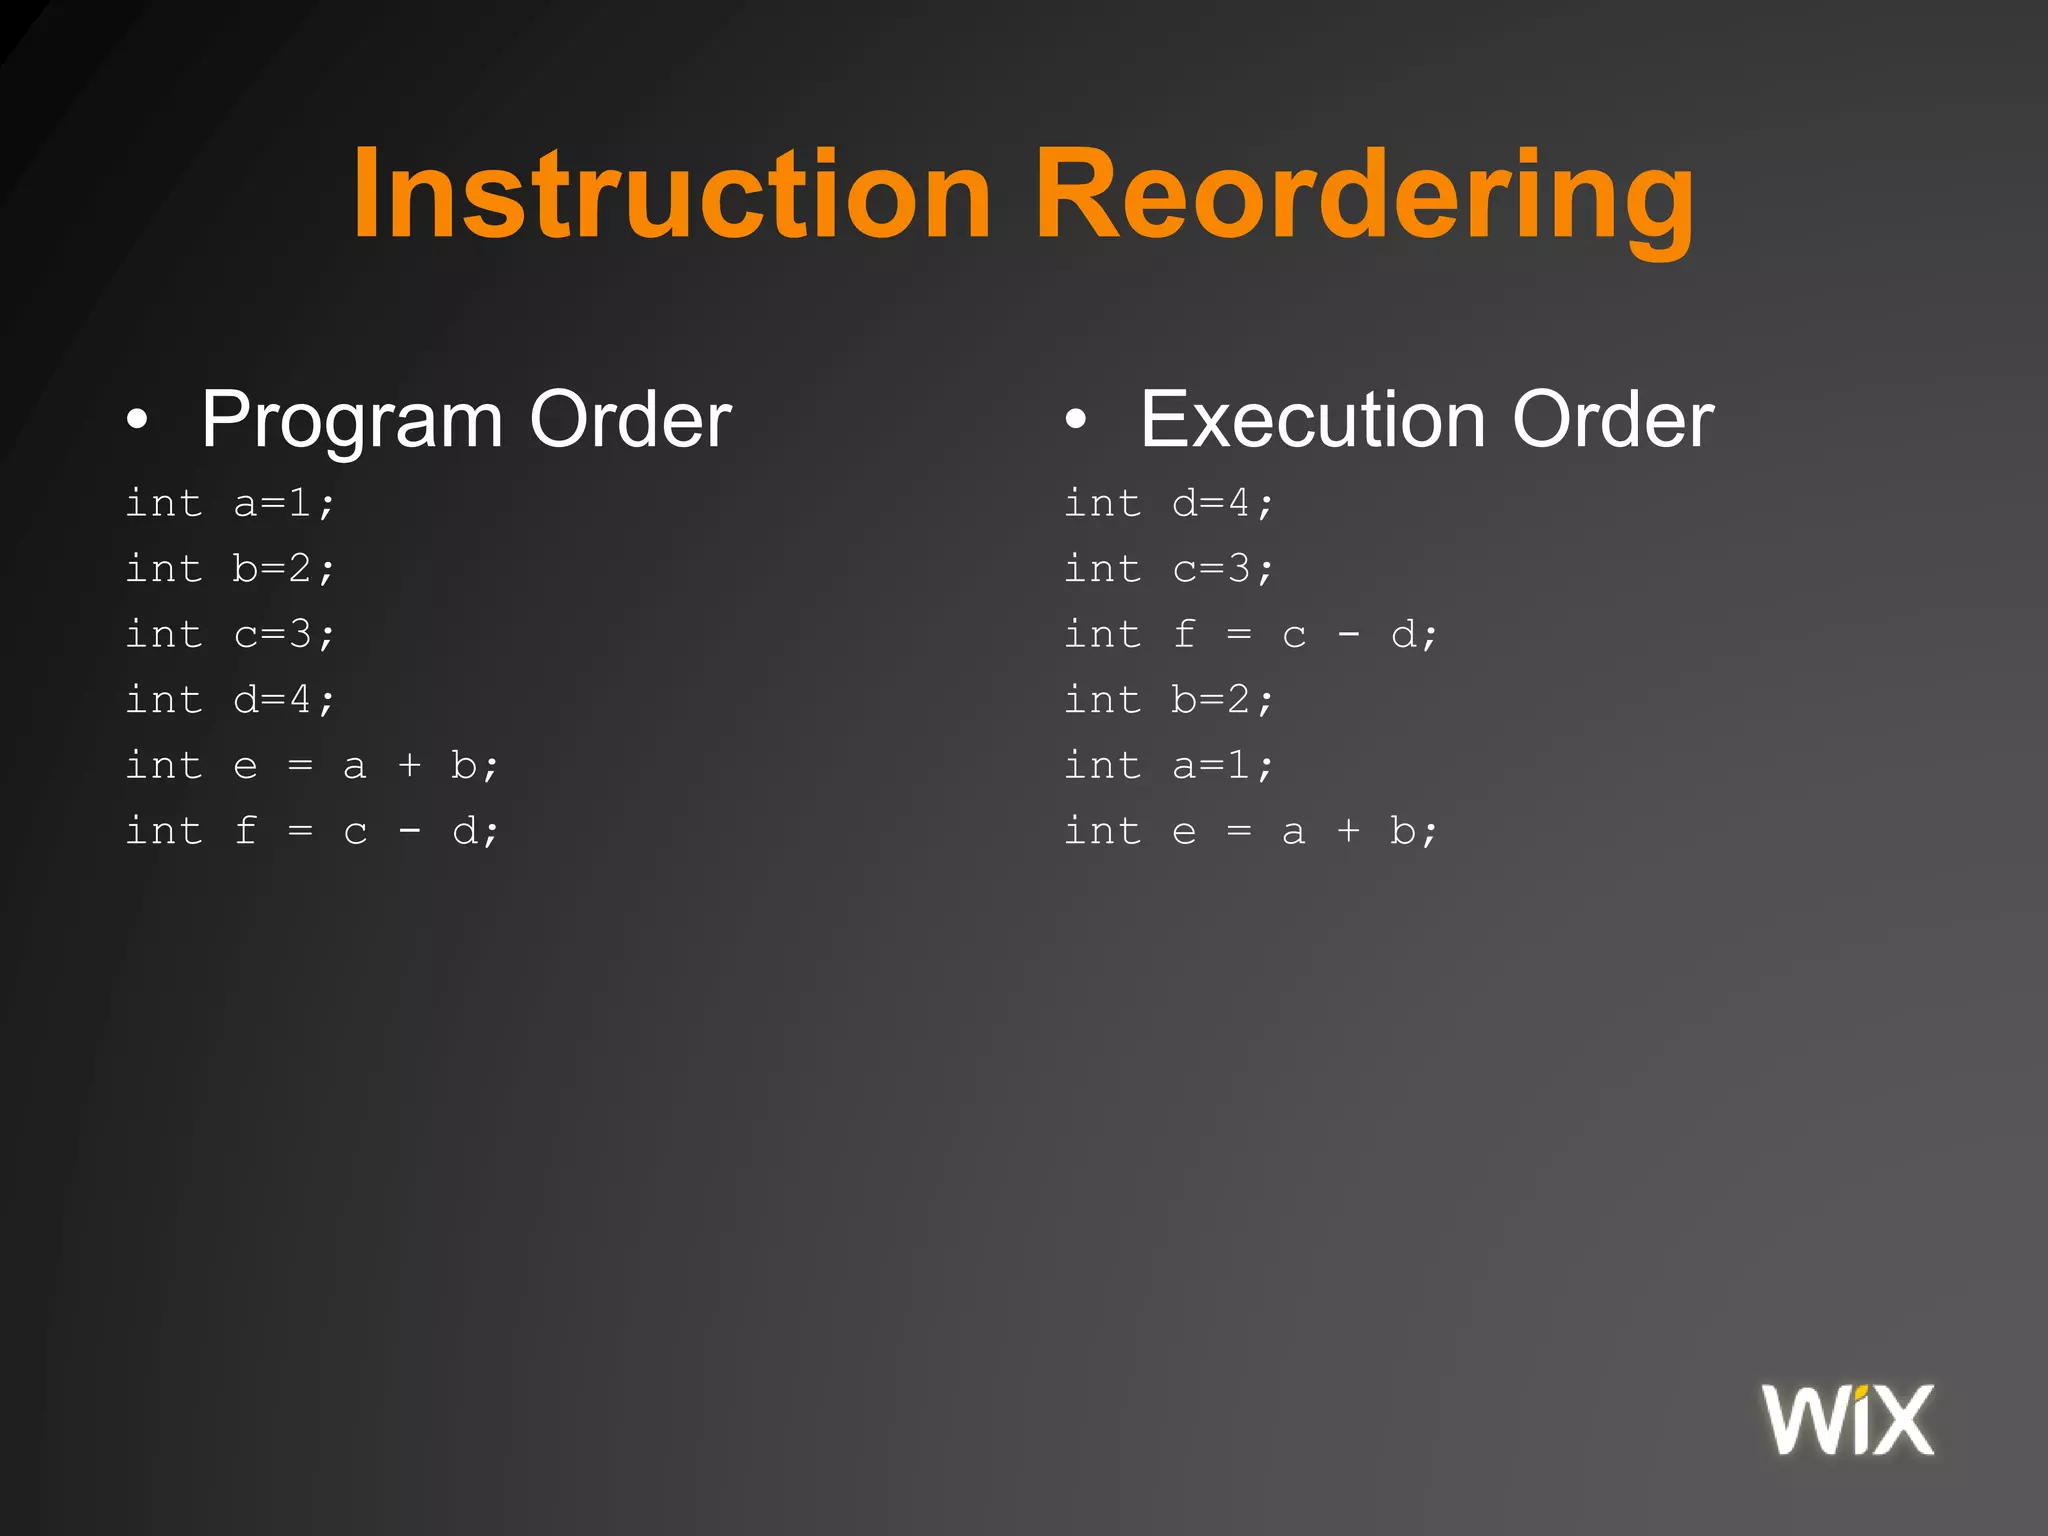
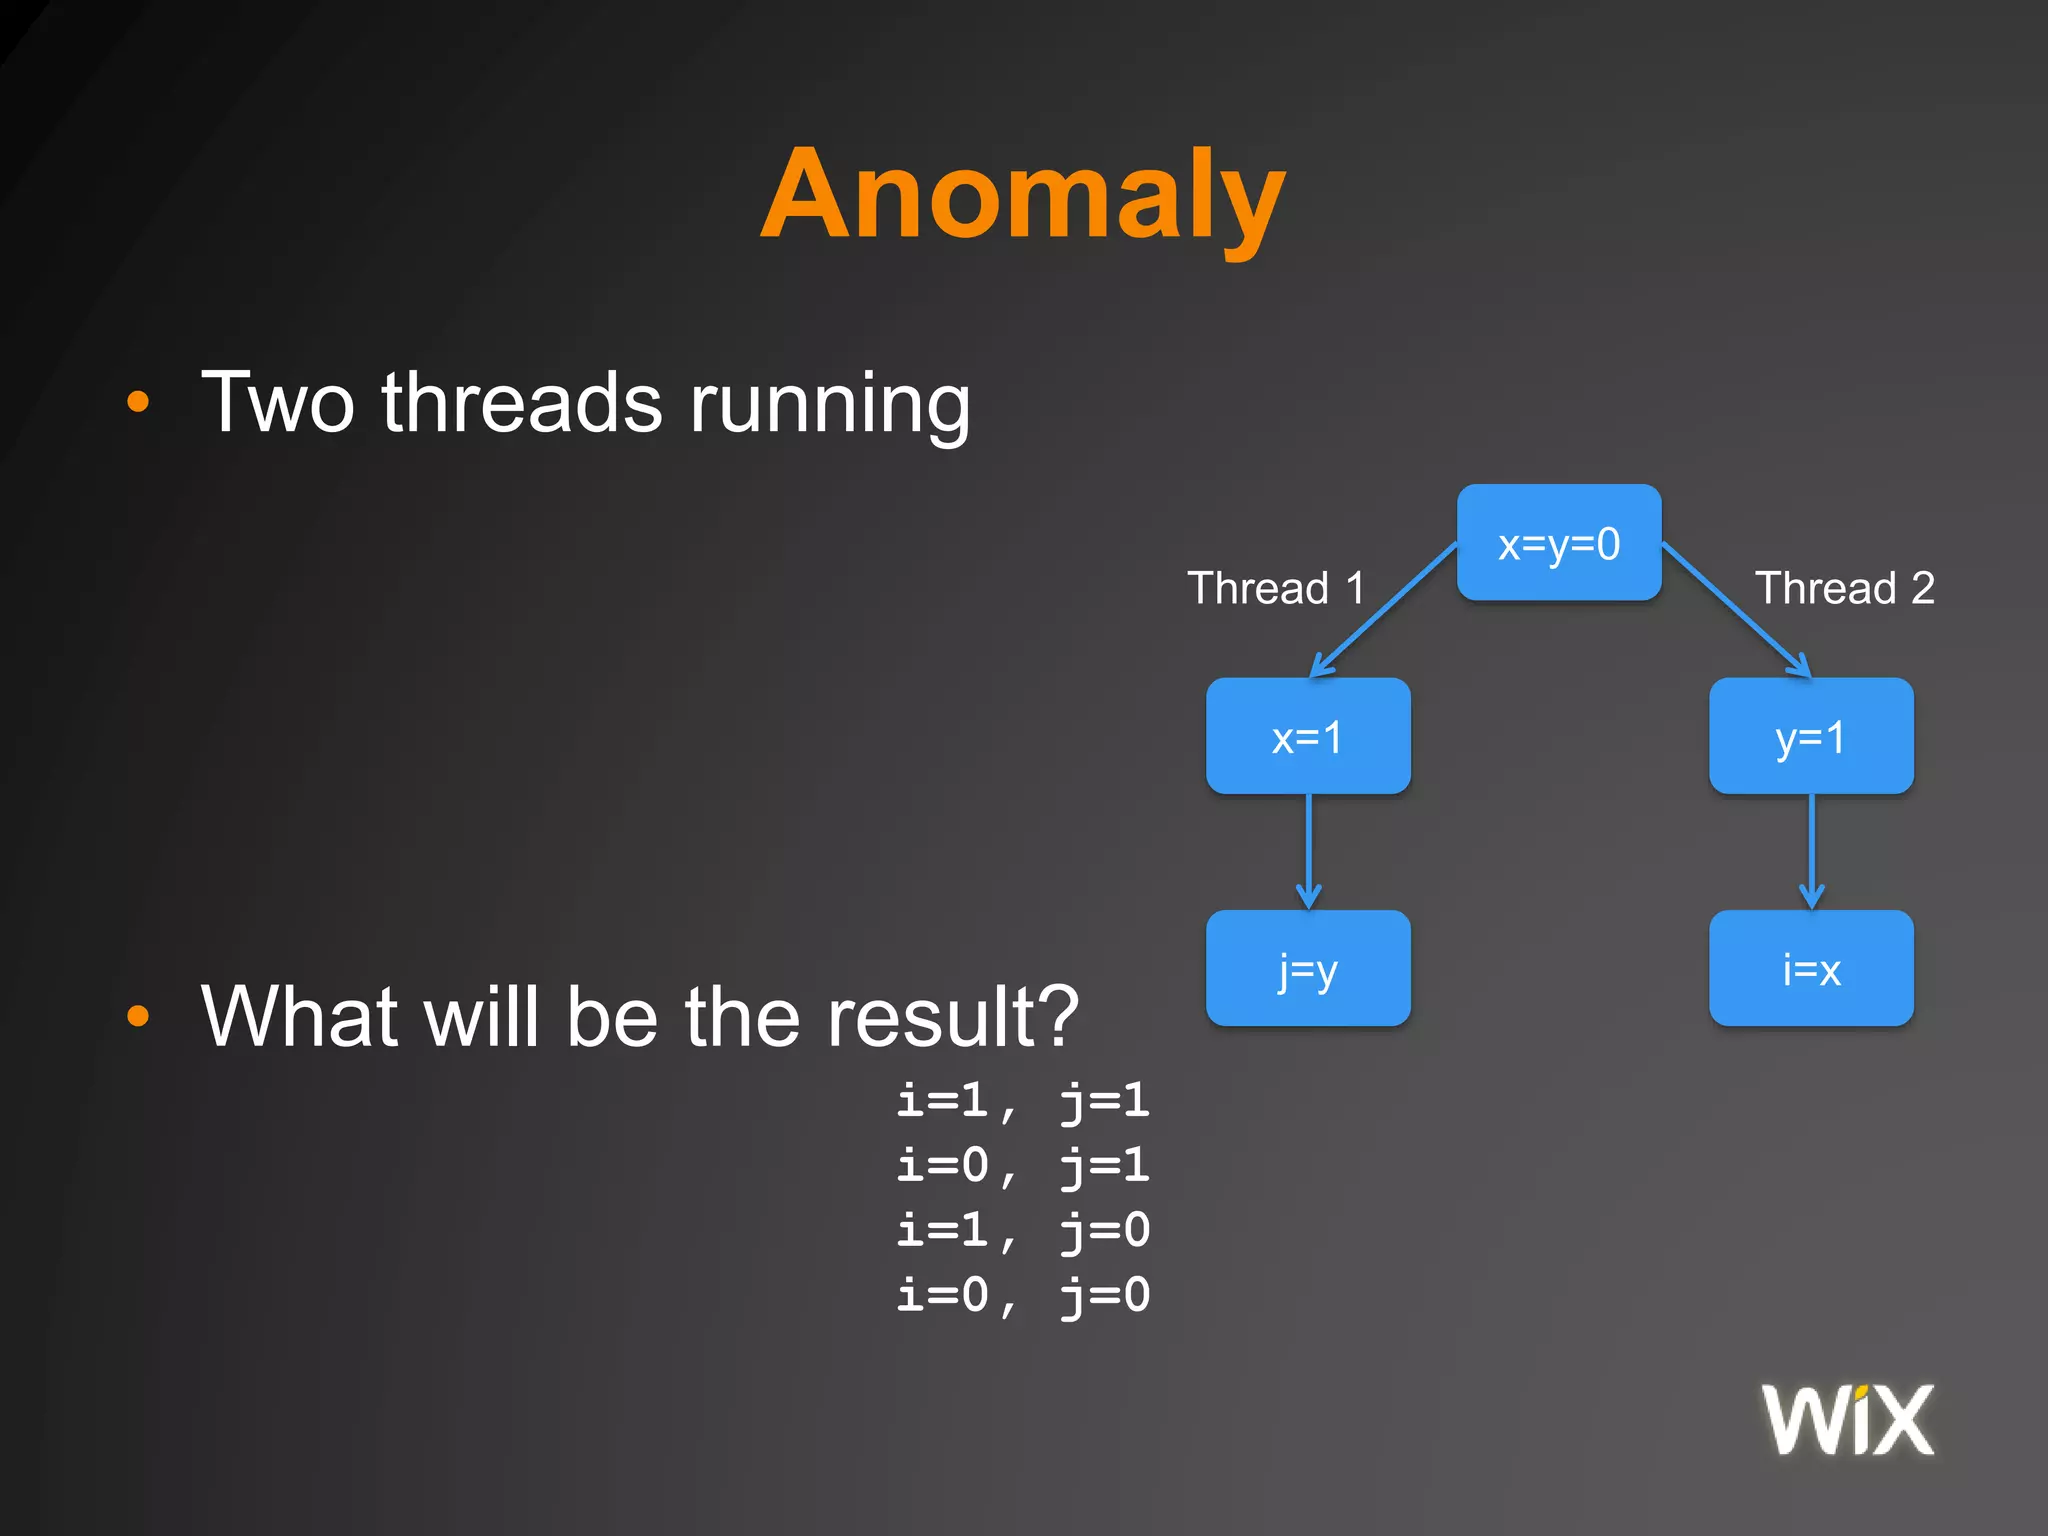
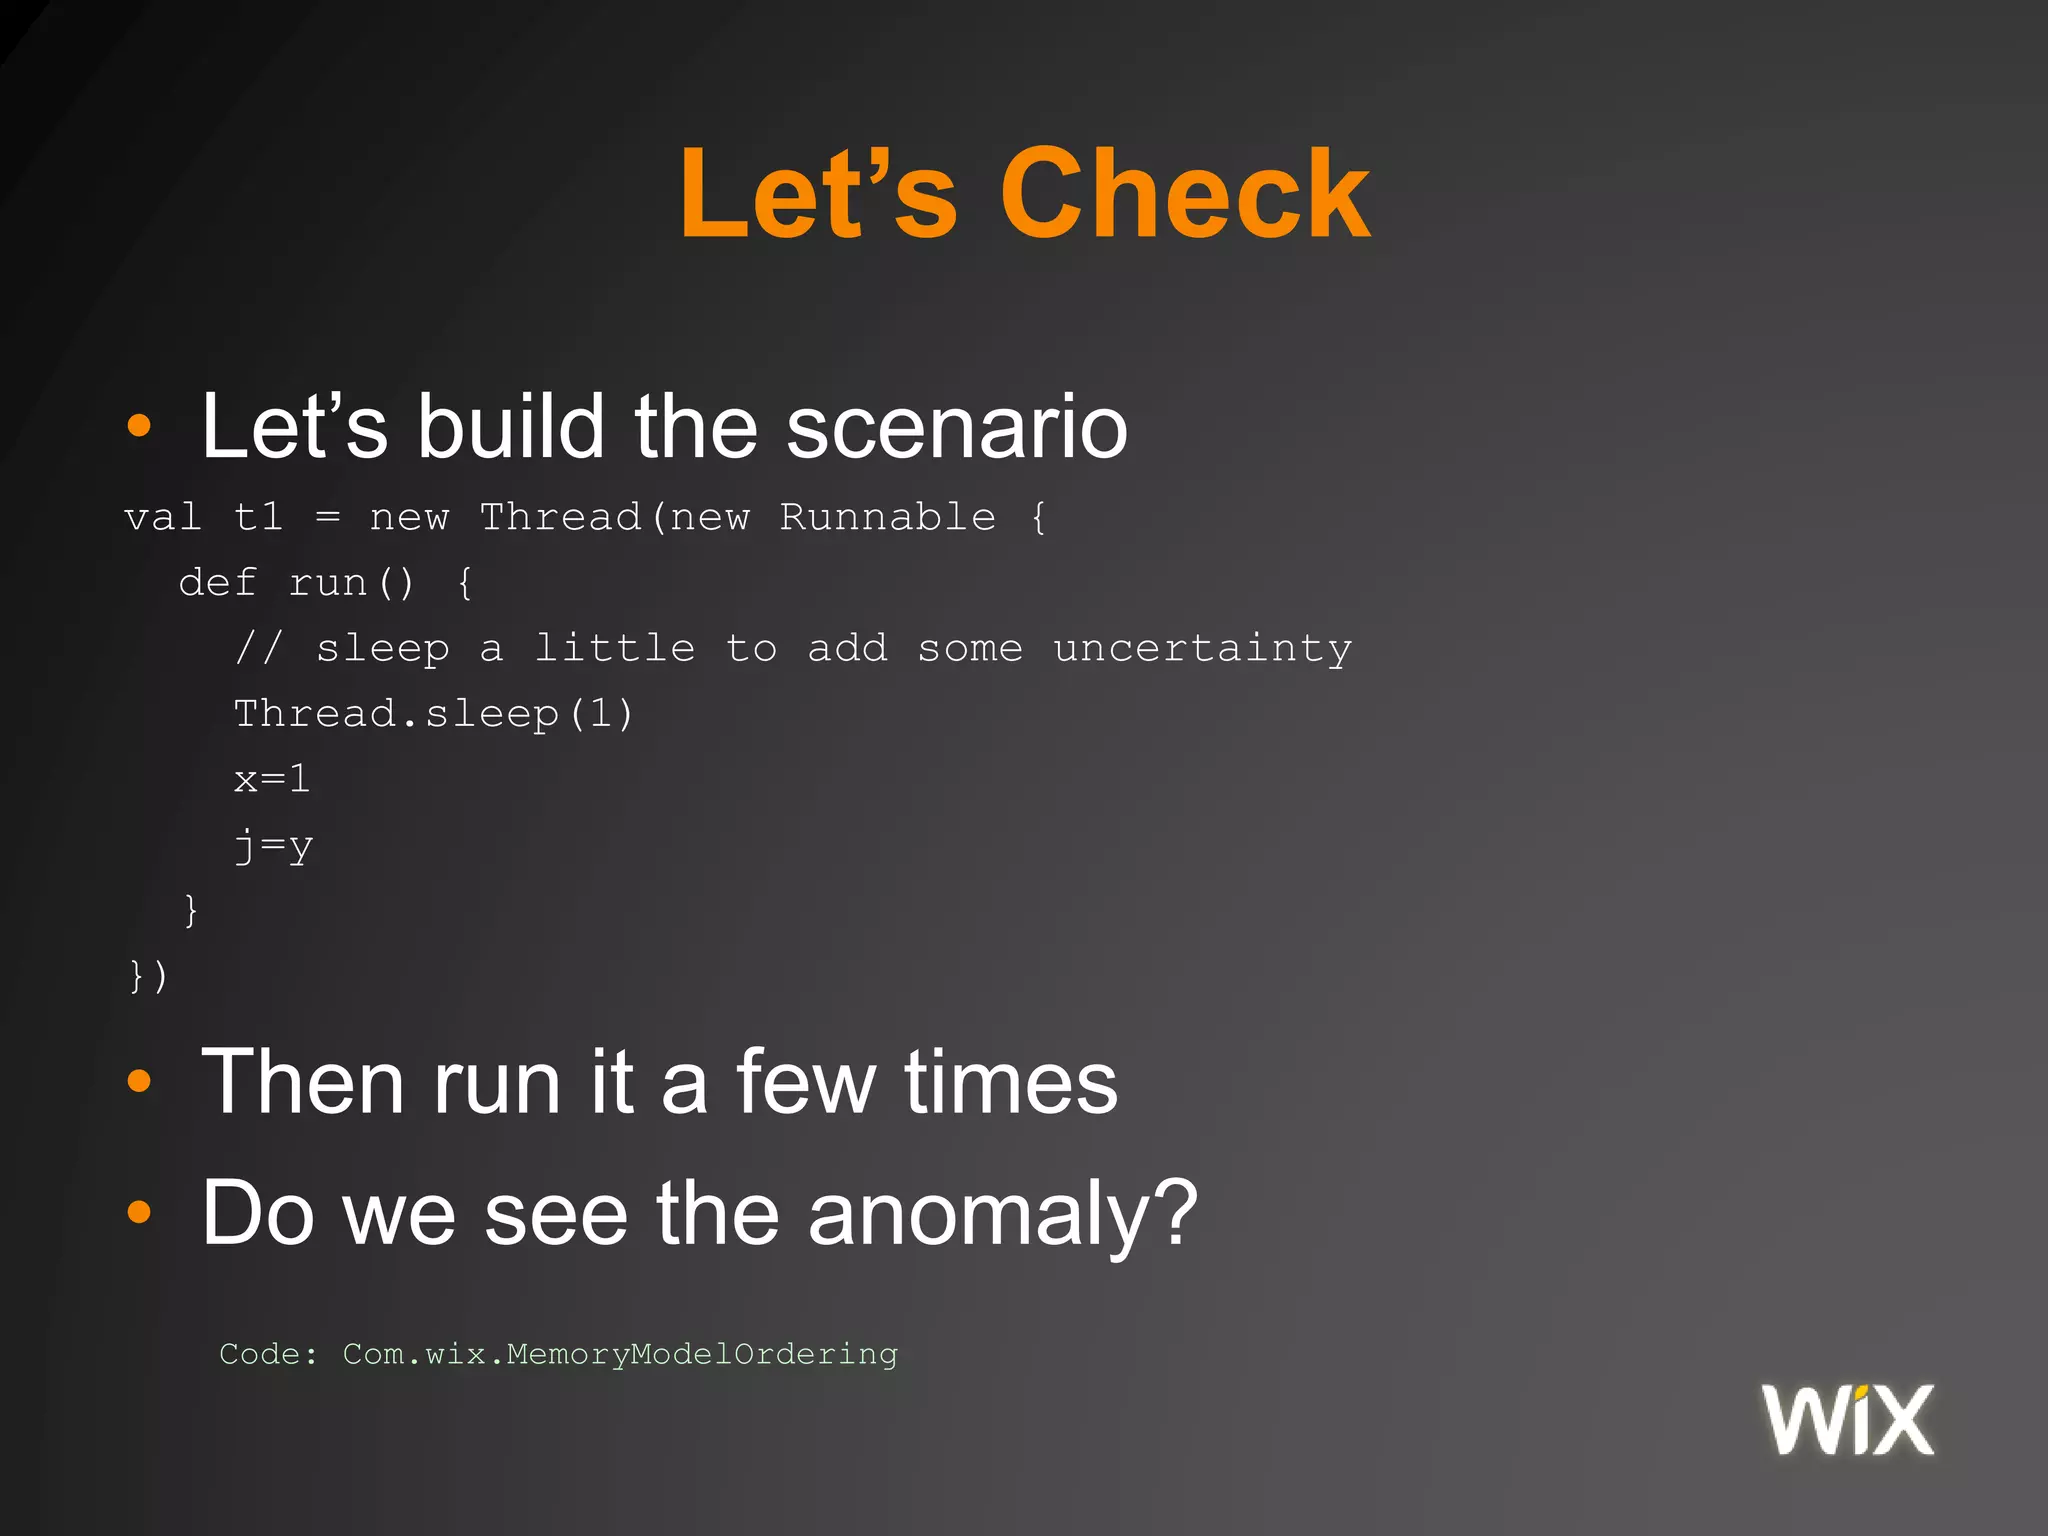
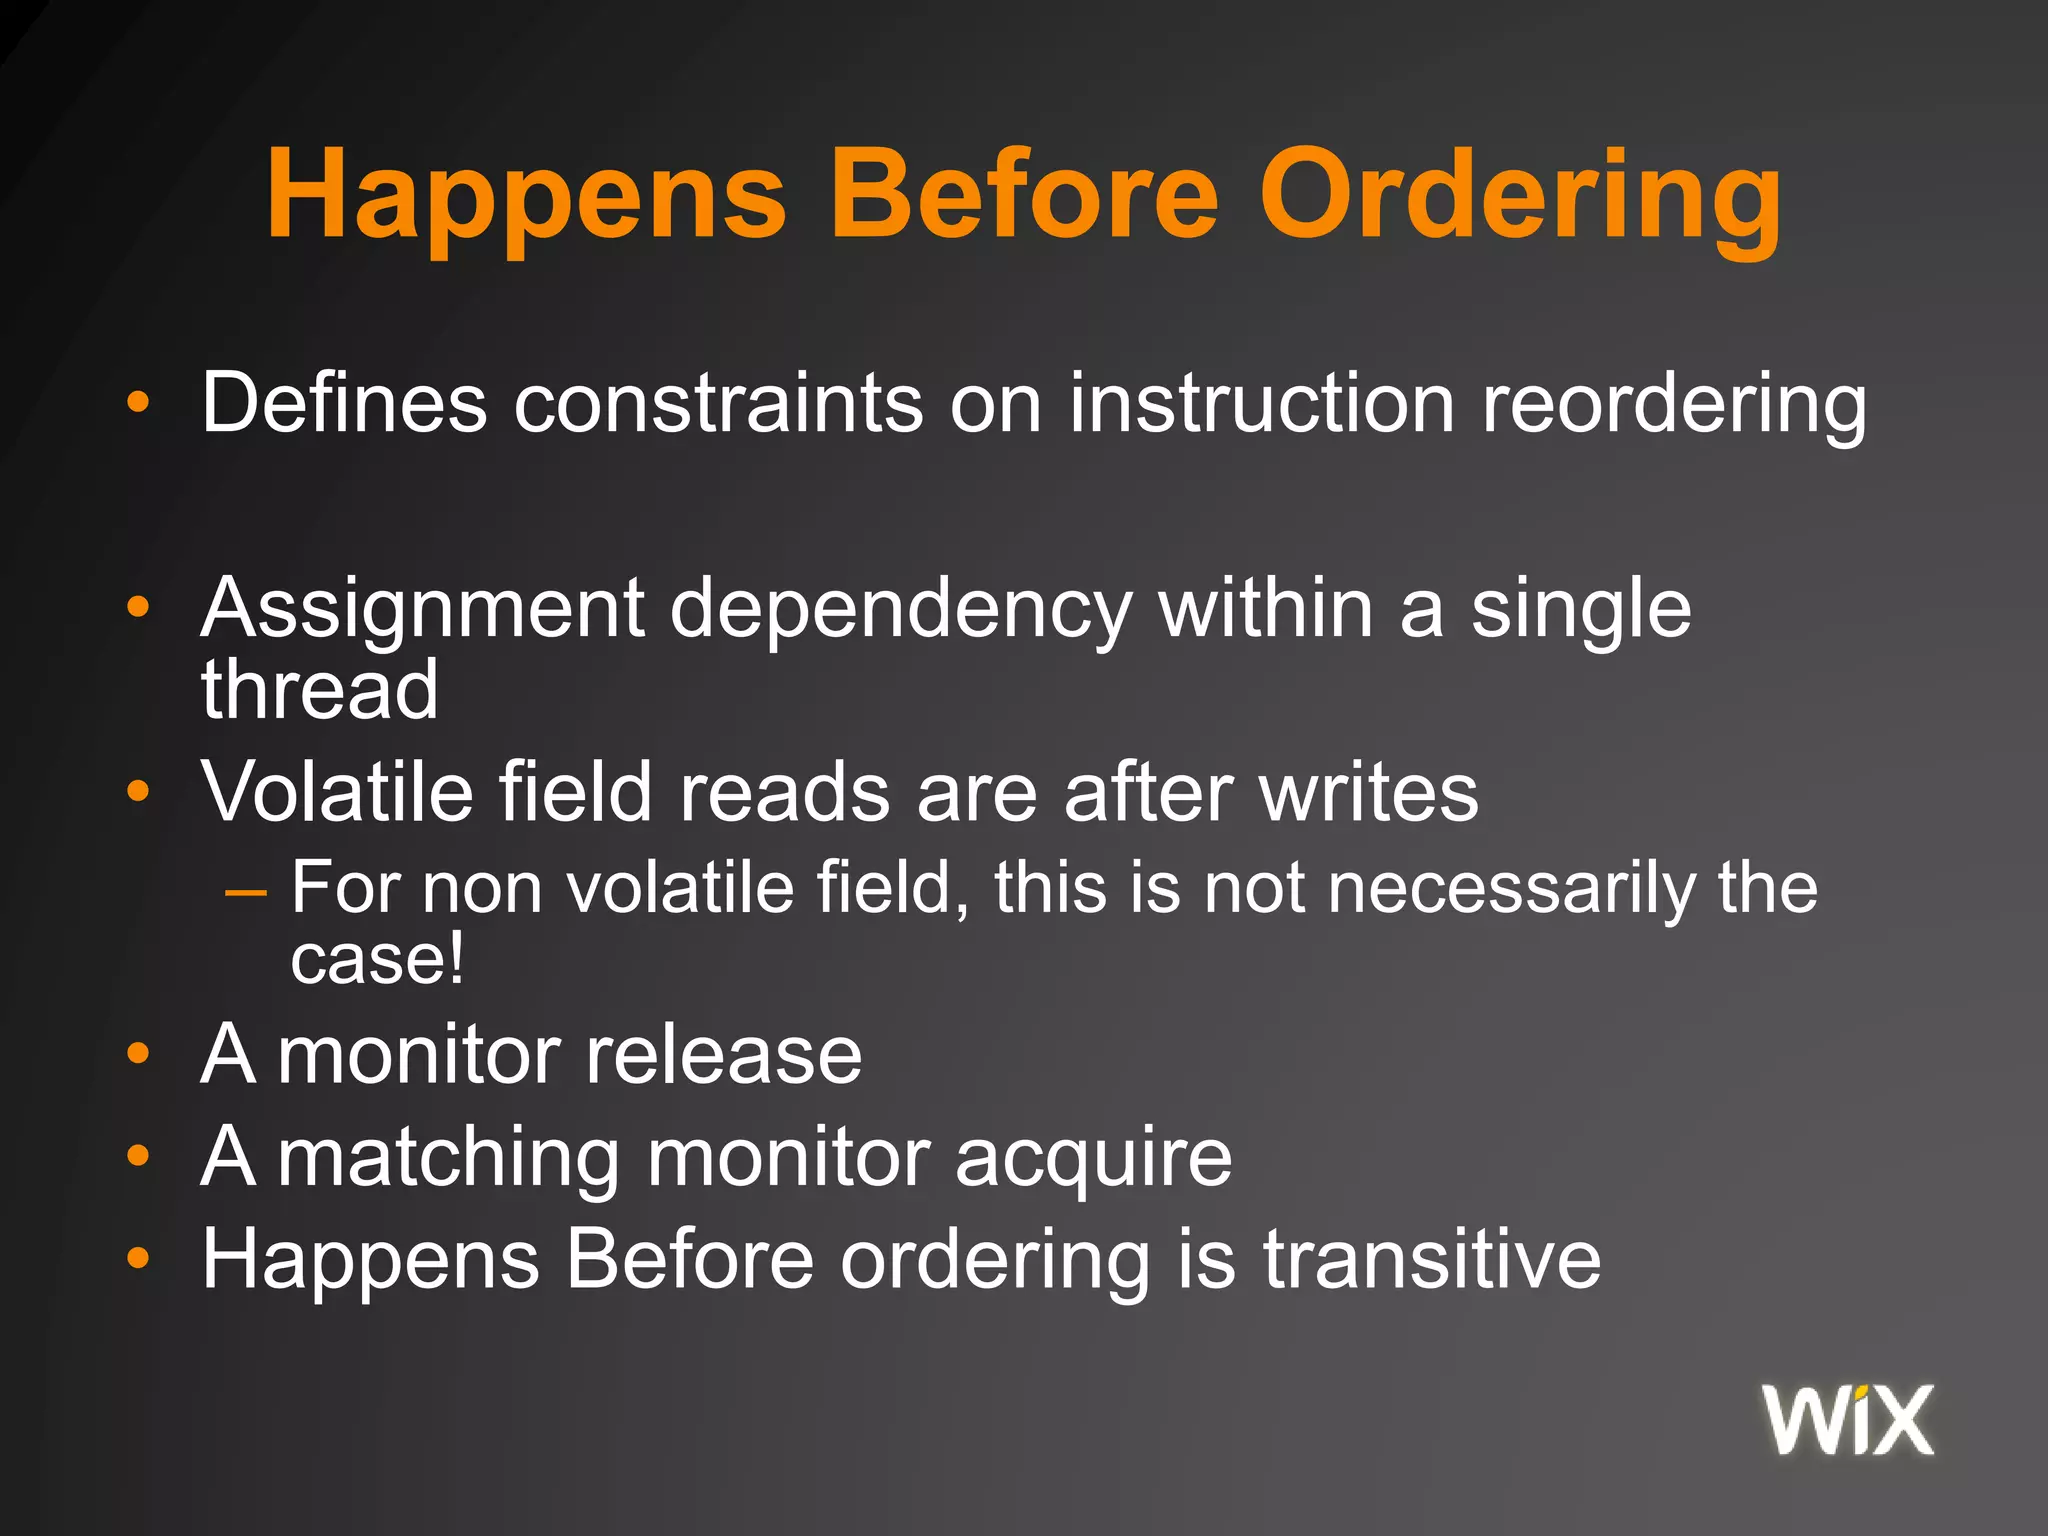
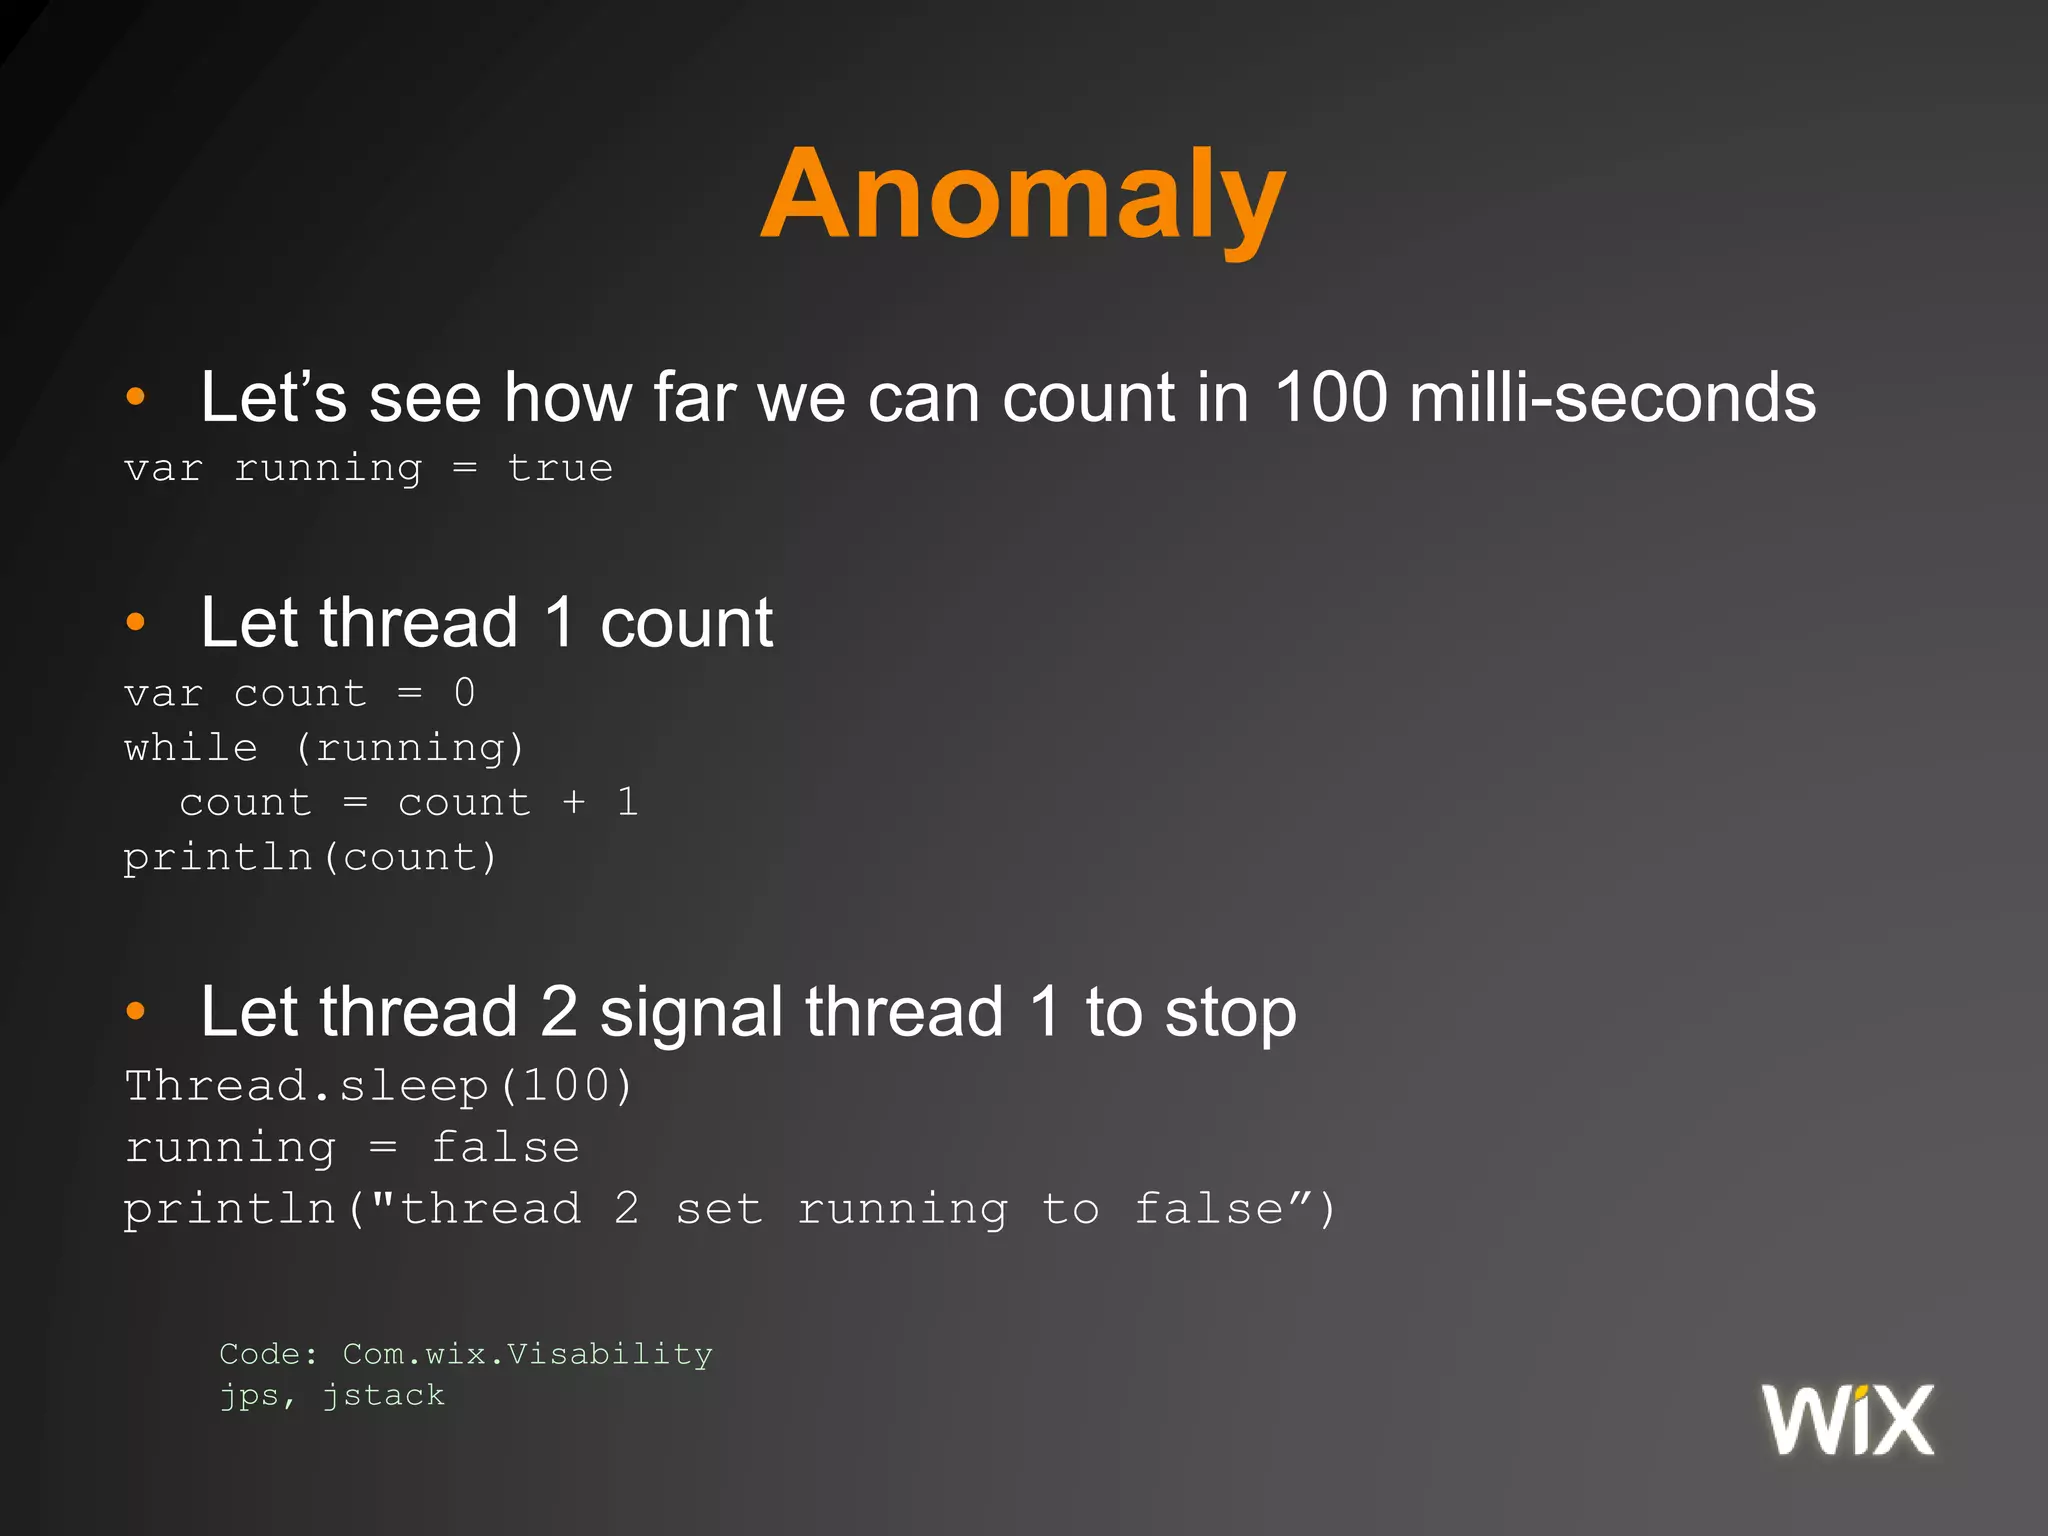
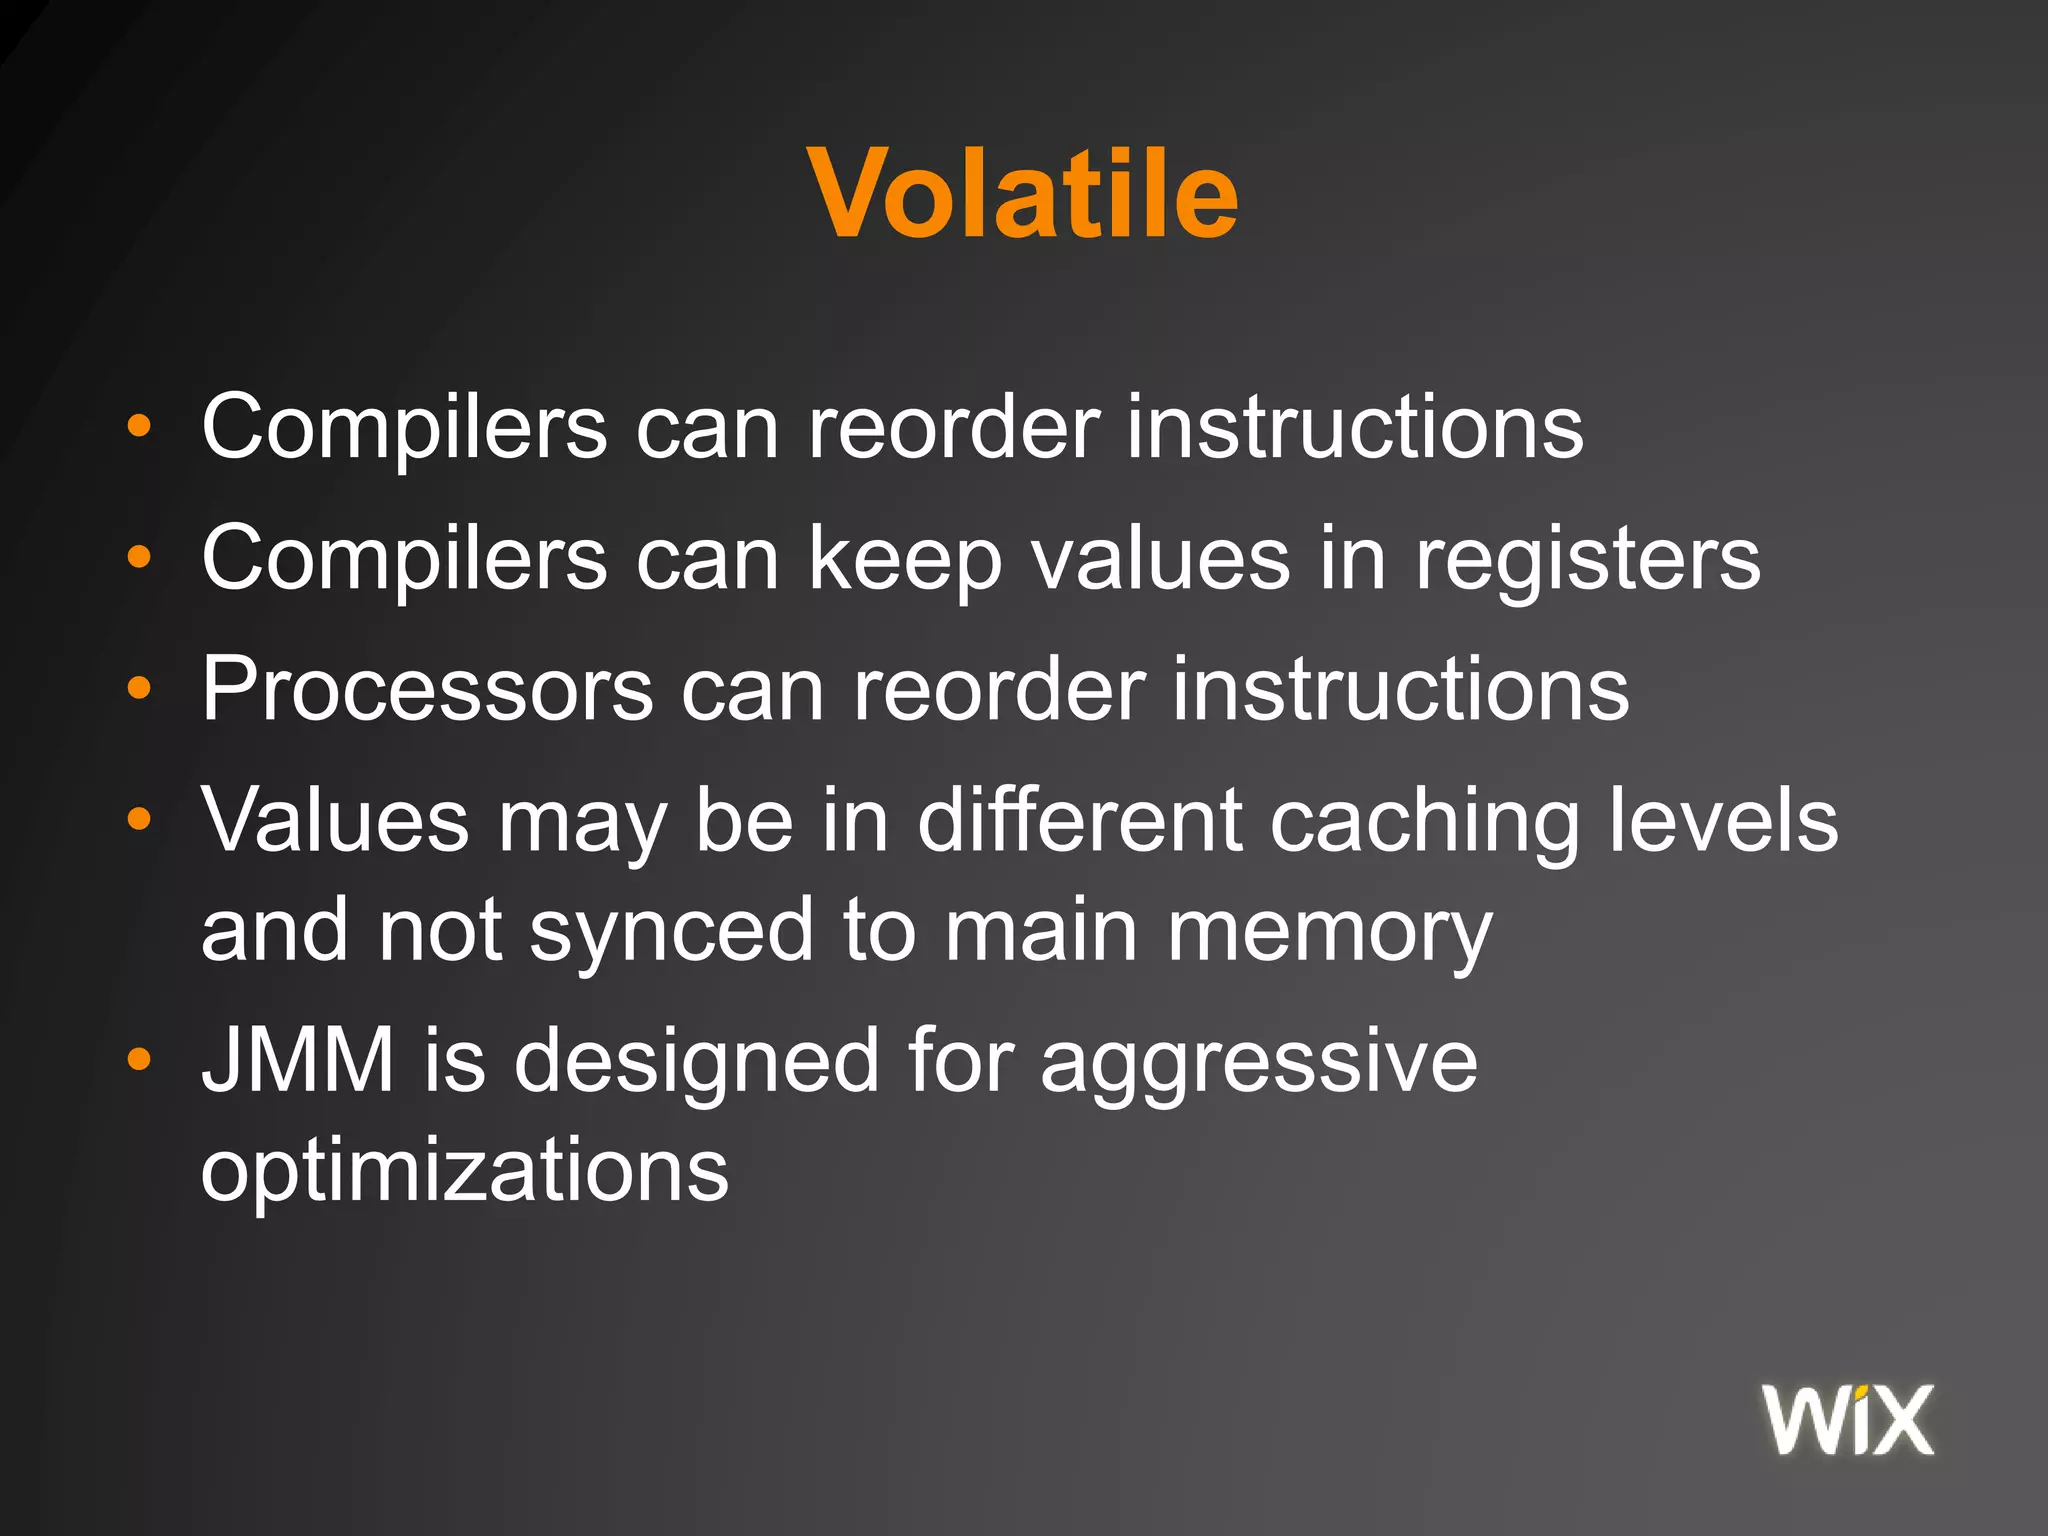
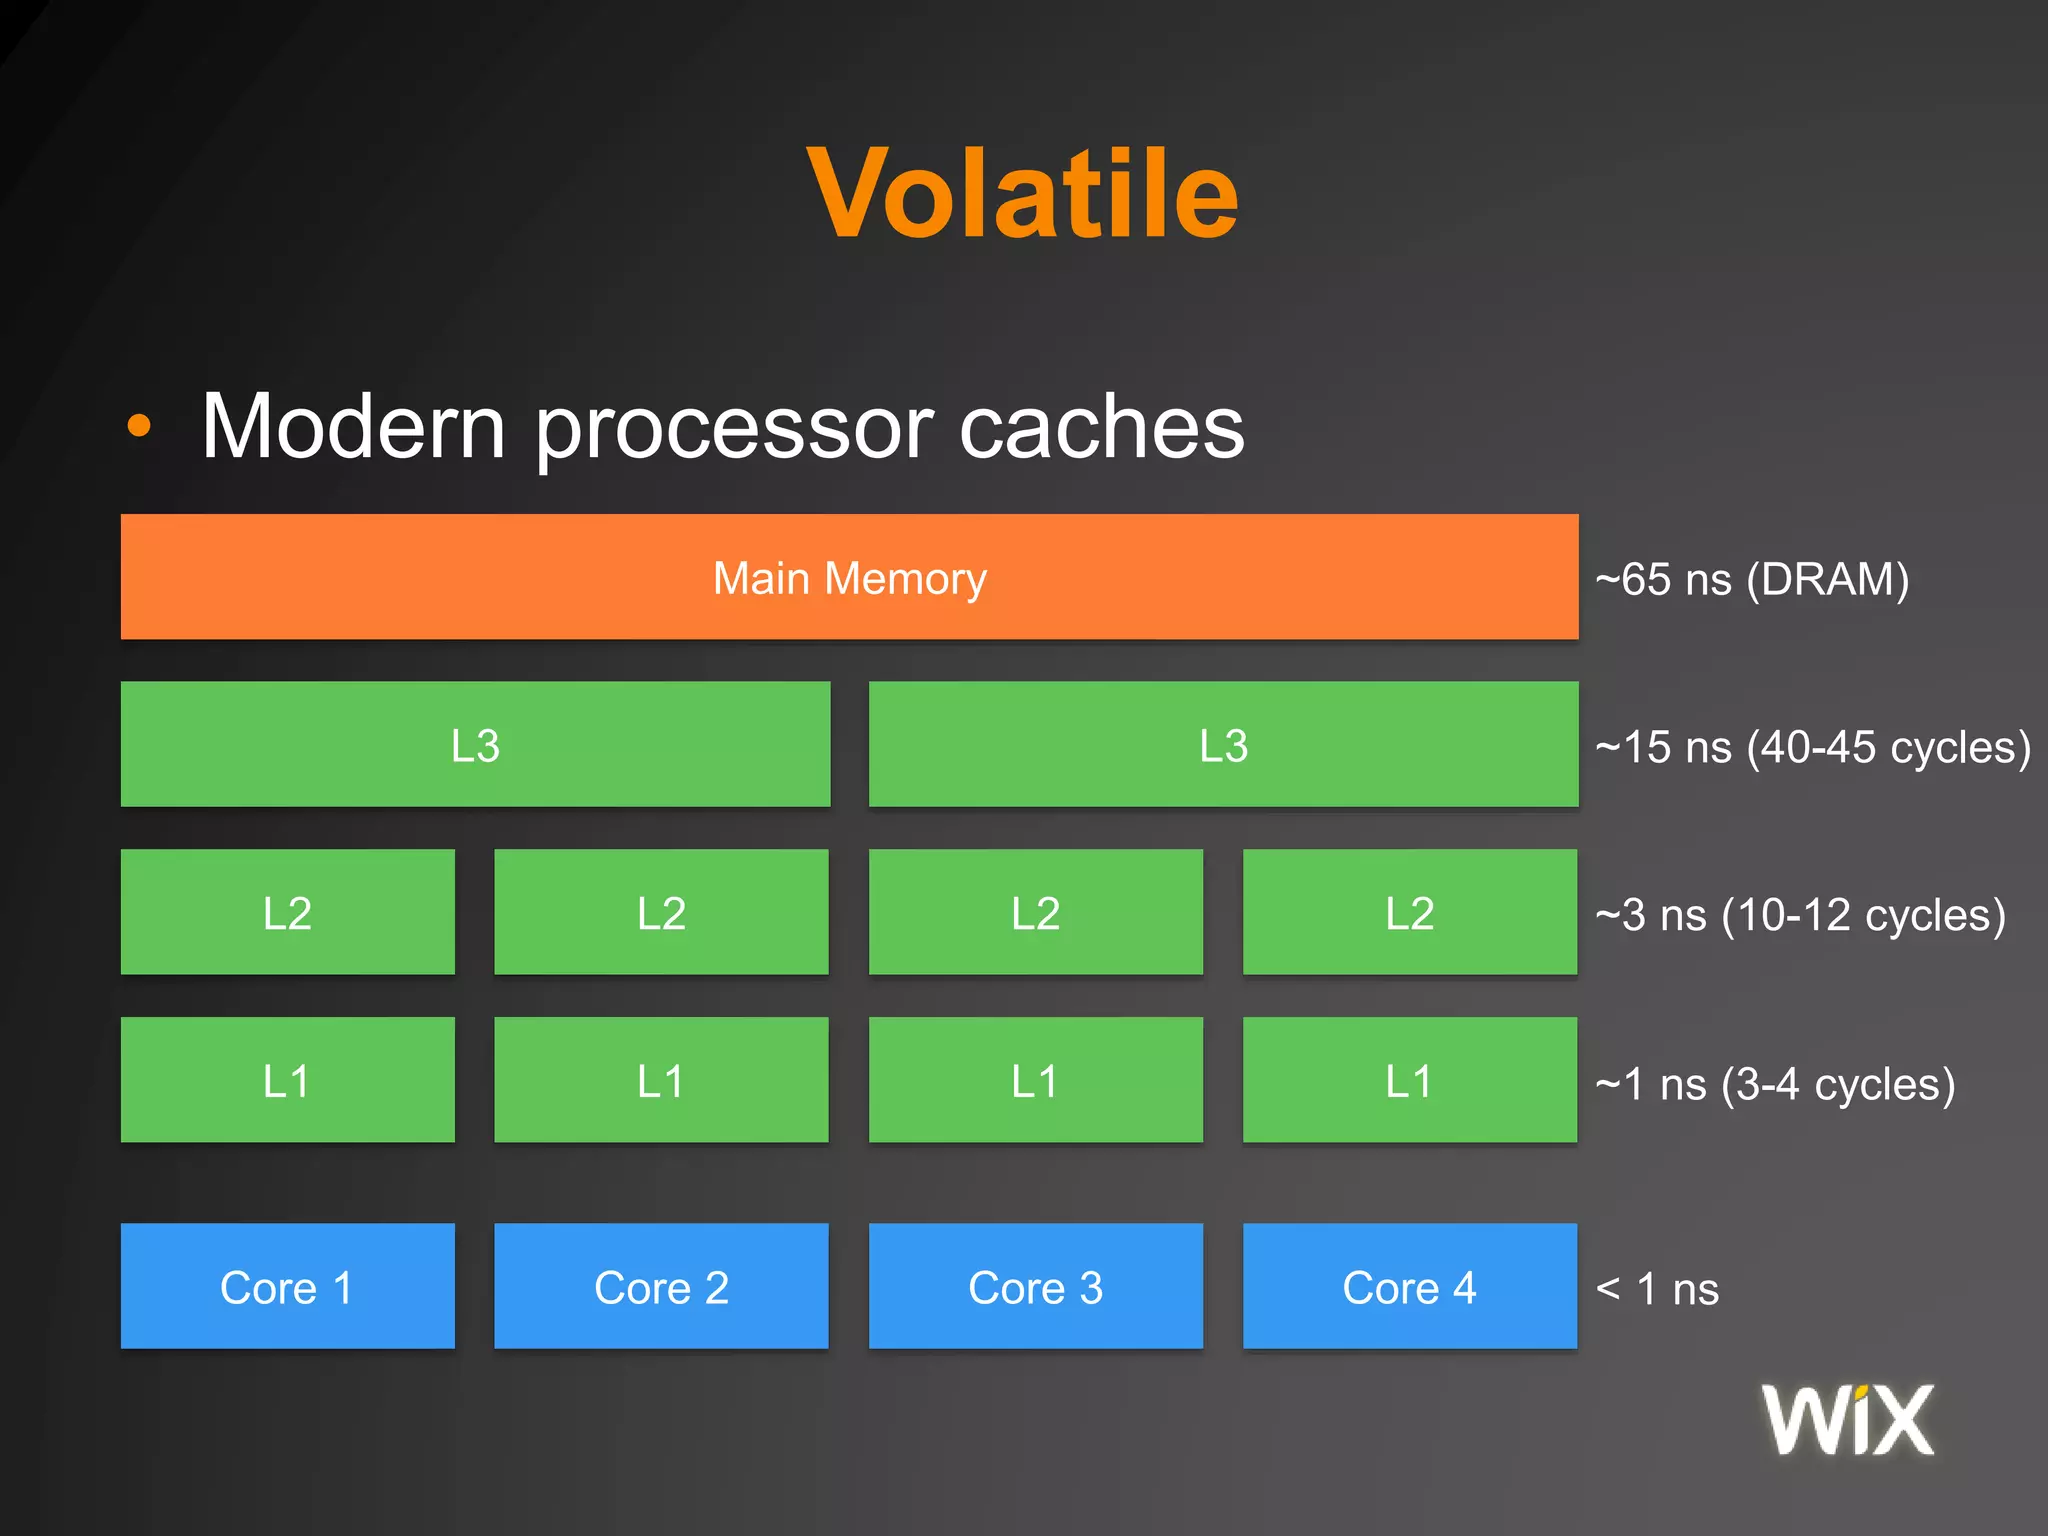
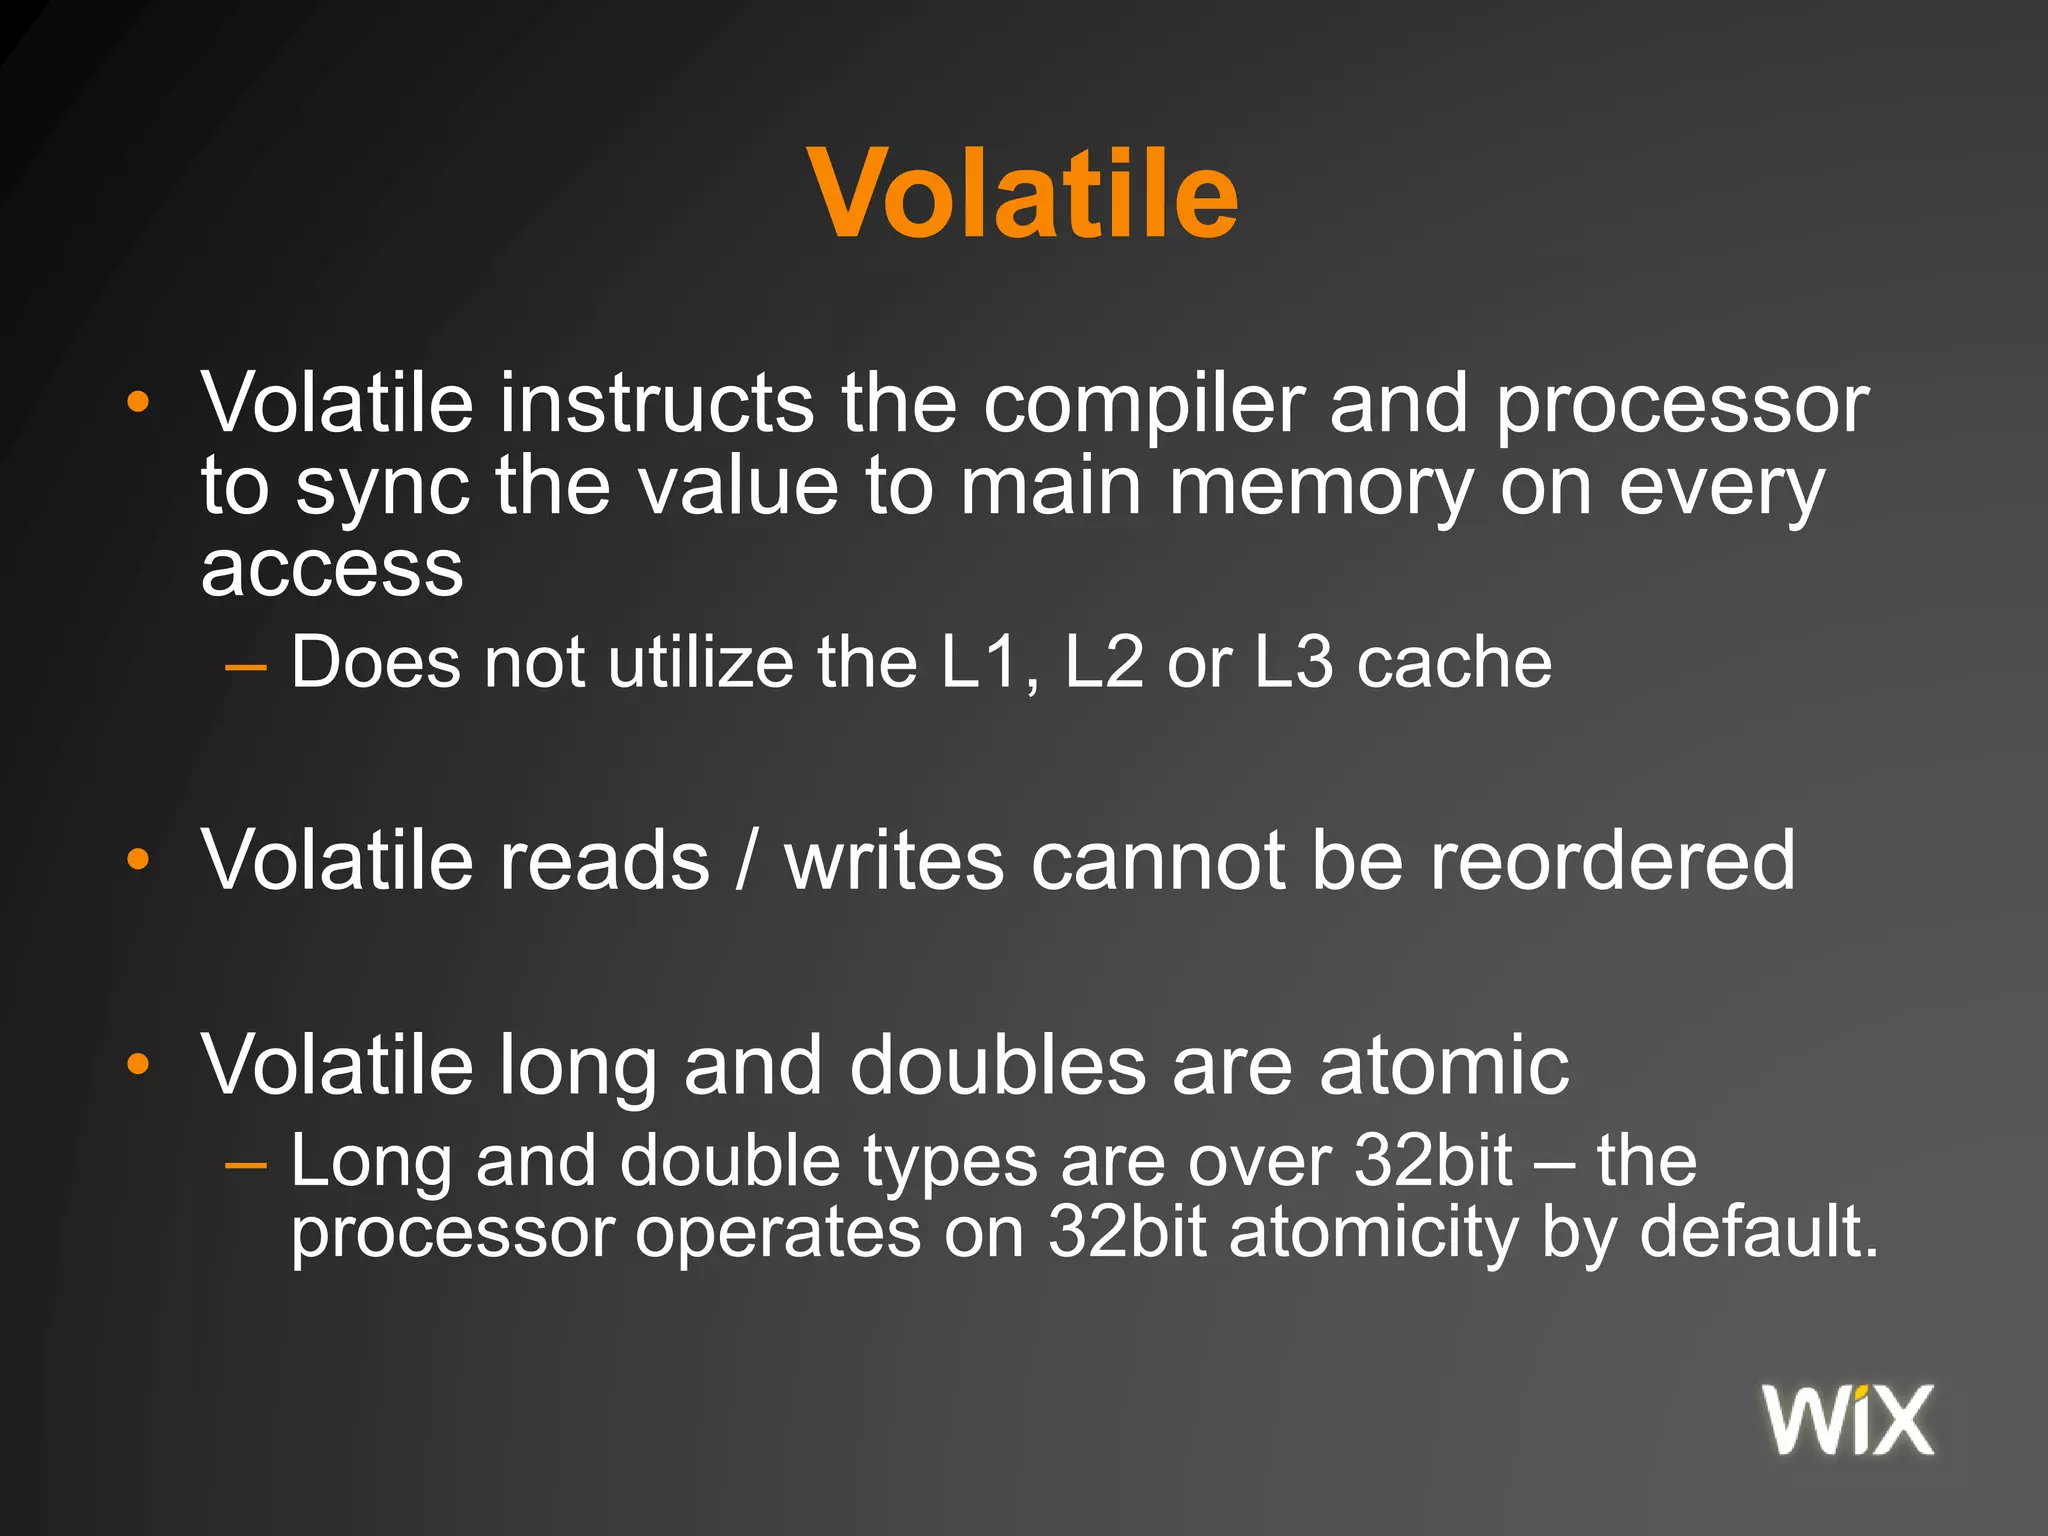
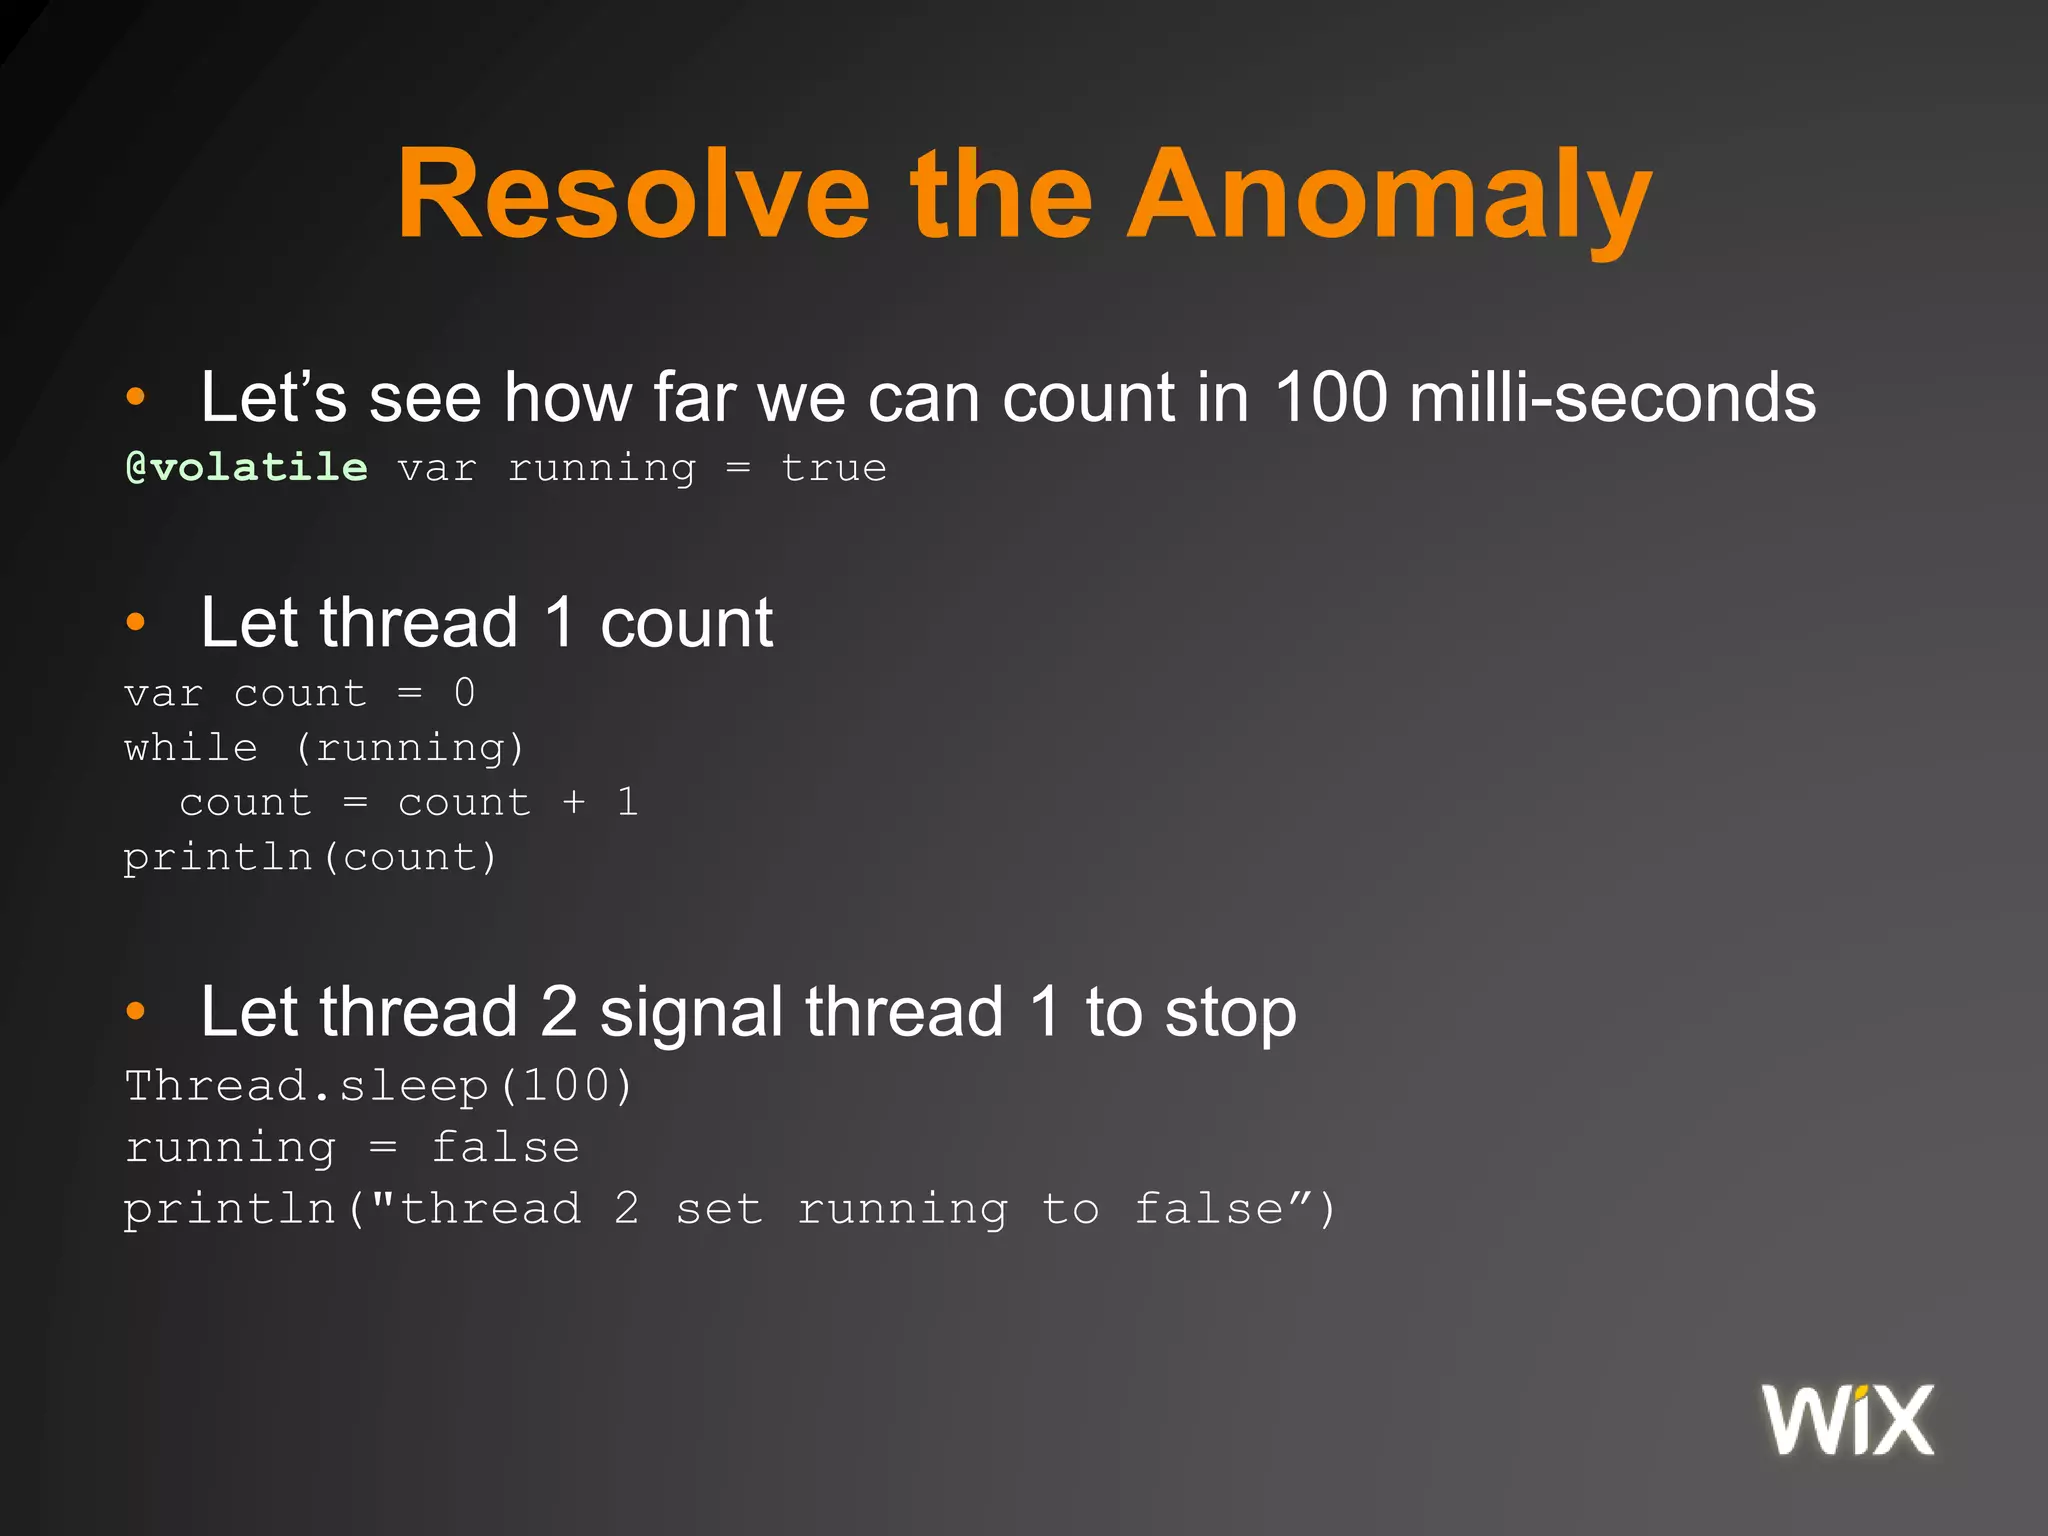
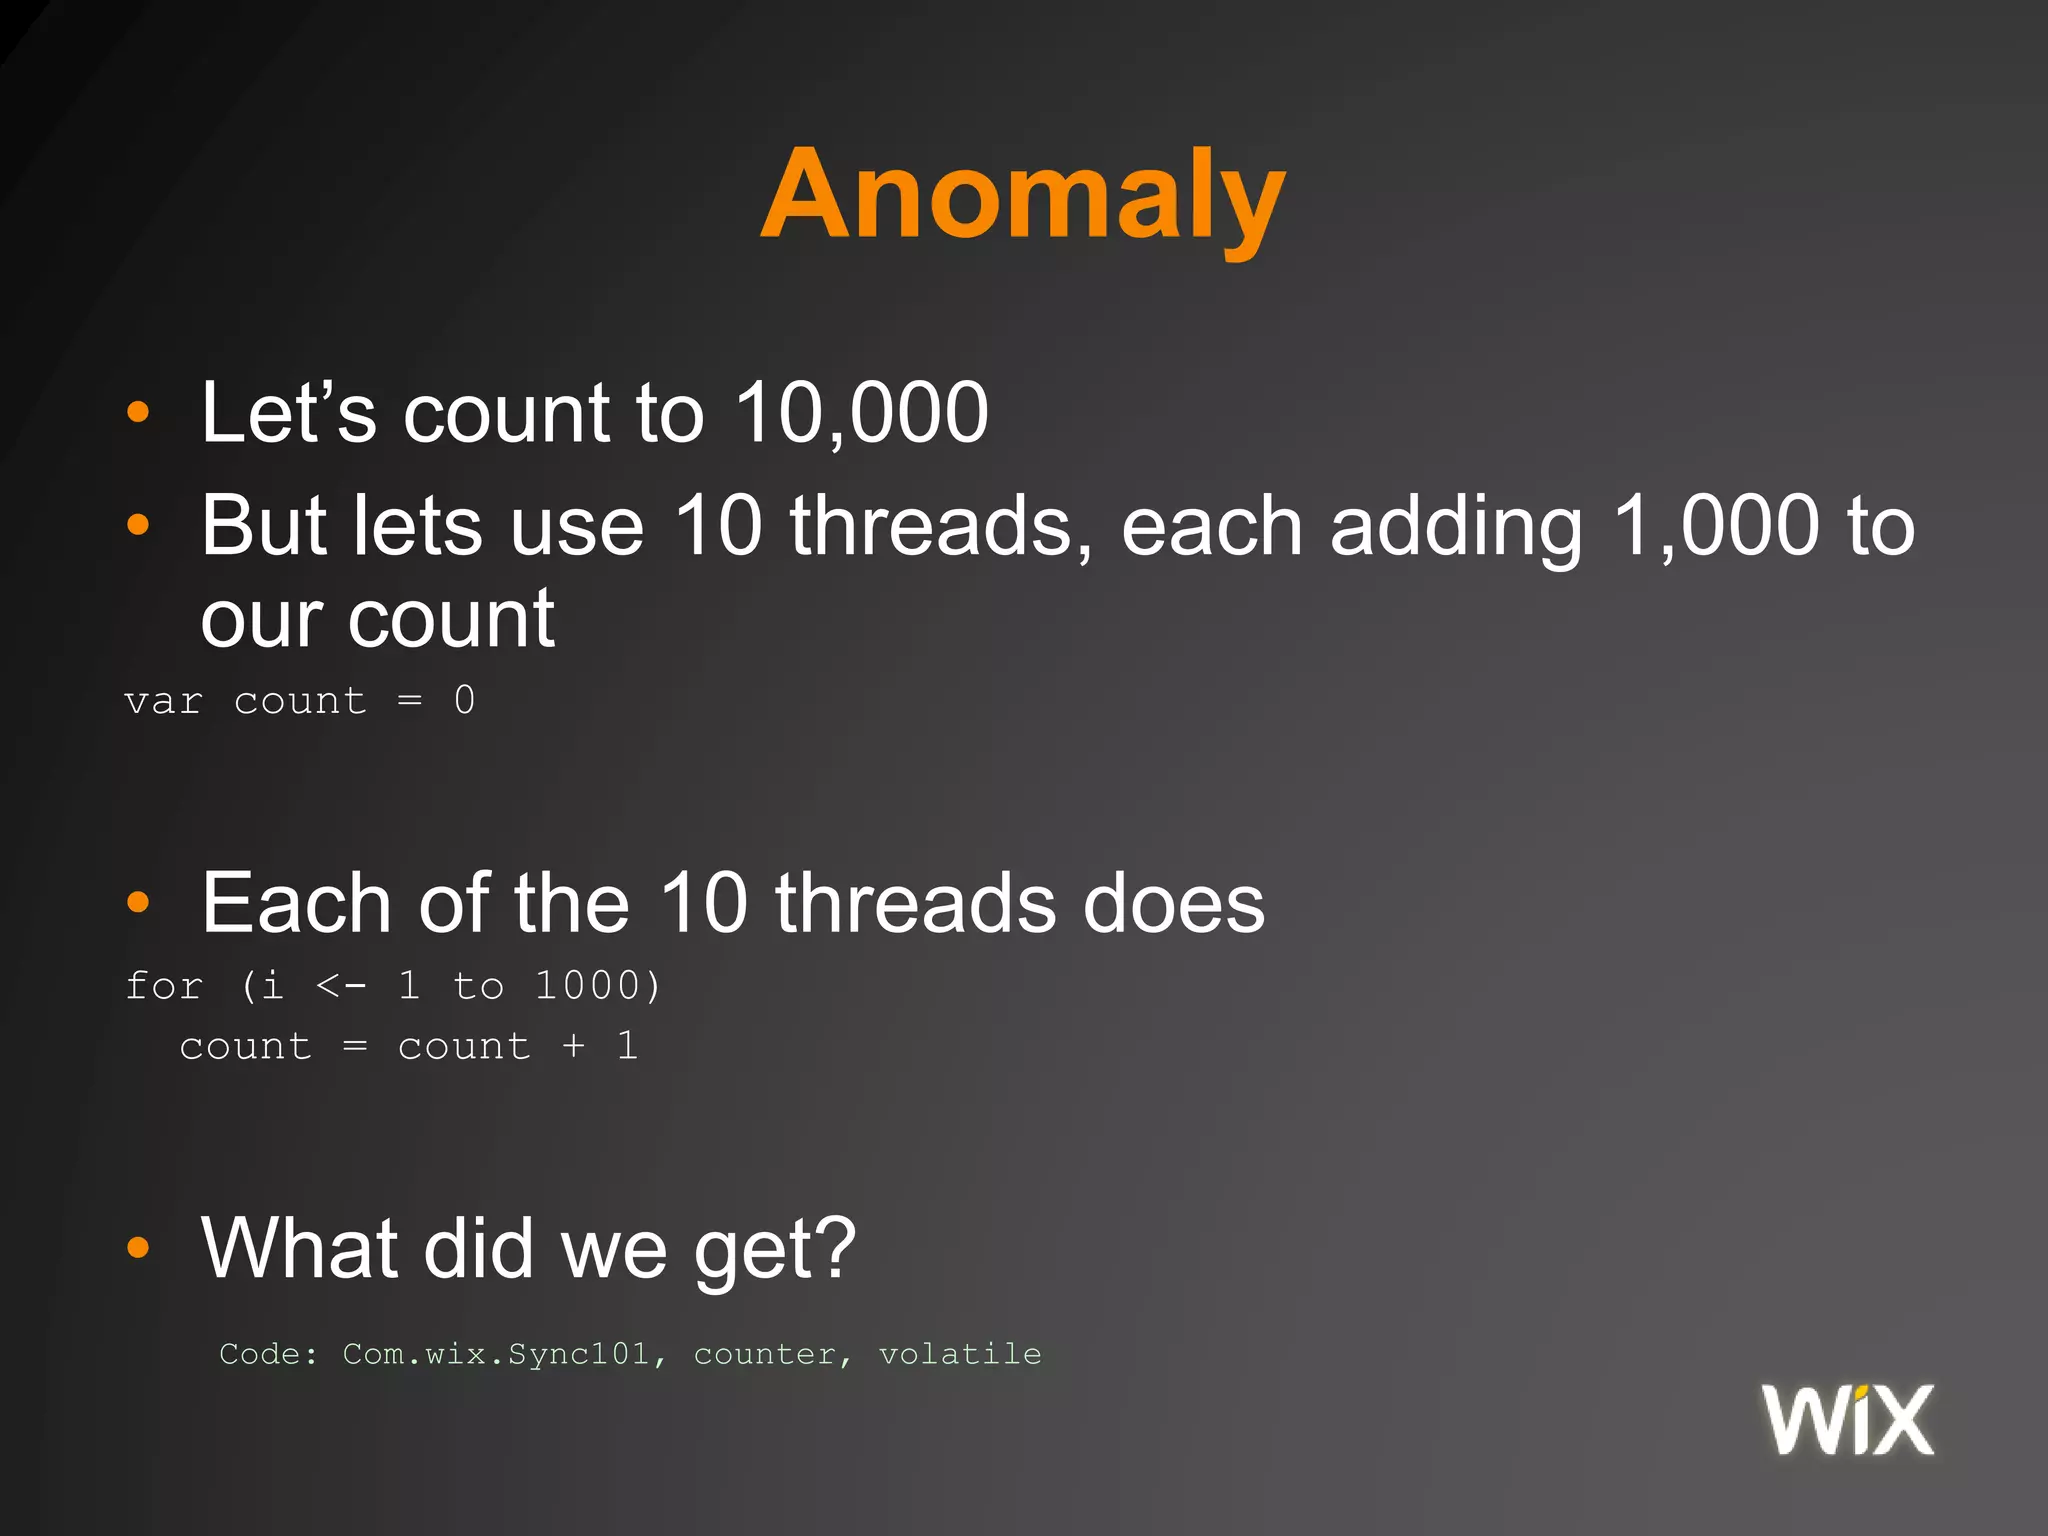
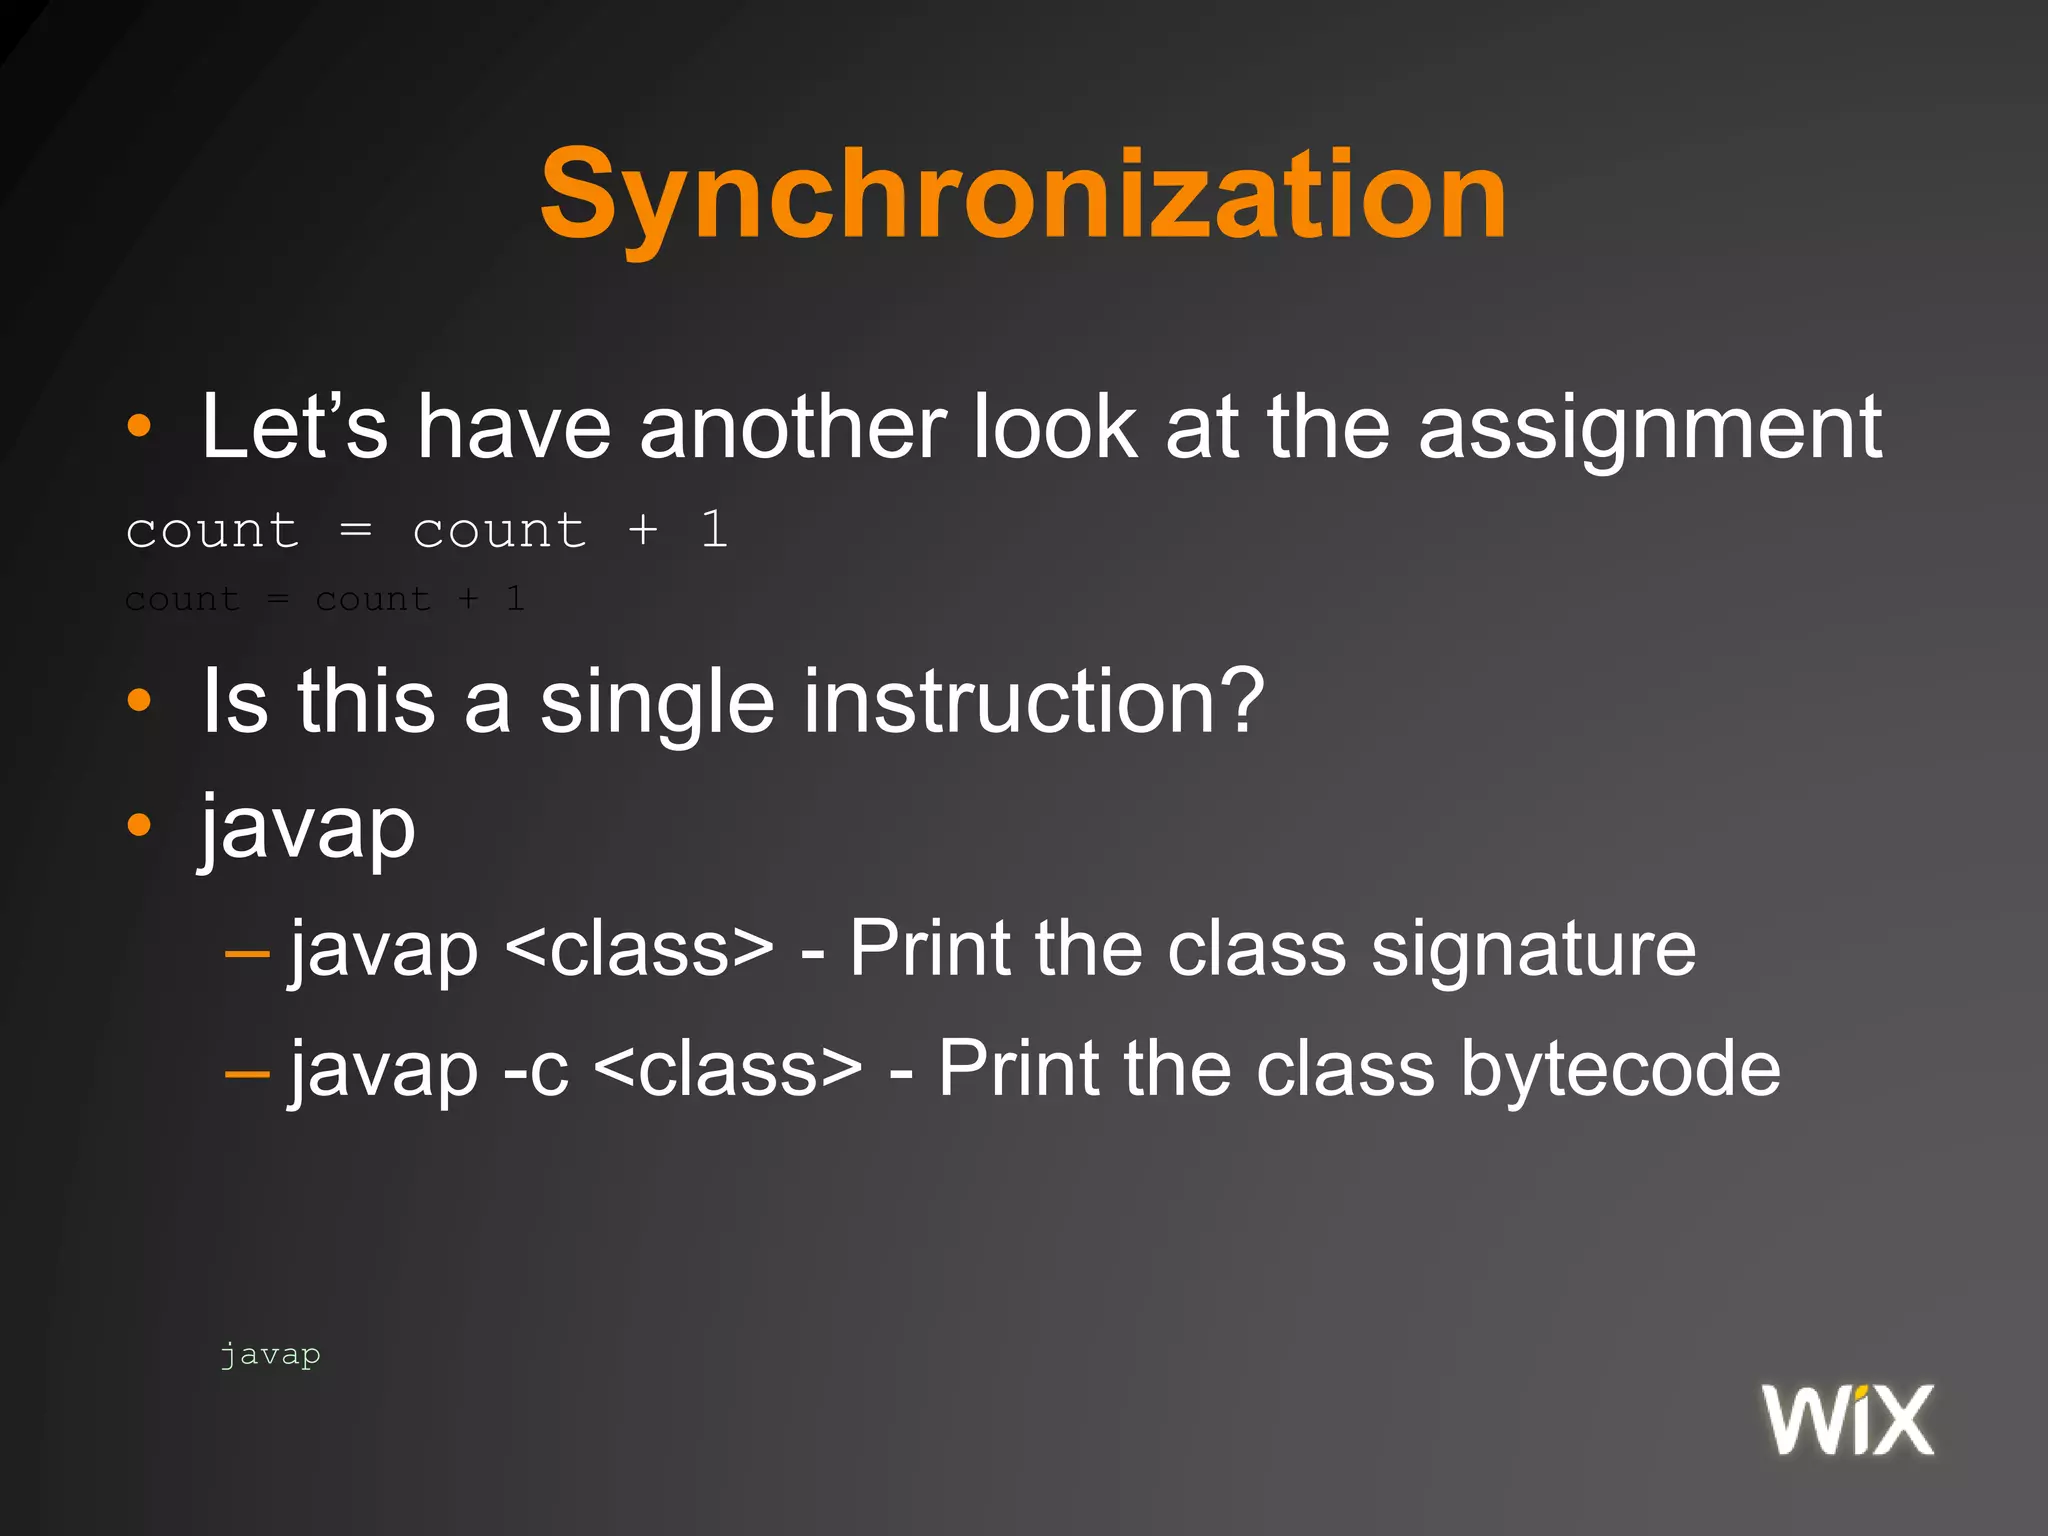
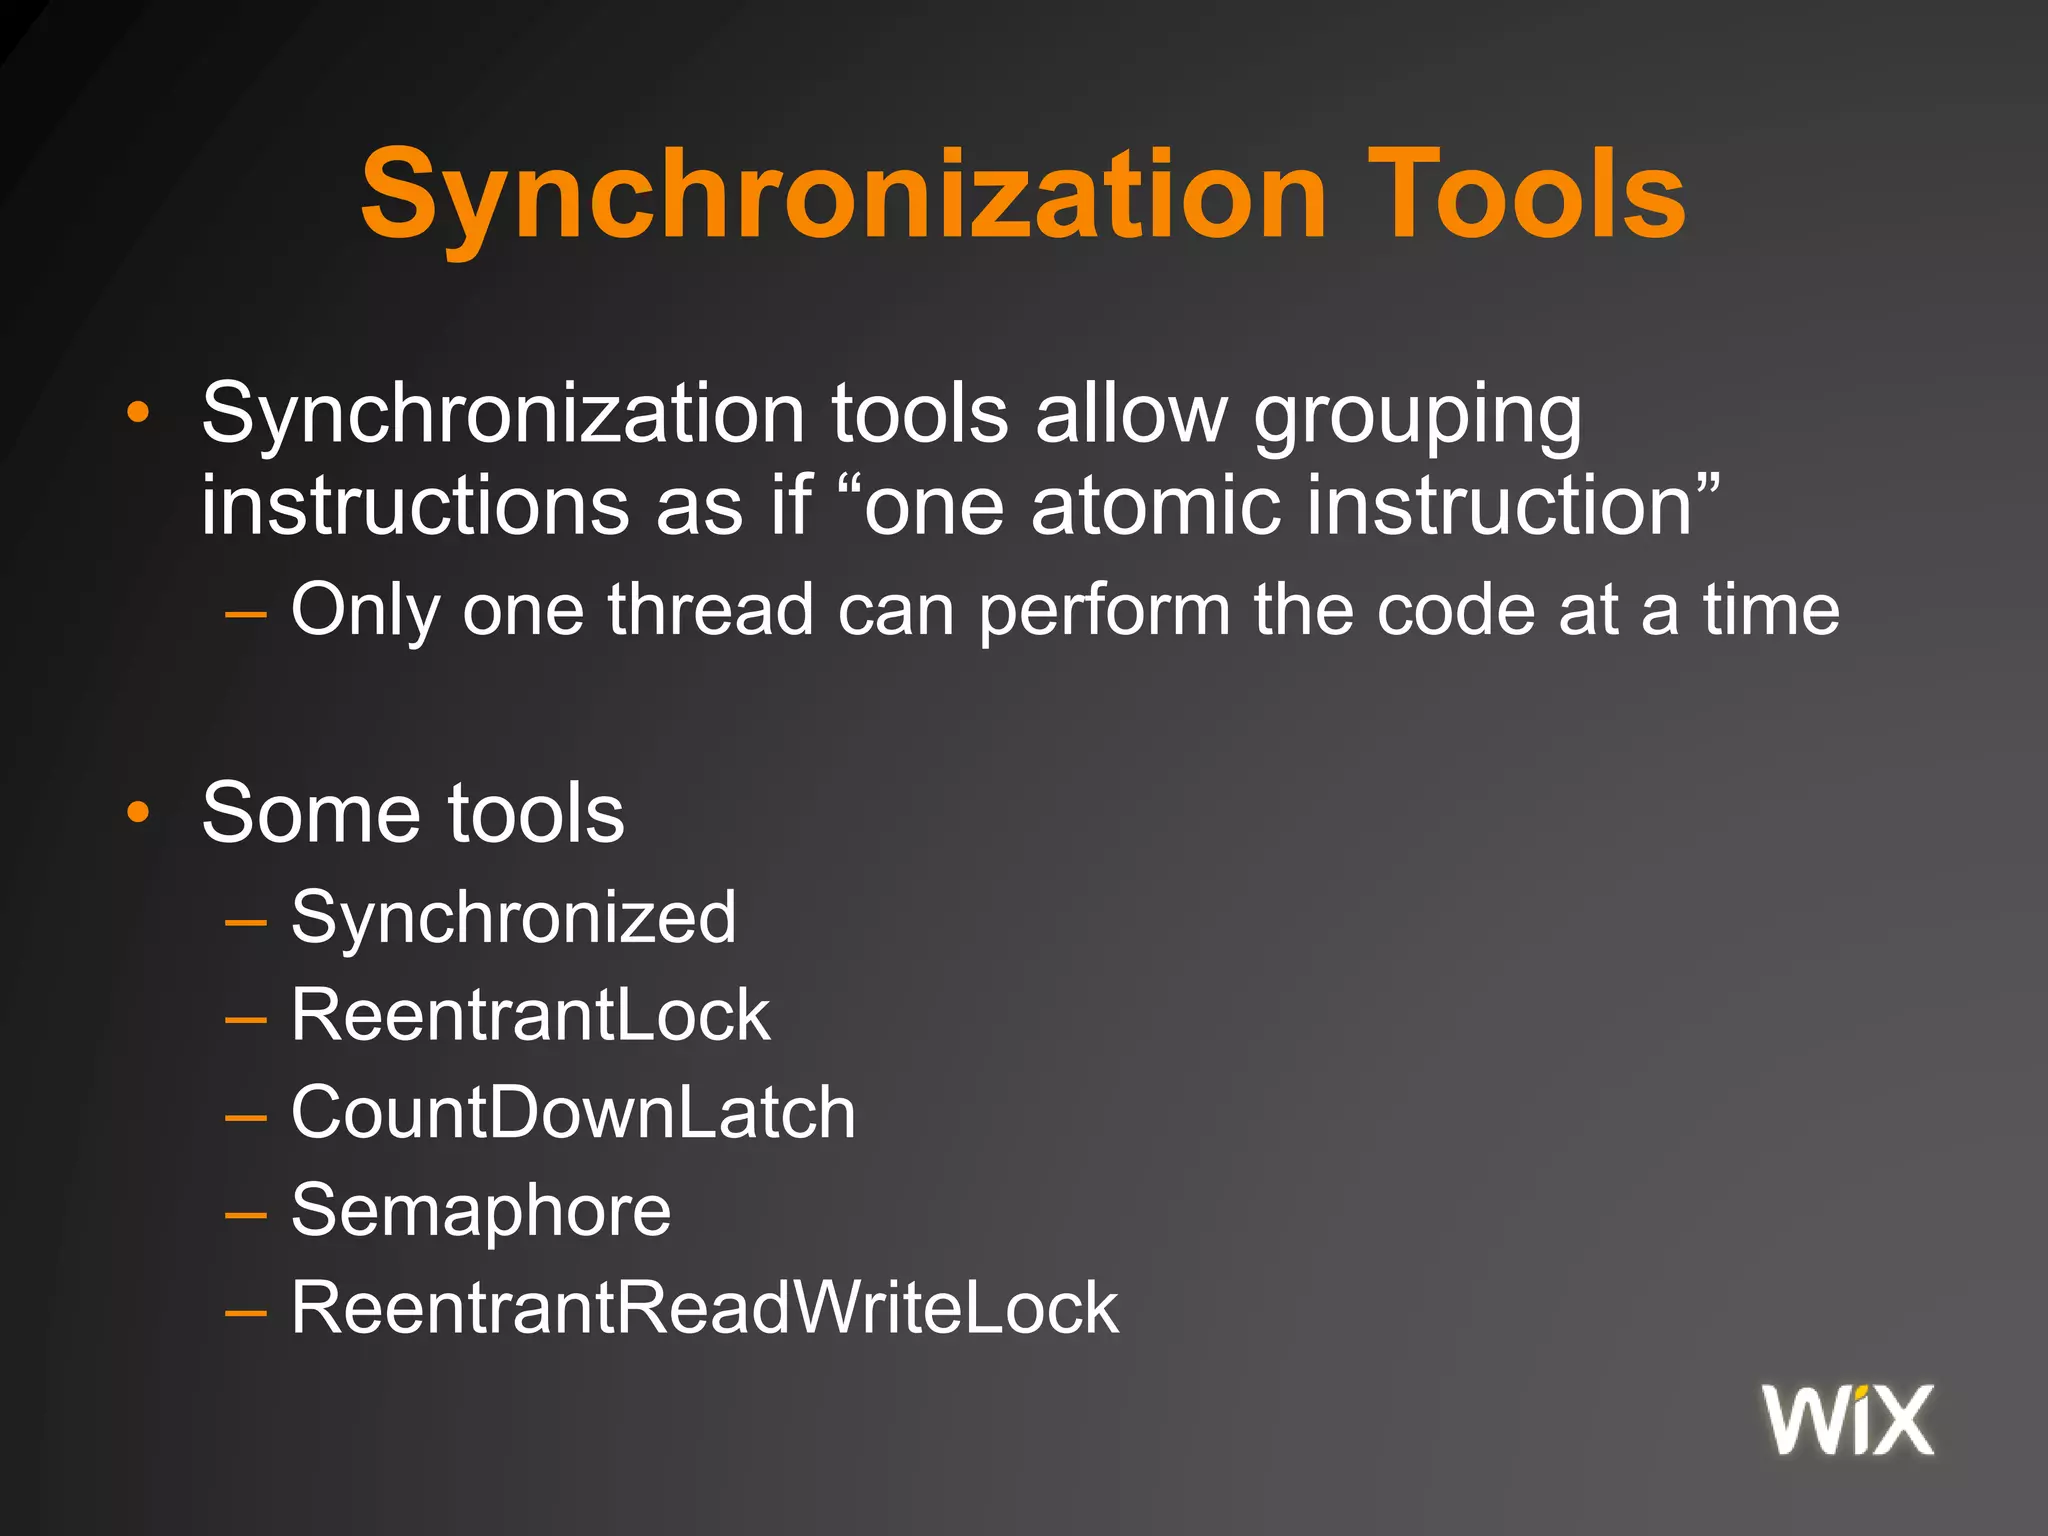
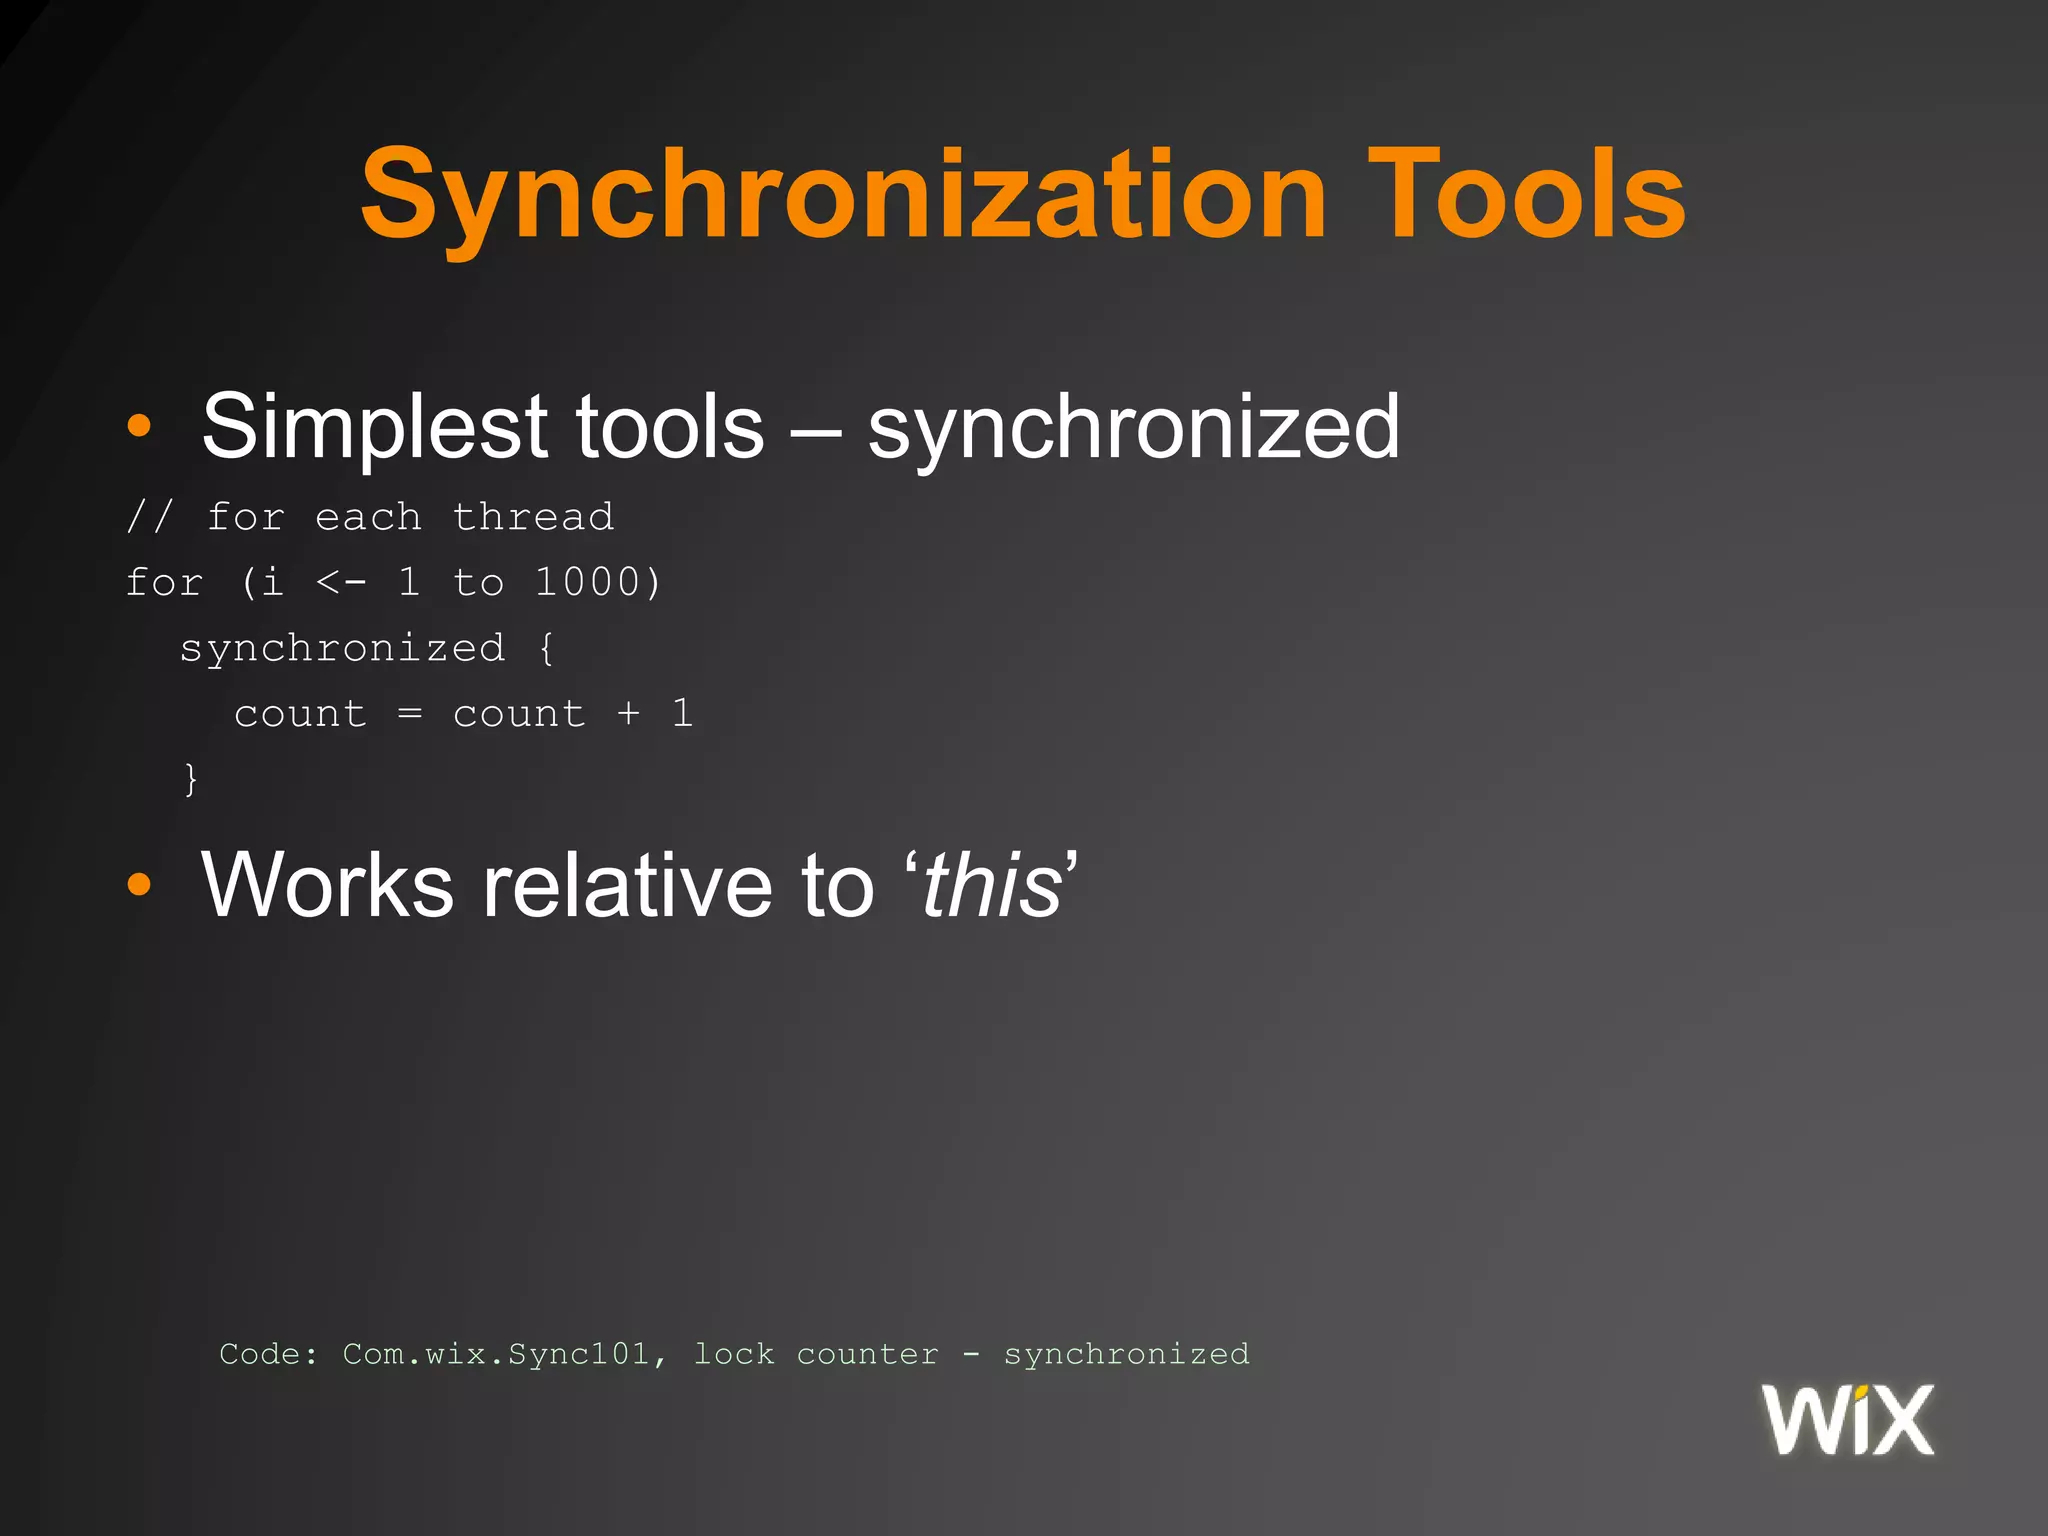
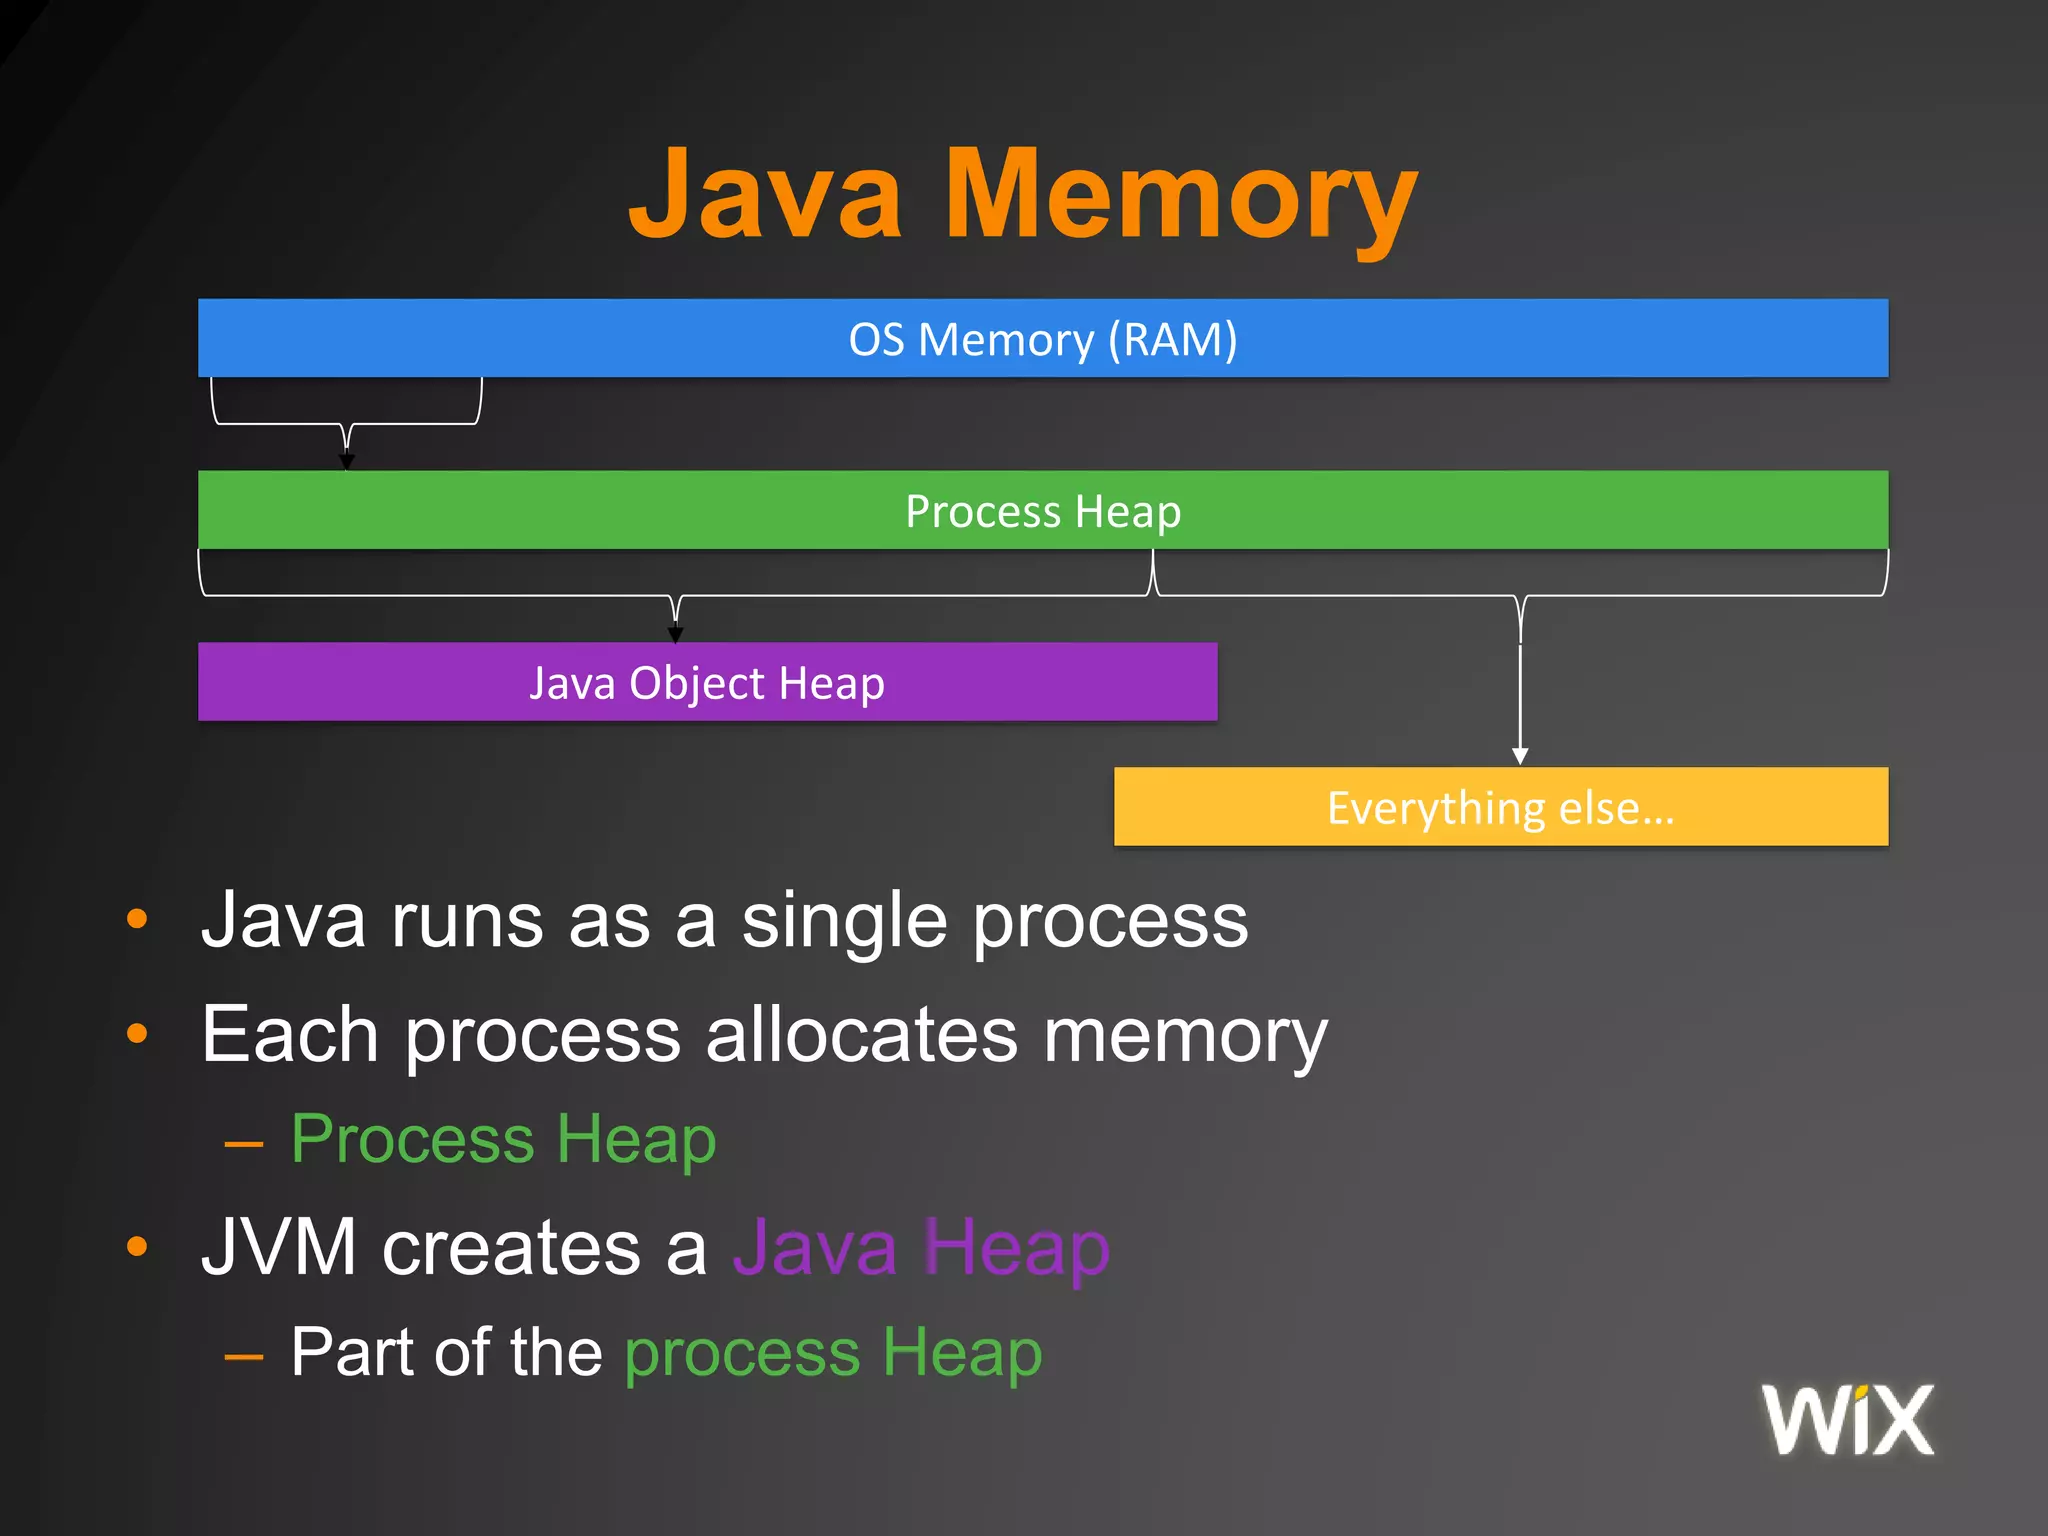
The document discusses the Java Virtual Machine (JVM) memory model, including aspects of Just-In-Time (JIT) compilation, instruction reordering, and memory allocation. It covers profiling, optimization techniques, and the interactions between threads through the Java Memory Model (JMM), including concepts such as volatile and synchronization tools. Additionally, it addresses garbage collection and memory monitoring strategies, as well as the memory structure utilized by JVM applications.


![Java Concurrency, A(nother) Peek Under the Hood [Code One 2019]](https://cdn.slidesharecdn.com/ss_thumbnails/oco19jcaluth-191015114641-thumbnail.jpg?width=640&height=640&fit=bounds)