Downloaded 878 times

![Stack Traces
• A code path snapshot. e.g., from jstack(1):
$ jstack 1819
[…]
"main" prio=10 tid=0x00007ff304009000
nid=0x7361 runnable [0x00007ff30d4f9000]
java.lang.Thread.State: RUNNABLE
at Func_abc.func_c(Func_abc.java:6)
at Func_abc.func_b(Func_abc.java:16)
at Func_abc.func_a(Func_abc.java:23)
at Func_abc.main(Func_abc.java:27)
running
parent
g.parent
g.g.parent](https://image.slidesharecdn.com/javaone2016javaflamegraphs-160920172322/75/Java-Performance-Analysis-on-Linux-with-Flame-Graphs-17-2048.jpg)
![perf Profiling
# perf record -F 99 -ag -- sleep 30
[ perf record: Woken up 9 times to write data ]
[ perf record: Captured and wrote 2.745 MB perf.data (~119930 samples) ]
# perf report -n -stdio
[…]
# Overhead Samples Command Shared Object Symbol
# ........ ............ ....... ................. .............................
#
20.42% 605 bash [kernel.kallsyms] [k] xen_hypercall_xen_version
|
--- xen_hypercall_xen_version
check_events
|
|--44.13%-- syscall_trace_enter
| tracesys
| |
| |--35.58%-- __GI___libc_fcntl
| | |
| | |--65.26%-- do_redirection_internal
| | | do_redirections
| | | execute_builtin_or_function
| | | execute_simple_command
[… ~13,000 lines truncated …]
call tree
summary](https://image.slidesharecdn.com/javaone2016javaflamegraphs-160920172322/75/Java-Performance-Analysis-on-Linux-with-Flame-Graphs-20-2048.jpg)

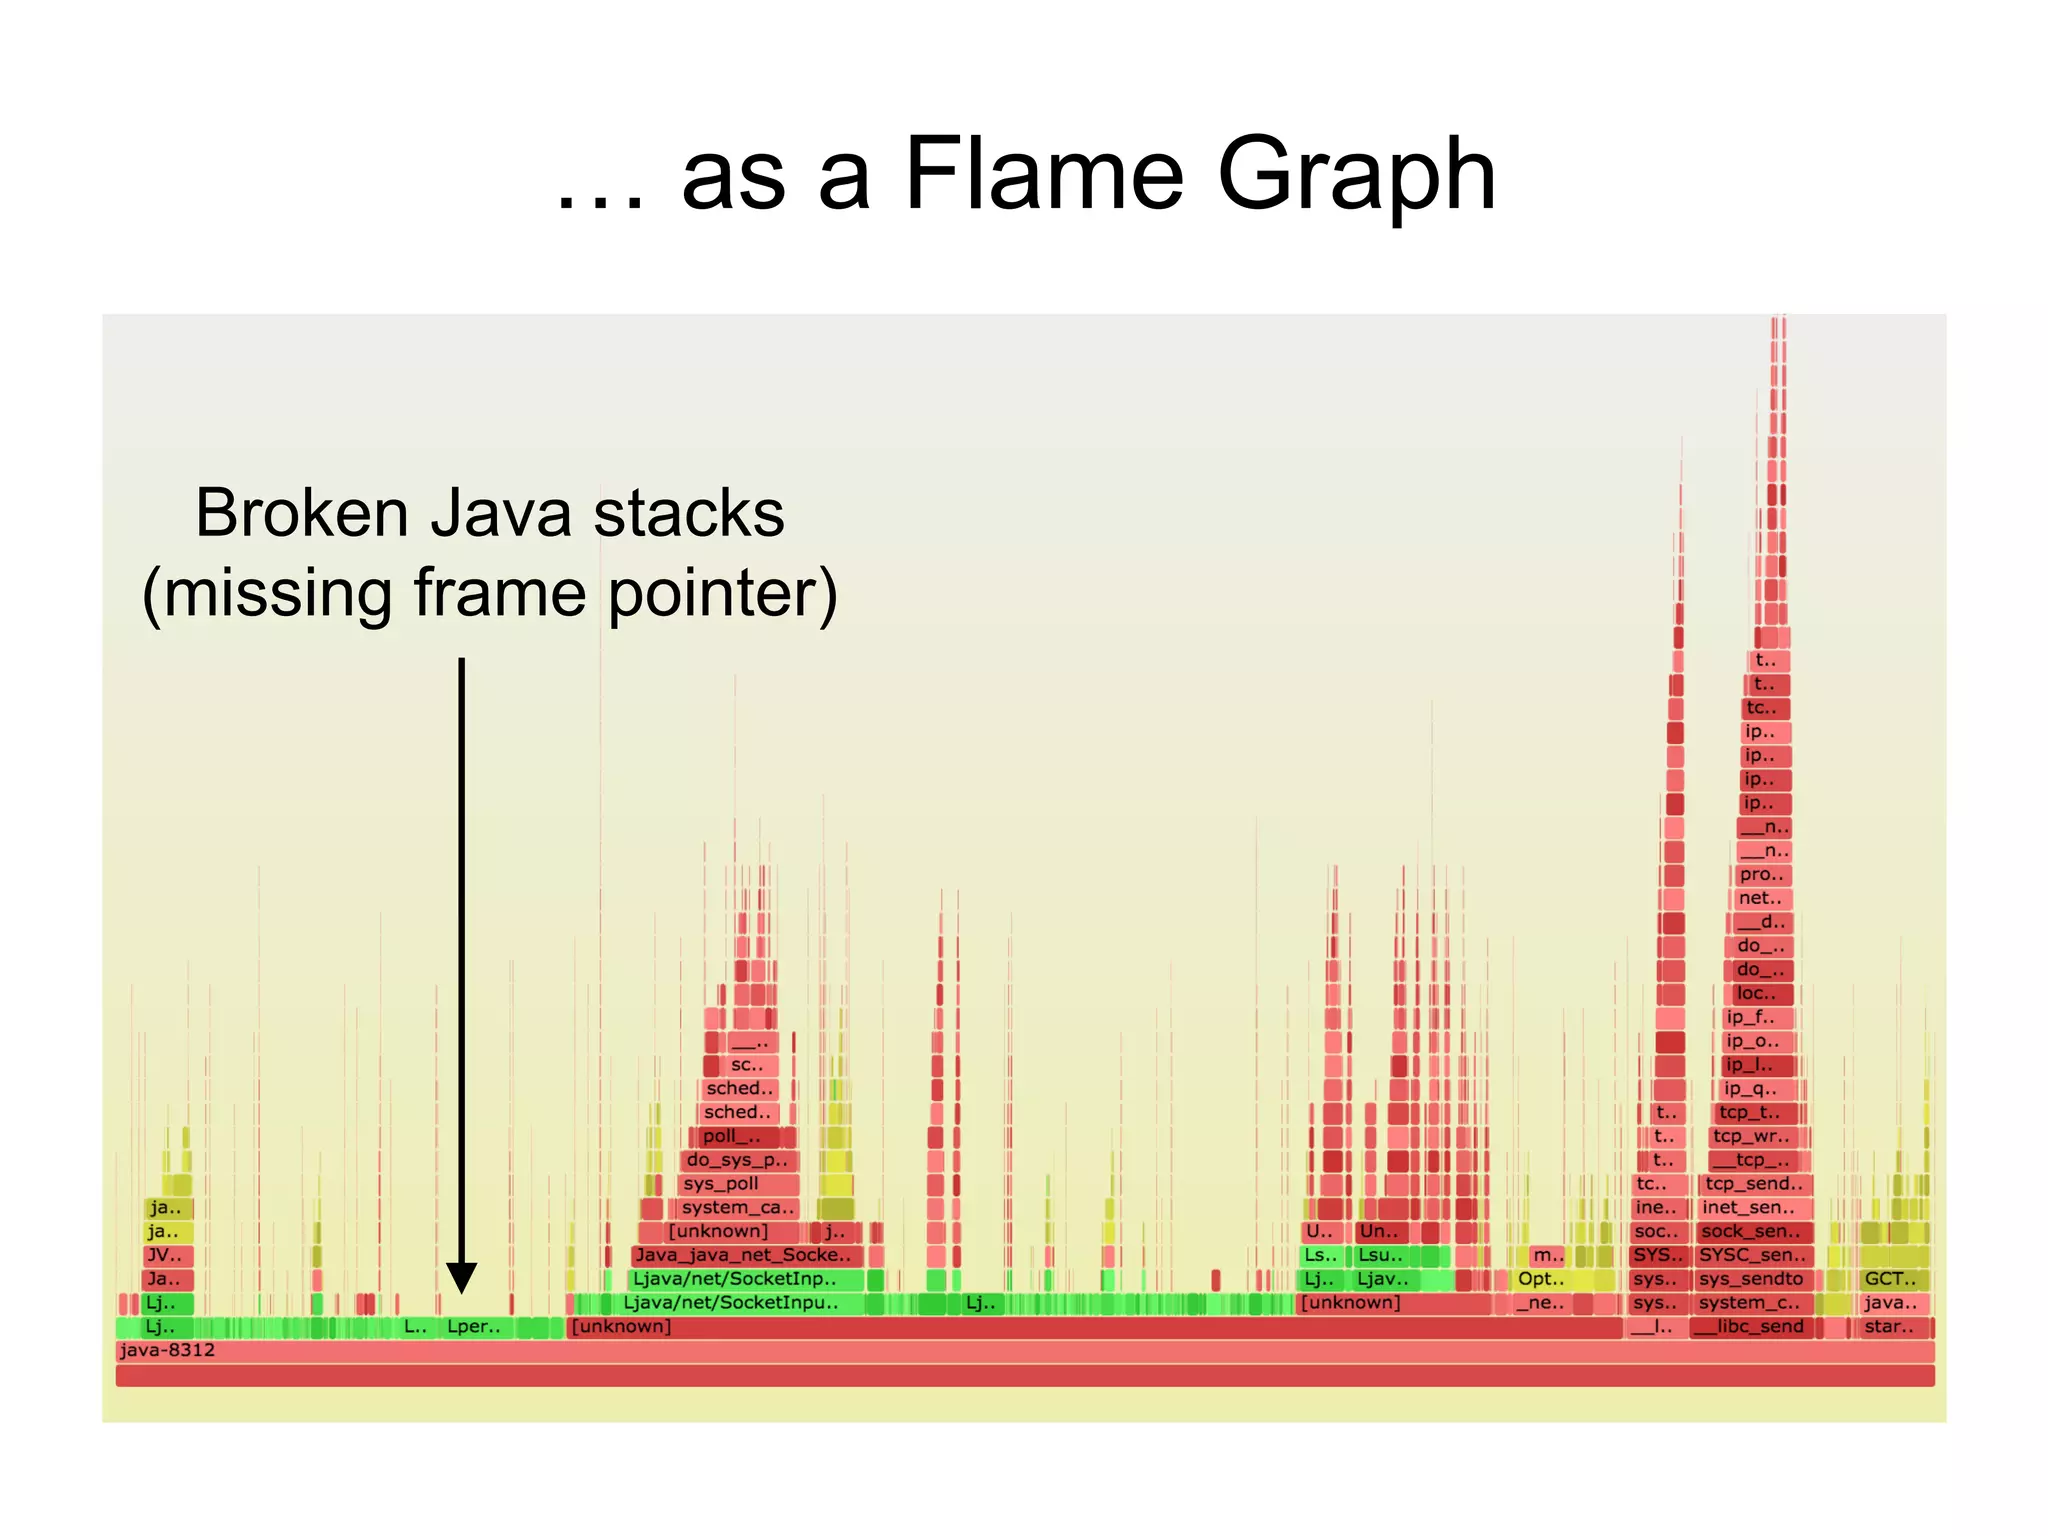
![Broken Java Stacks on x86
• These stacks are
1 or 2 levels deep,
with junk values
• On x86 (x86_64),
hotspot uses the
frame pointer
register (RBP) as
general purpose
• This "compiler optimization" breaks (RBP-based) stack walking
• Once upon a time, x86 had fewer registers, and this made more
sense
• gcc provides -fno-omit-frame-pointer to avoid doing this, but
the JVM had no such option…
# perf record –F 99 –a –g – sleep 30
# perf script
[…]
java 4579 cpu-clock:
7f417908c10b [unknown] (/tmp/perf-4458.map)
java 4579 cpu-clock:
7f41792fc65f [unknown] (/tmp/perf-4458.map)
a2d53351ff7da603 [unknown] ([unknown])
[…]](https://image.slidesharecdn.com/javaone2016javaflamegraphs-160920172322/75/Java-Performance-Analysis-on-Linux-with-Flame-Graphs-33-2048.jpg)
![Fixed Java Stacks
# perf script
[…]
java 8131 cpu-clock:
7fff76f2dce1 [unknown] ([vdso])
7fd3173f7a93 os::javaTimeMillis() (/usr/lib/jvm…
7fd301861e46 [unknown] (/tmp/perf-8131.map)
7fd30184def8 [unknown] (/tmp/perf-8131.map)
7fd30174f544 [unknown] (/tmp/perf-8131.map)
7fd30175d3a8 [unknown] (/tmp/perf-8131.map)
7fd30166d51c [unknown] (/tmp/perf-8131.map)
7fd301750f34 [unknown] (/tmp/perf-8131.map)
7fd3016c2280 [unknown] (/tmp/perf-8131.map)
7fd301b02ec0 [unknown] (/tmp/perf-8131.map)
7fd3016f9888 [unknown] (/tmp/perf-8131.map)
7fd3016ece04 [unknown] (/tmp/perf-8131.map)
7fd30177783c [unknown] (/tmp/perf-8131.map)
7fd301600aa8 [unknown] (/tmp/perf-8131.map)
7fd301a4484c [unknown] (/tmp/perf-8131.map)
7fd3010072e0 [unknown] (/tmp/perf-8131.map)
7fd301007325 [unknown] (/tmp/perf-8131.map)
7fd301007325 [unknown] (/tmp/perf-8131.map)
7fd3010004e7 [unknown] (/tmp/perf-8131.map)
7fd3171df76a JavaCalls::call_helper(JavaValue*,…
7fd3171dce44 JavaCalls::call_virtual(JavaValue*…
7fd3171dd43a JavaCalls::call_virtual(JavaValue*…
7fd31721b6ce thread_entry(JavaThread*, Thread*)…
7fd3175389e0 JavaThread::thread_main_inner() (/…
7fd317538cb2 JavaThread::run() (/usr/lib/jvm/nf…
7fd3173f6f52 java_start(Thread*) (/usr/lib/jvm/…
7fd317a7e182 start_thread (/lib/x86_64-linux-gn…
# perf script
[…]
java 4579 cpu-clock:
7f417908c10b [unknown] (/tmp/…
java 4579 cpu-clock:
7f41792fc65f [unknown] (/tmp/…
a2d53351ff7da603 [unknown] ([unkn…
[…]](https://image.slidesharecdn.com/javaone2016javaflamegraphs-160920172322/75/Java-Performance-Analysis-on-Linux-with-Flame-Graphs-37-2048.jpg)

![Fixing Symbols
• For JIT'd code, Linux perf already looks for an
externally provided symbol file: /tmp/perf-PID.map, and
warns if it doesn't exist
• This file can be created by a Java agent
# perf script
Failed to open /tmp/perf-8131.map, continuing without symbols
[…]
java 8131 cpu-clock:
7fff76f2dce1 [unknown] ([vdso])
7fd3173f7a93 os::javaTimeMillis() (/usr/lib/jvm…
7fd301861e46 [unknown] (/tmp/perf-8131.map)
[…]](https://image.slidesharecdn.com/javaone2016javaflamegraphs-160920172322/75/Java-Performance-Analysis-on-Linux-with-Flame-Graphs-41-2048.jpg)
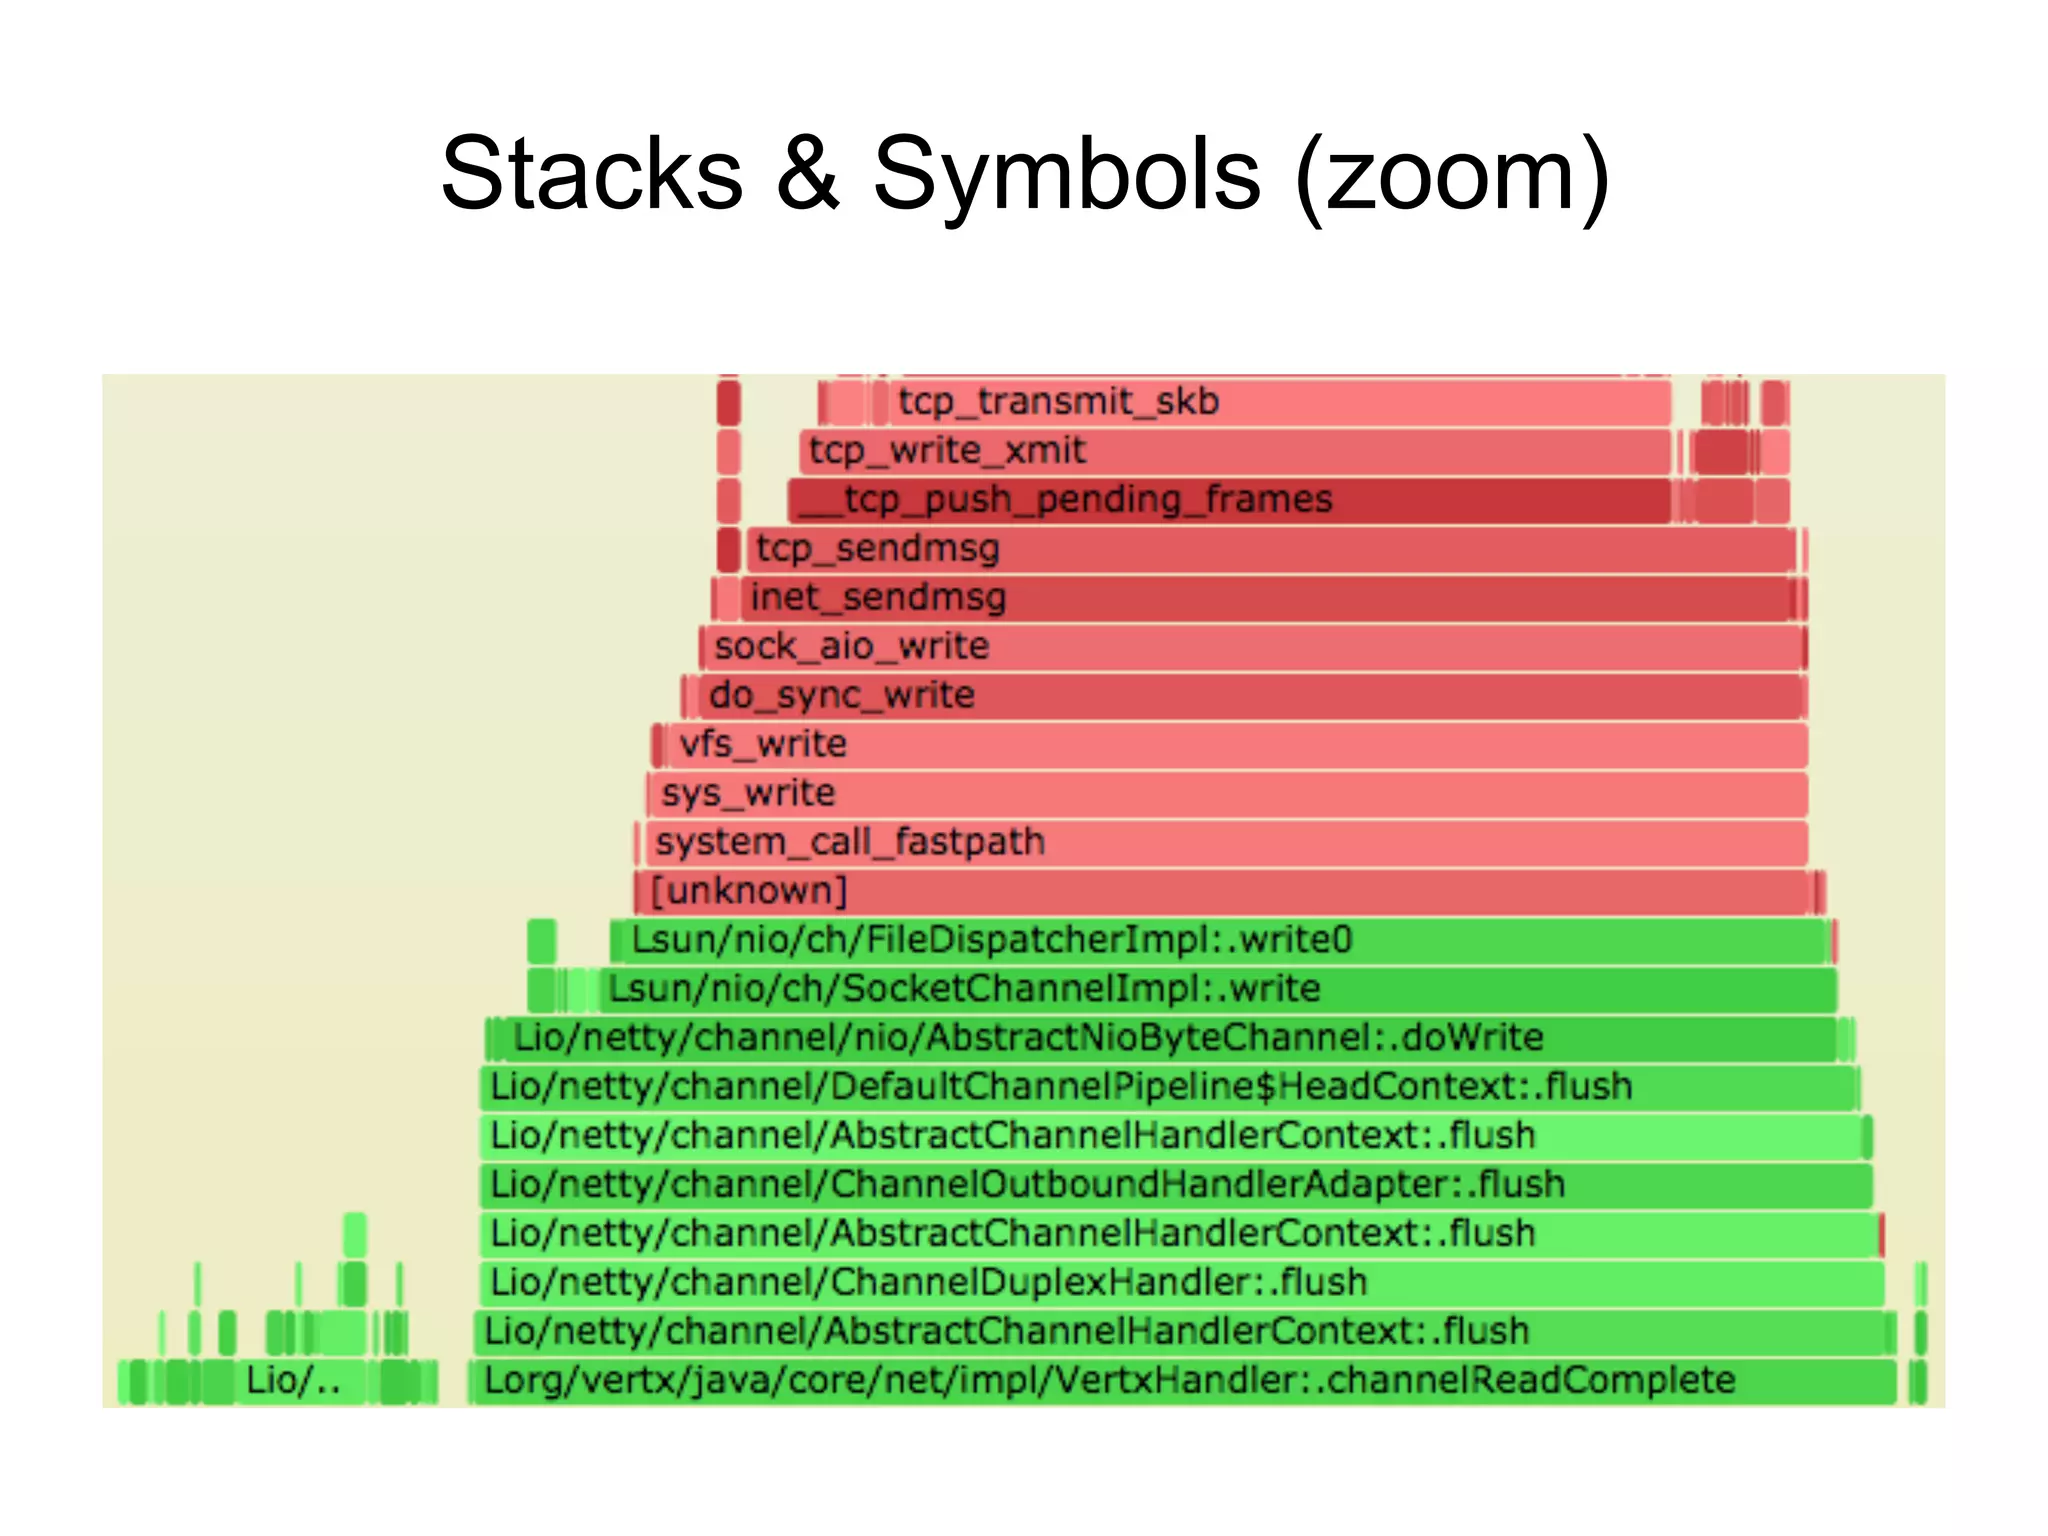
![Java Symbols for perf
• perf-map-agent
– https://github.com/jrudolph/perf-map-agent
– Agent attaches and writes the /tmp file on demand (previous versions
attached on Java start, wrote continually)
– Thanks Johannes Rudolph!
• Use of a /tmp symbol file
– Pros: simple, can be low overhead (snapshot on demand)
– Cons: stale symbols
• Using a symbol logger with perf instead
– Stephane Eranian contributed this to perf
– See lkml for "perf: add support for profiling jitted code"
# perf script
java 14025 [017] 8048.157085: cpu-clock: 7fd781253265 Ljava/util/
HashMap;::get (/tmp/perf-12149.map)
[…]
fixed
symbols](https://image.slidesharecdn.com/javaone2016javaflamegraphs-160920172322/75/Java-Performance-Analysis-on-Linux-with-Flame-Graphs-42-2048.jpg)


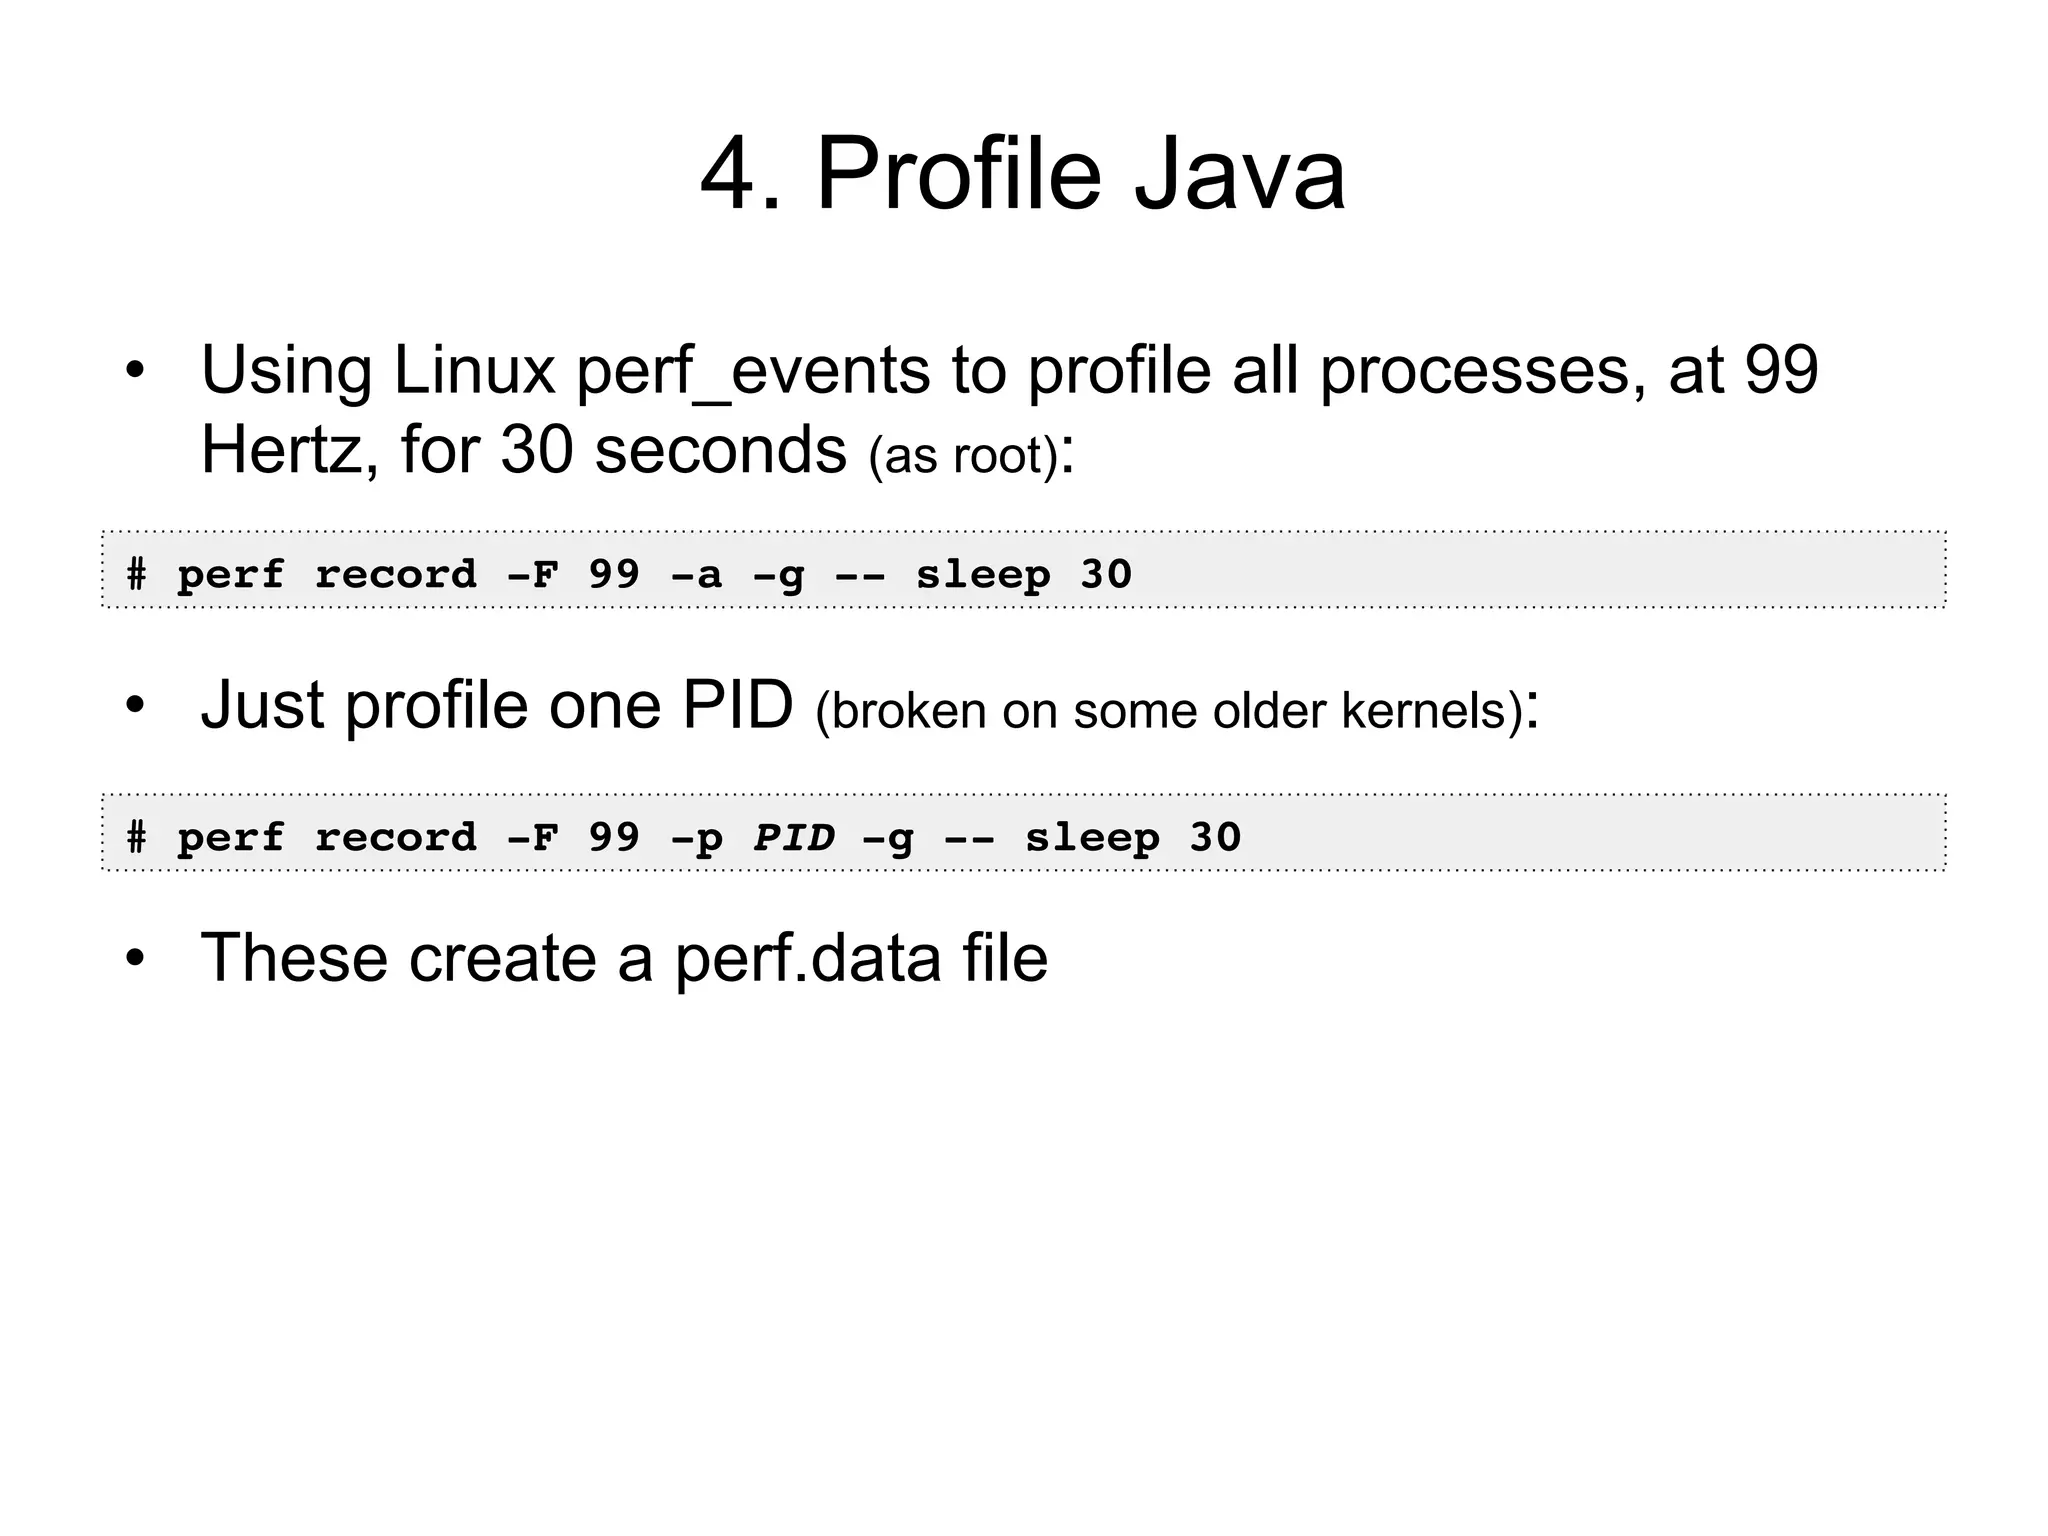
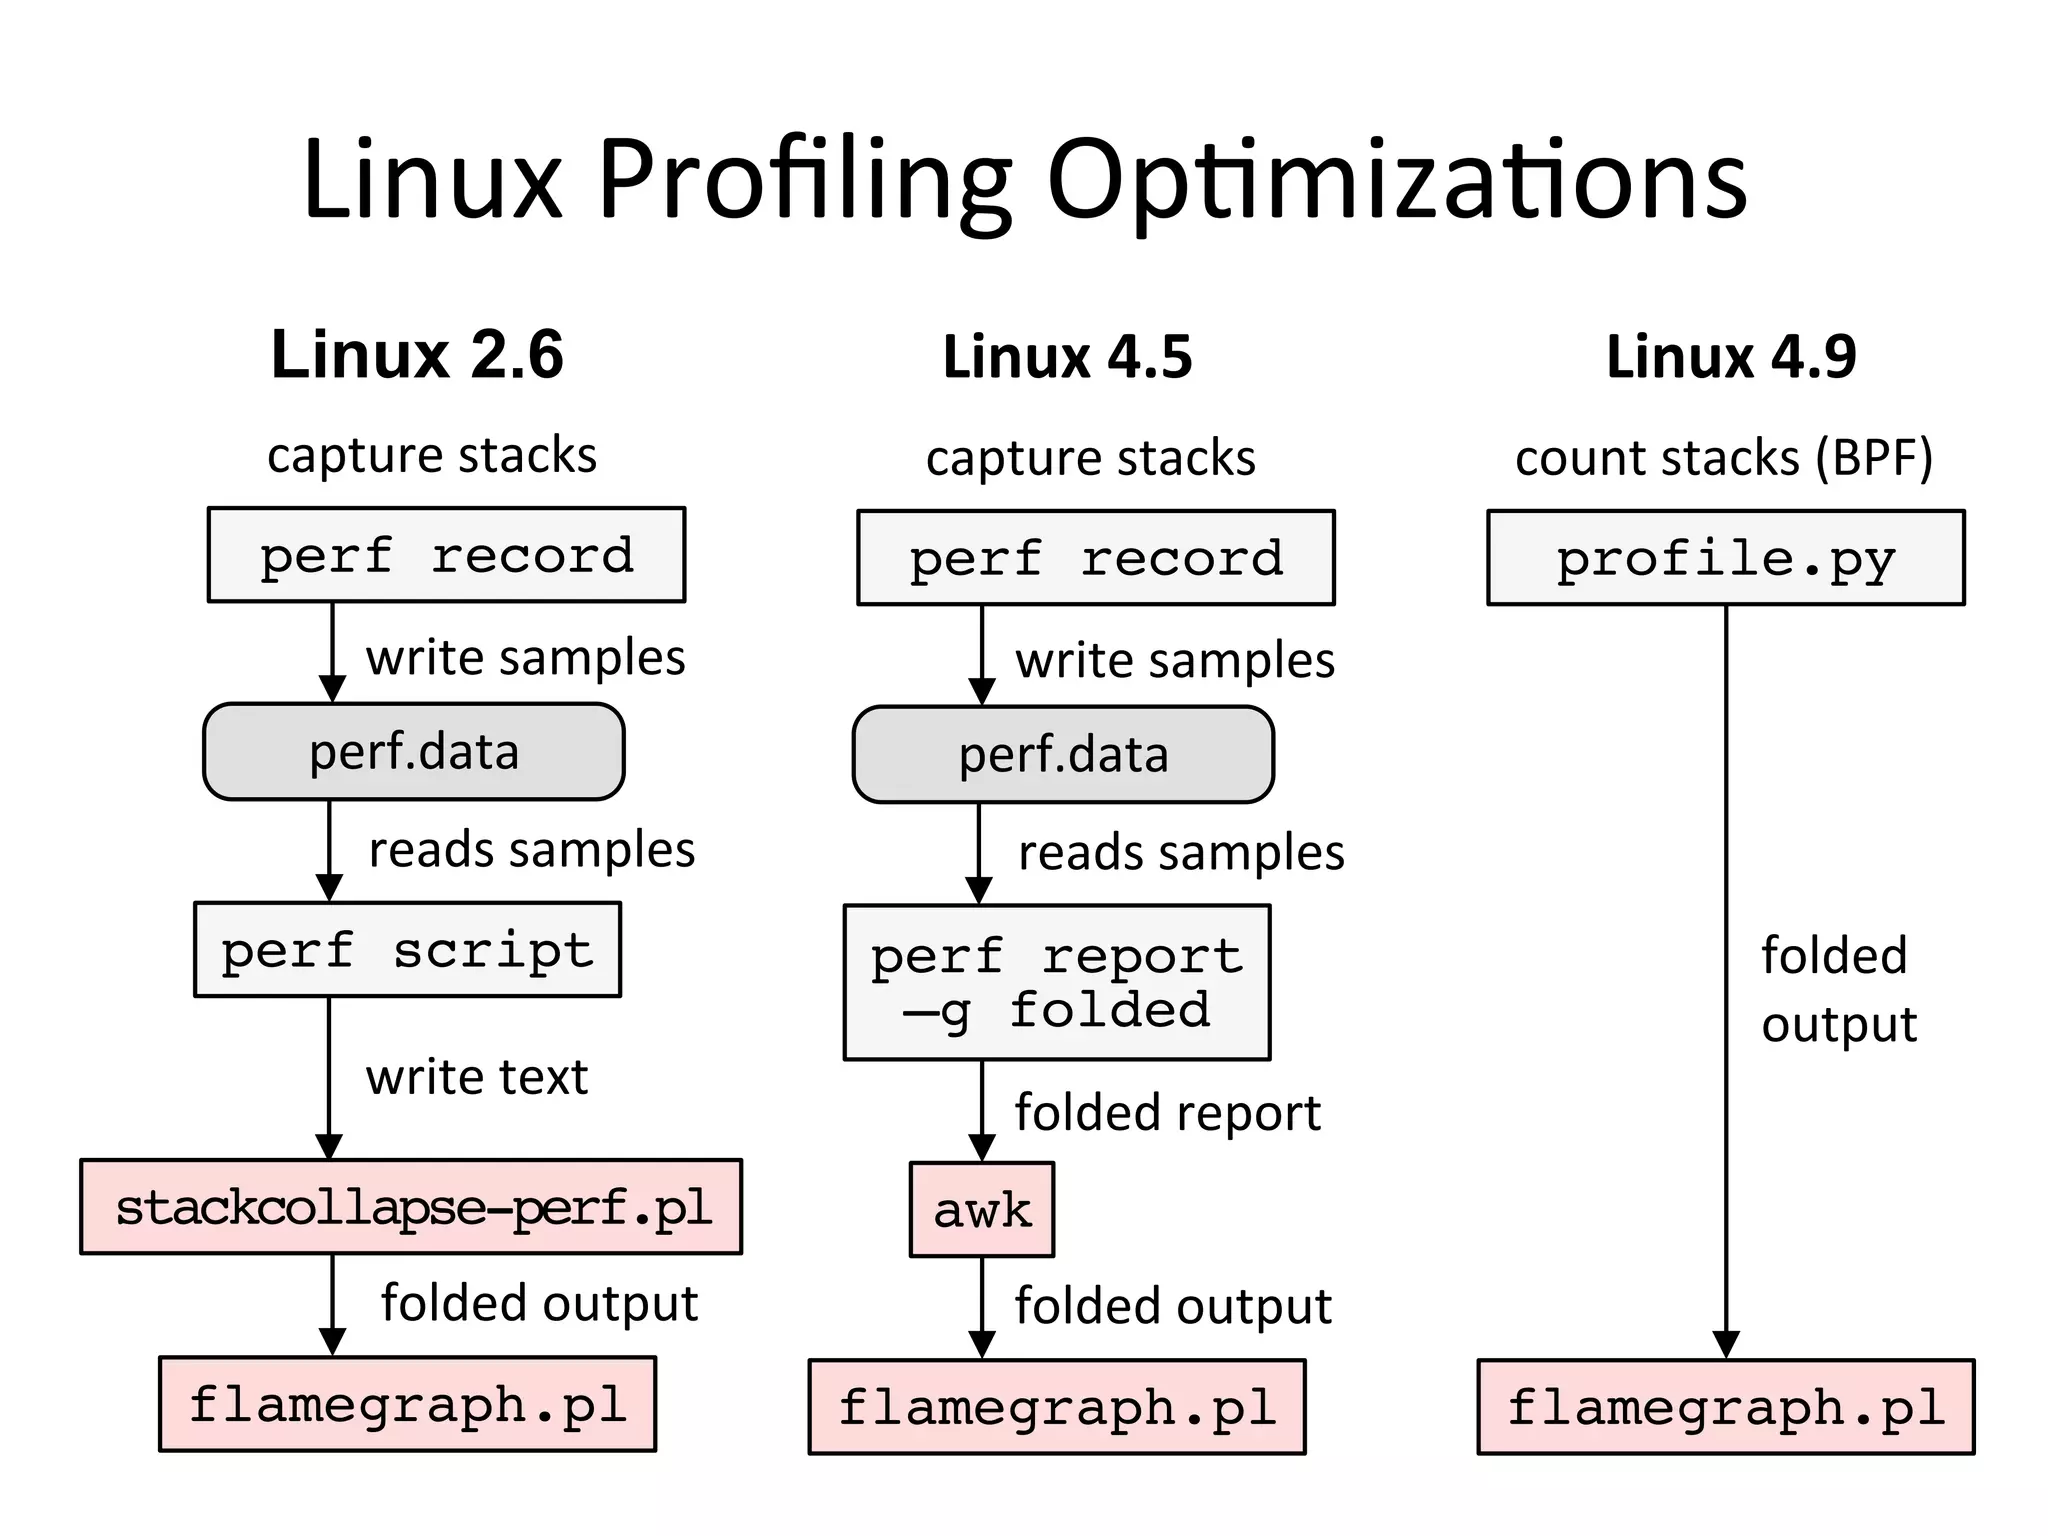
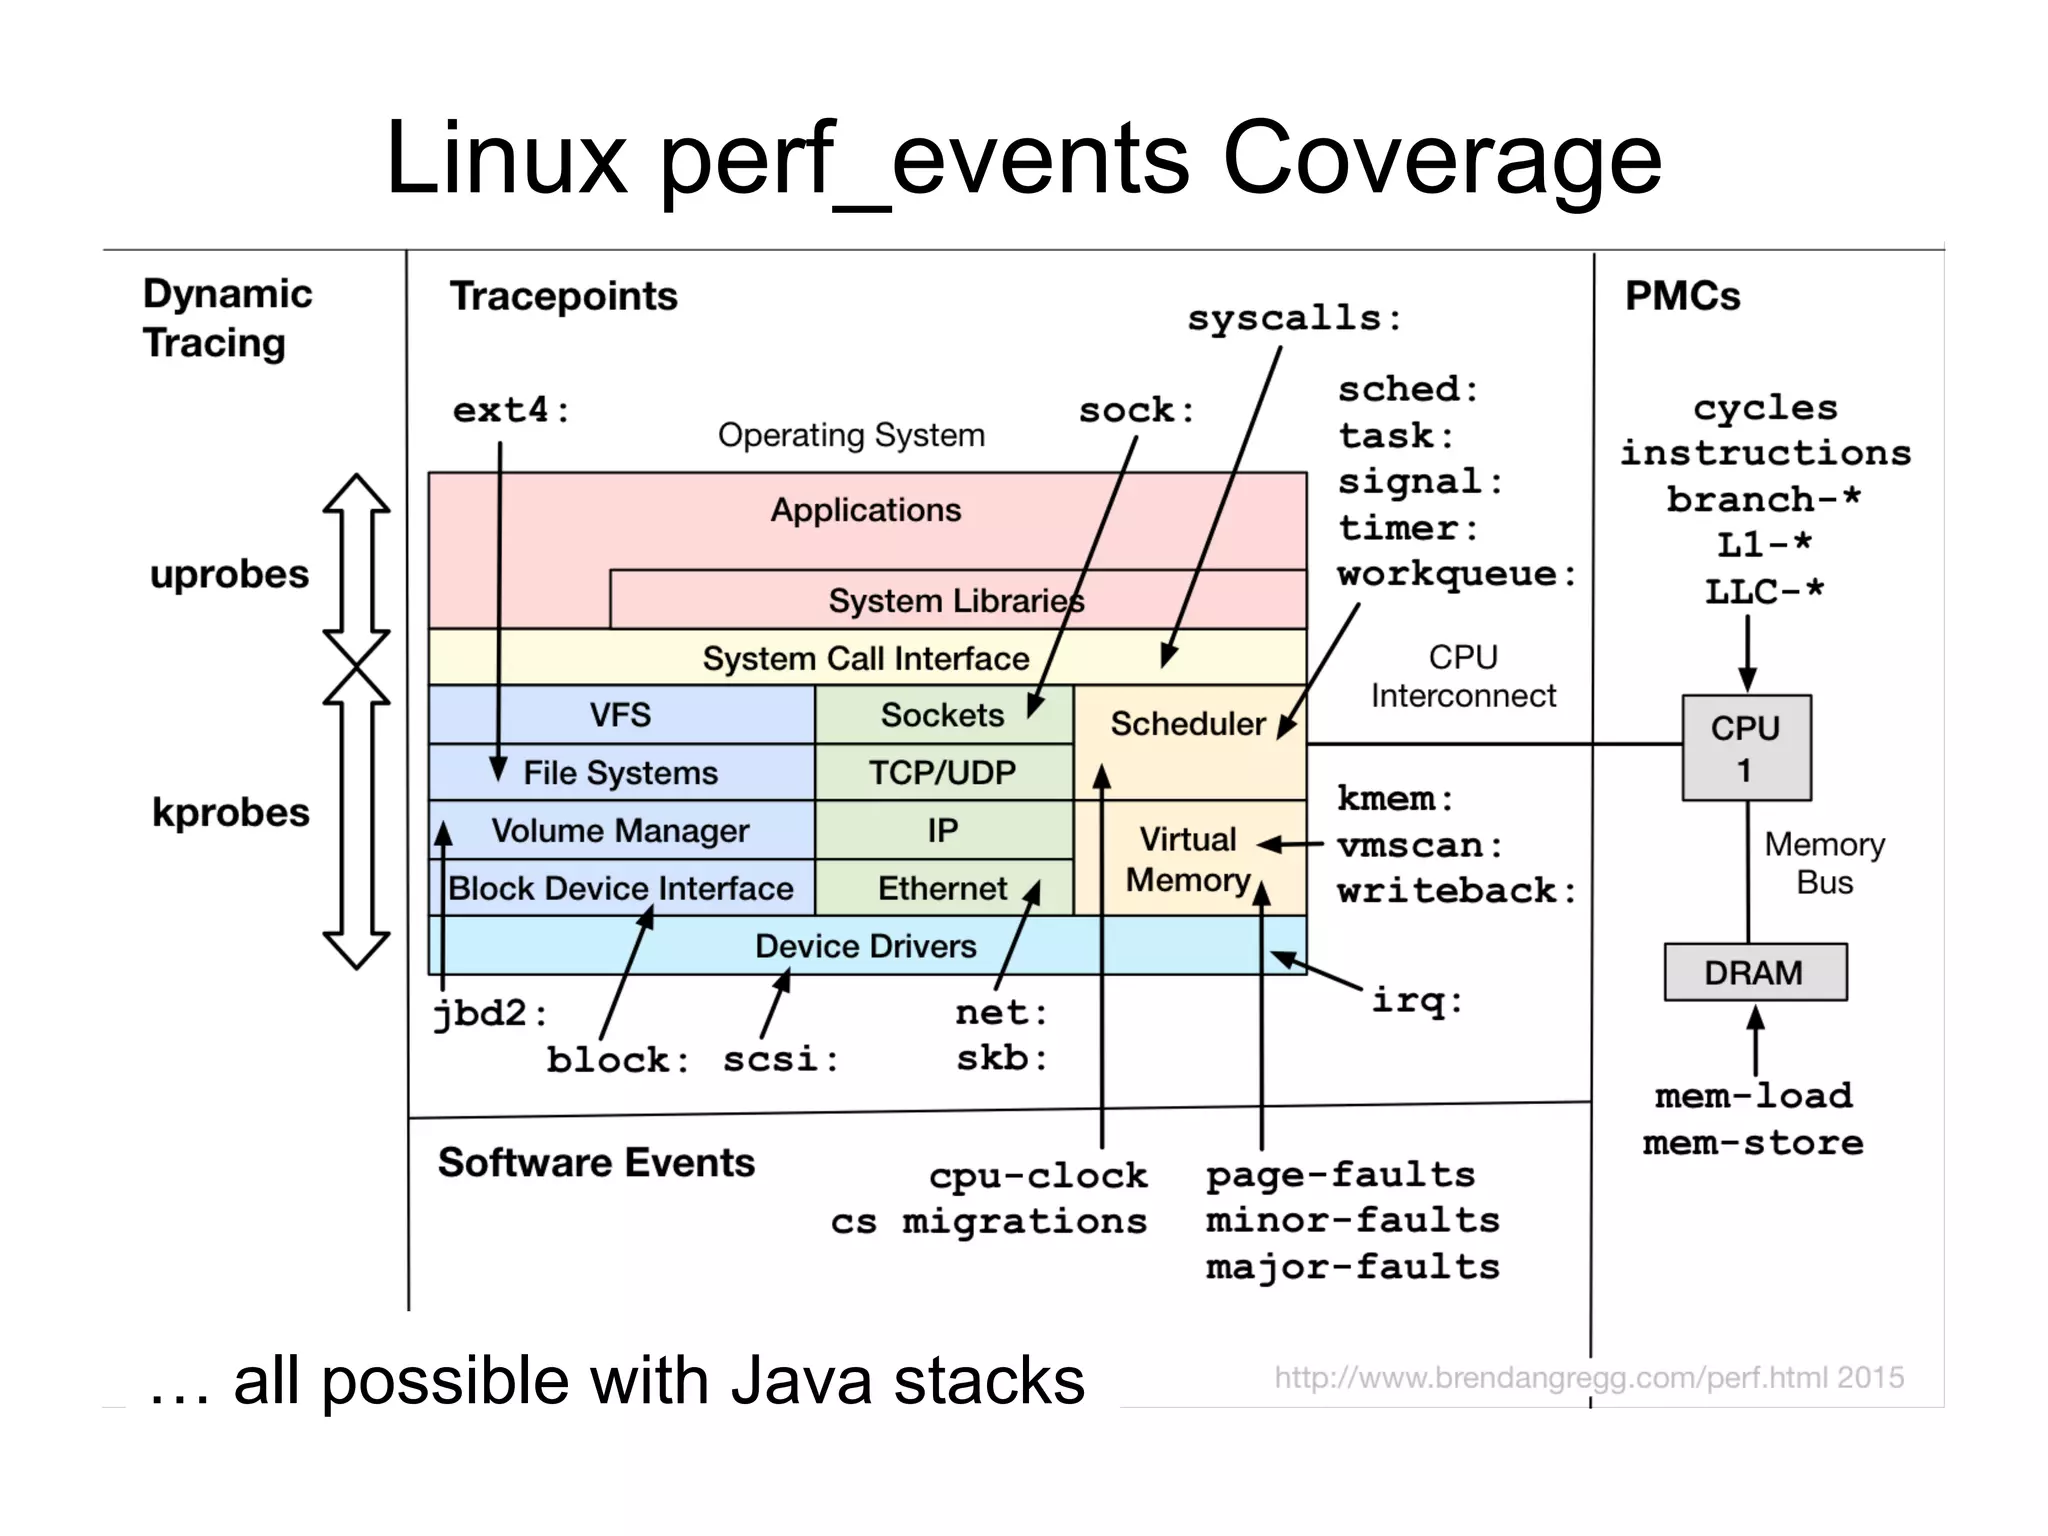
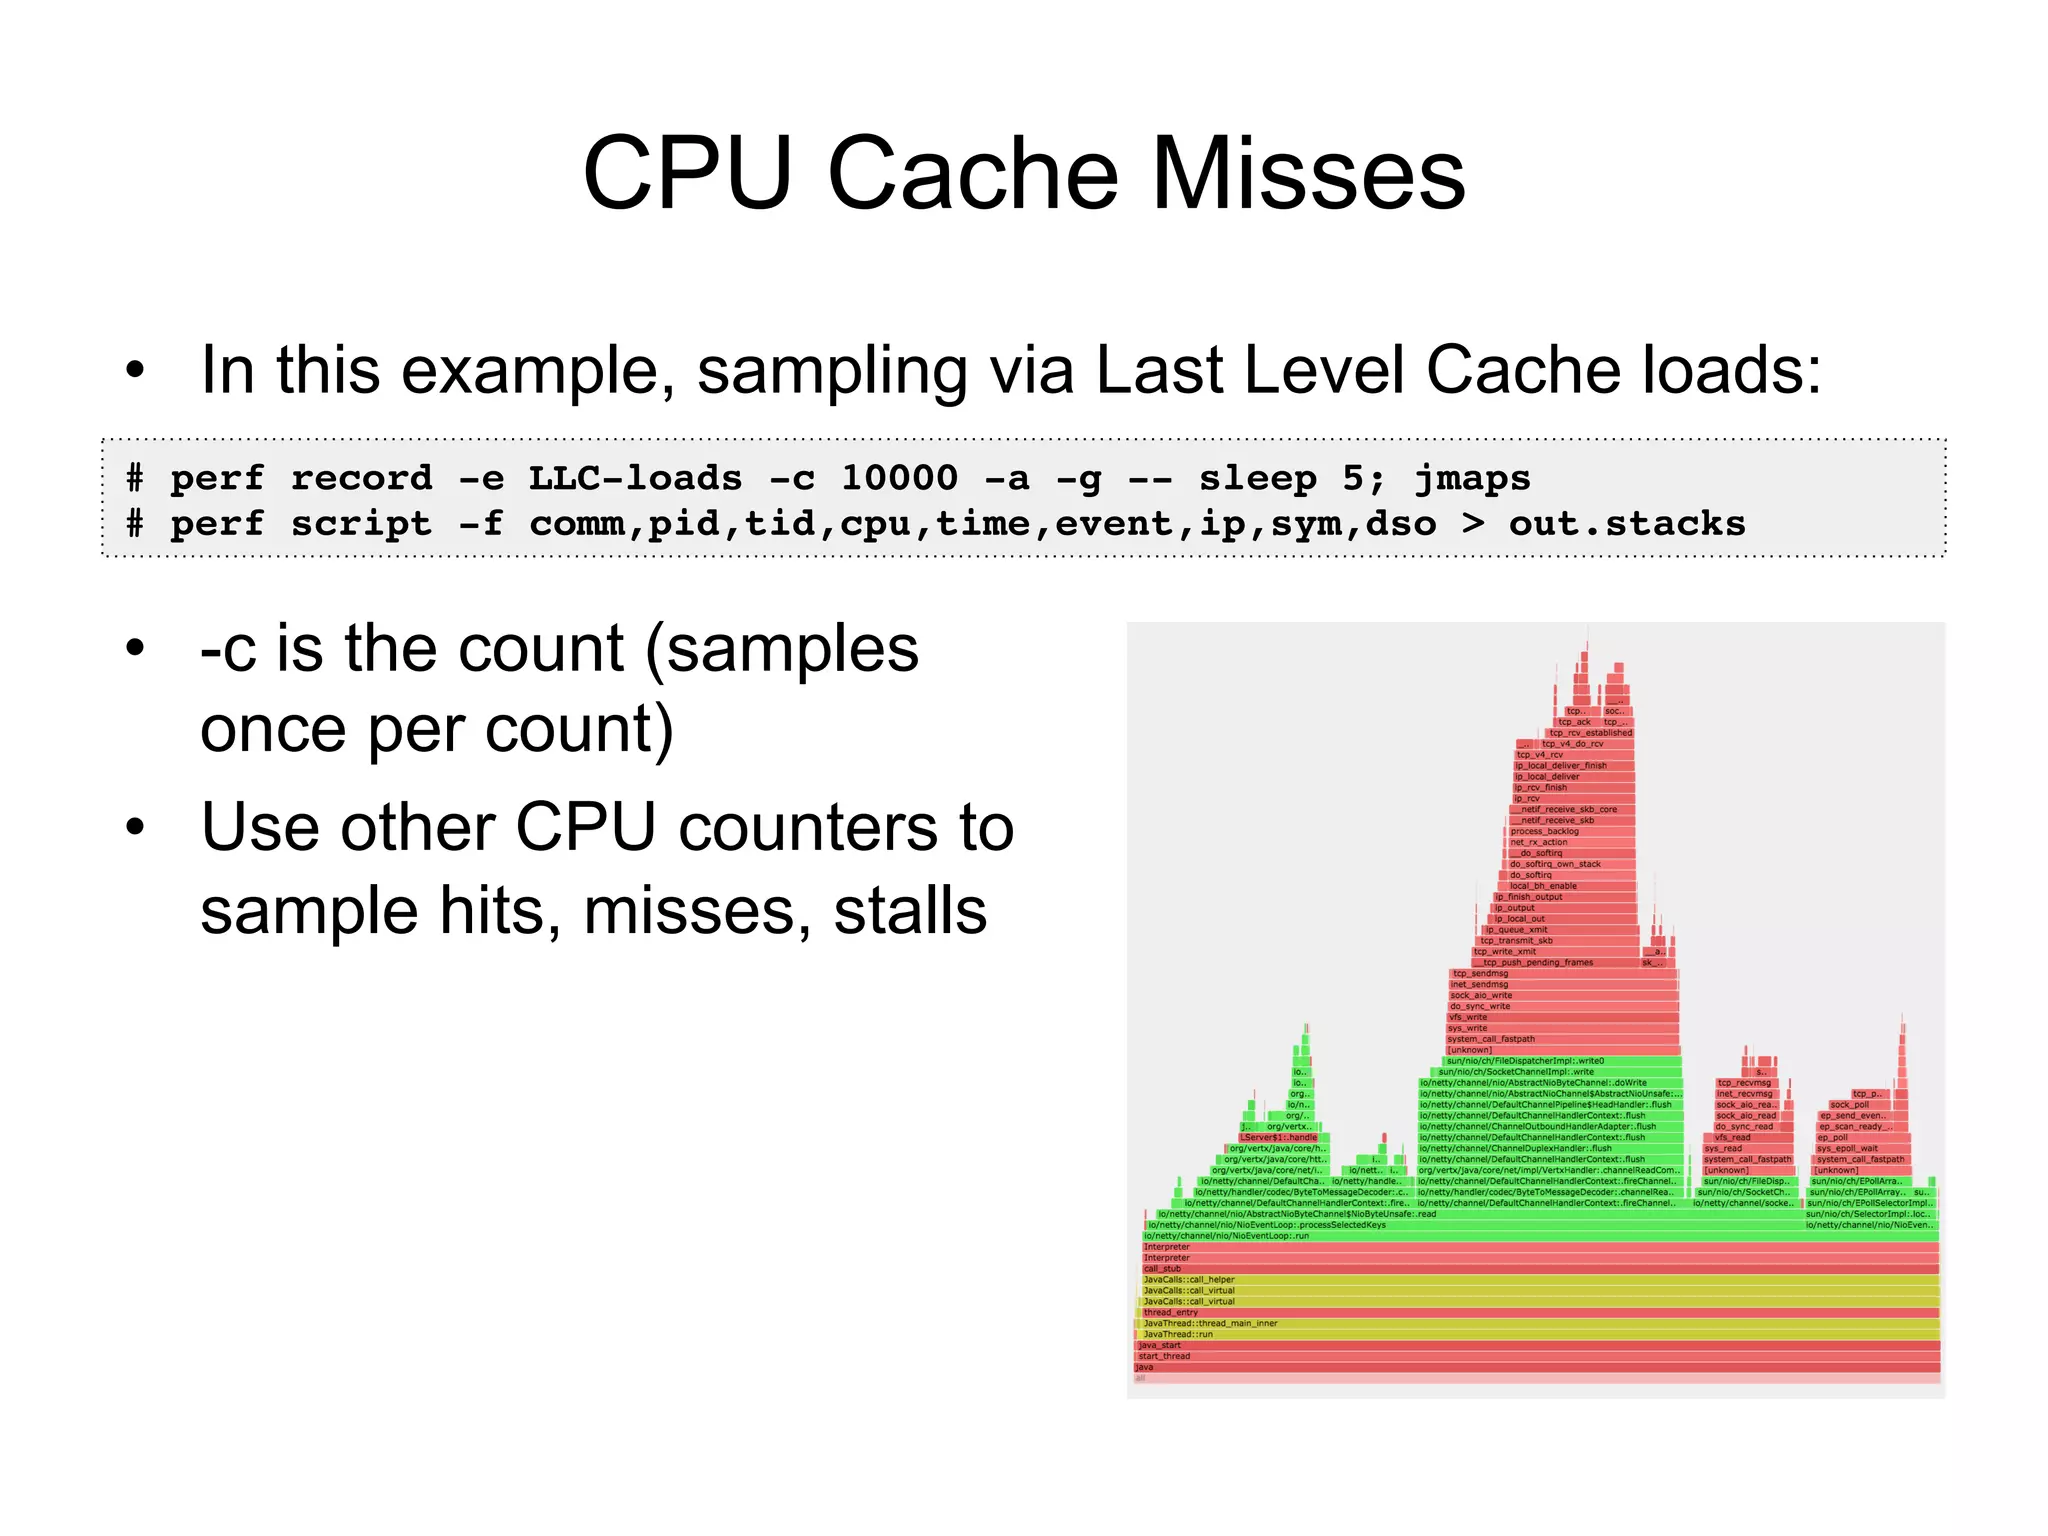

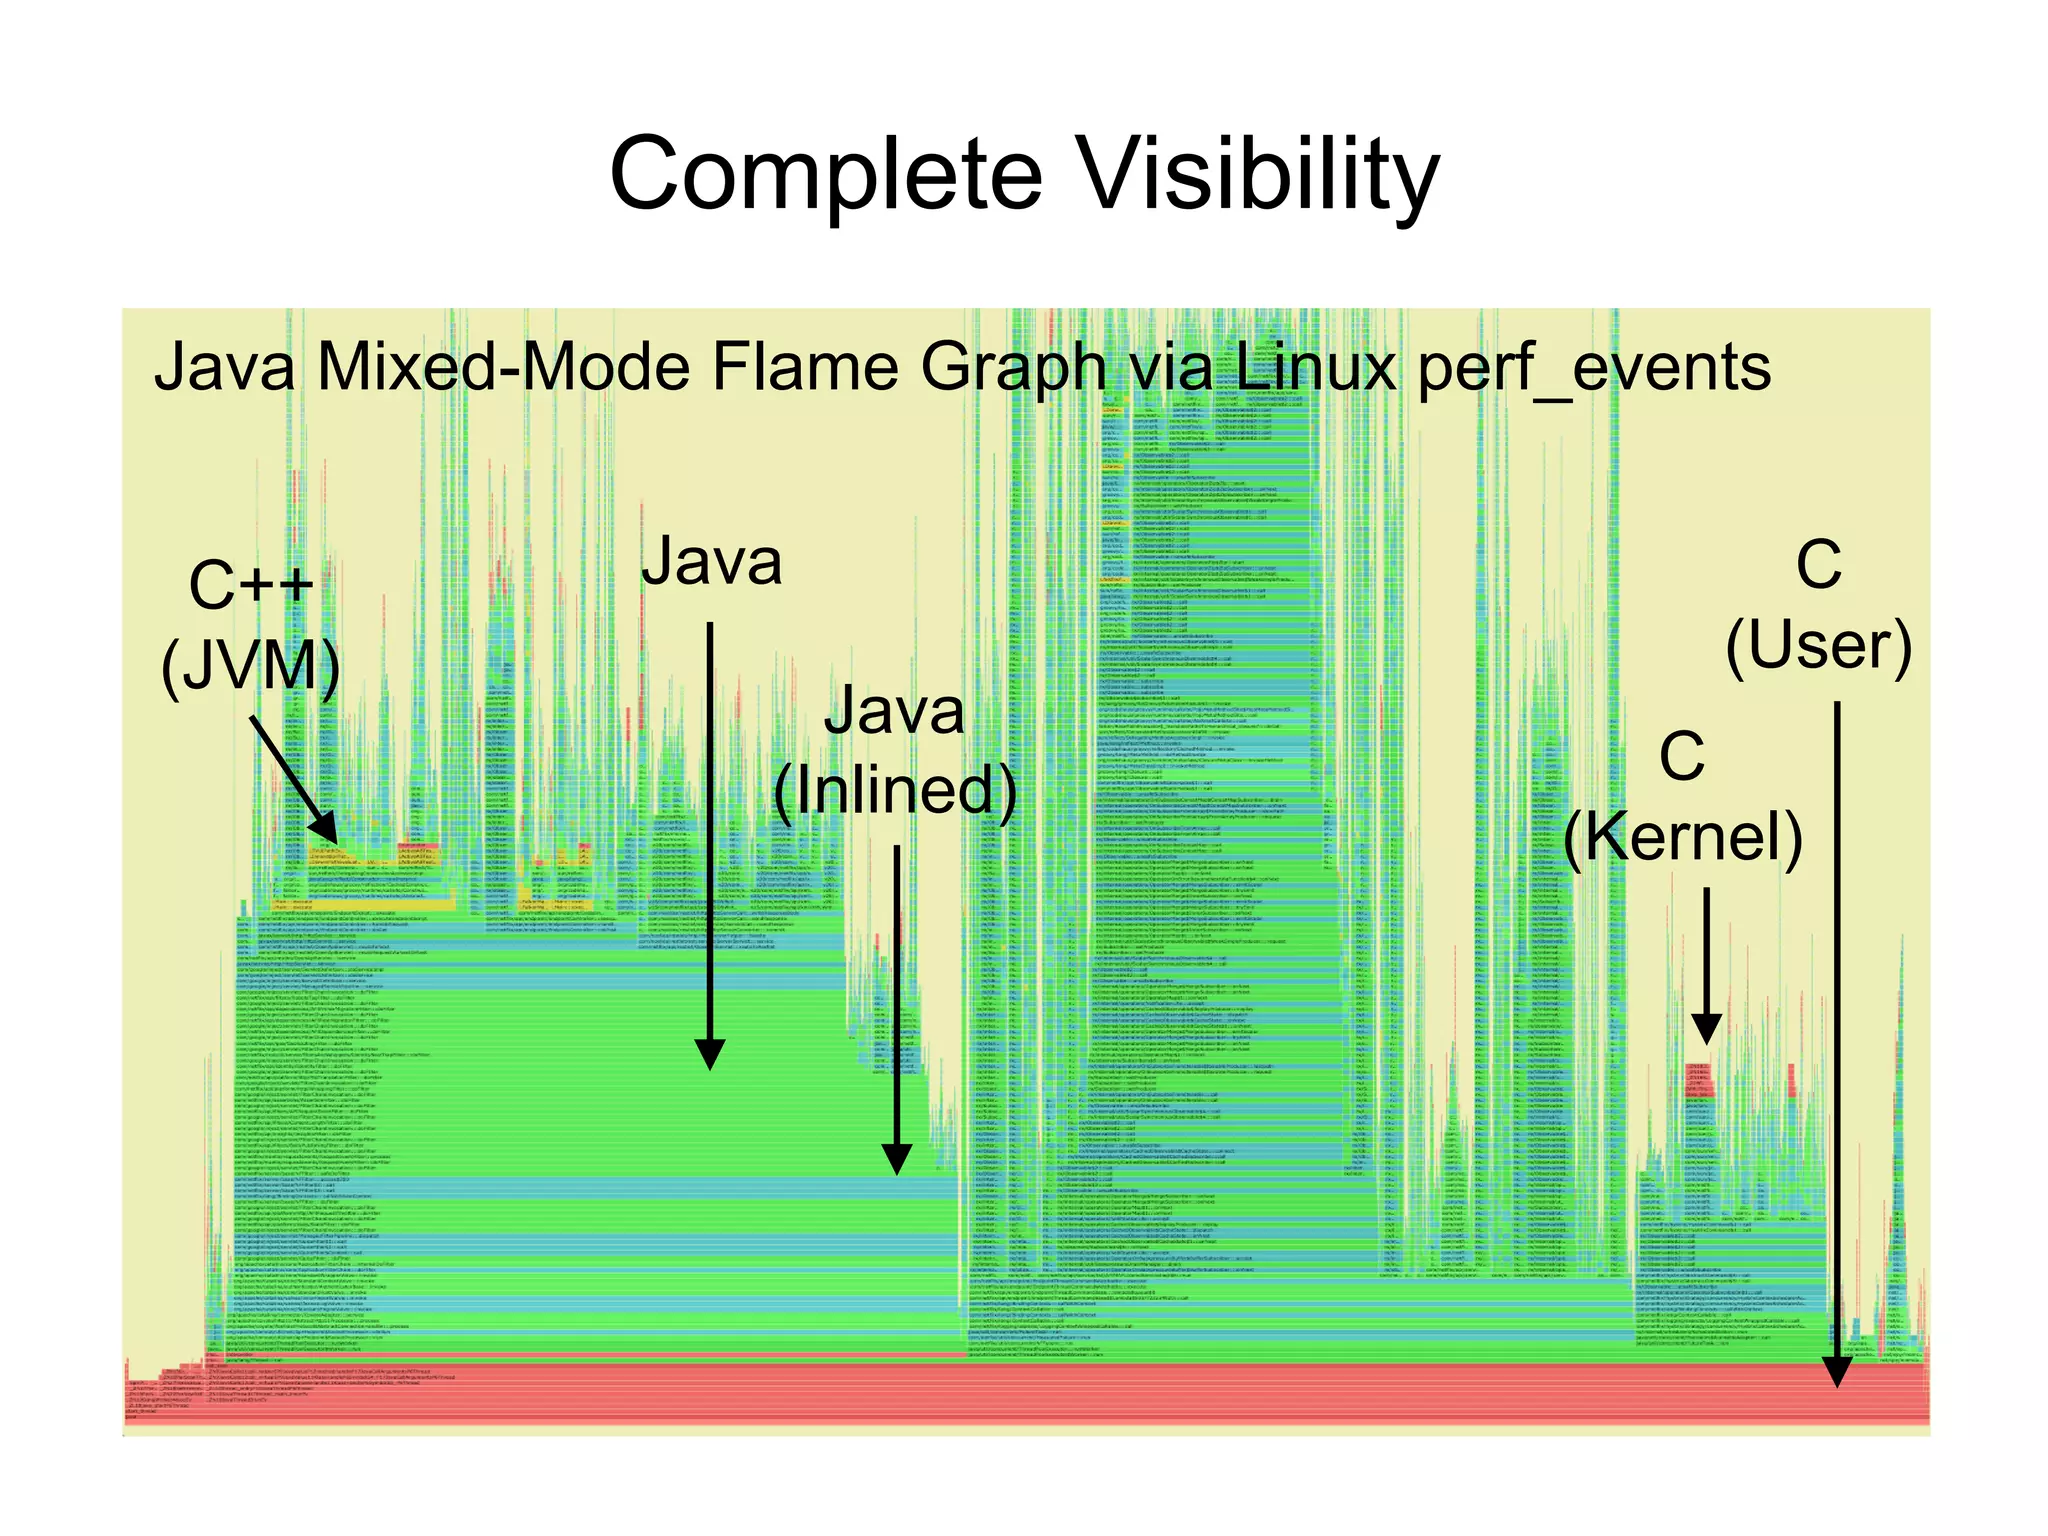
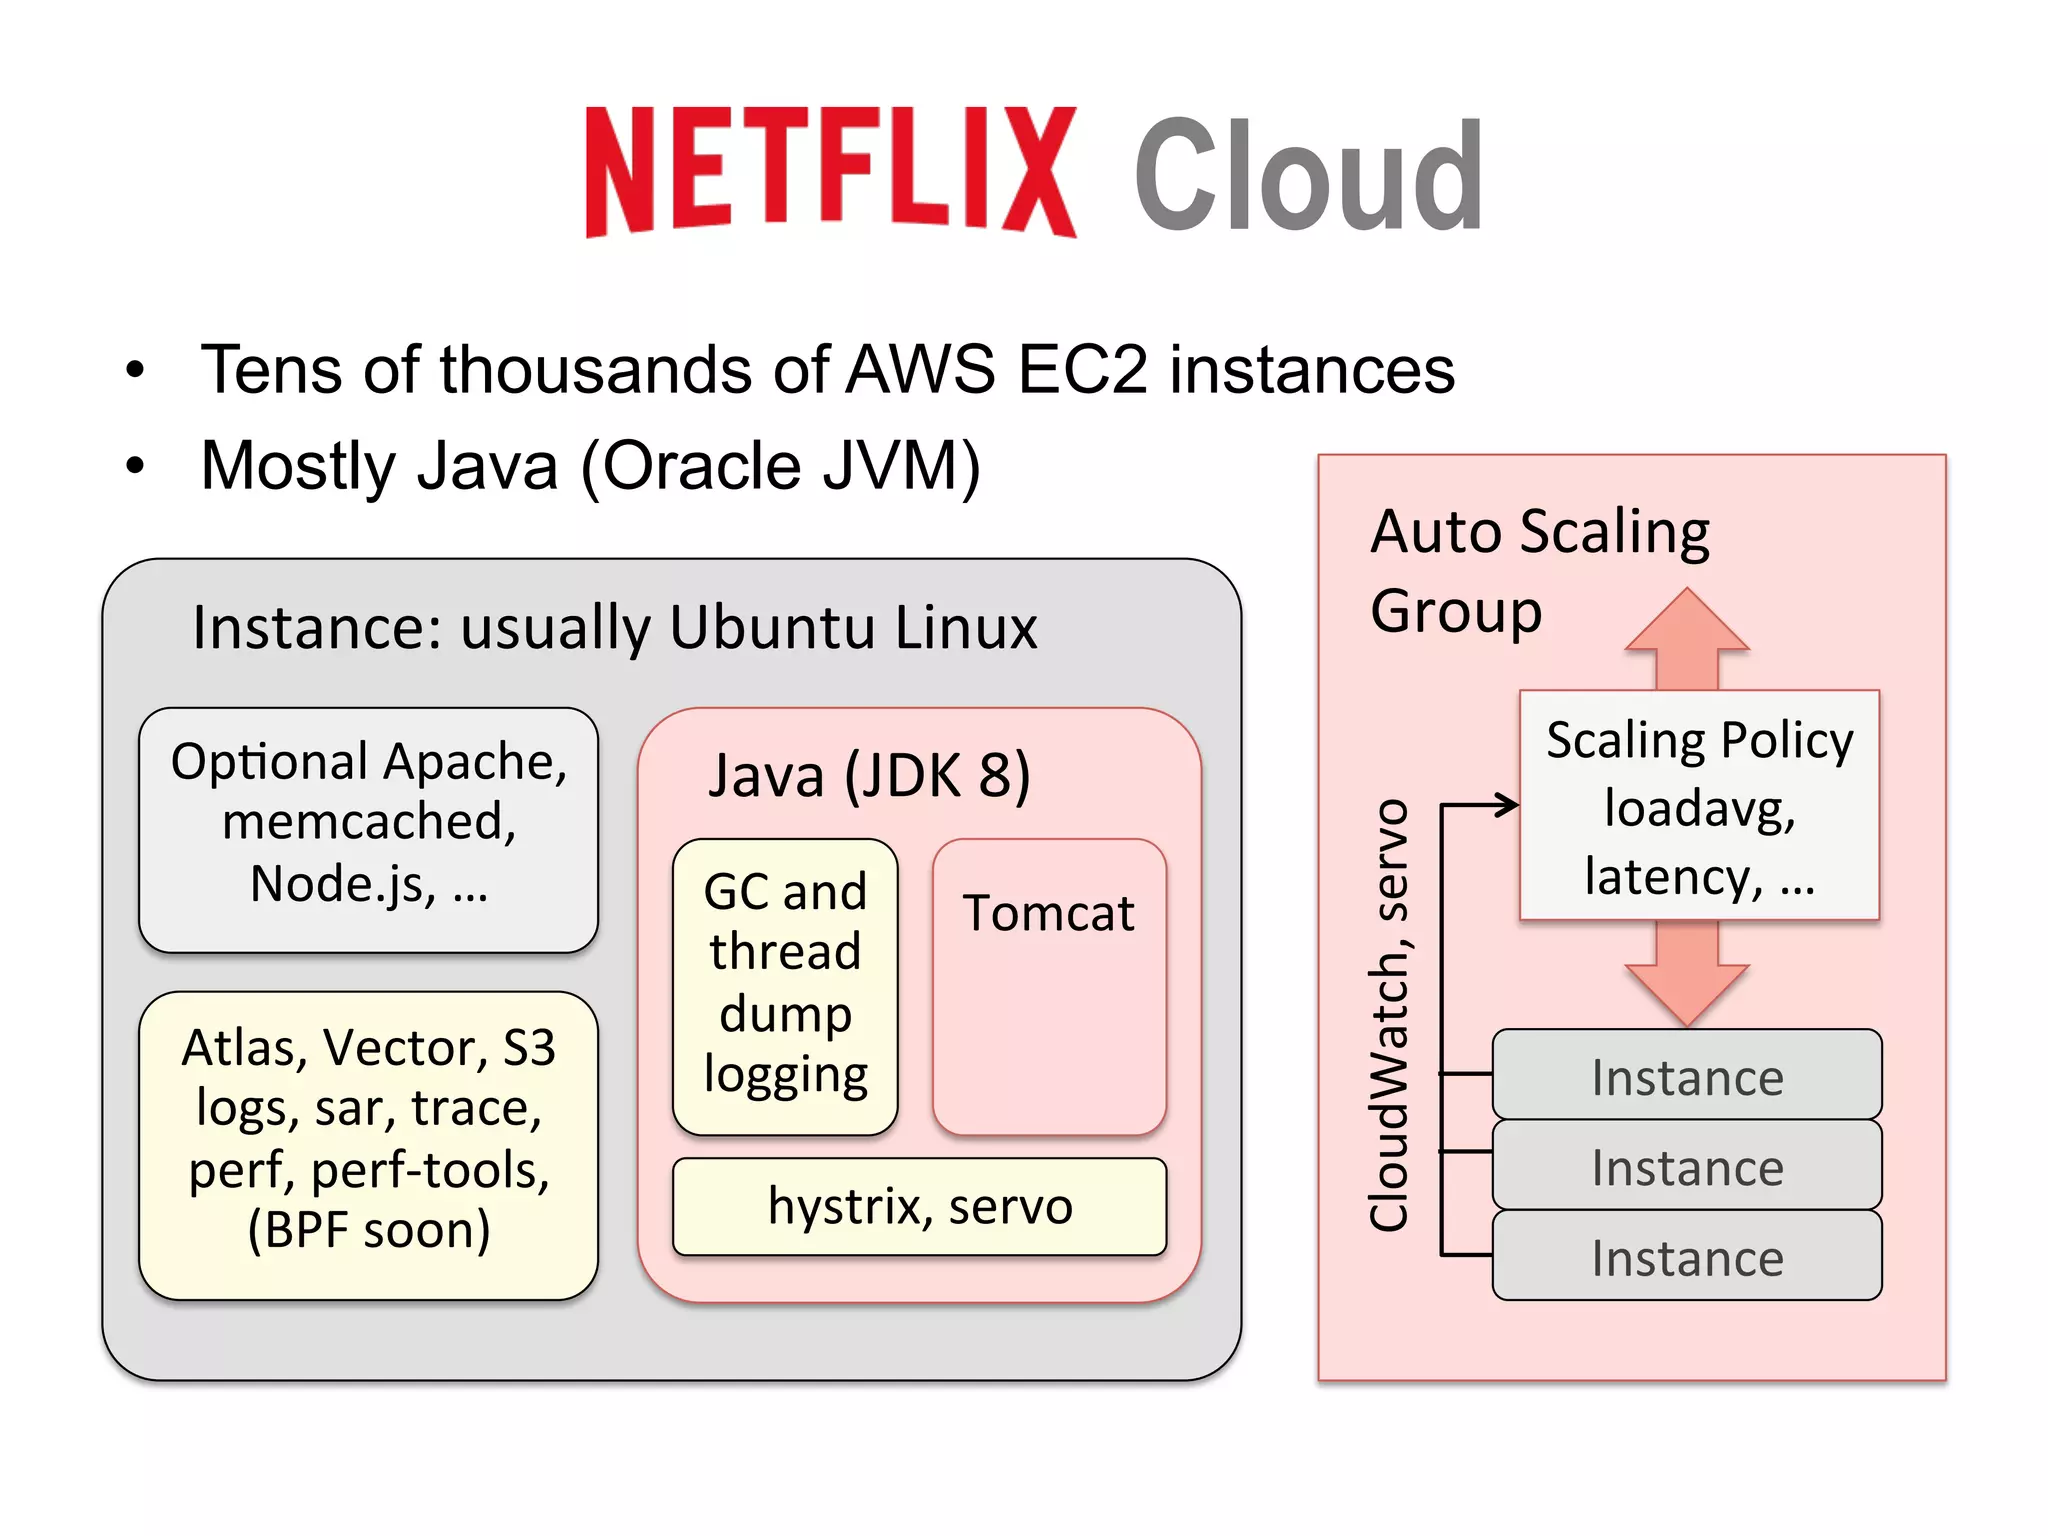
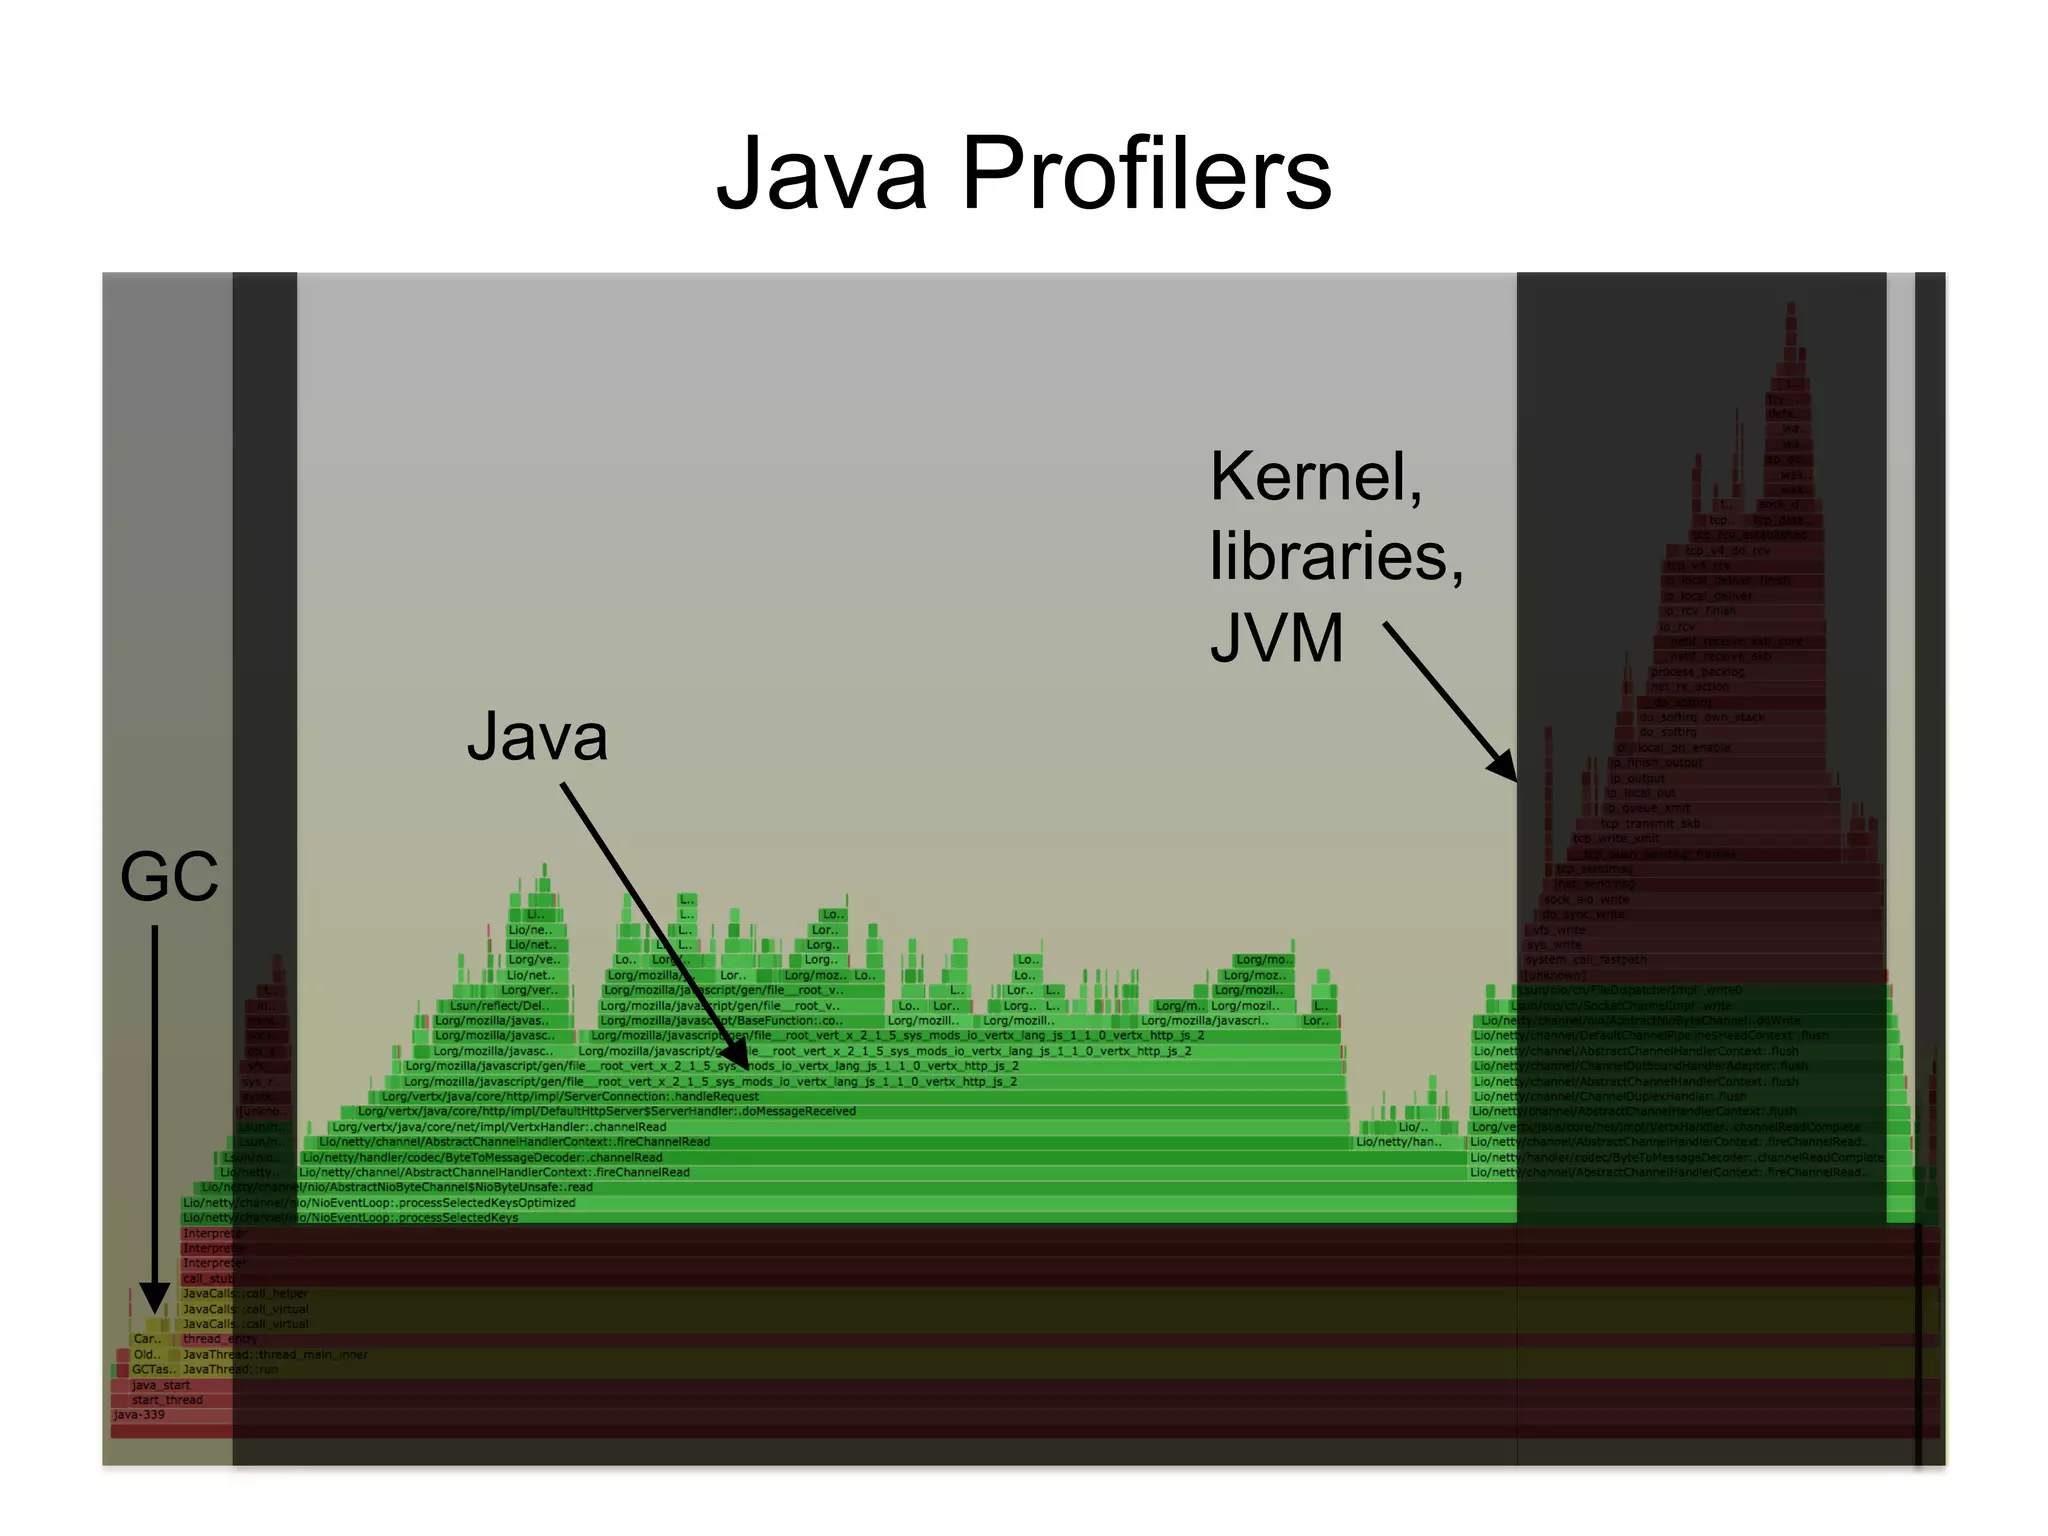
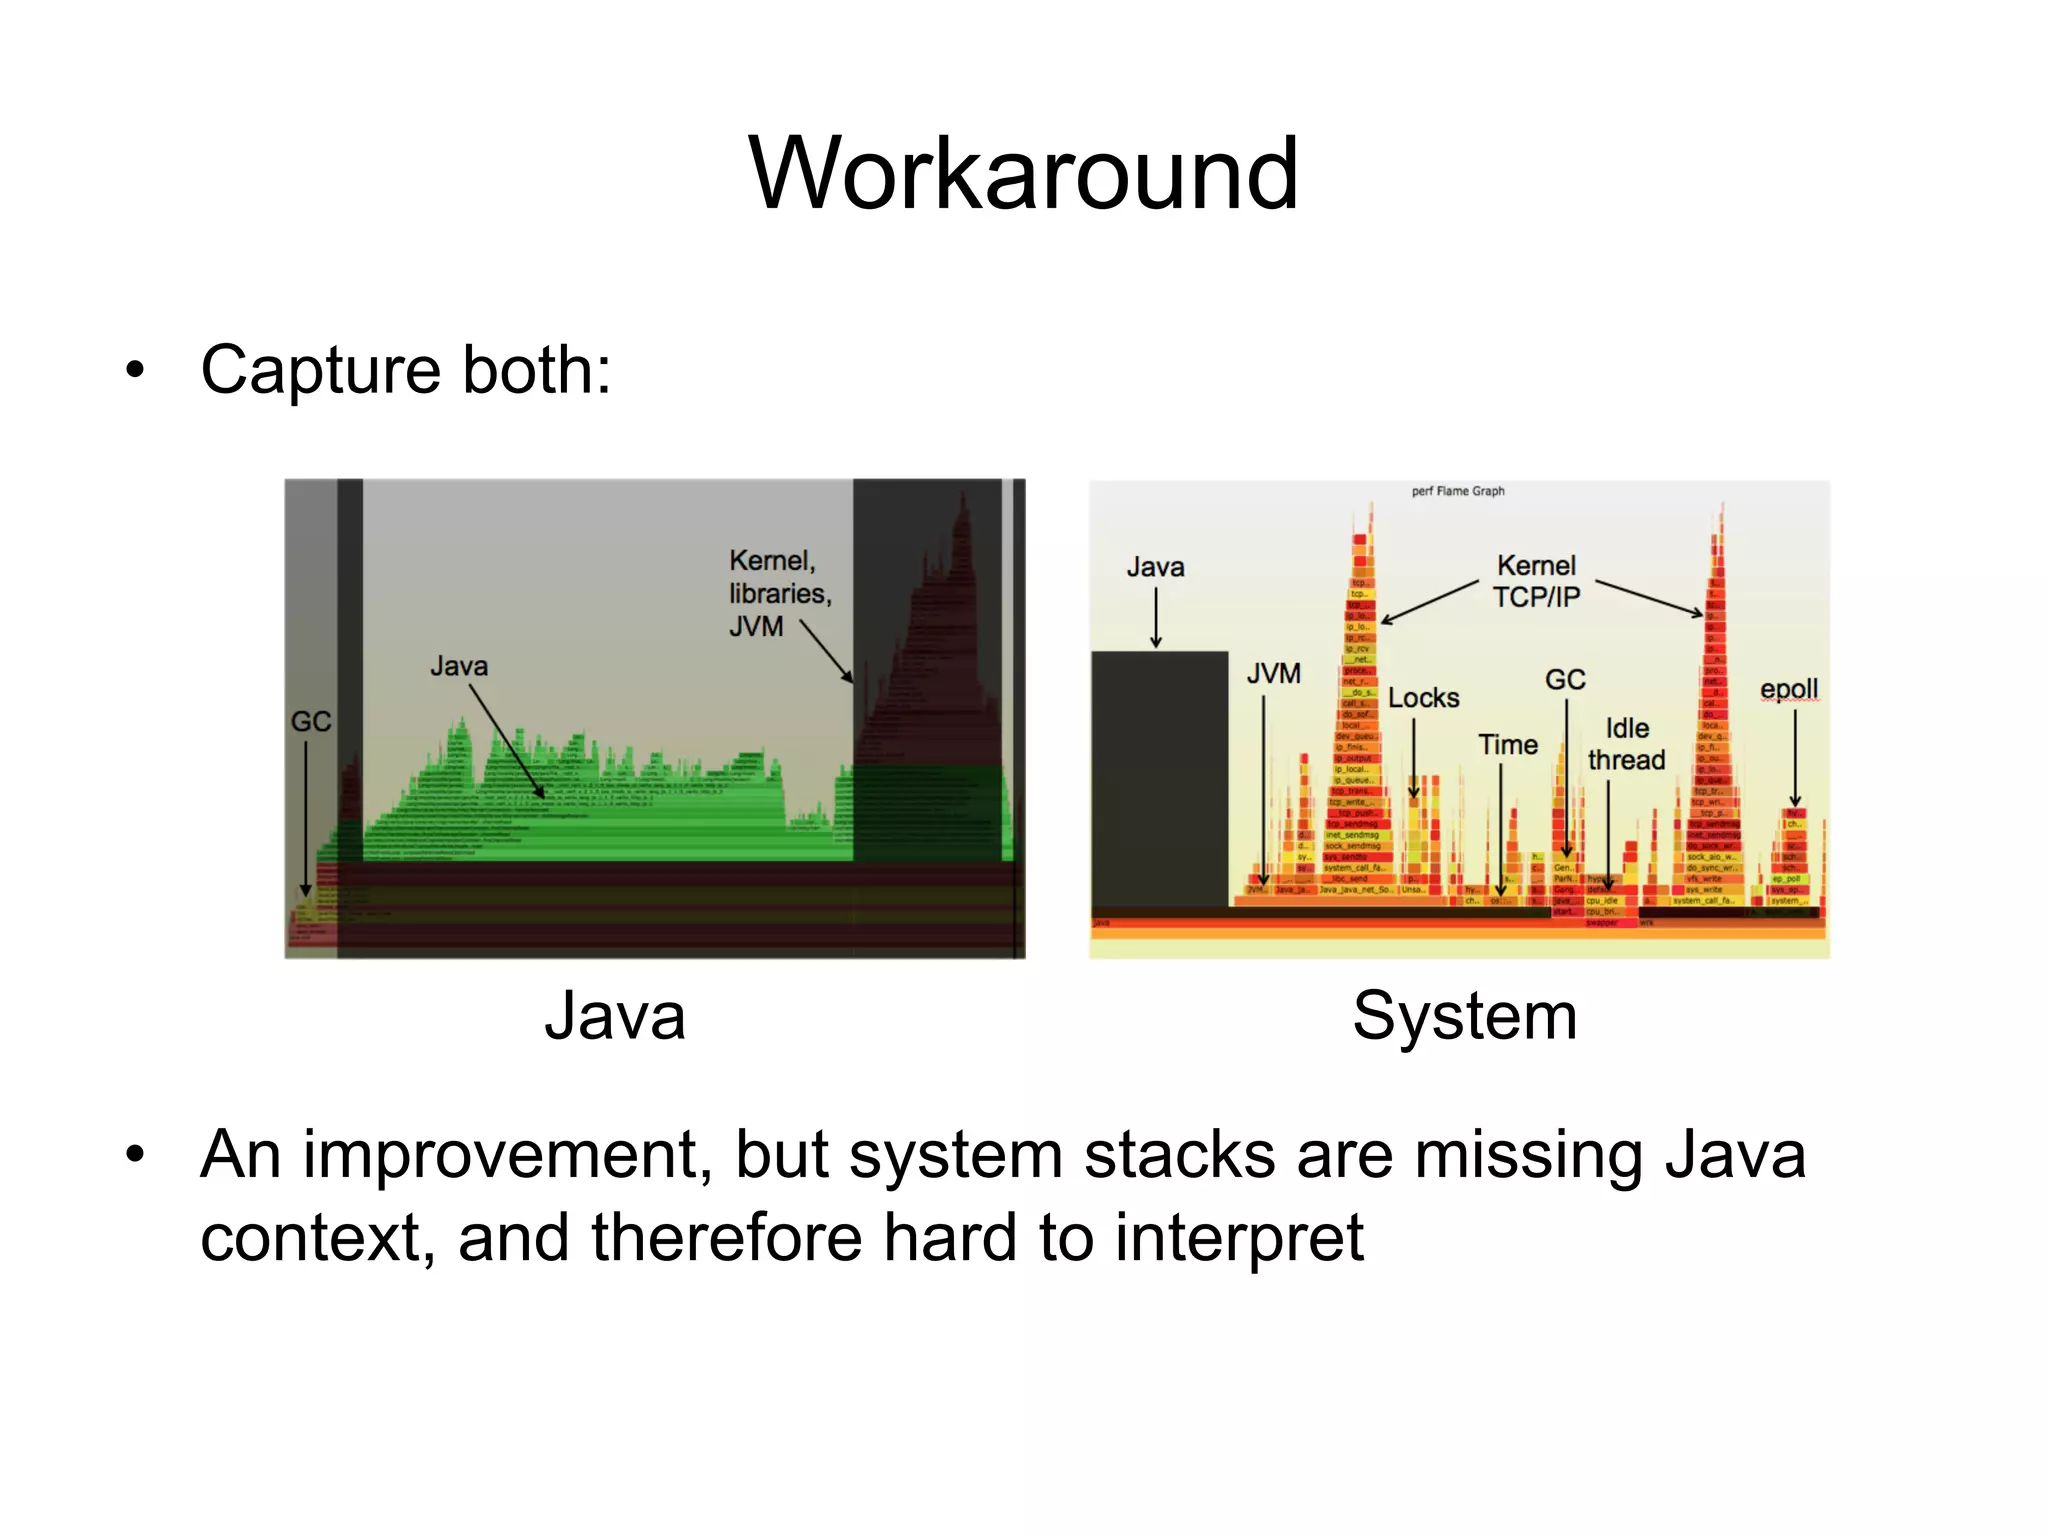
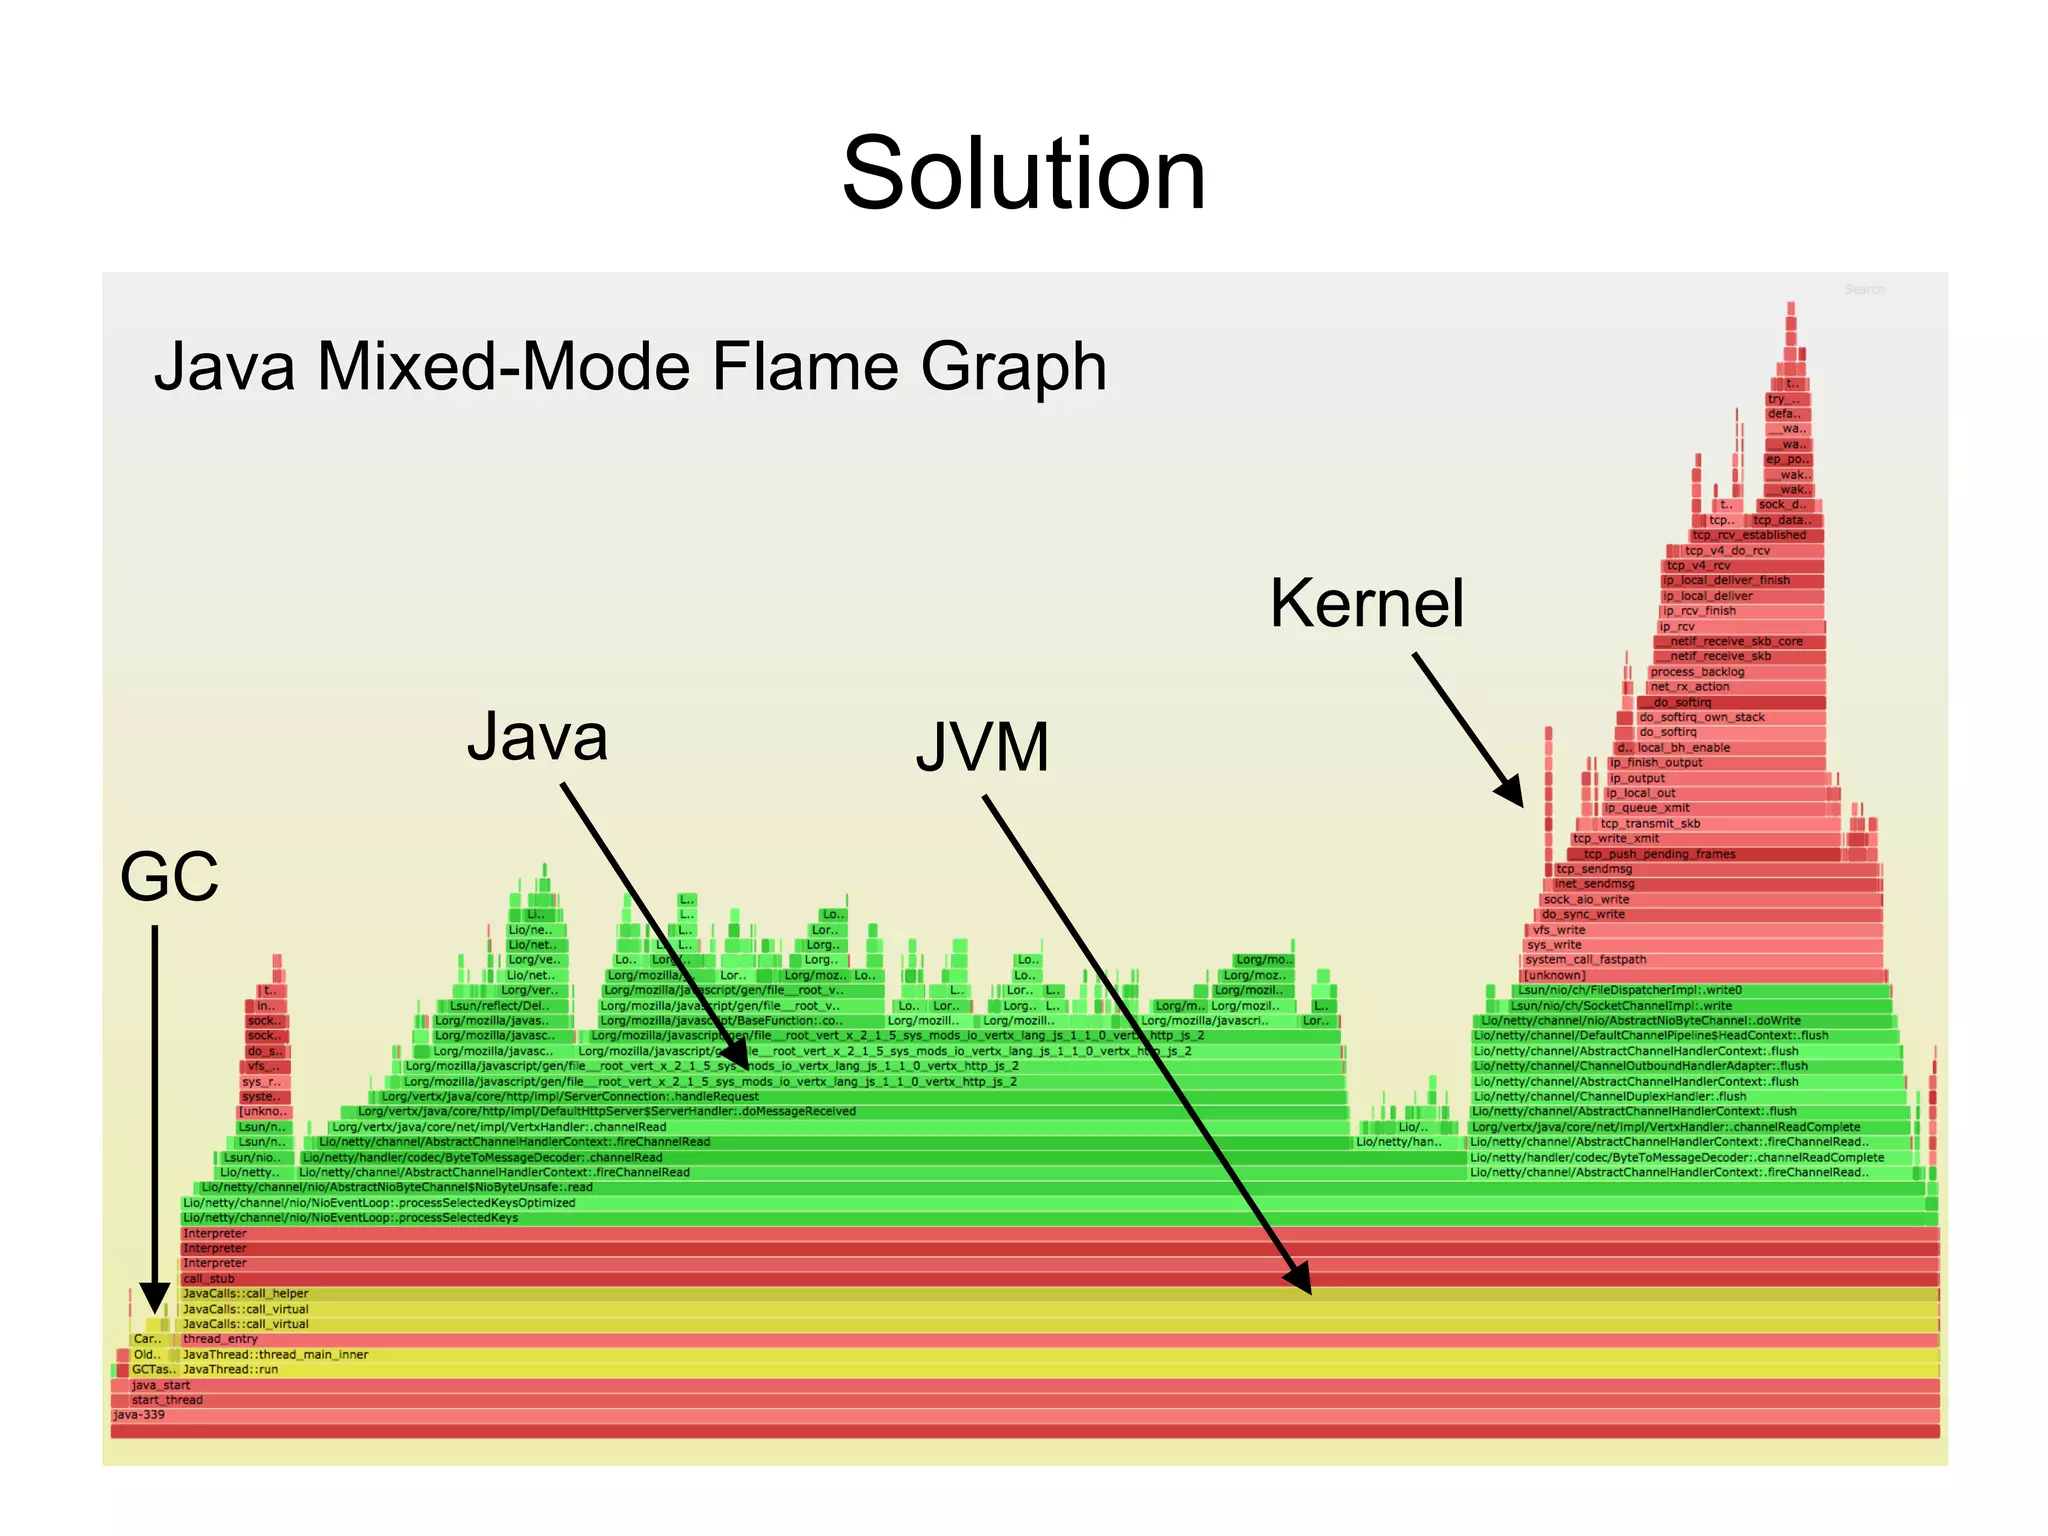
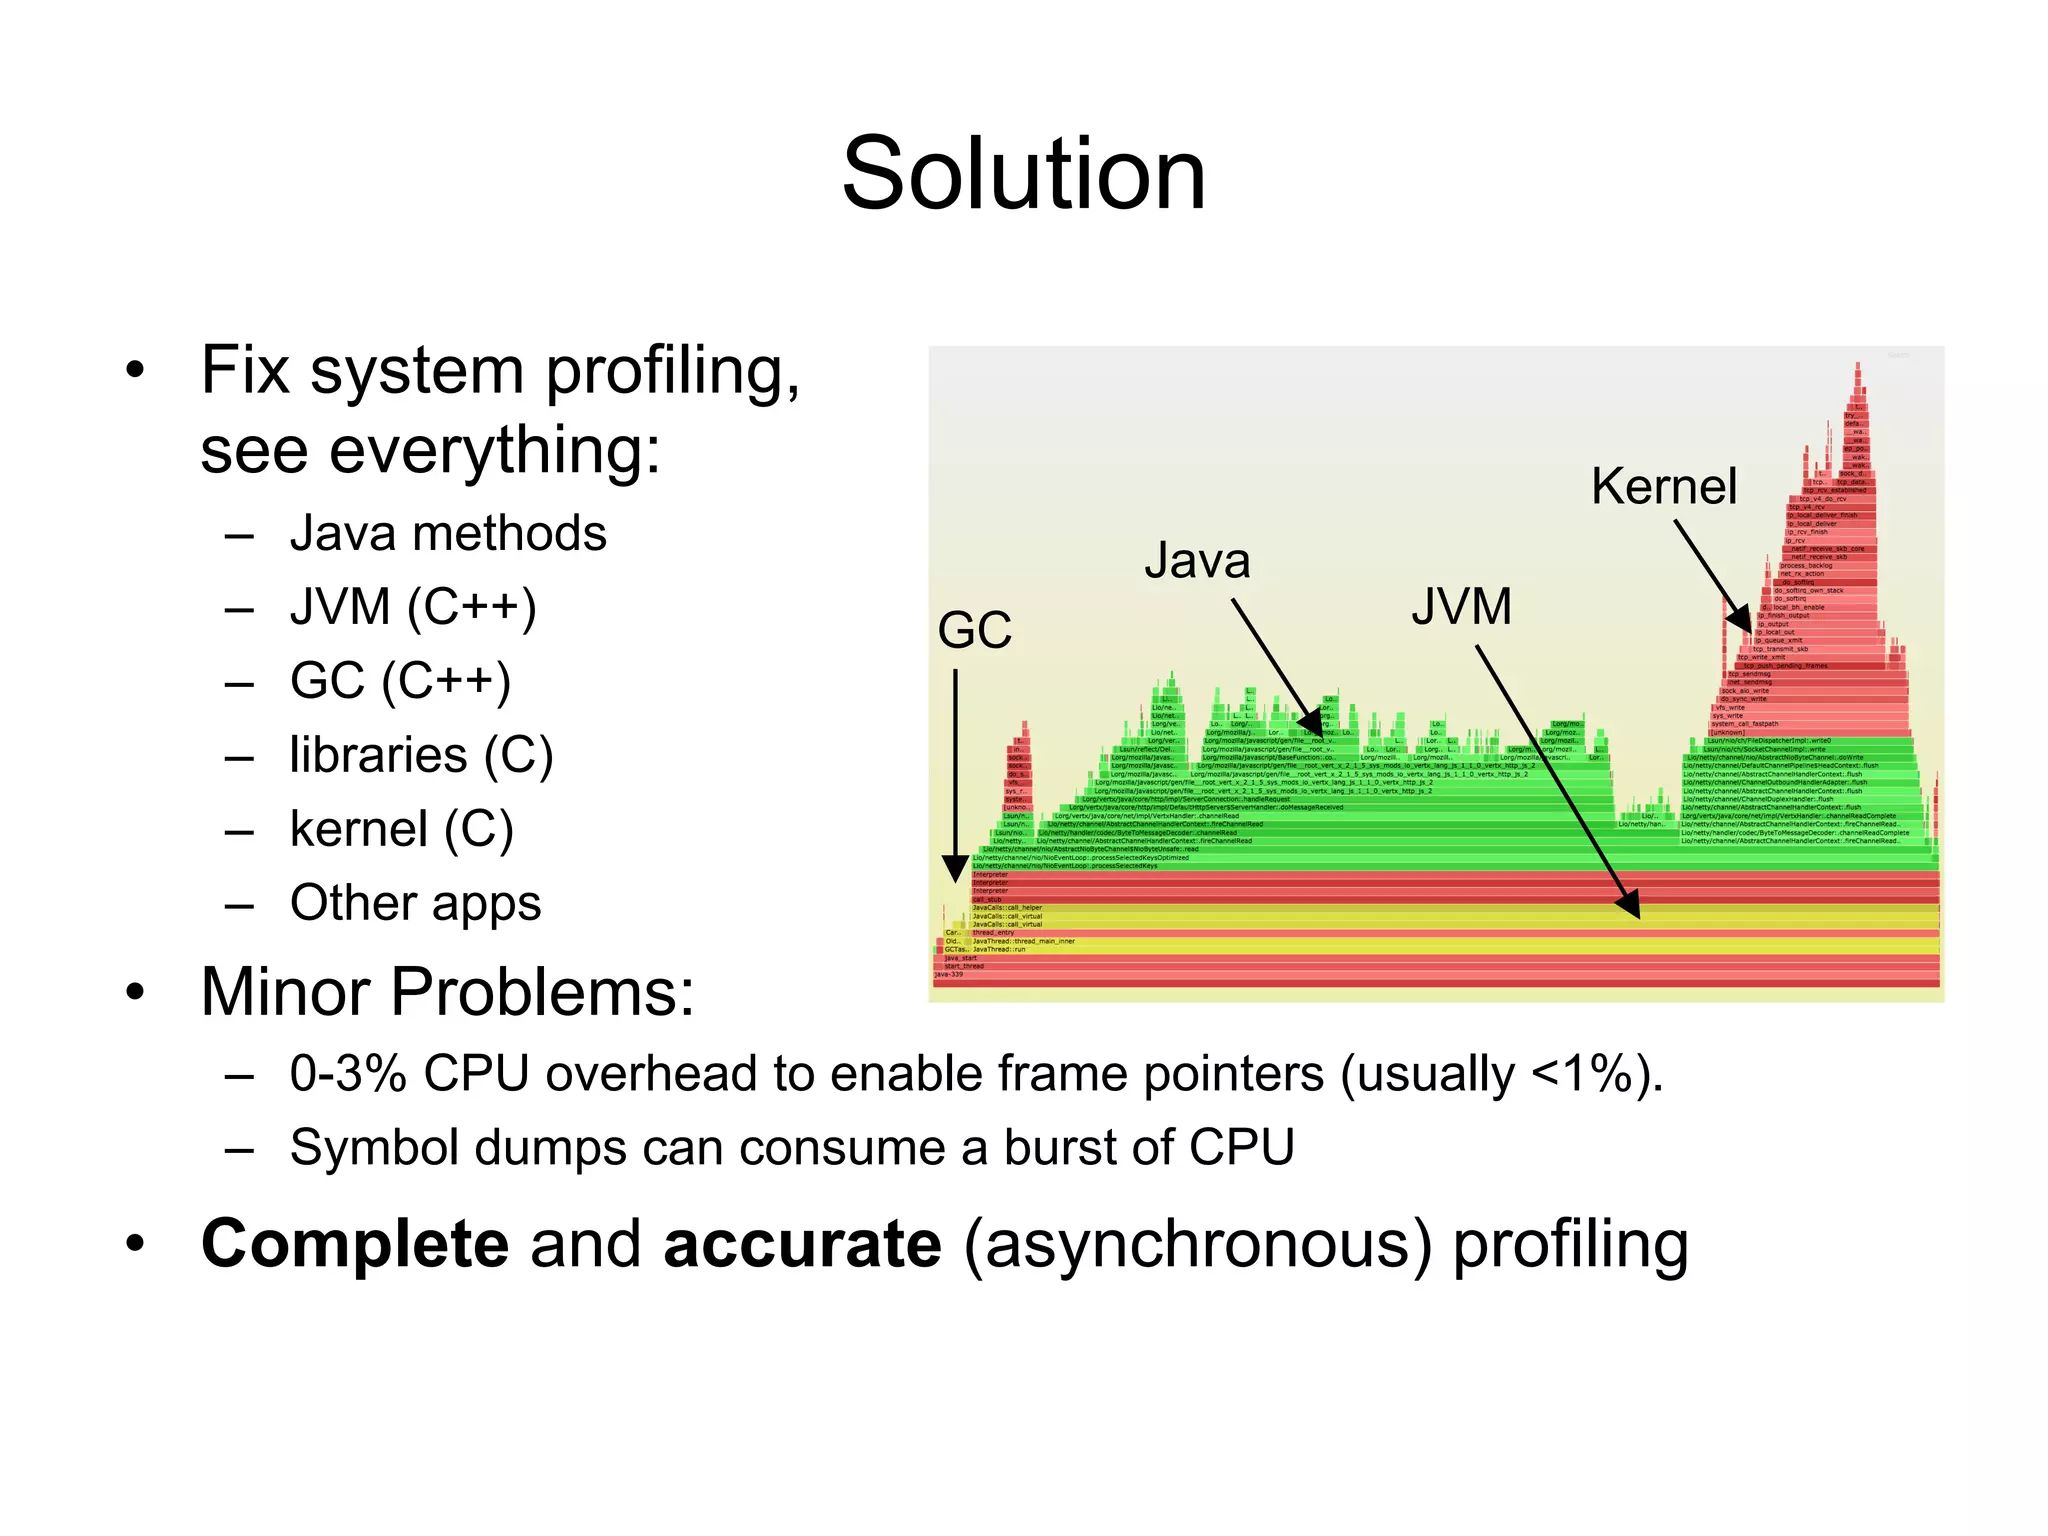
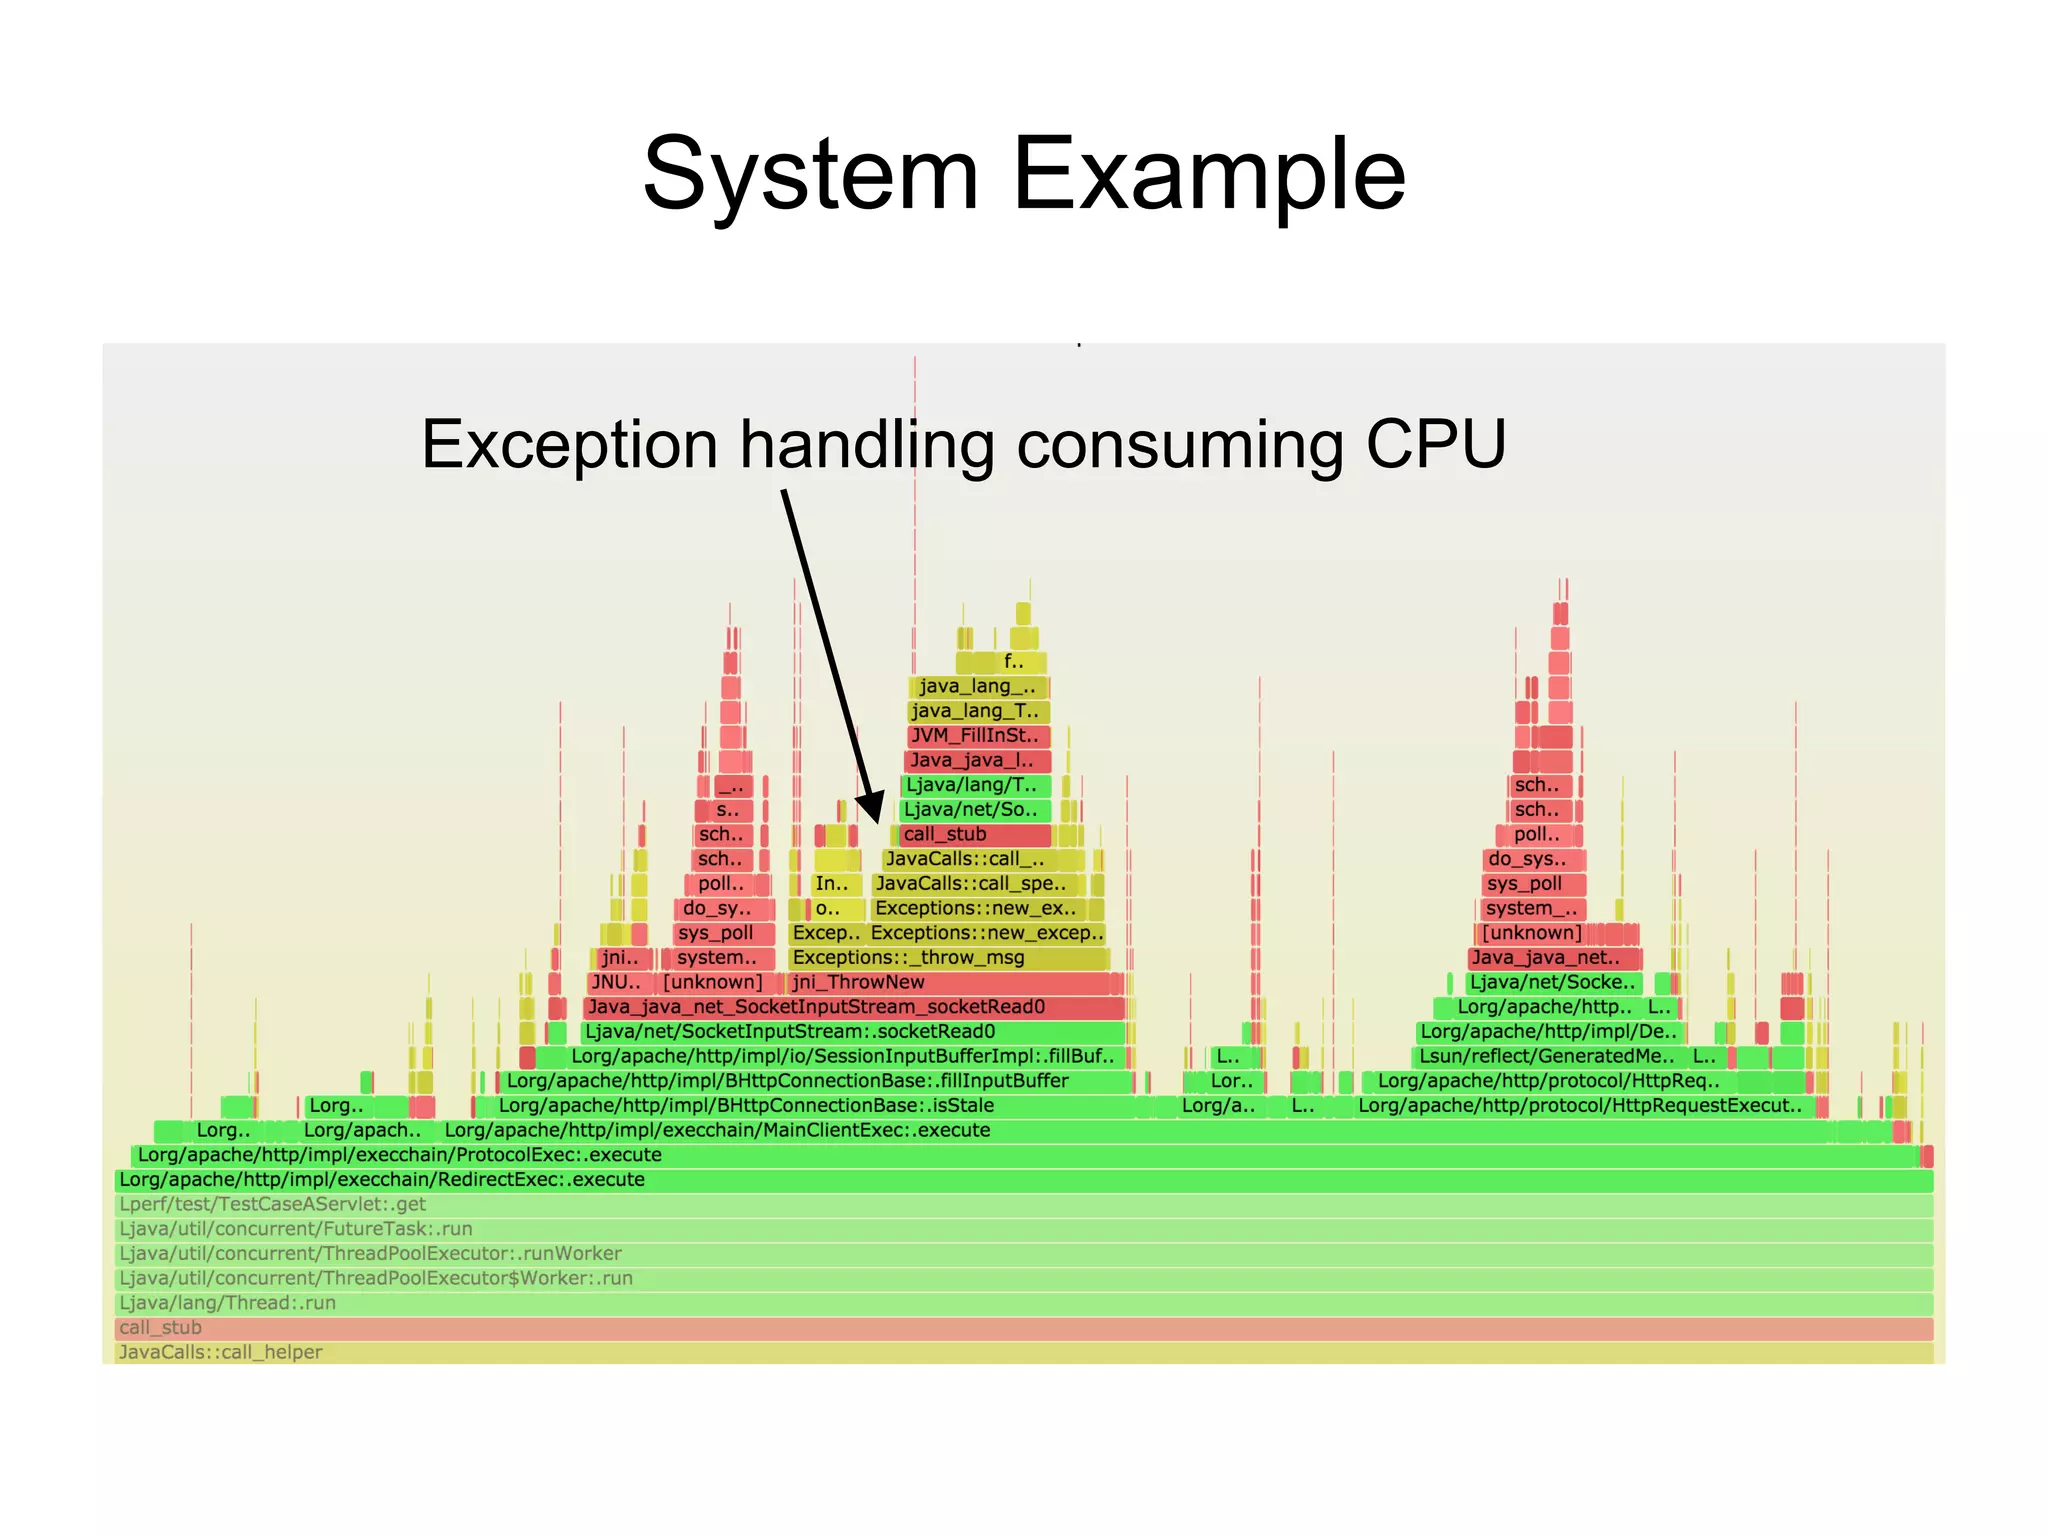
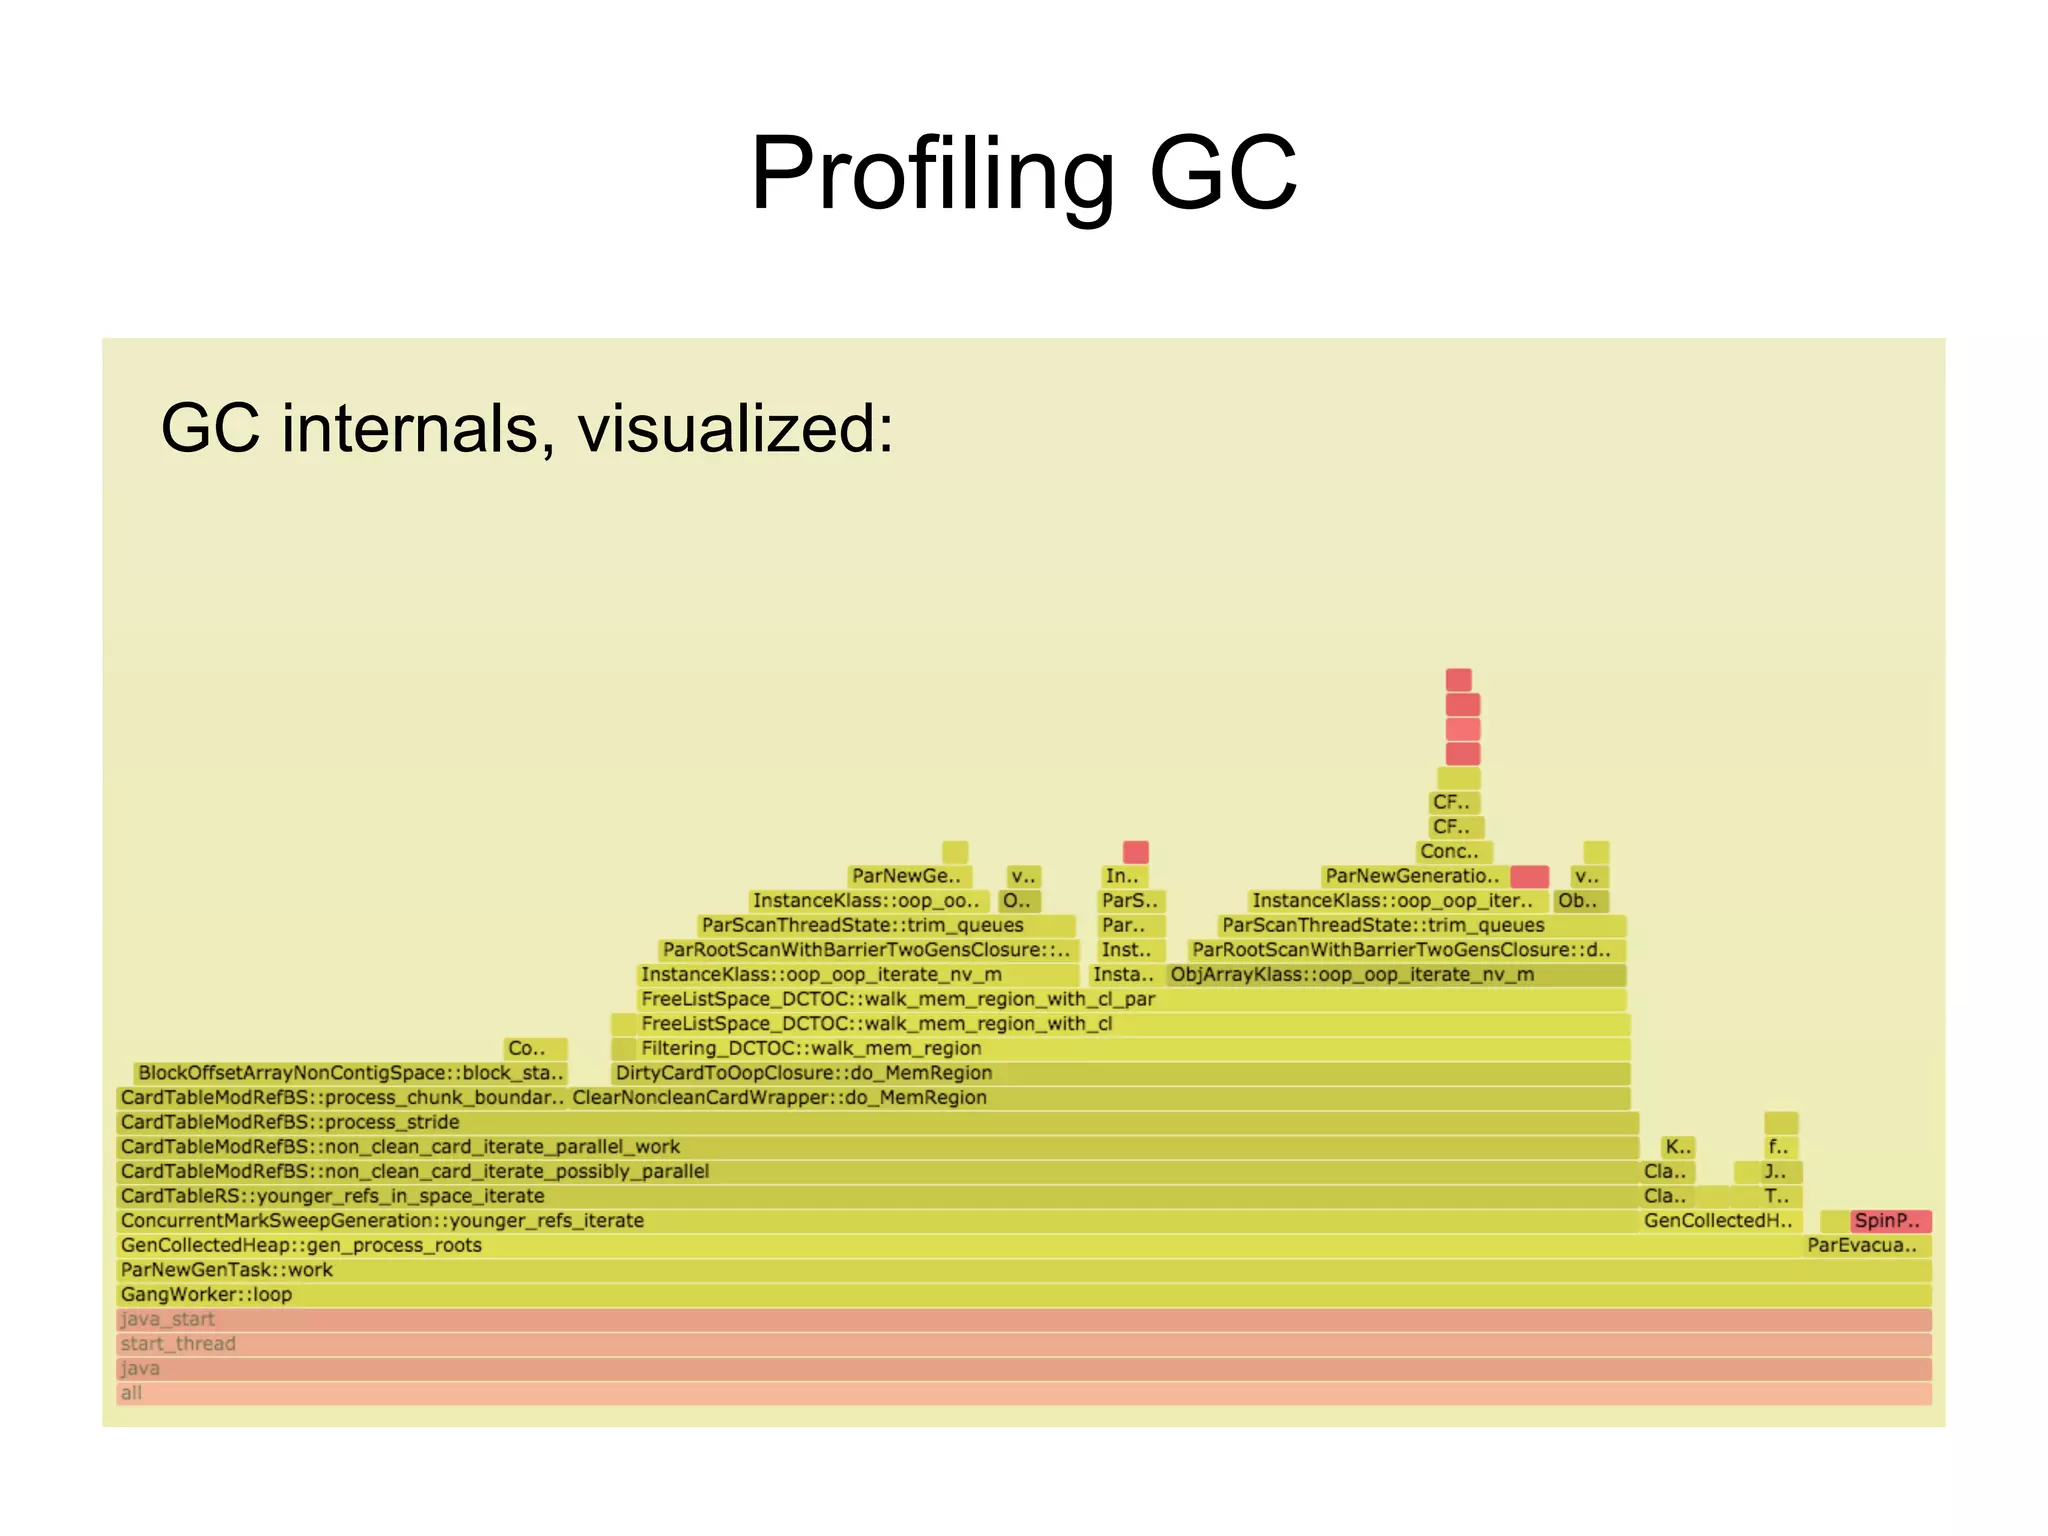
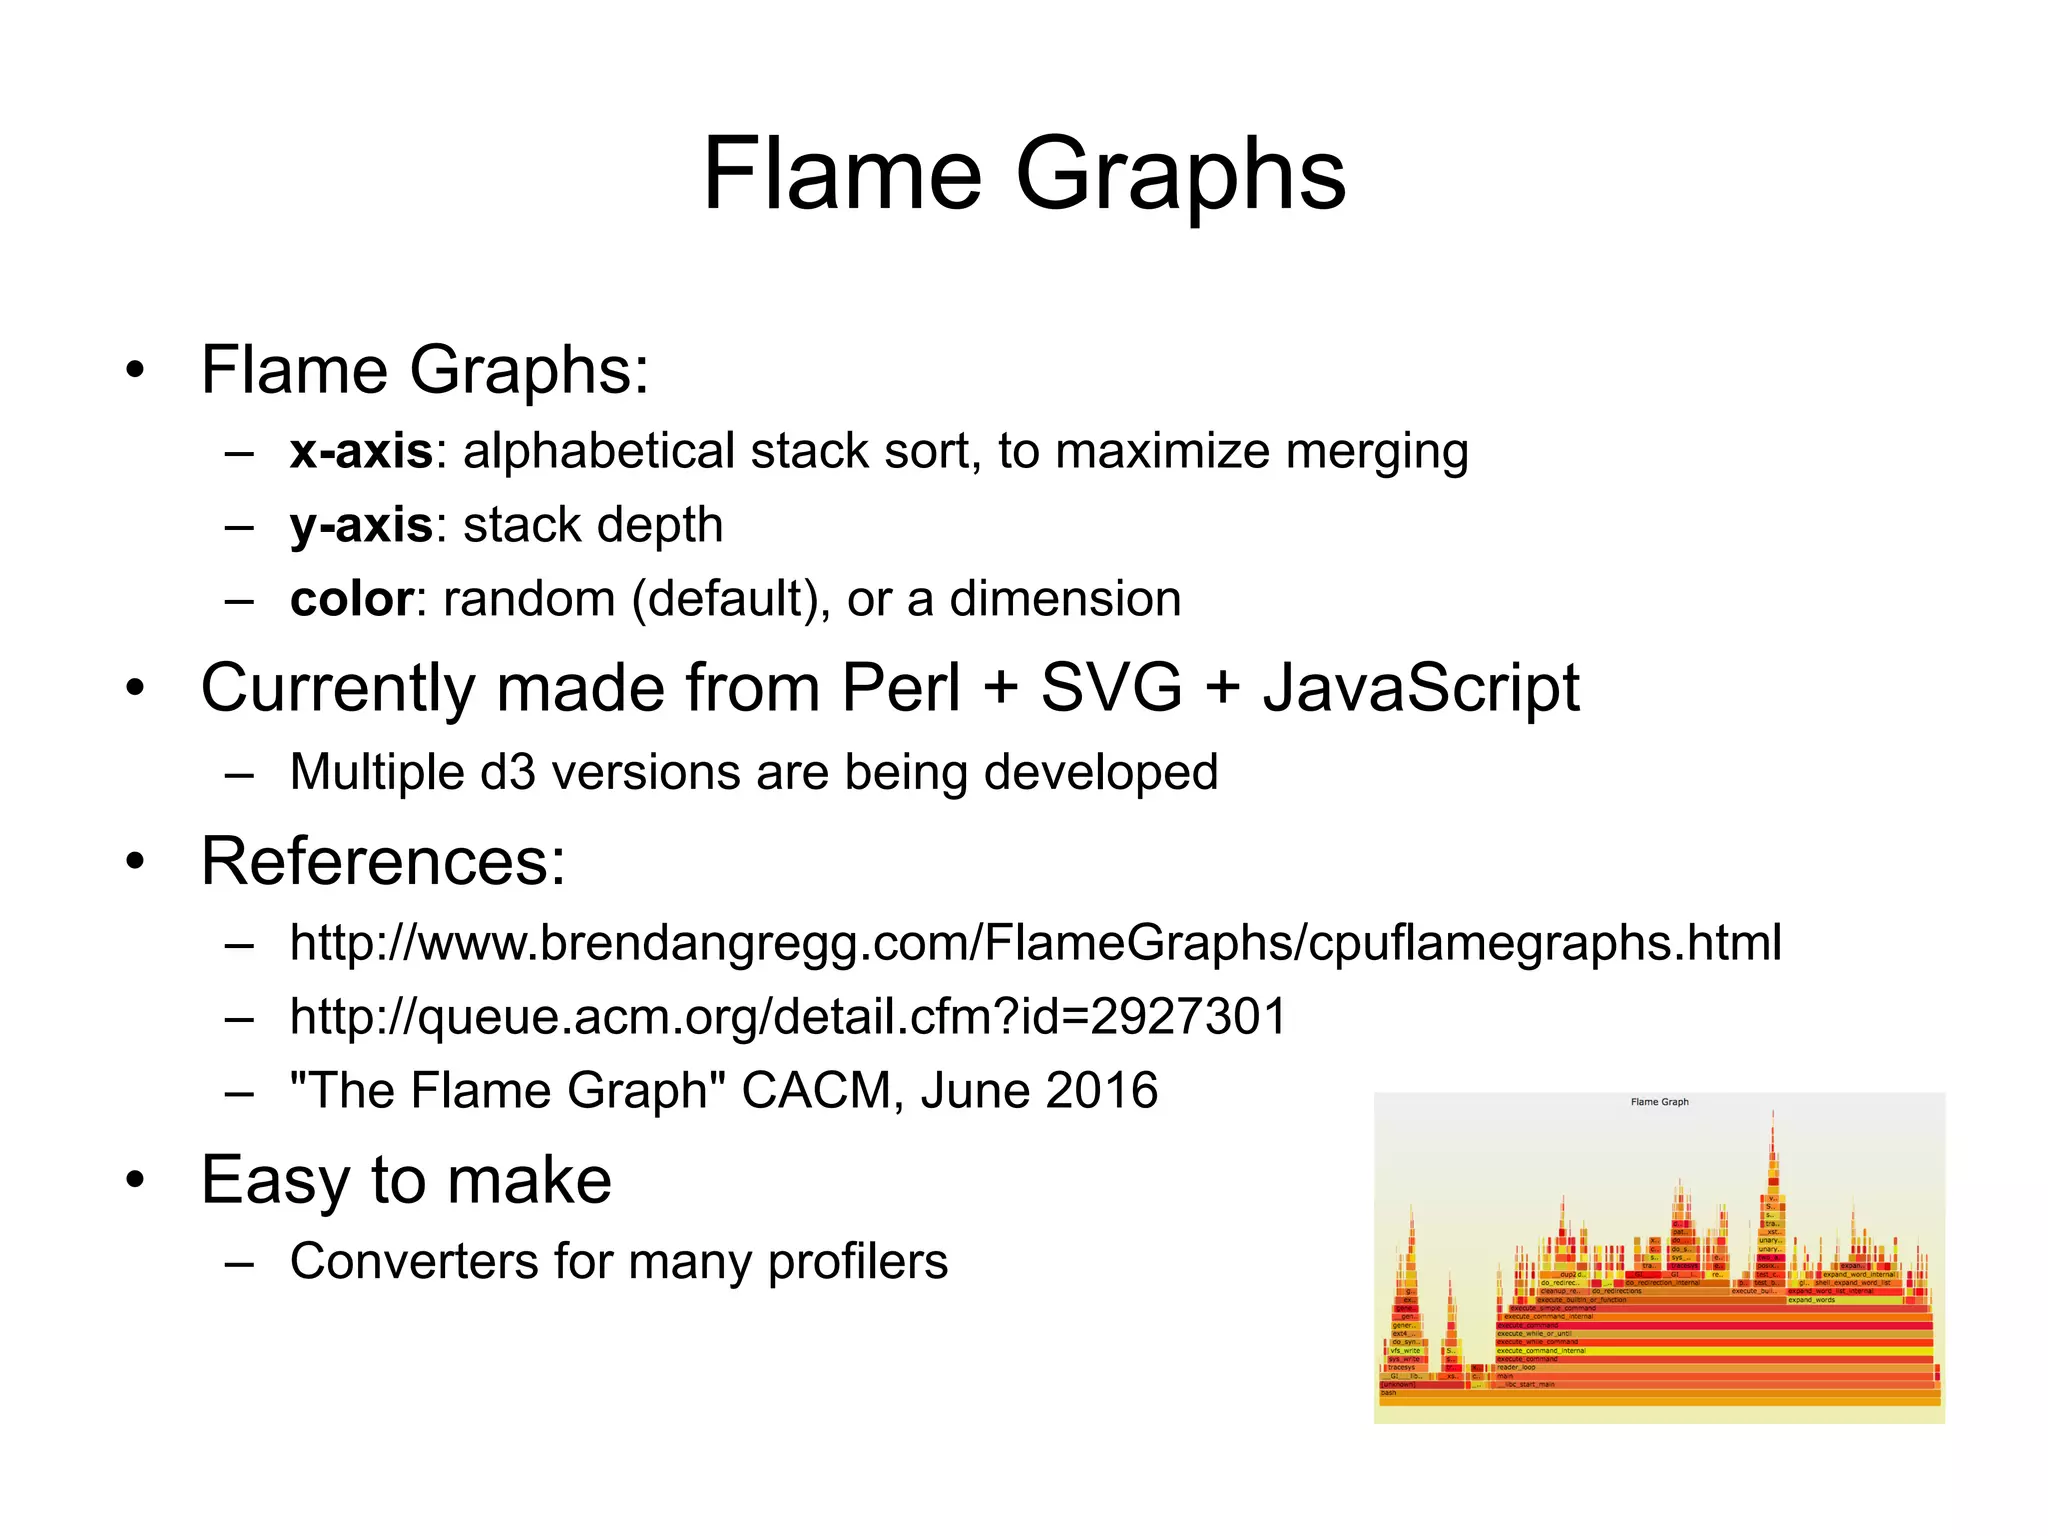
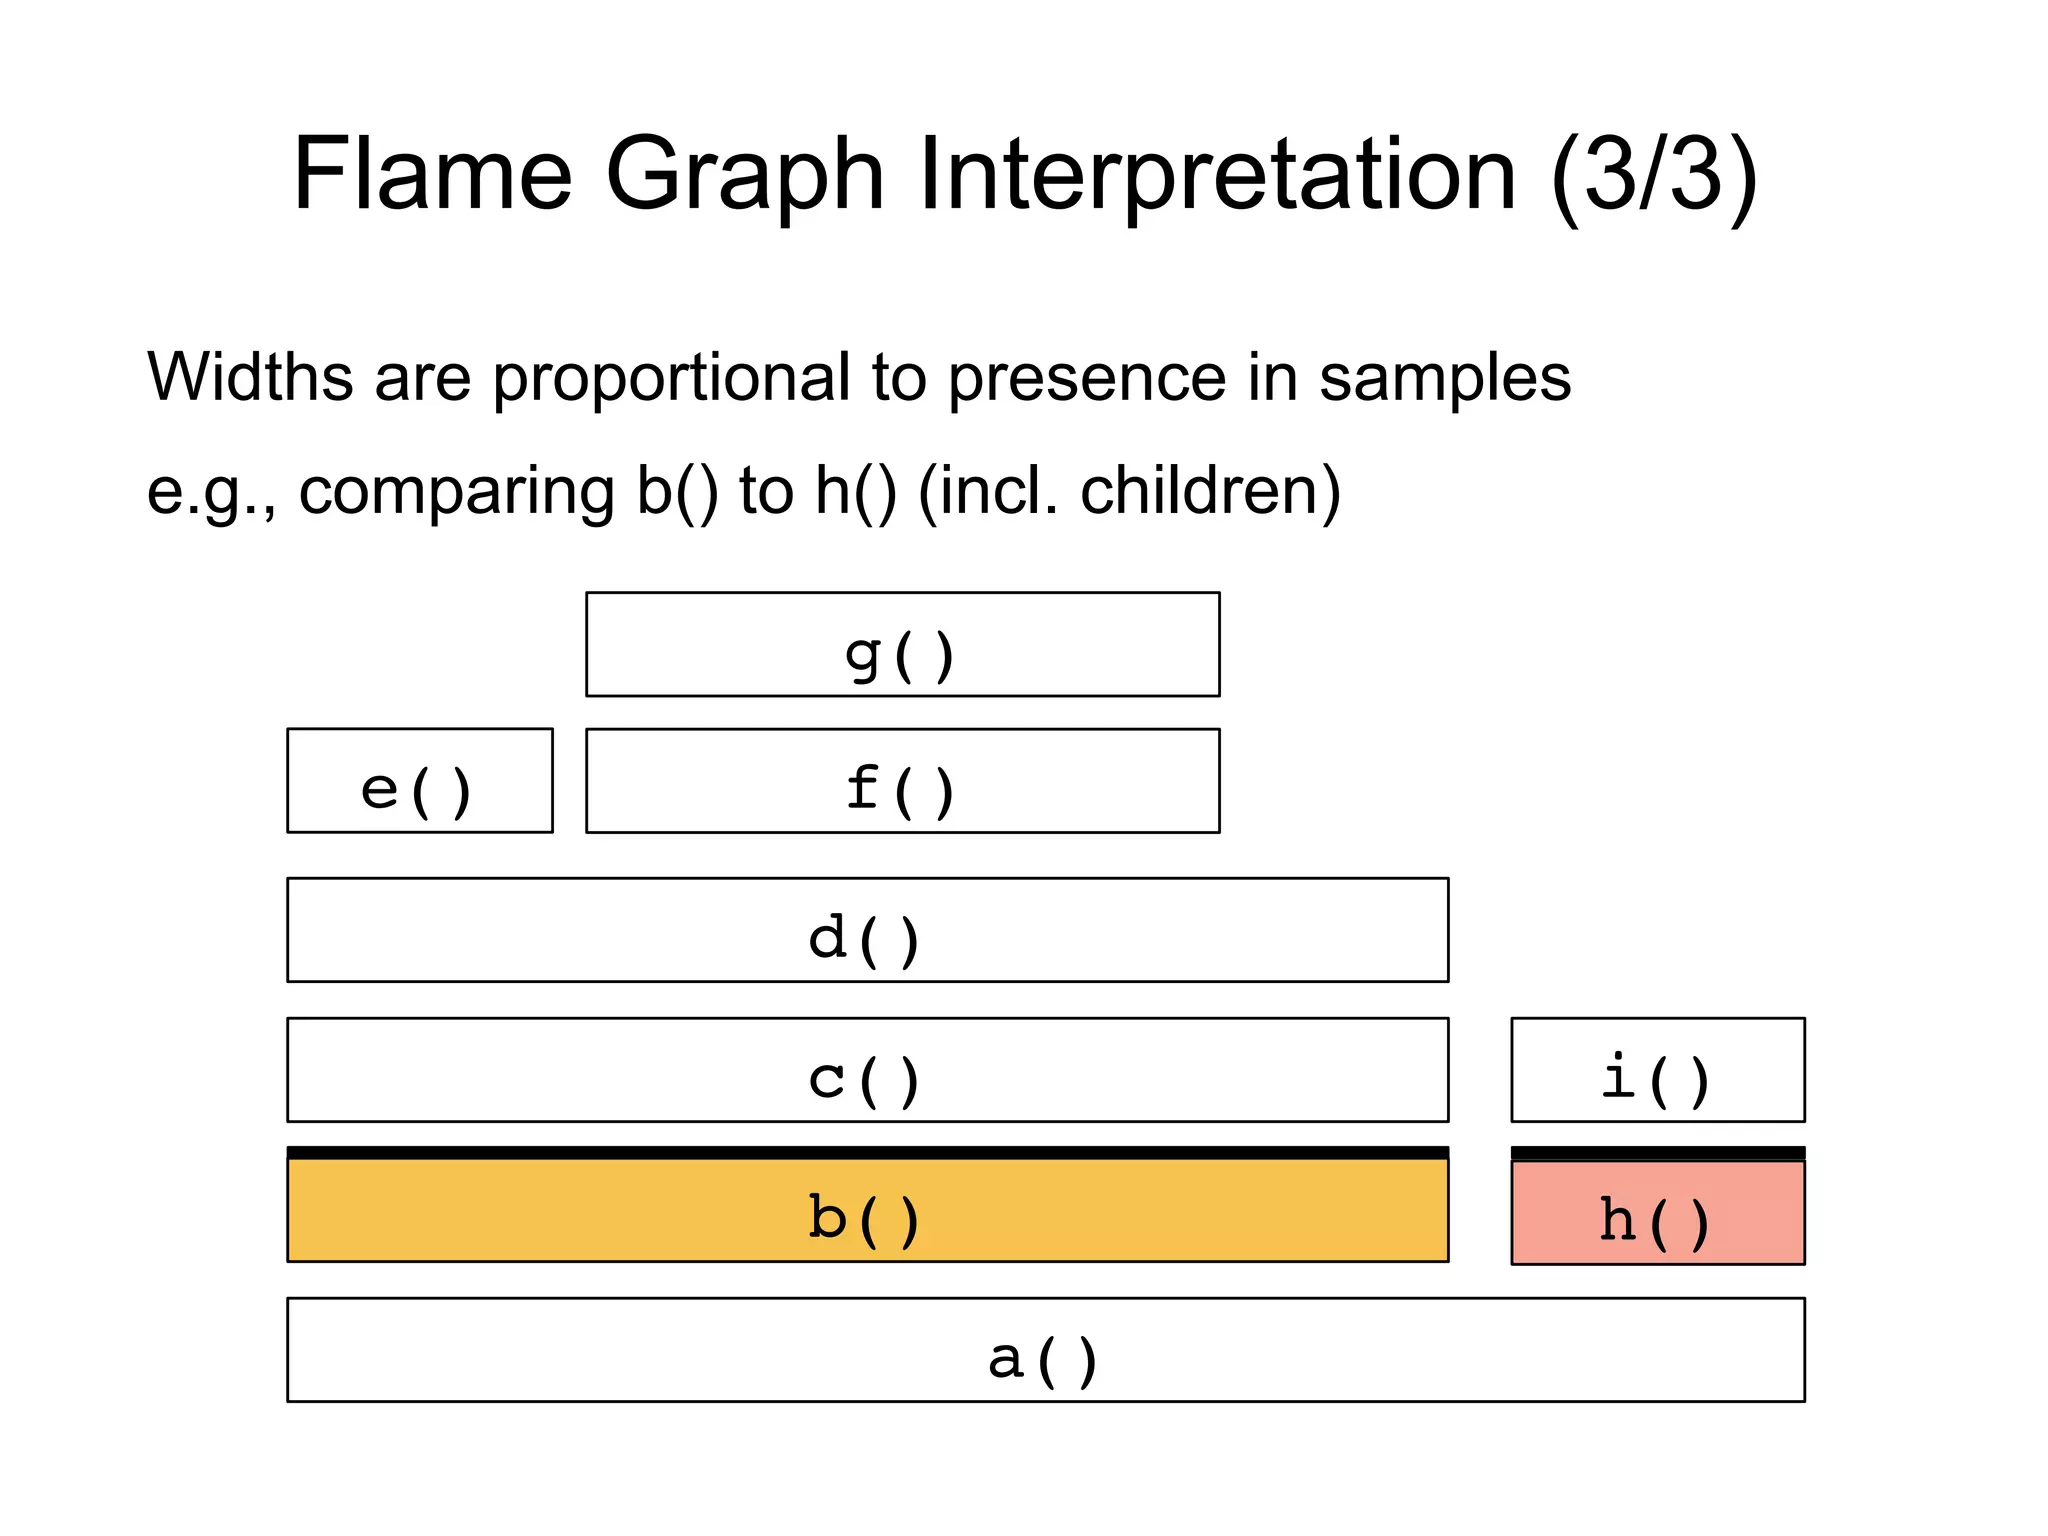
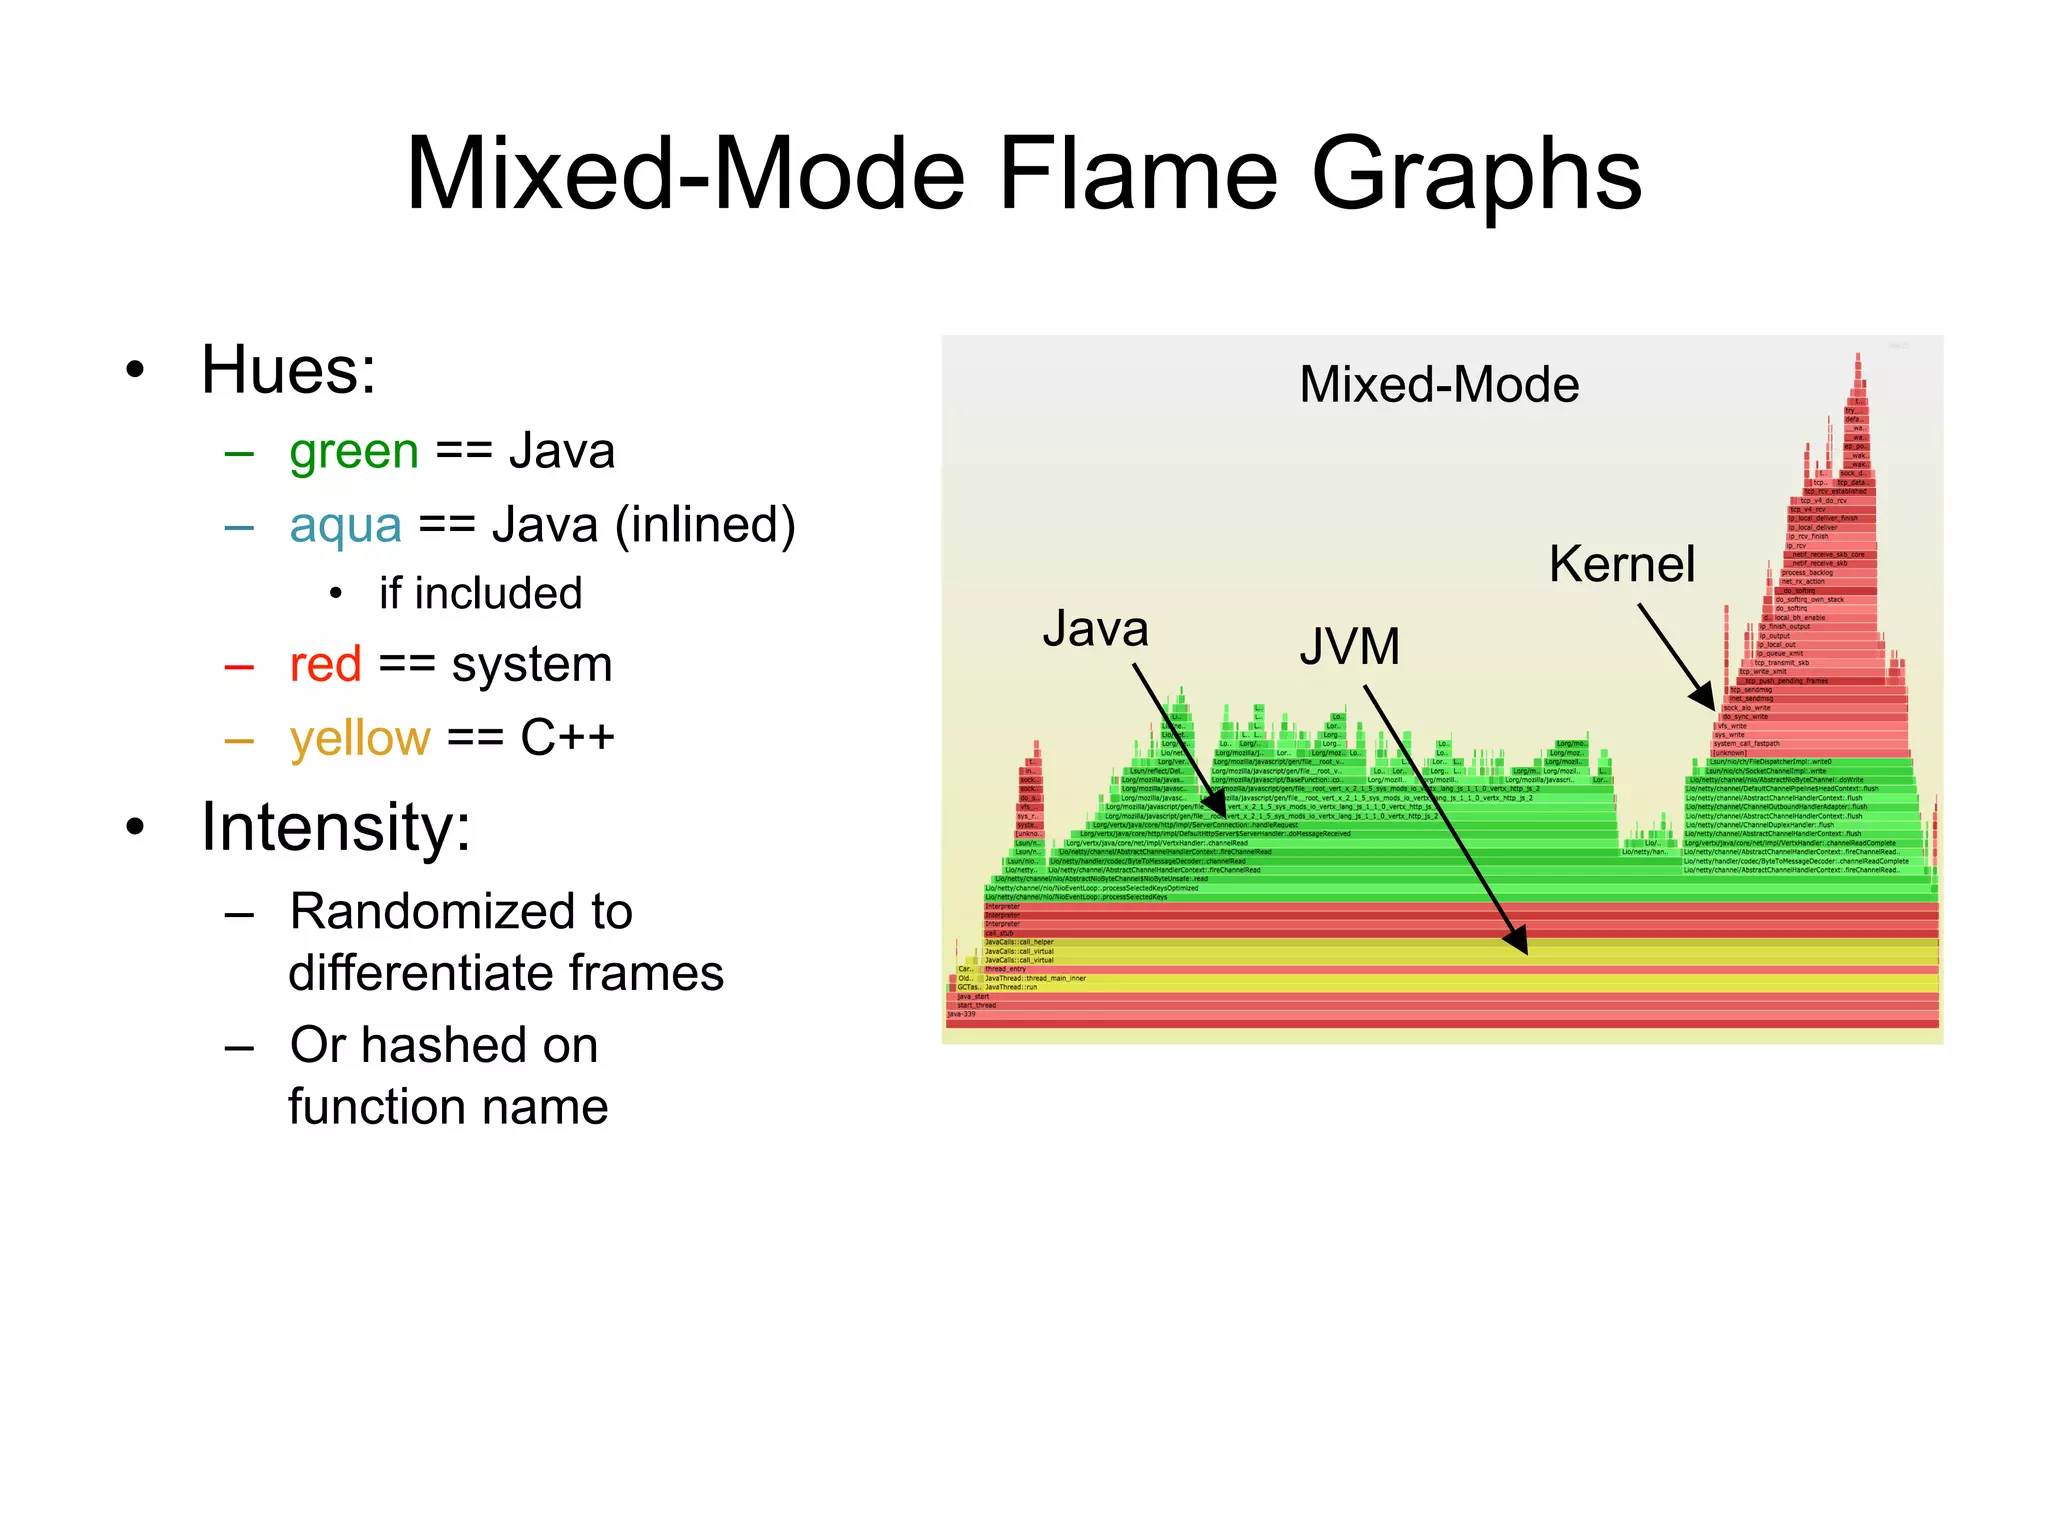
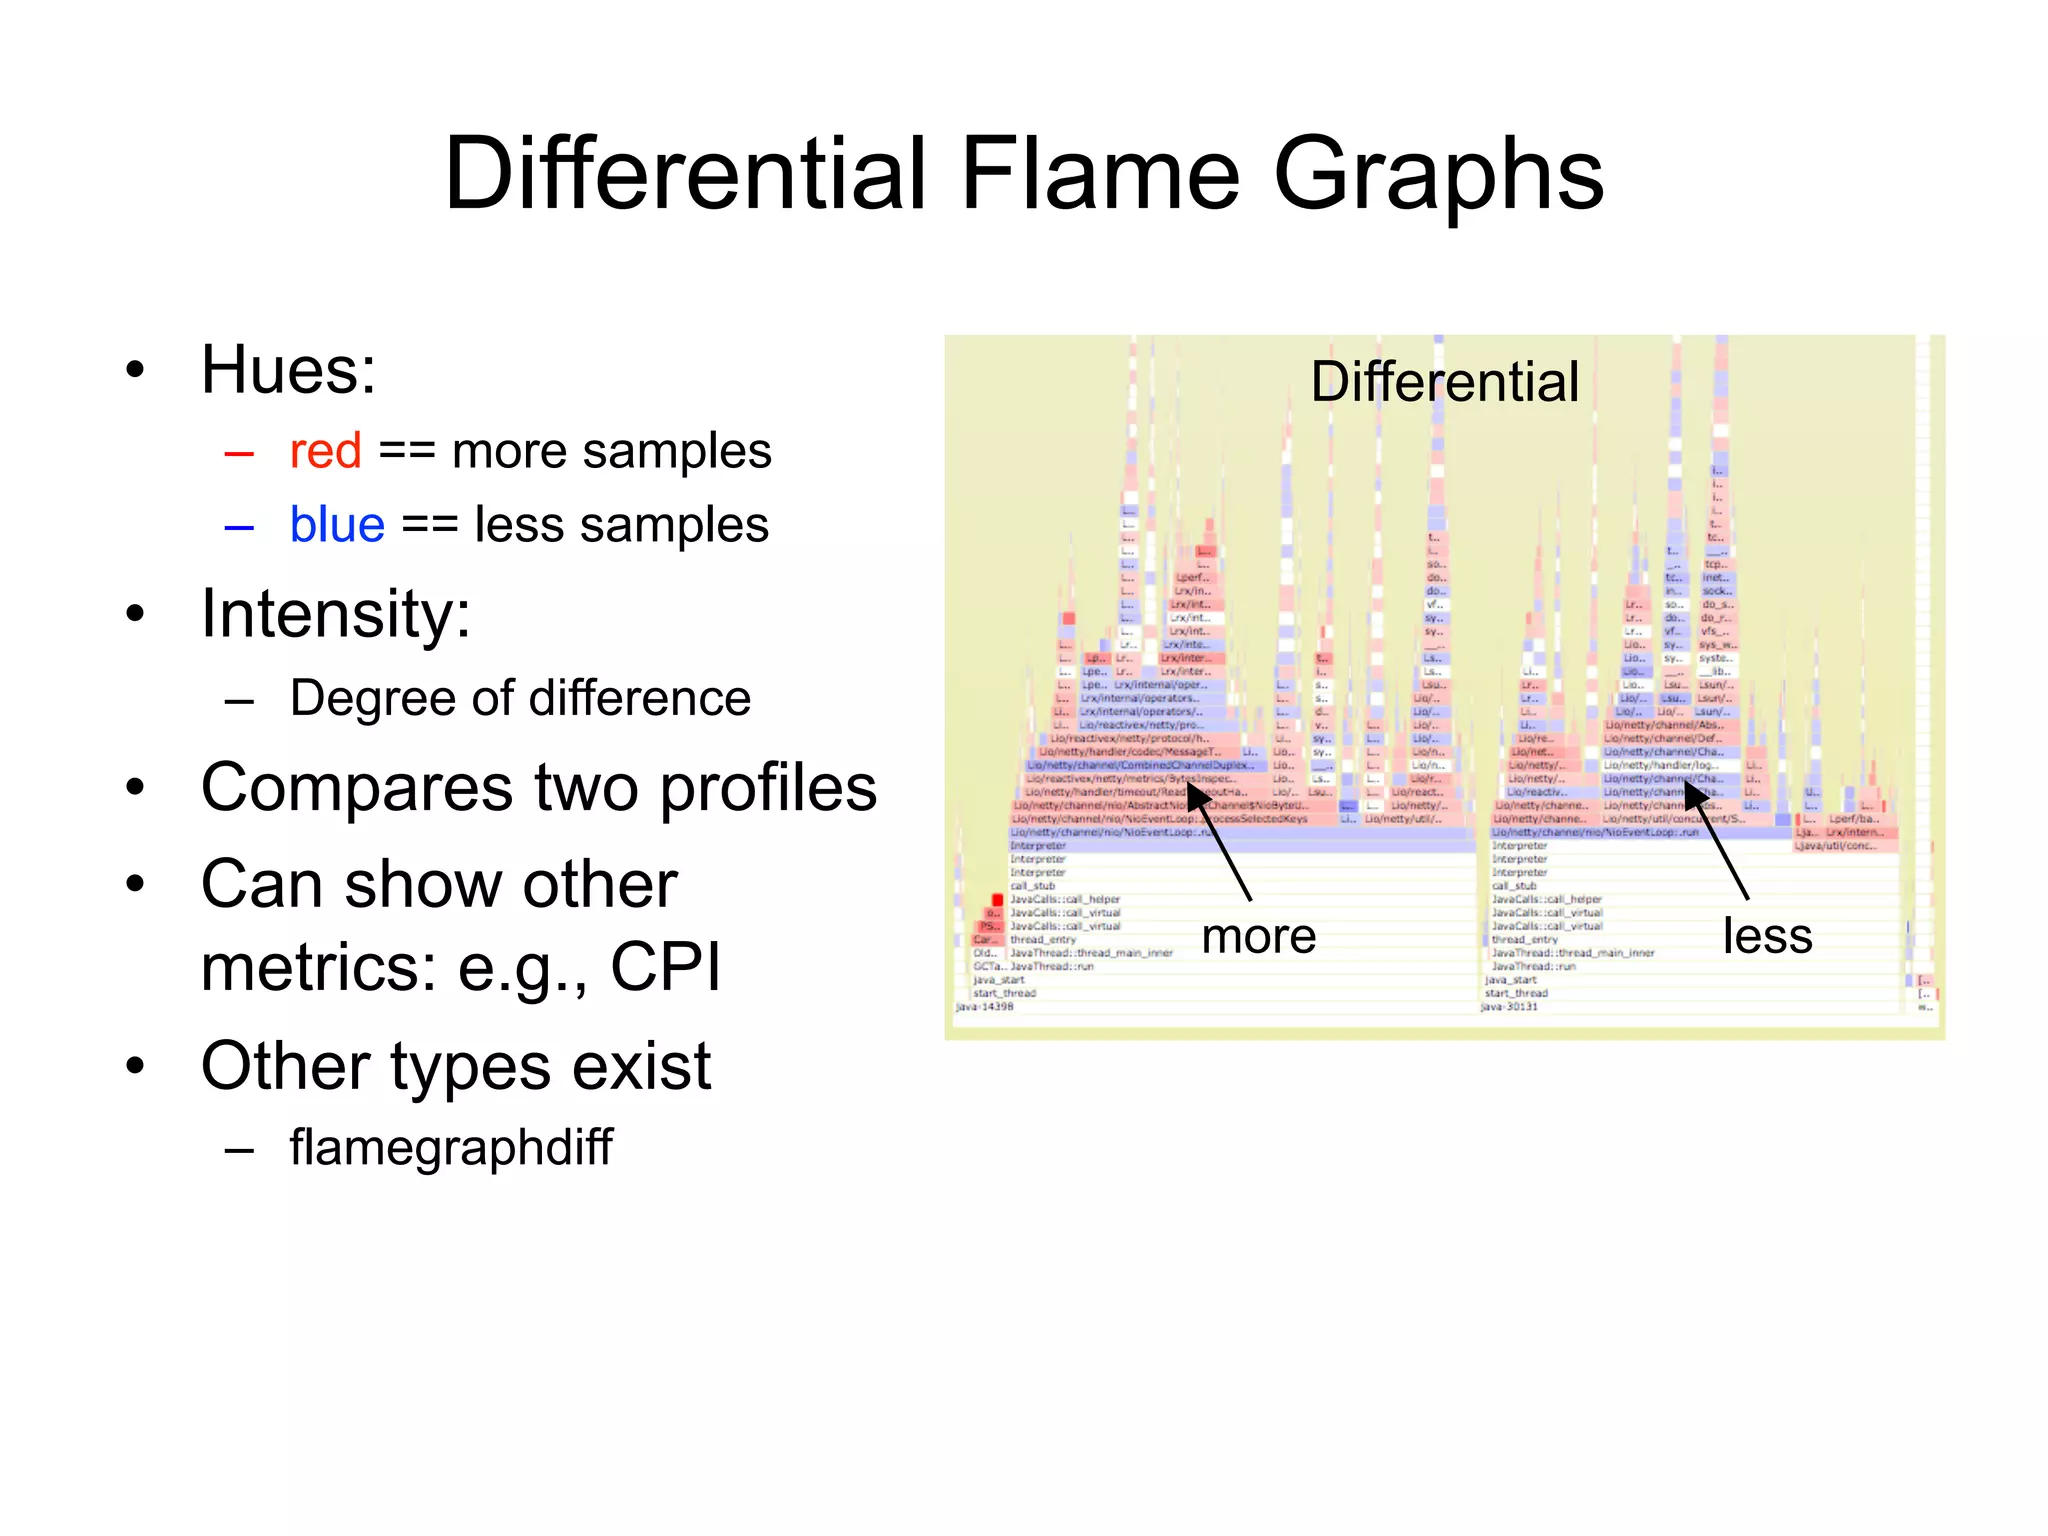
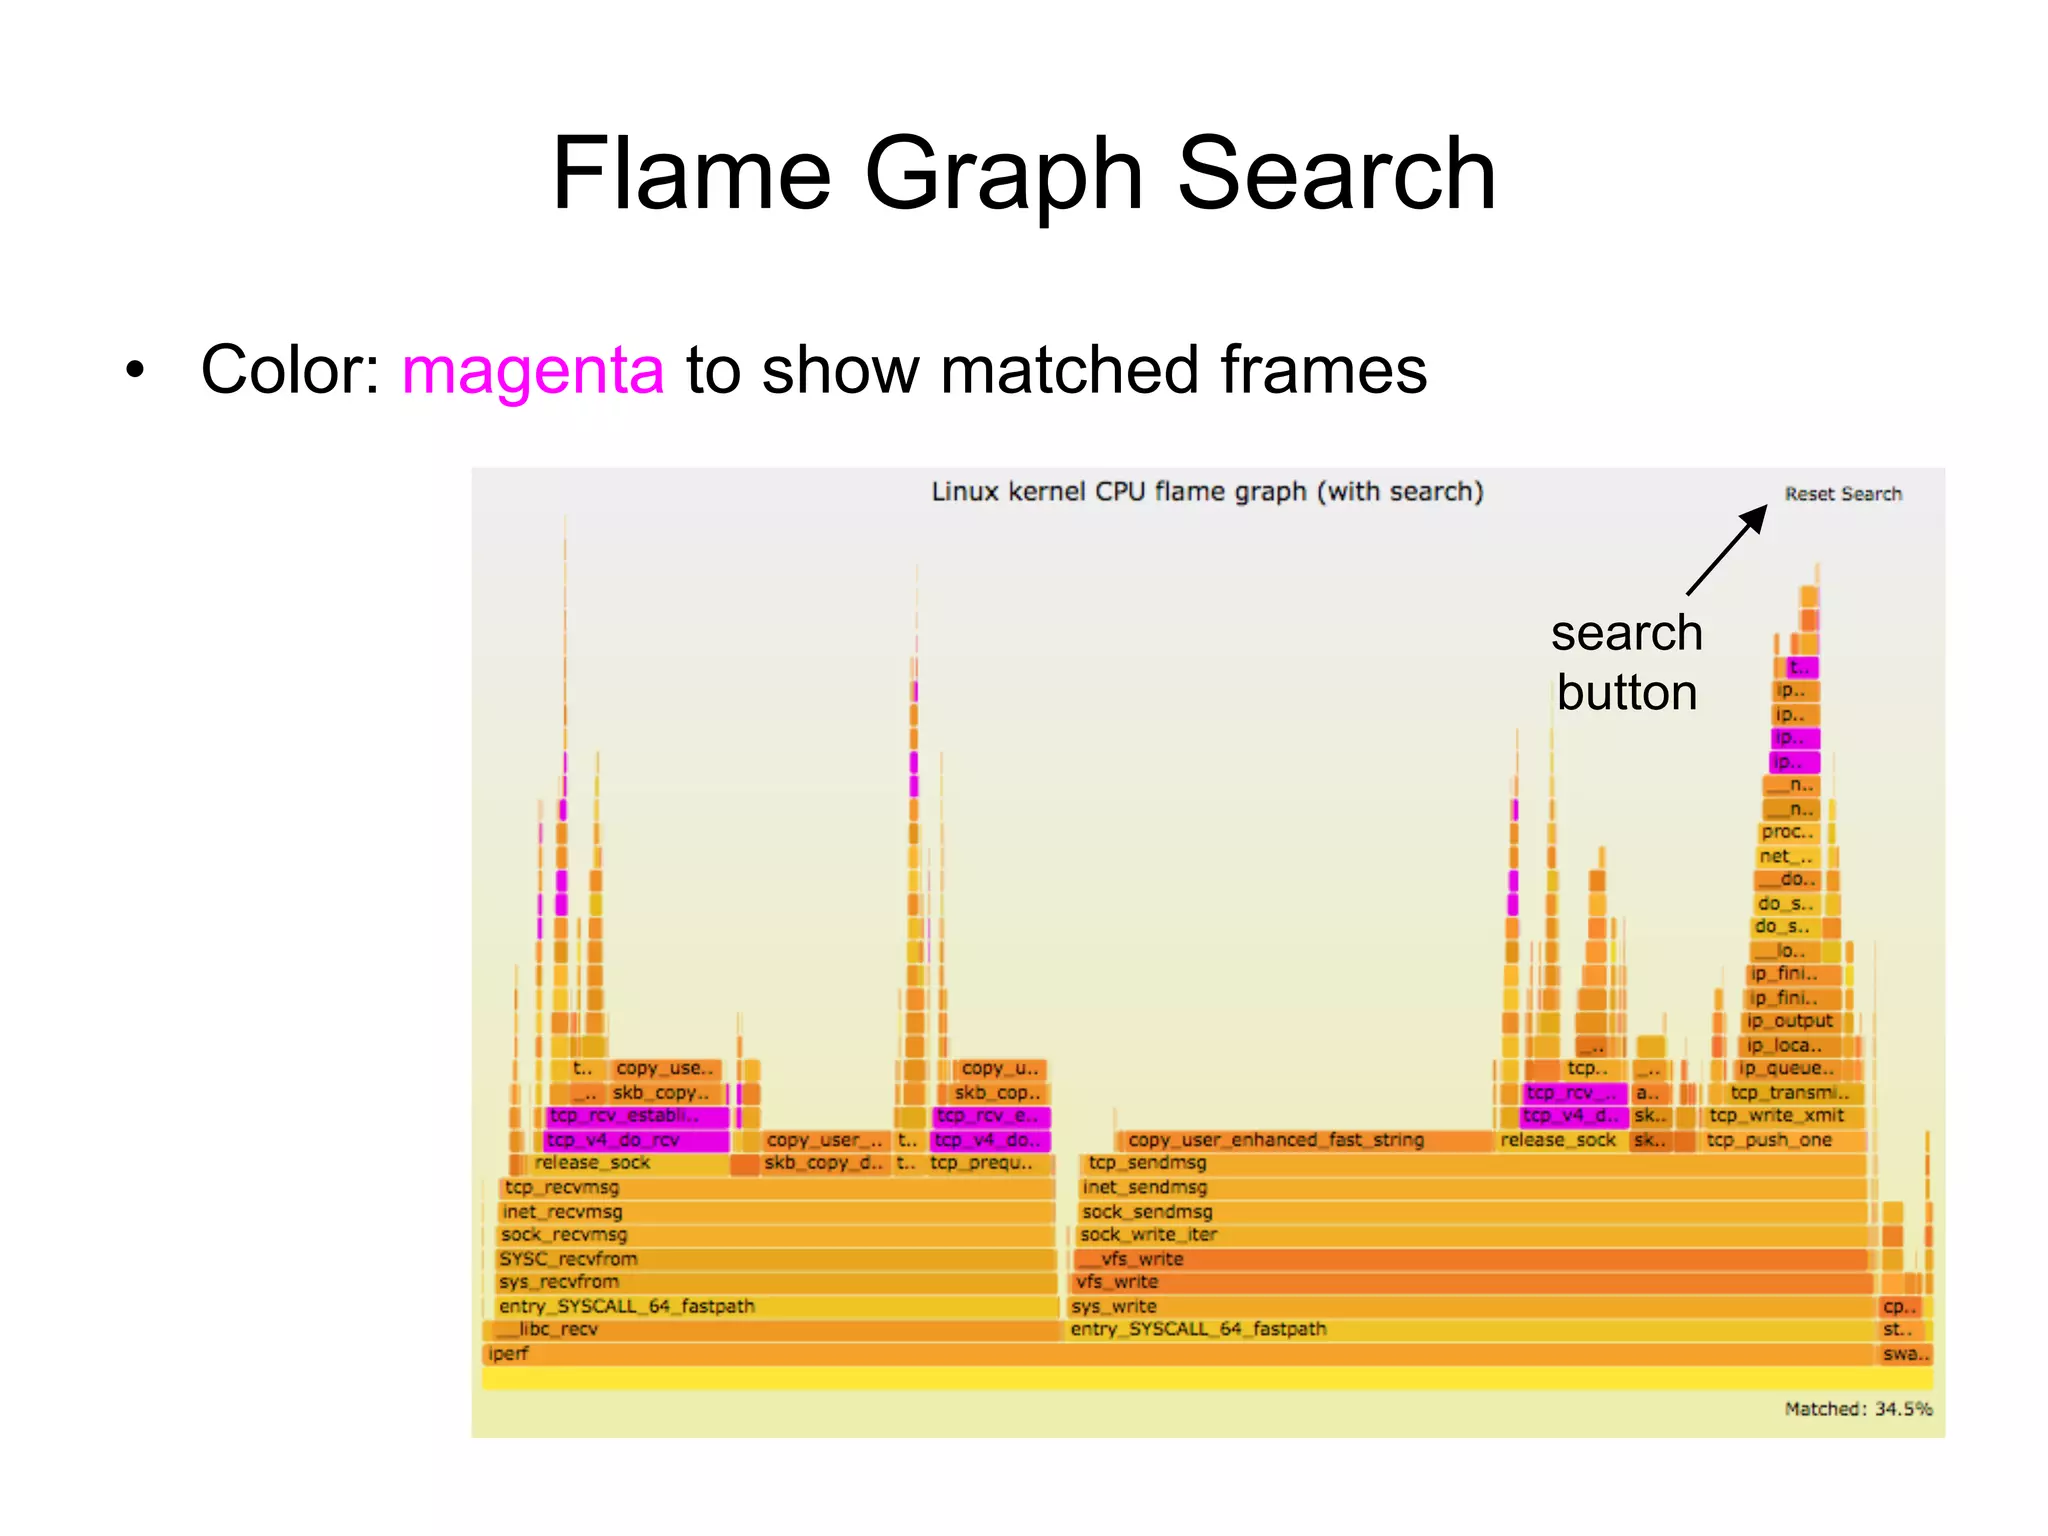
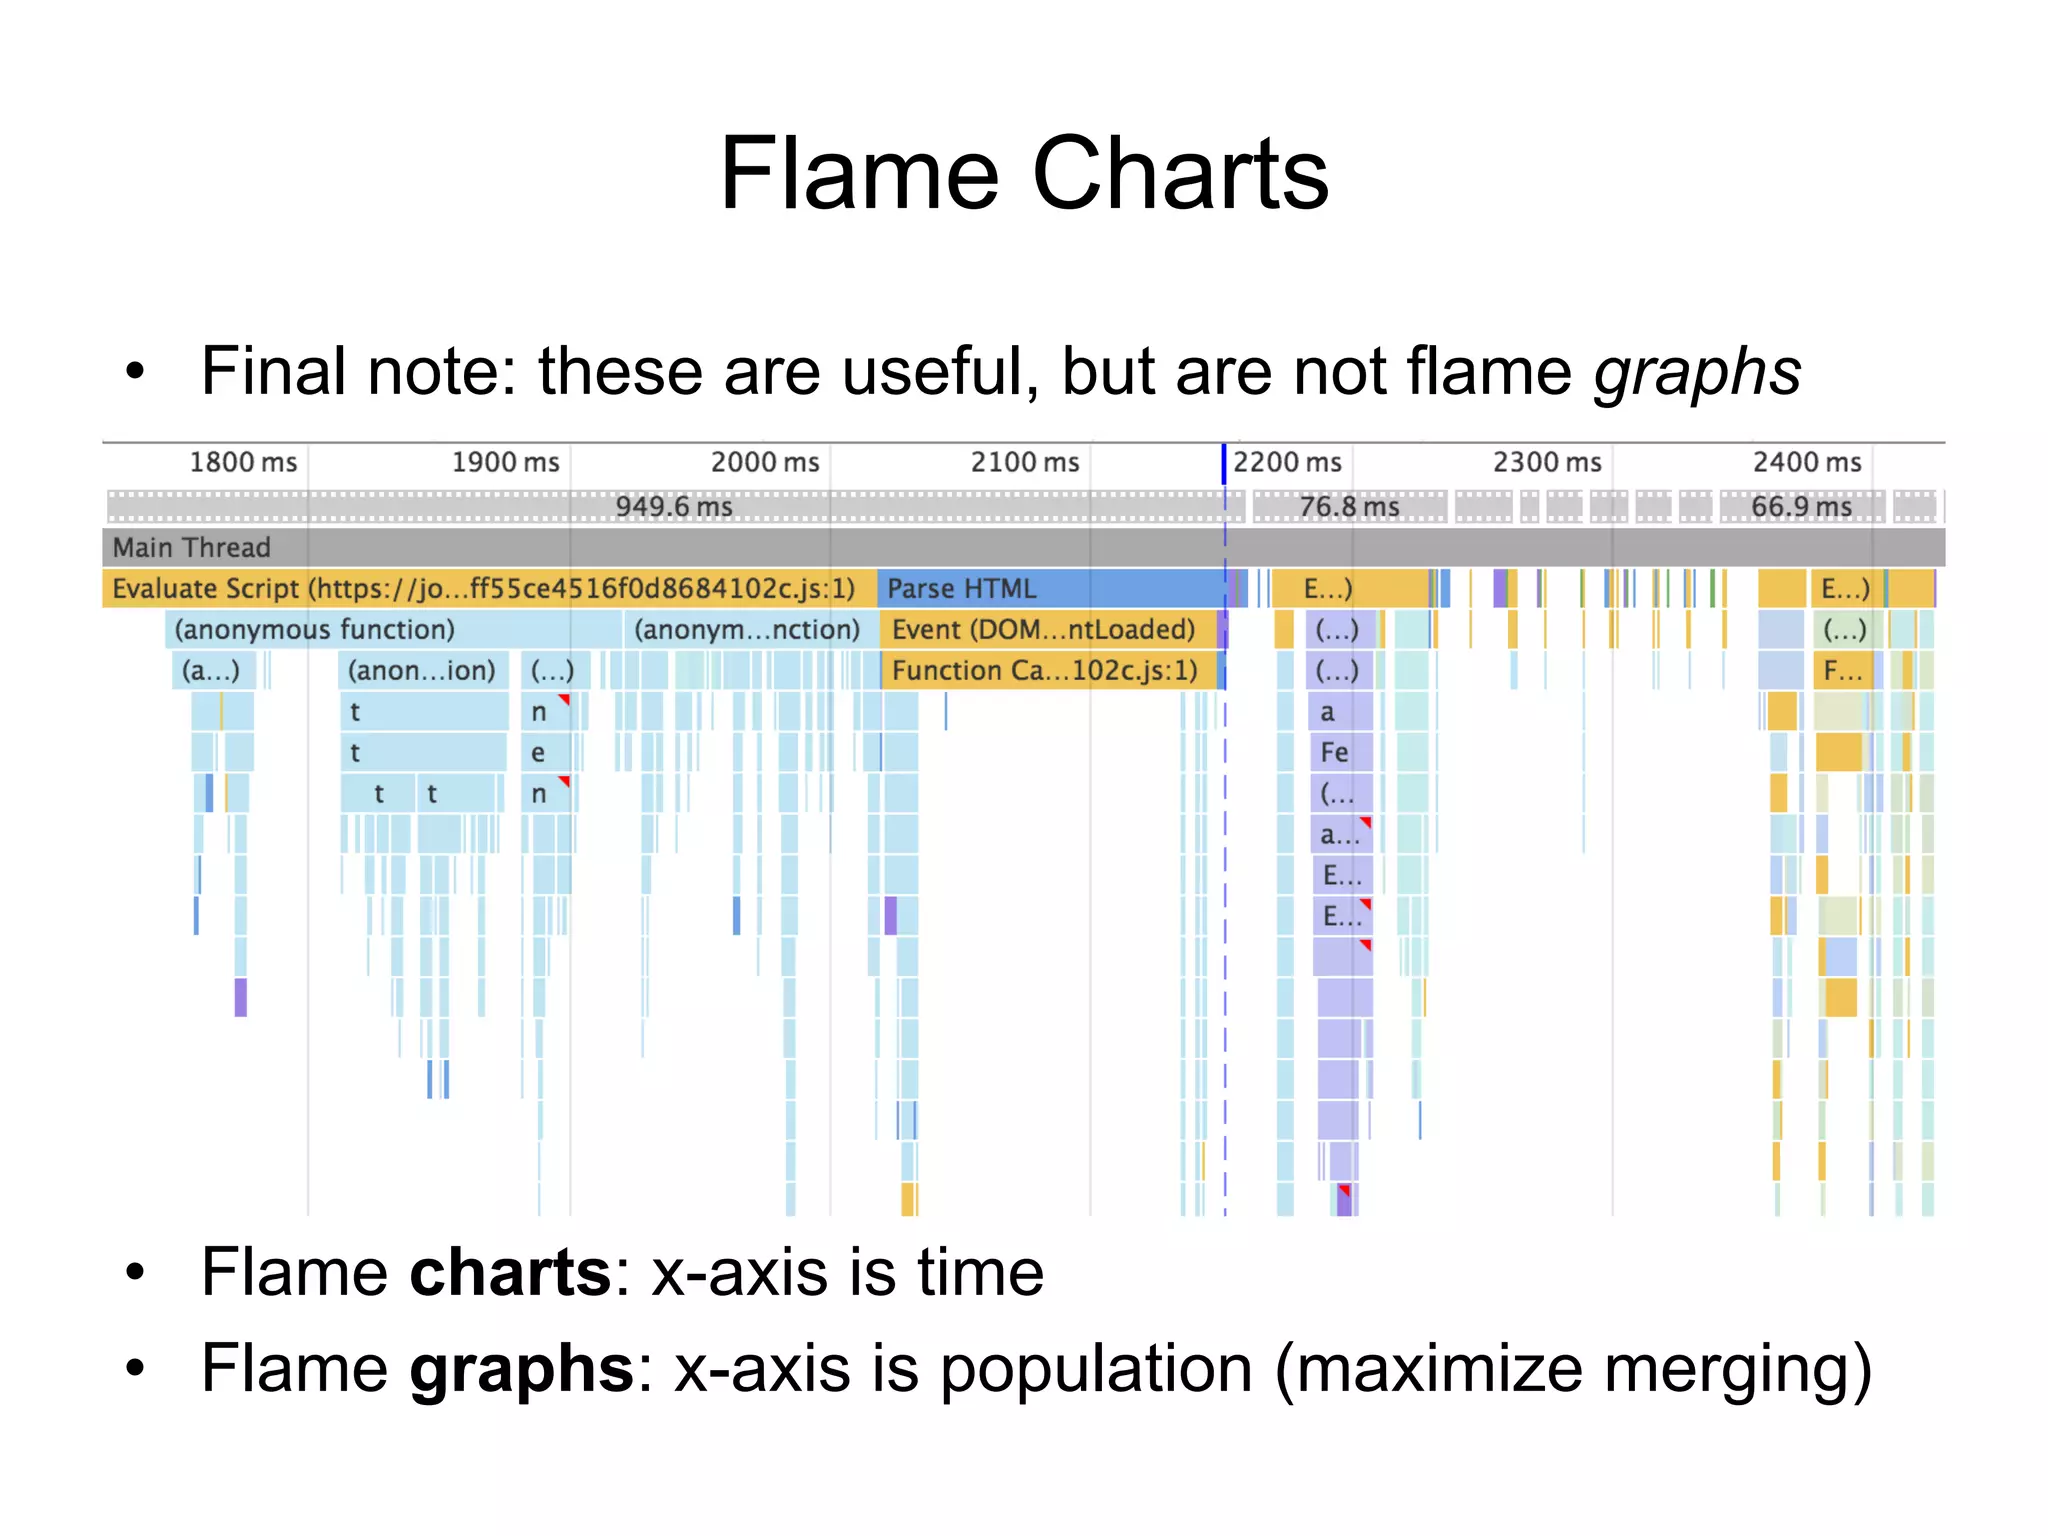
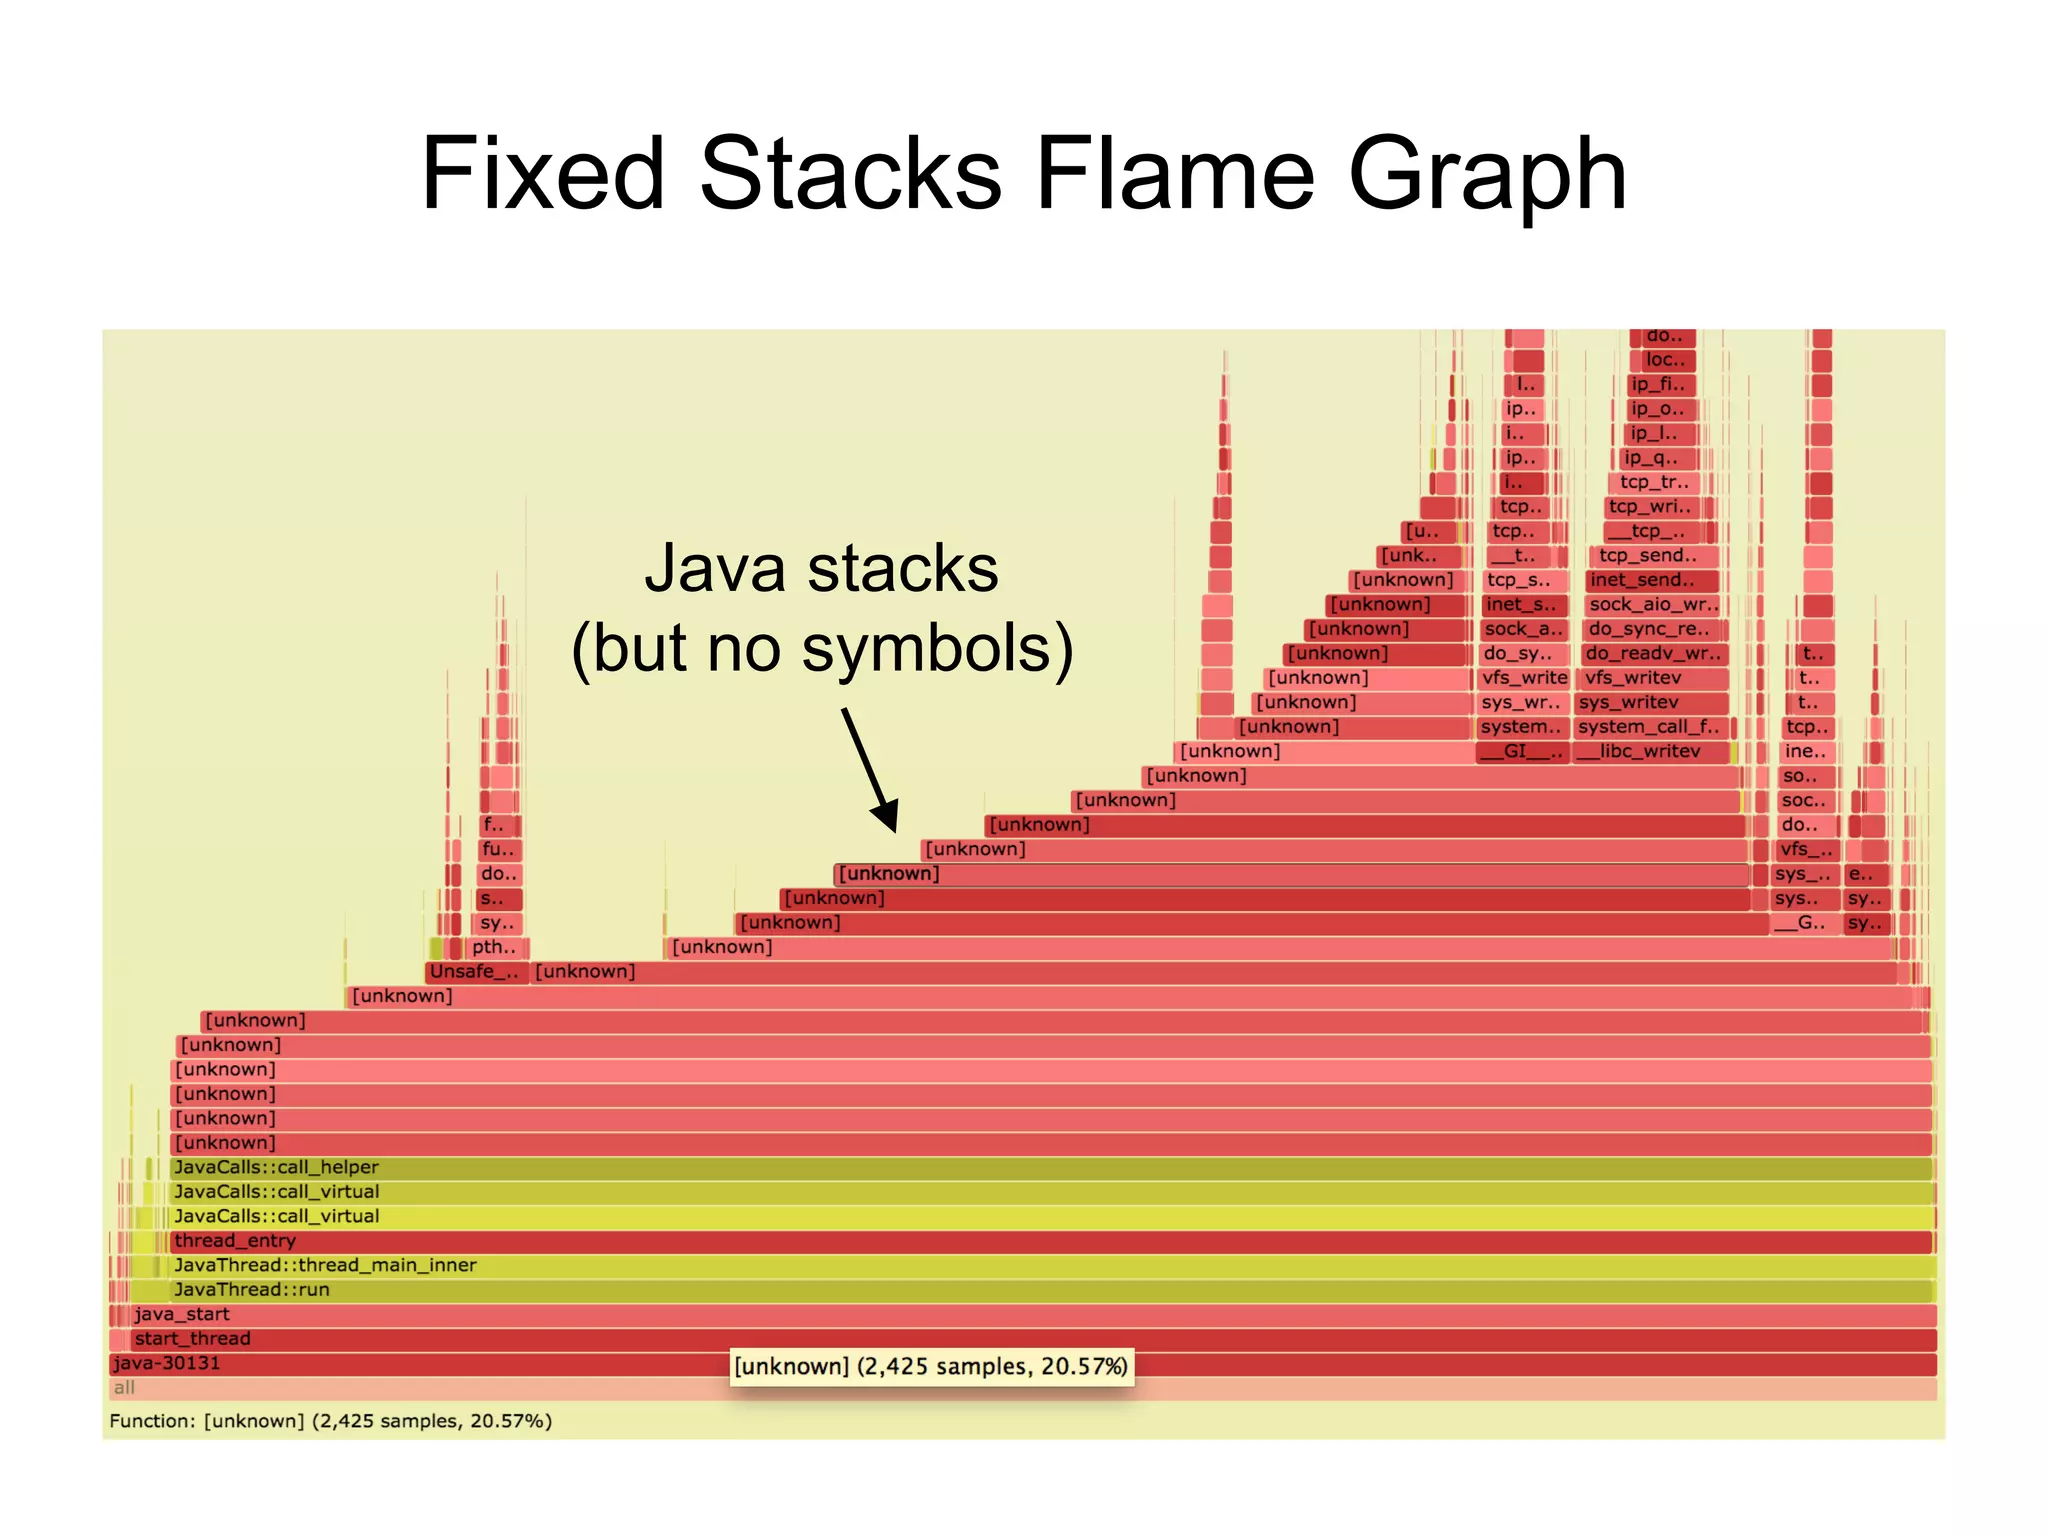
This document discusses using Linux perf_events (perf) profiling tools to analyze Java performance on Linux. It describes how perf can provide complete visibility into Java, JVM, GC and system code but that Java profilers have limitations. It presents the solution of using perf to collect mixed-mode flame graphs that include Java method names and symbols. It also discusses fixing issues with broken Java stacks and missing symbols on x86 architectures in perf profiles.