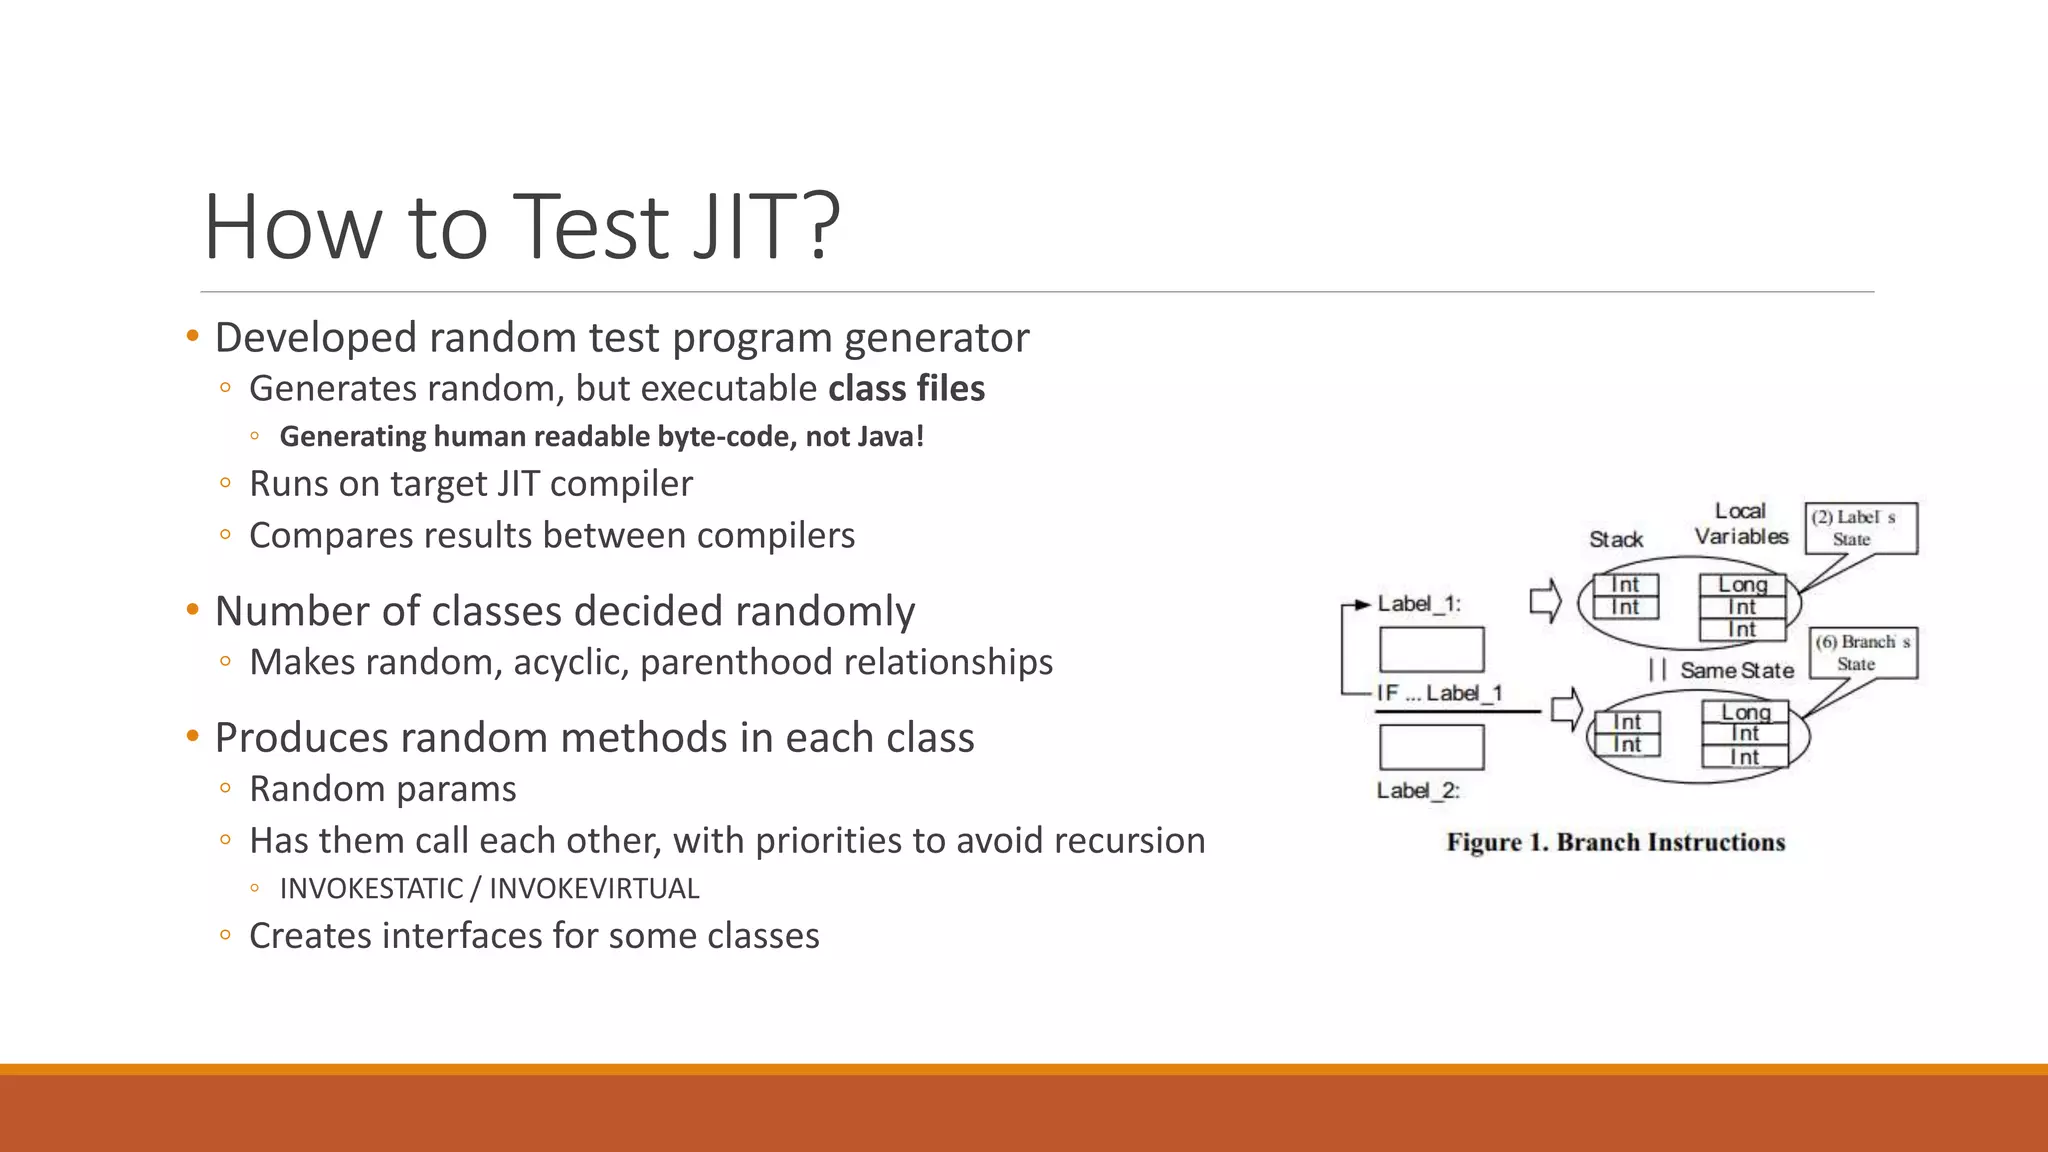
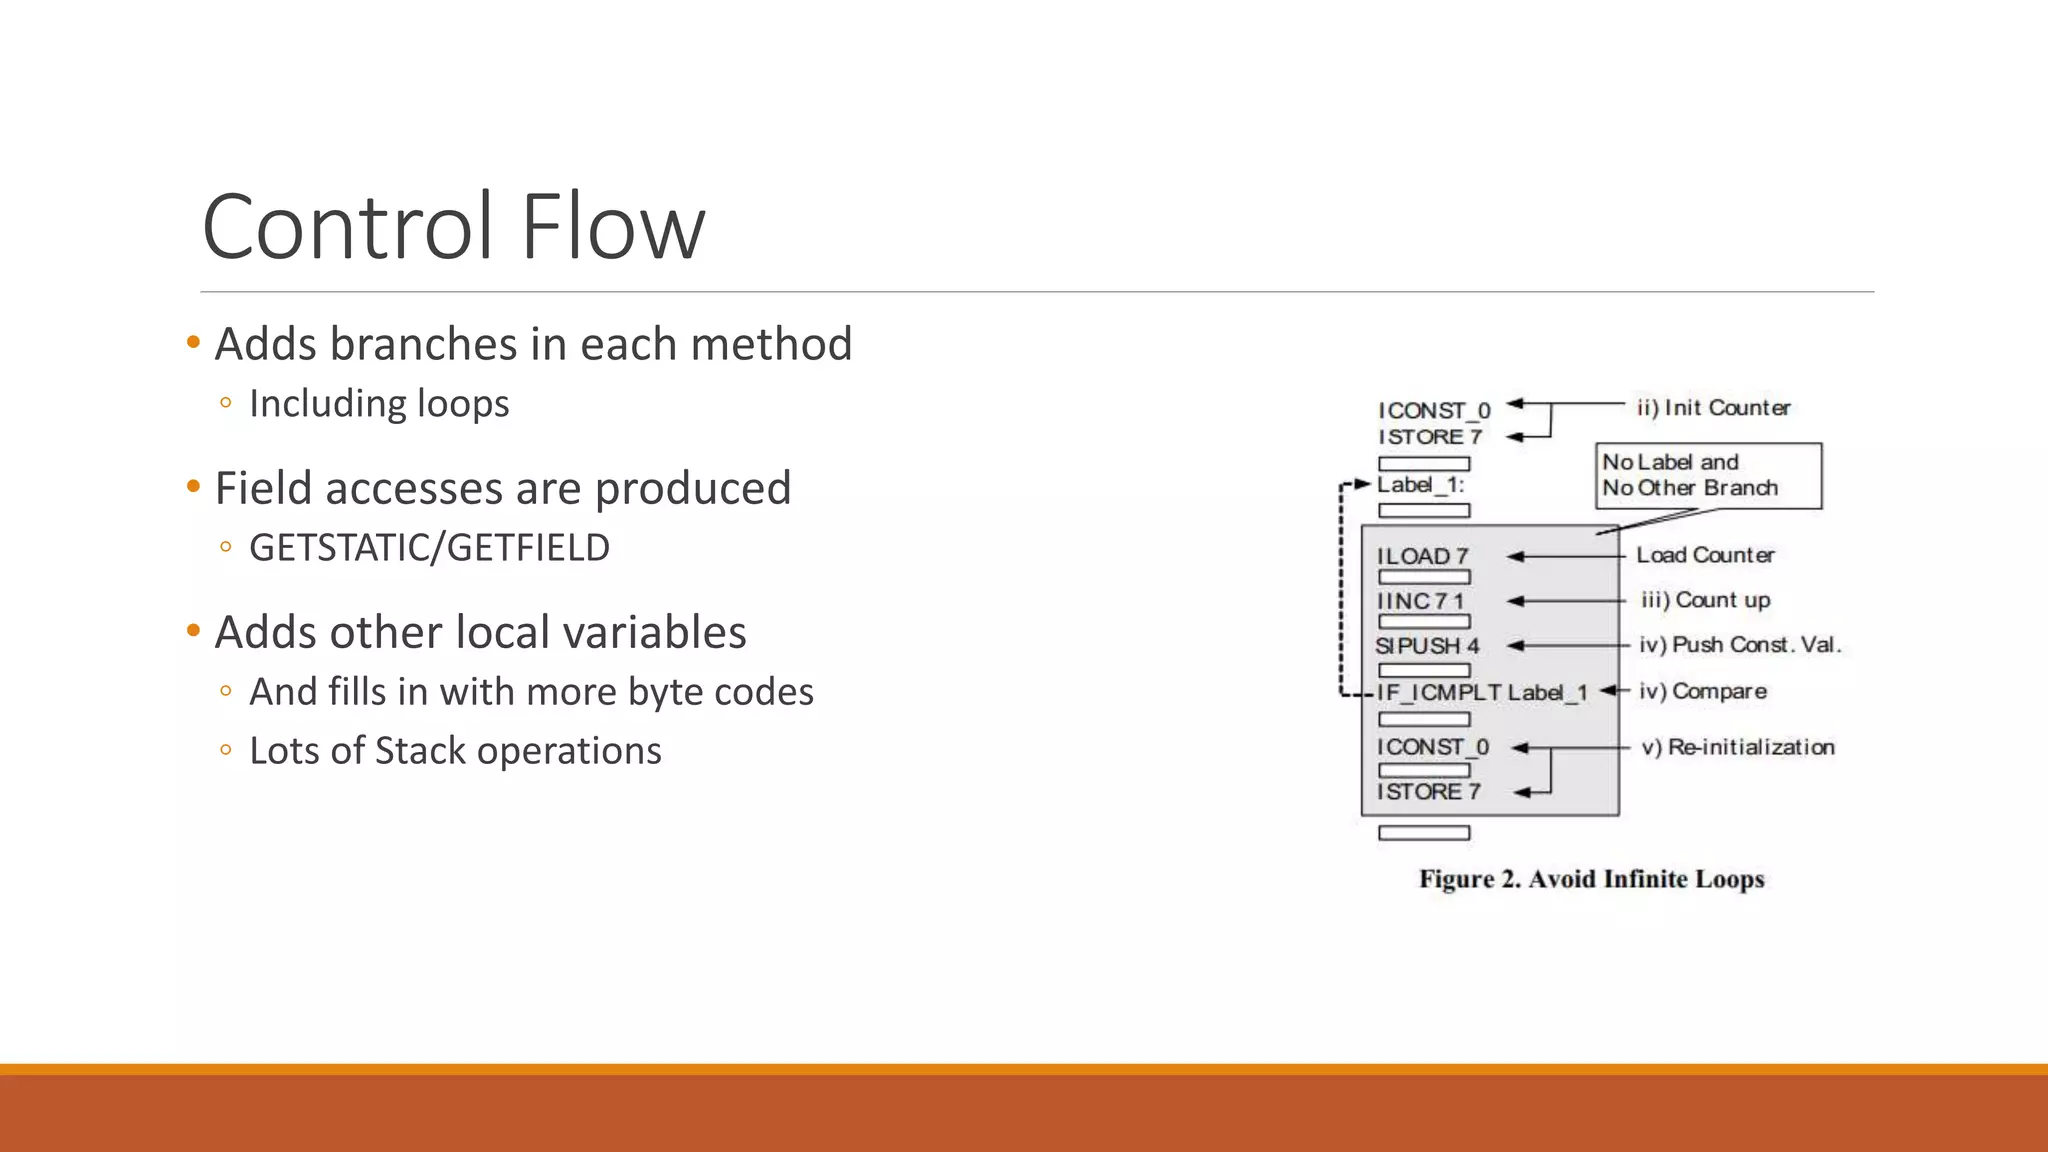
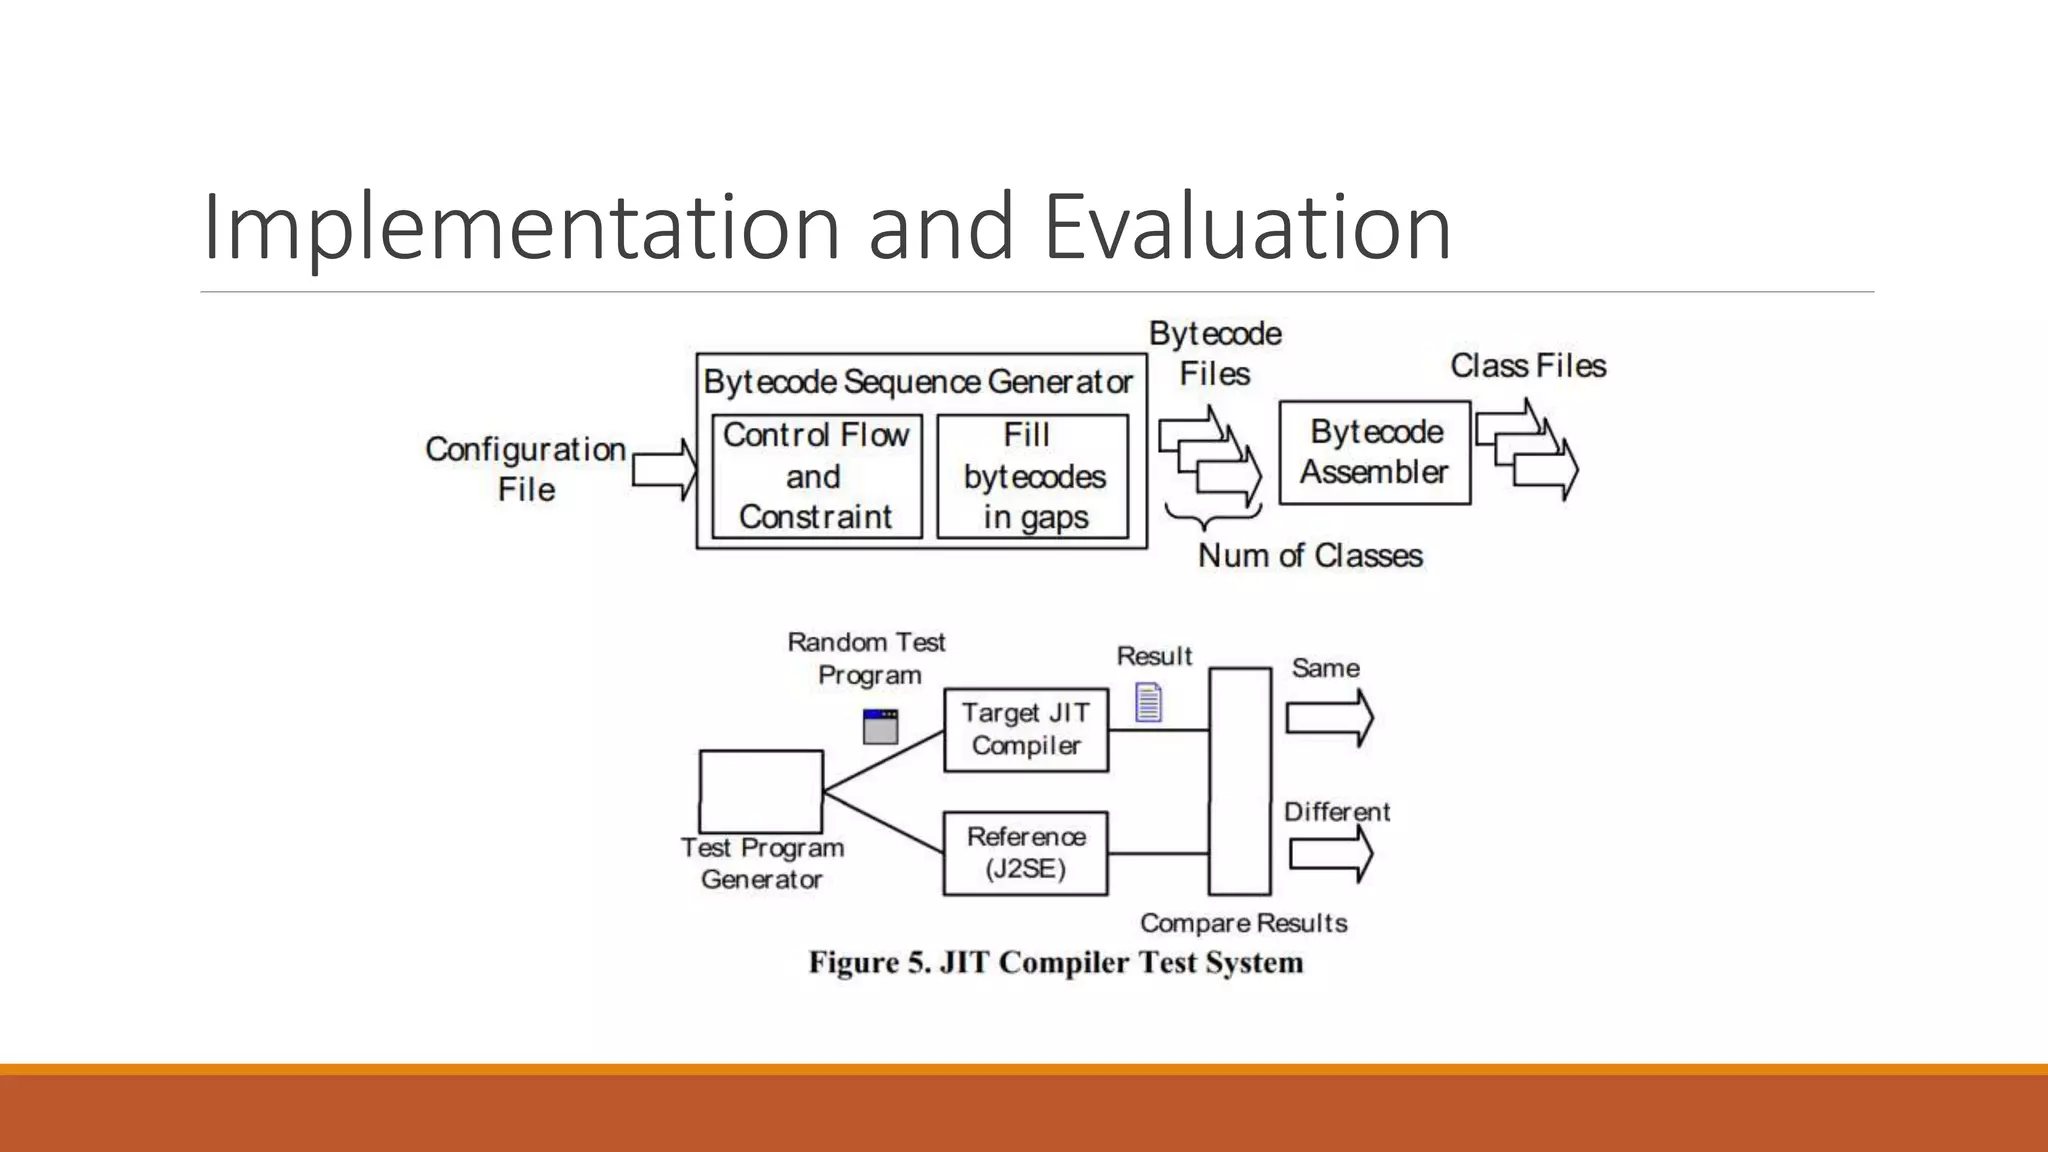
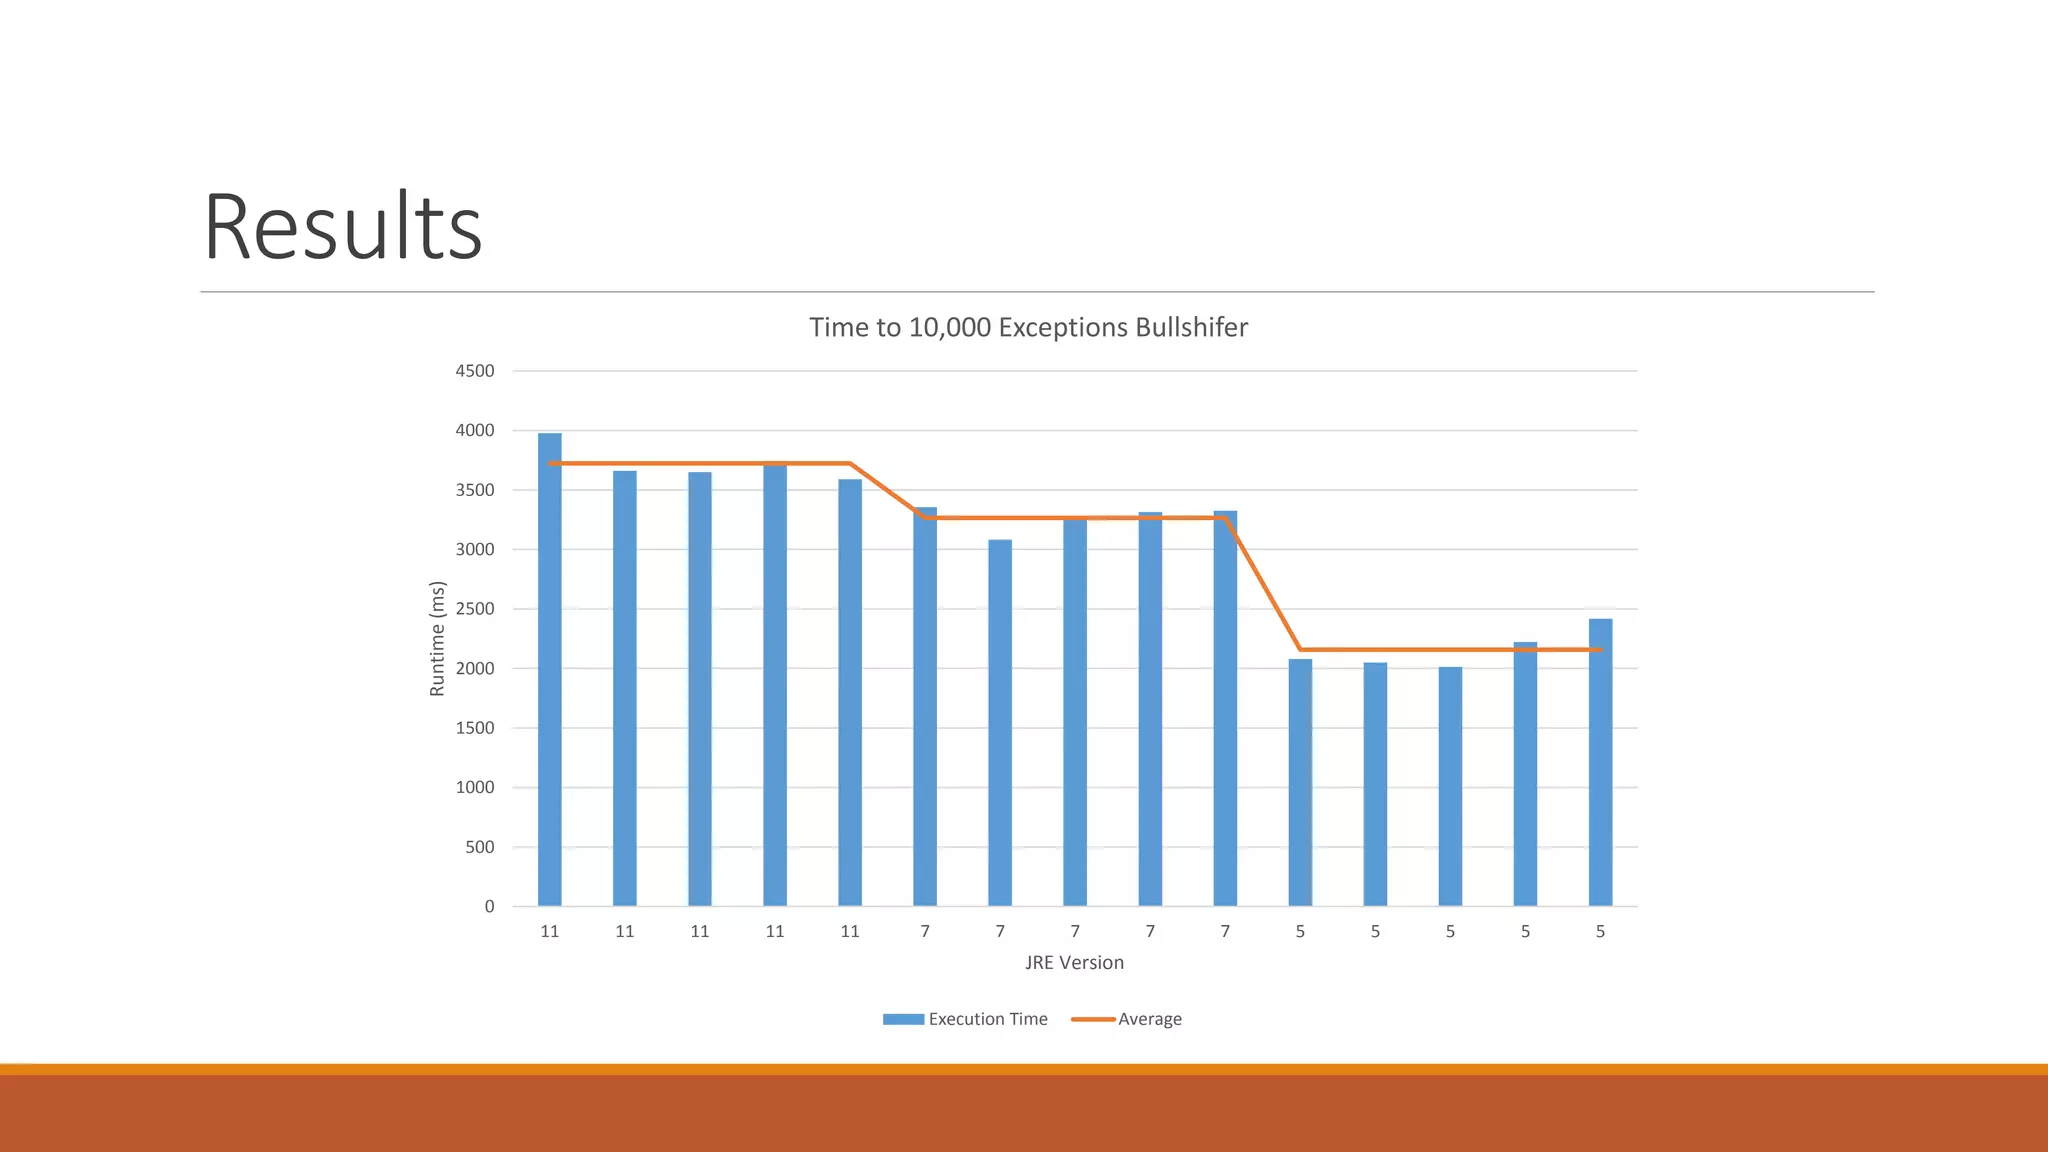
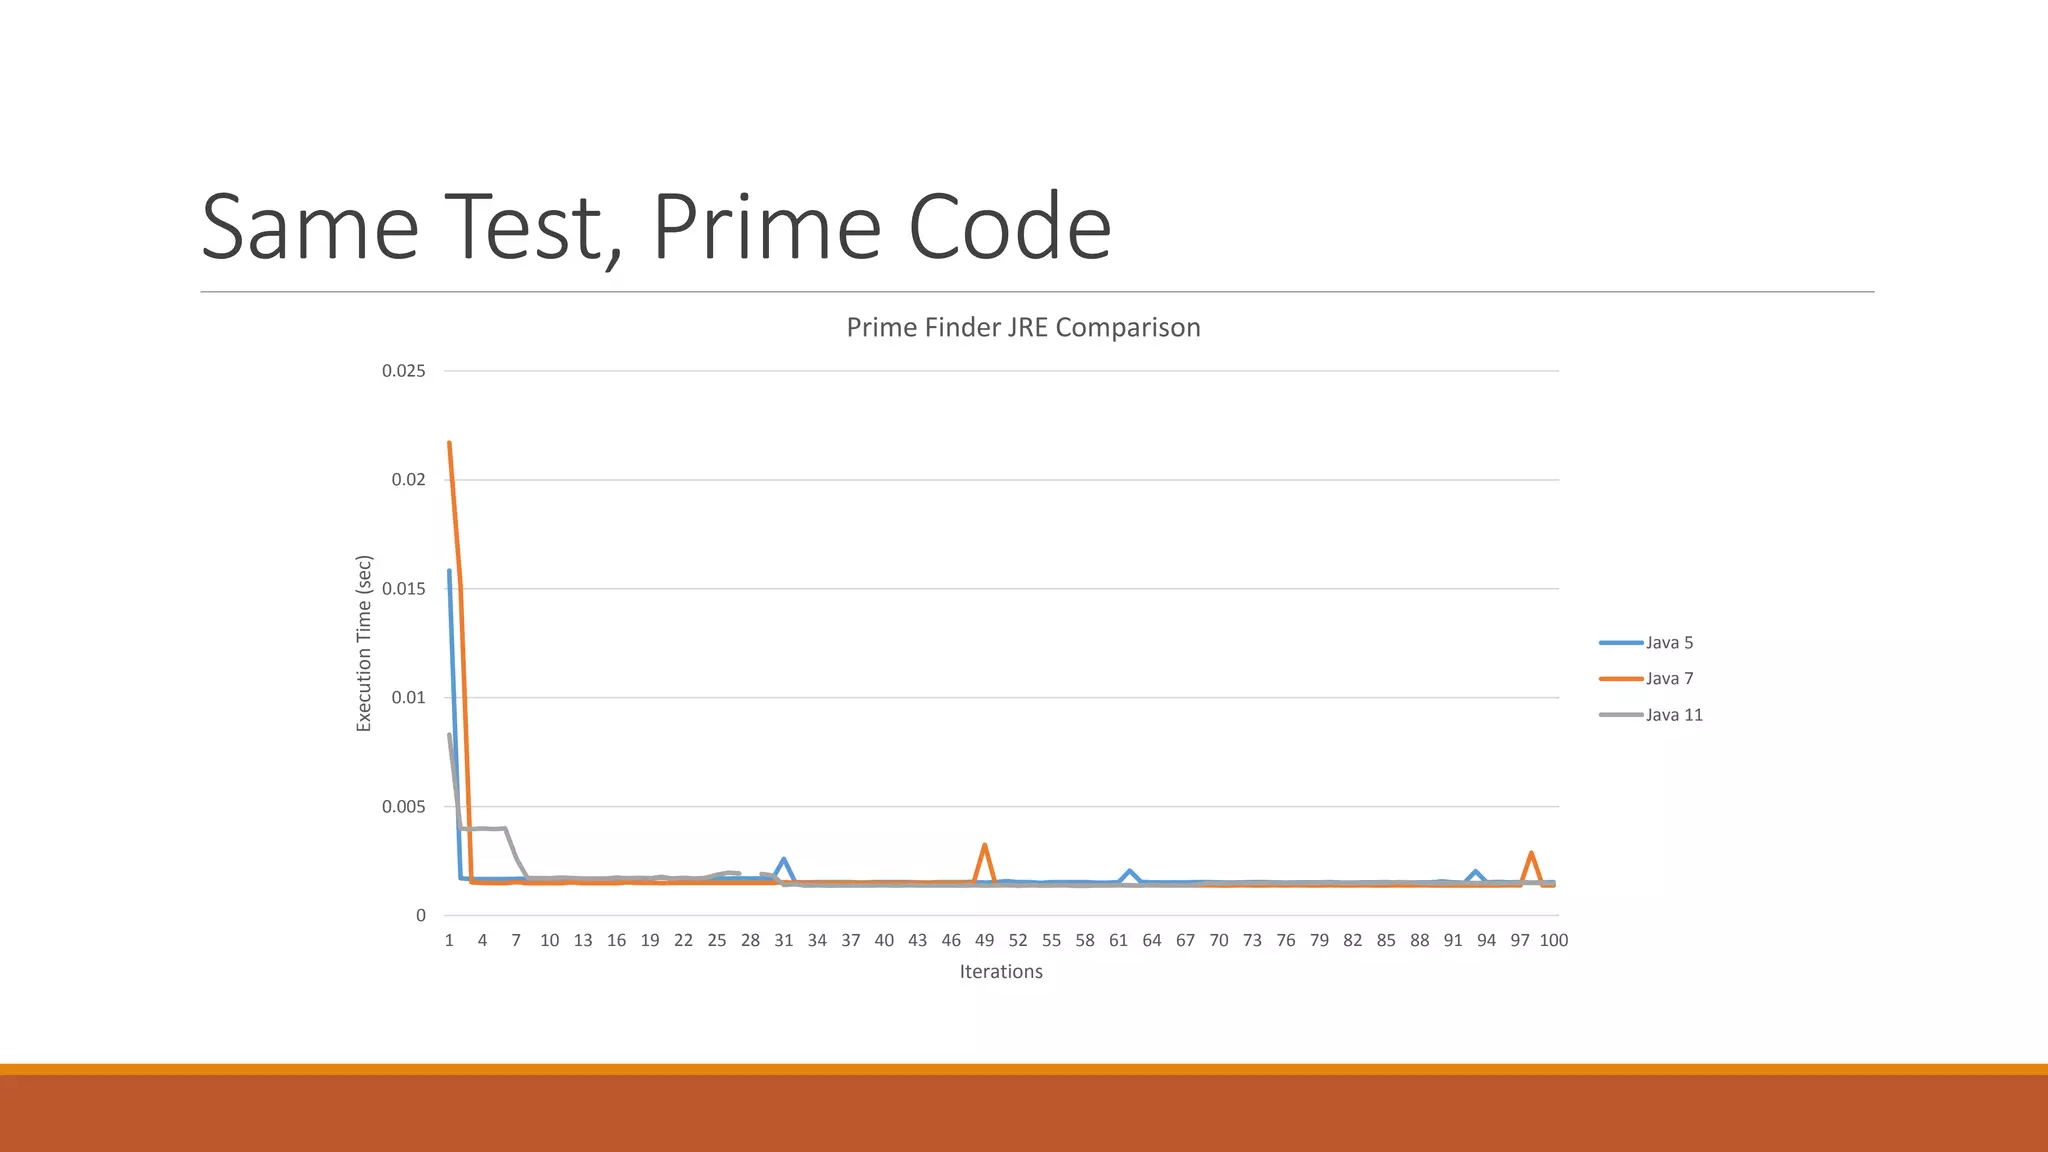
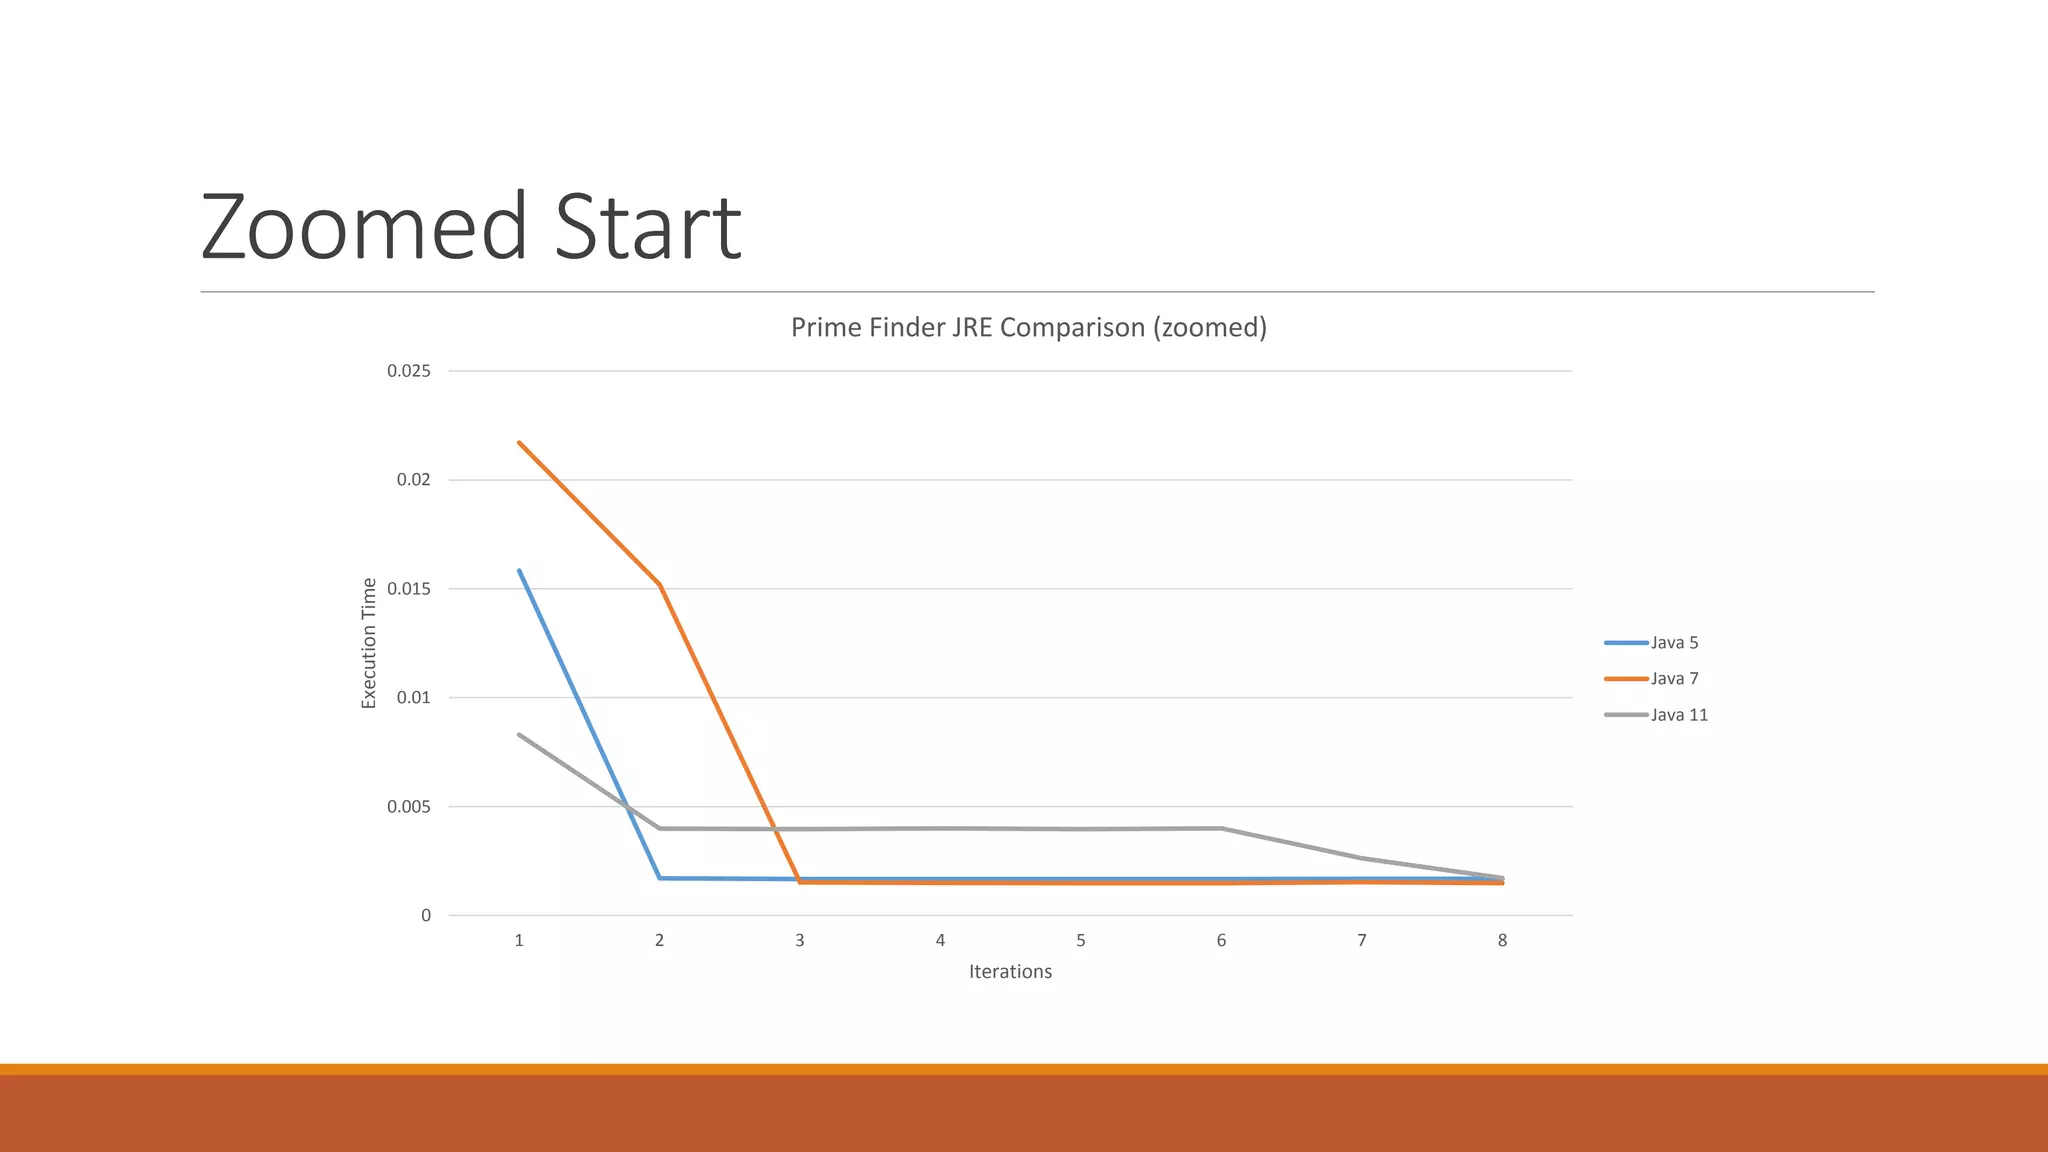
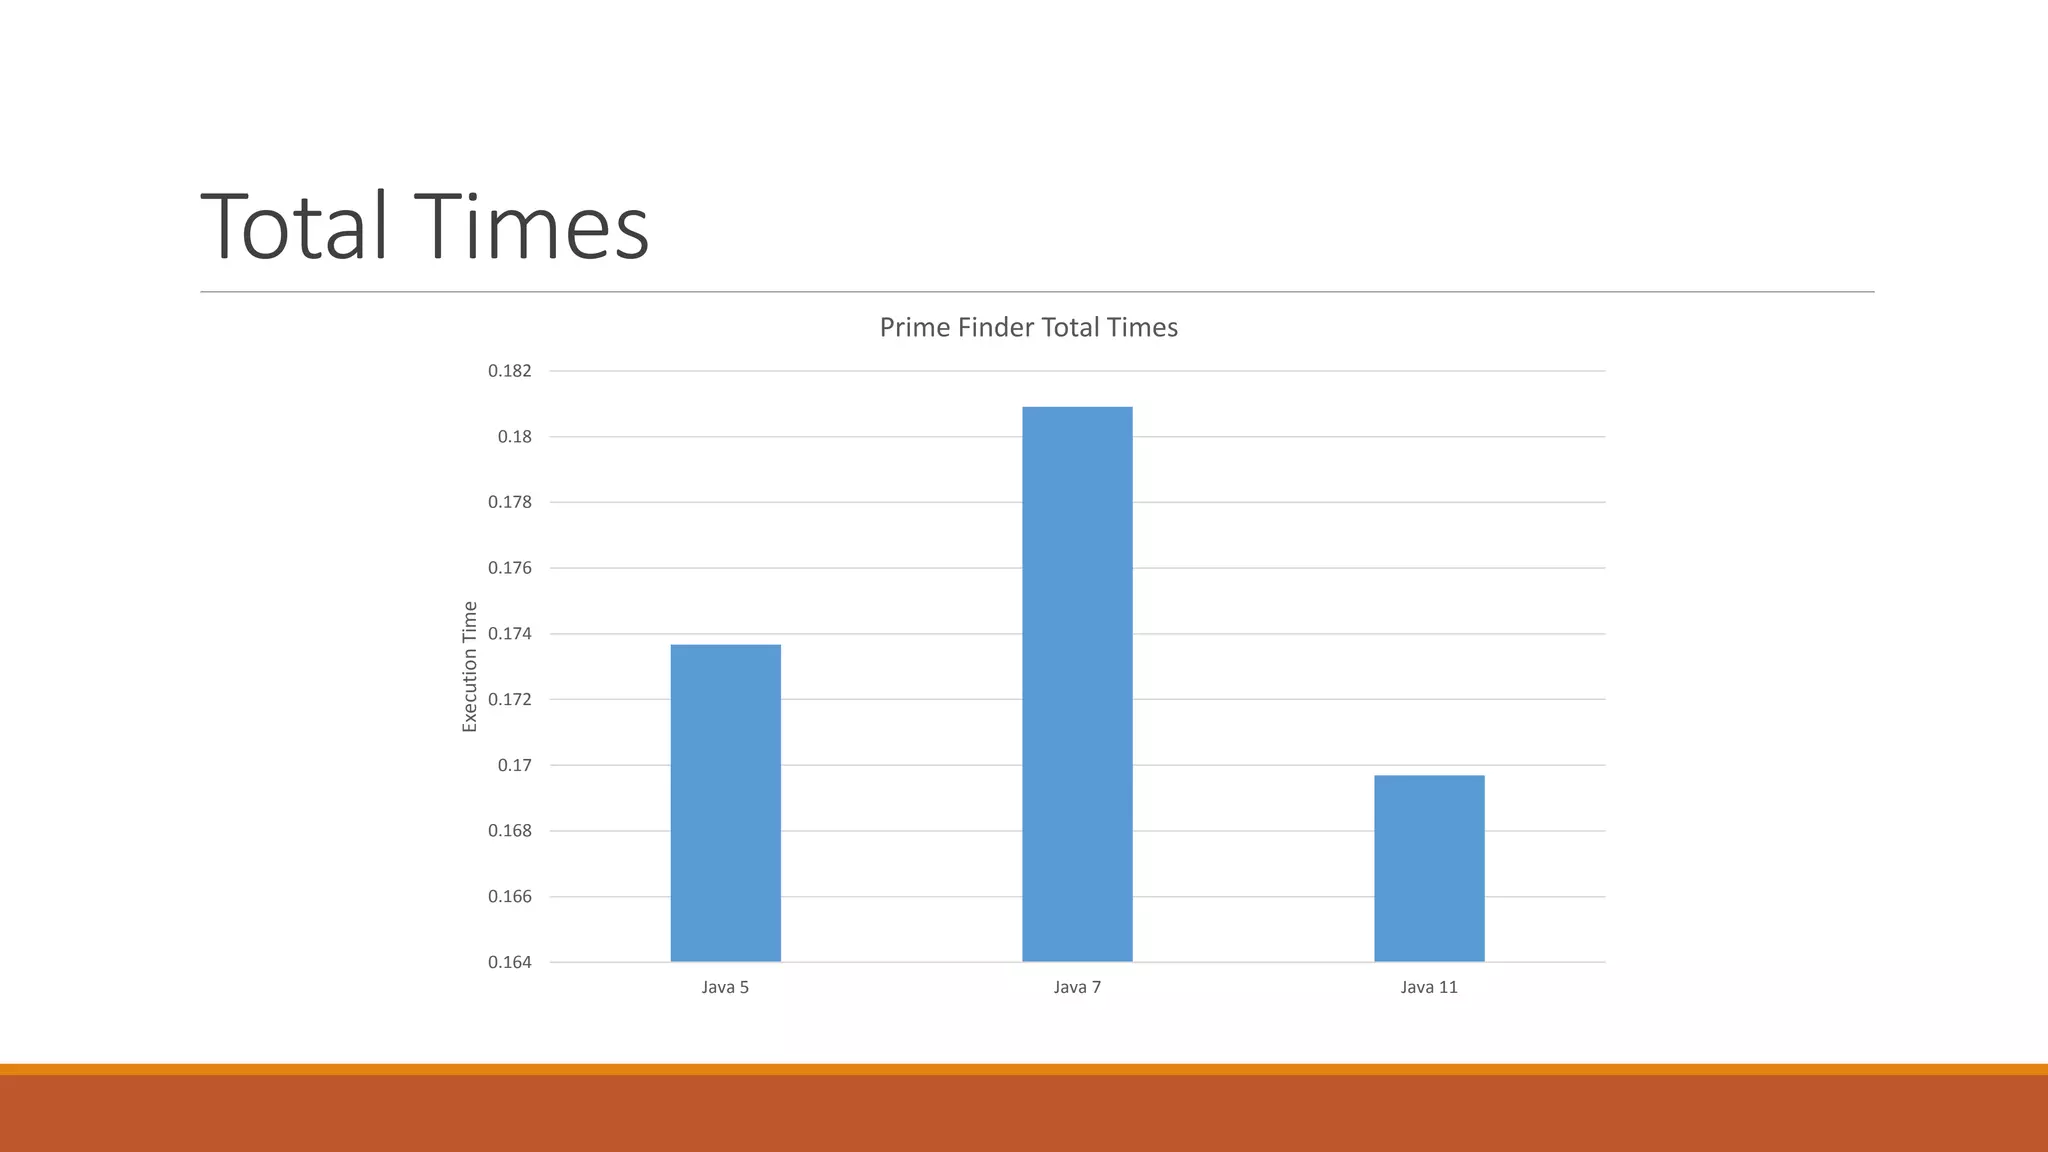
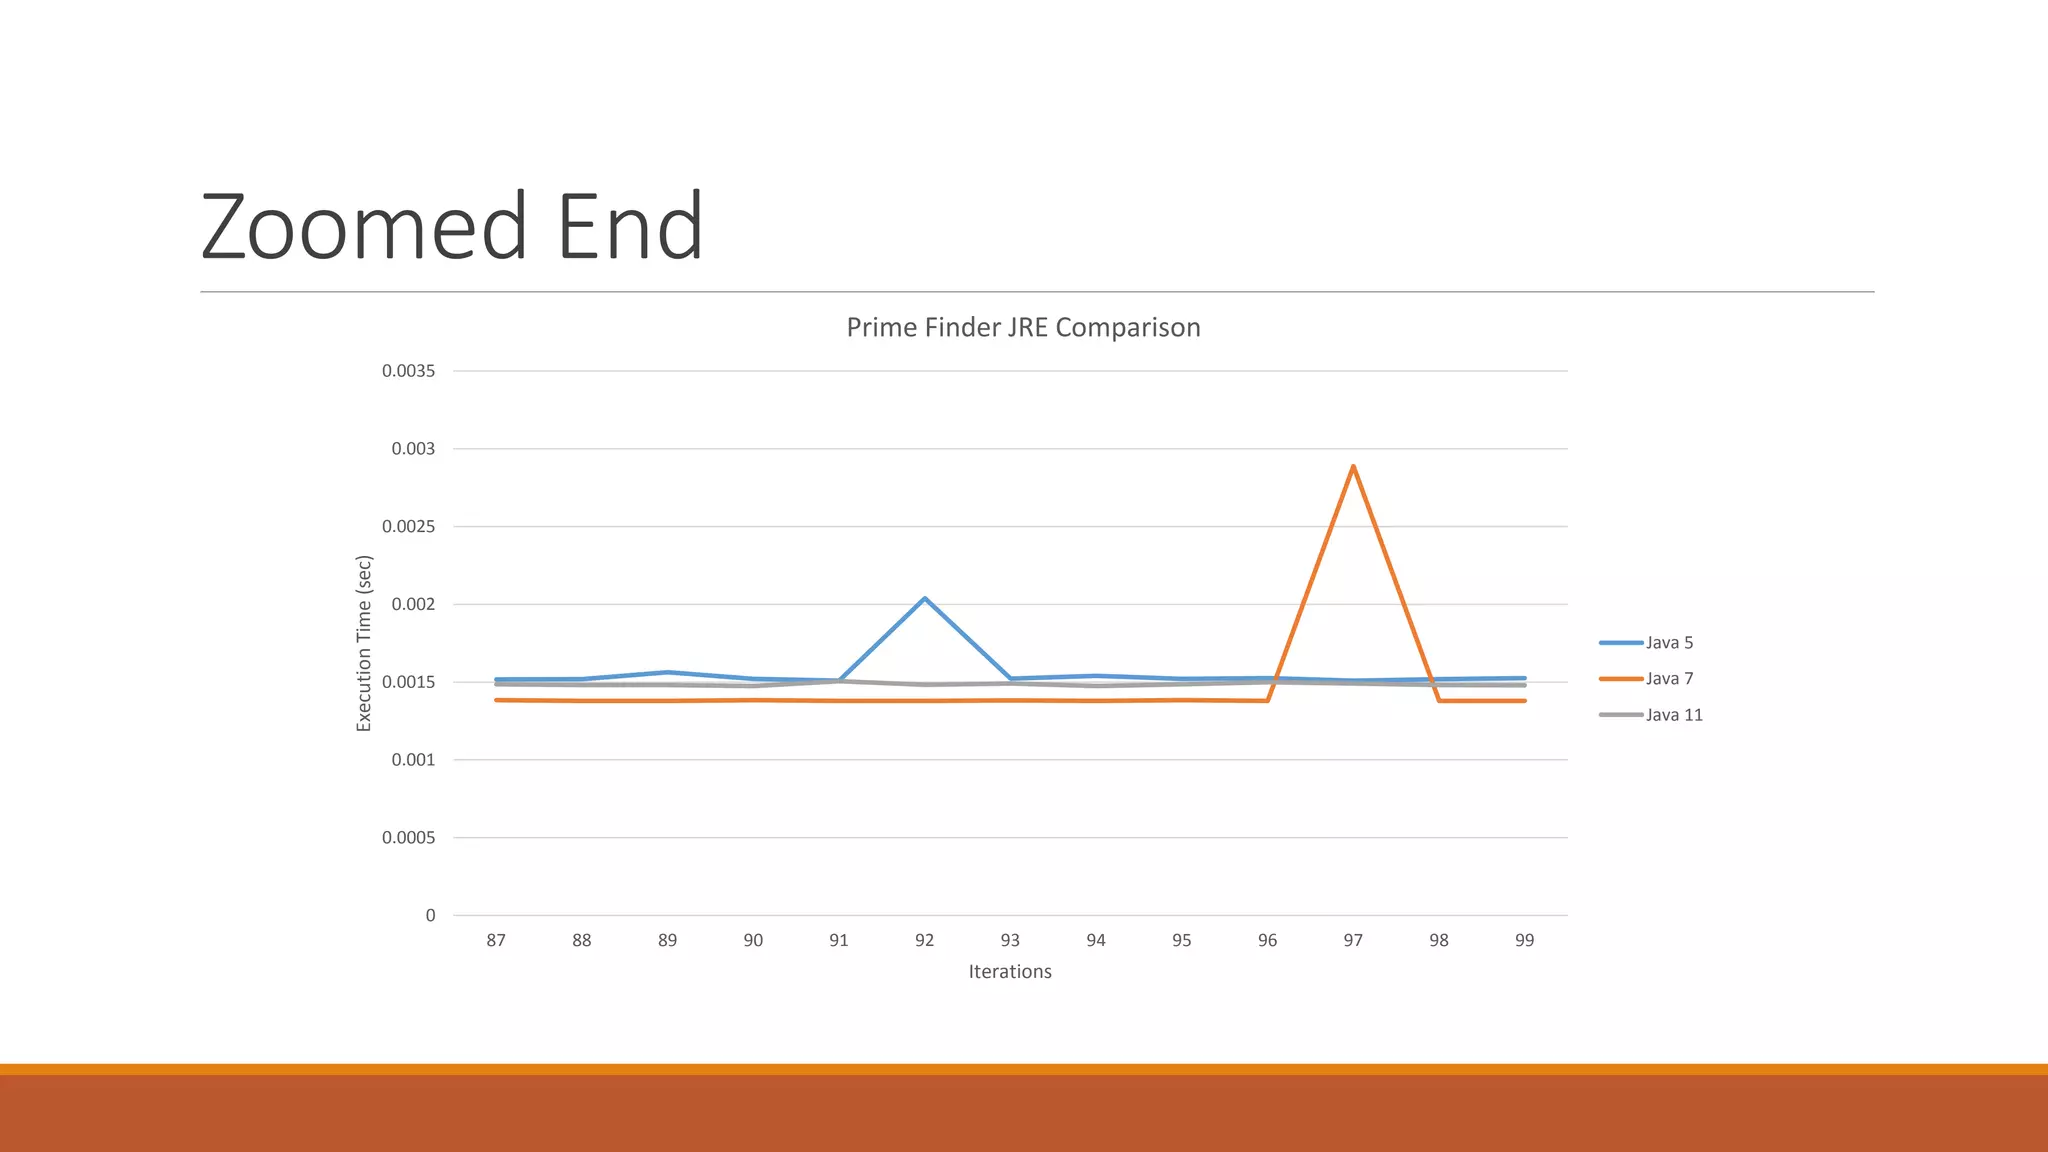
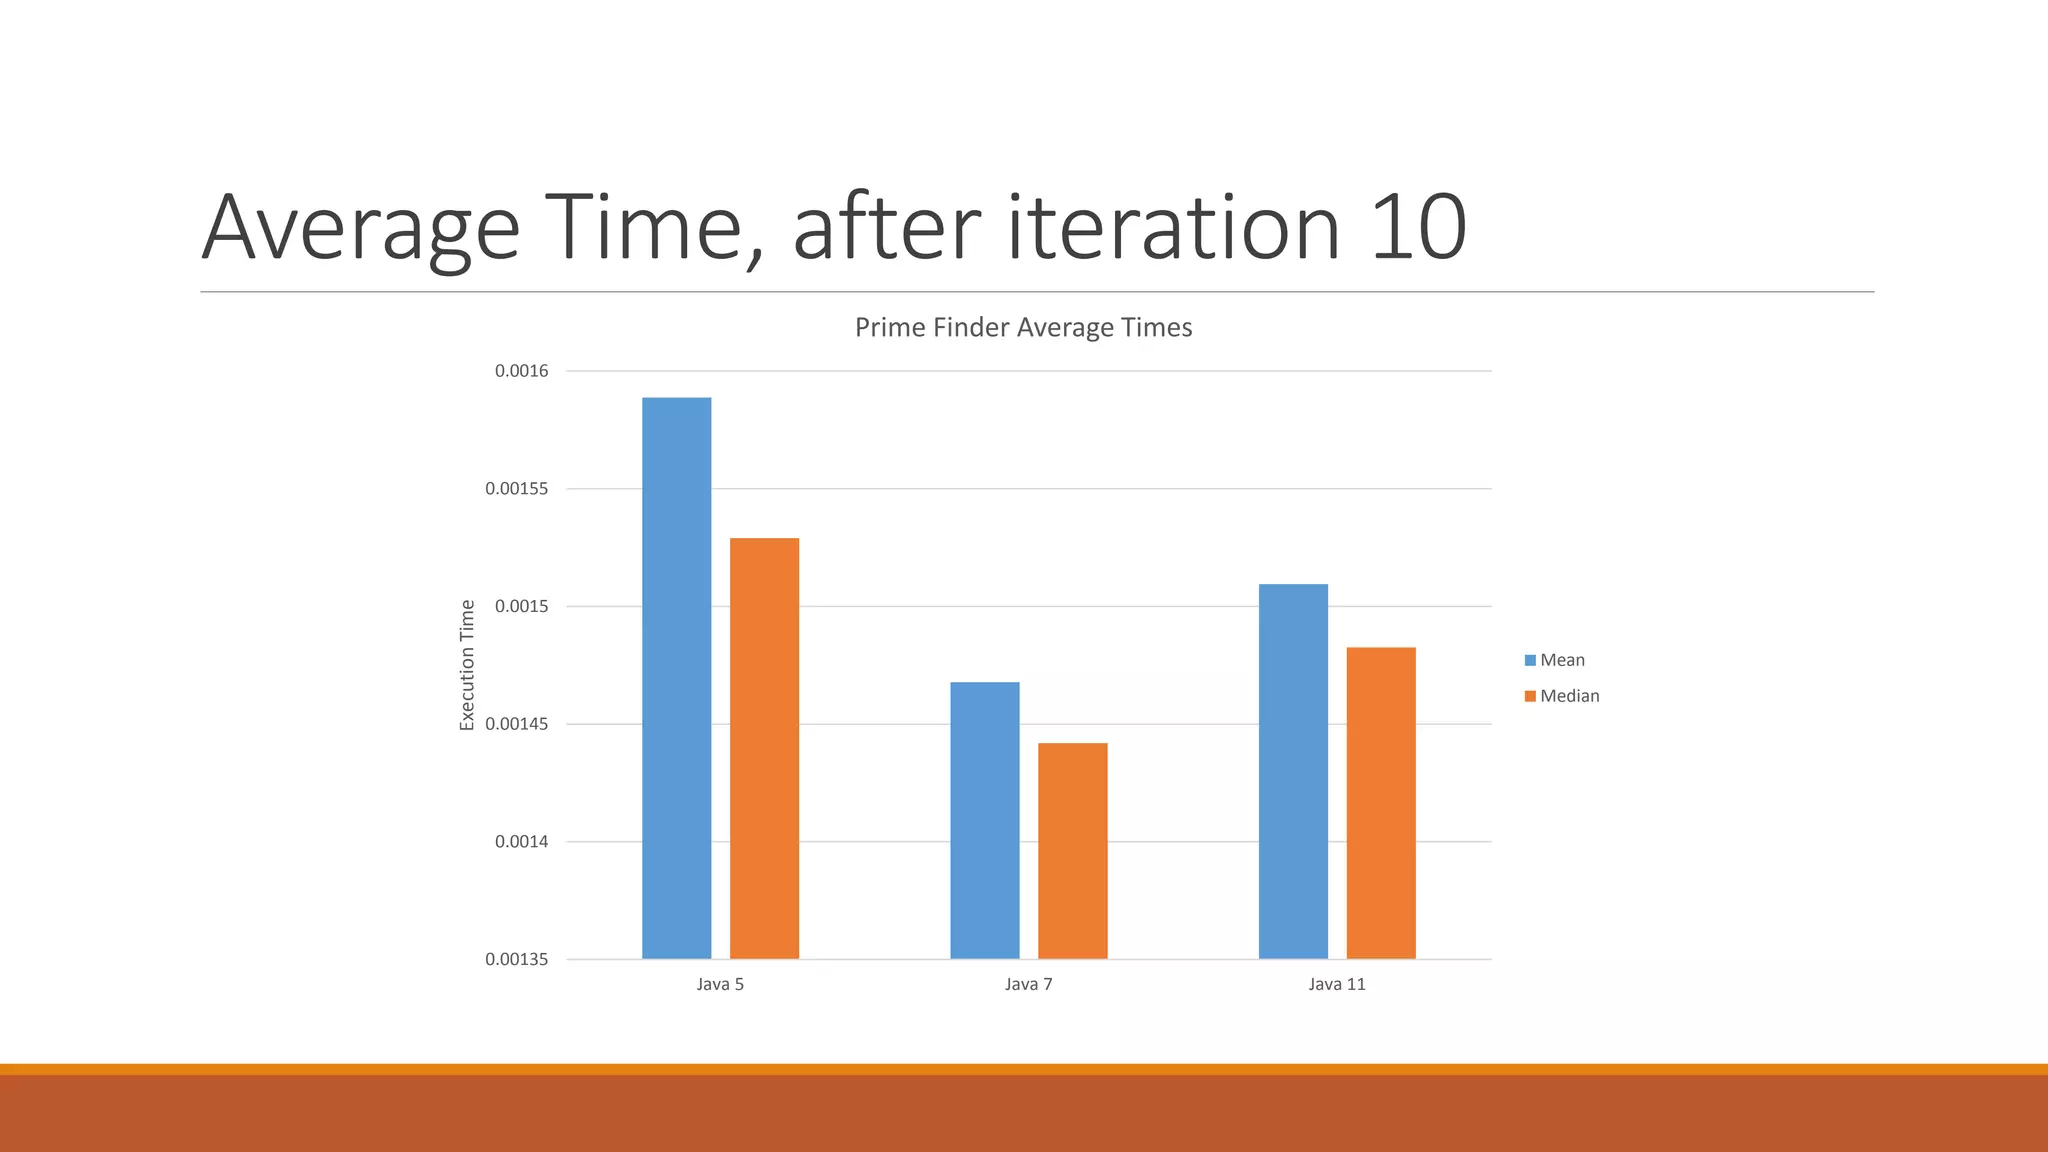
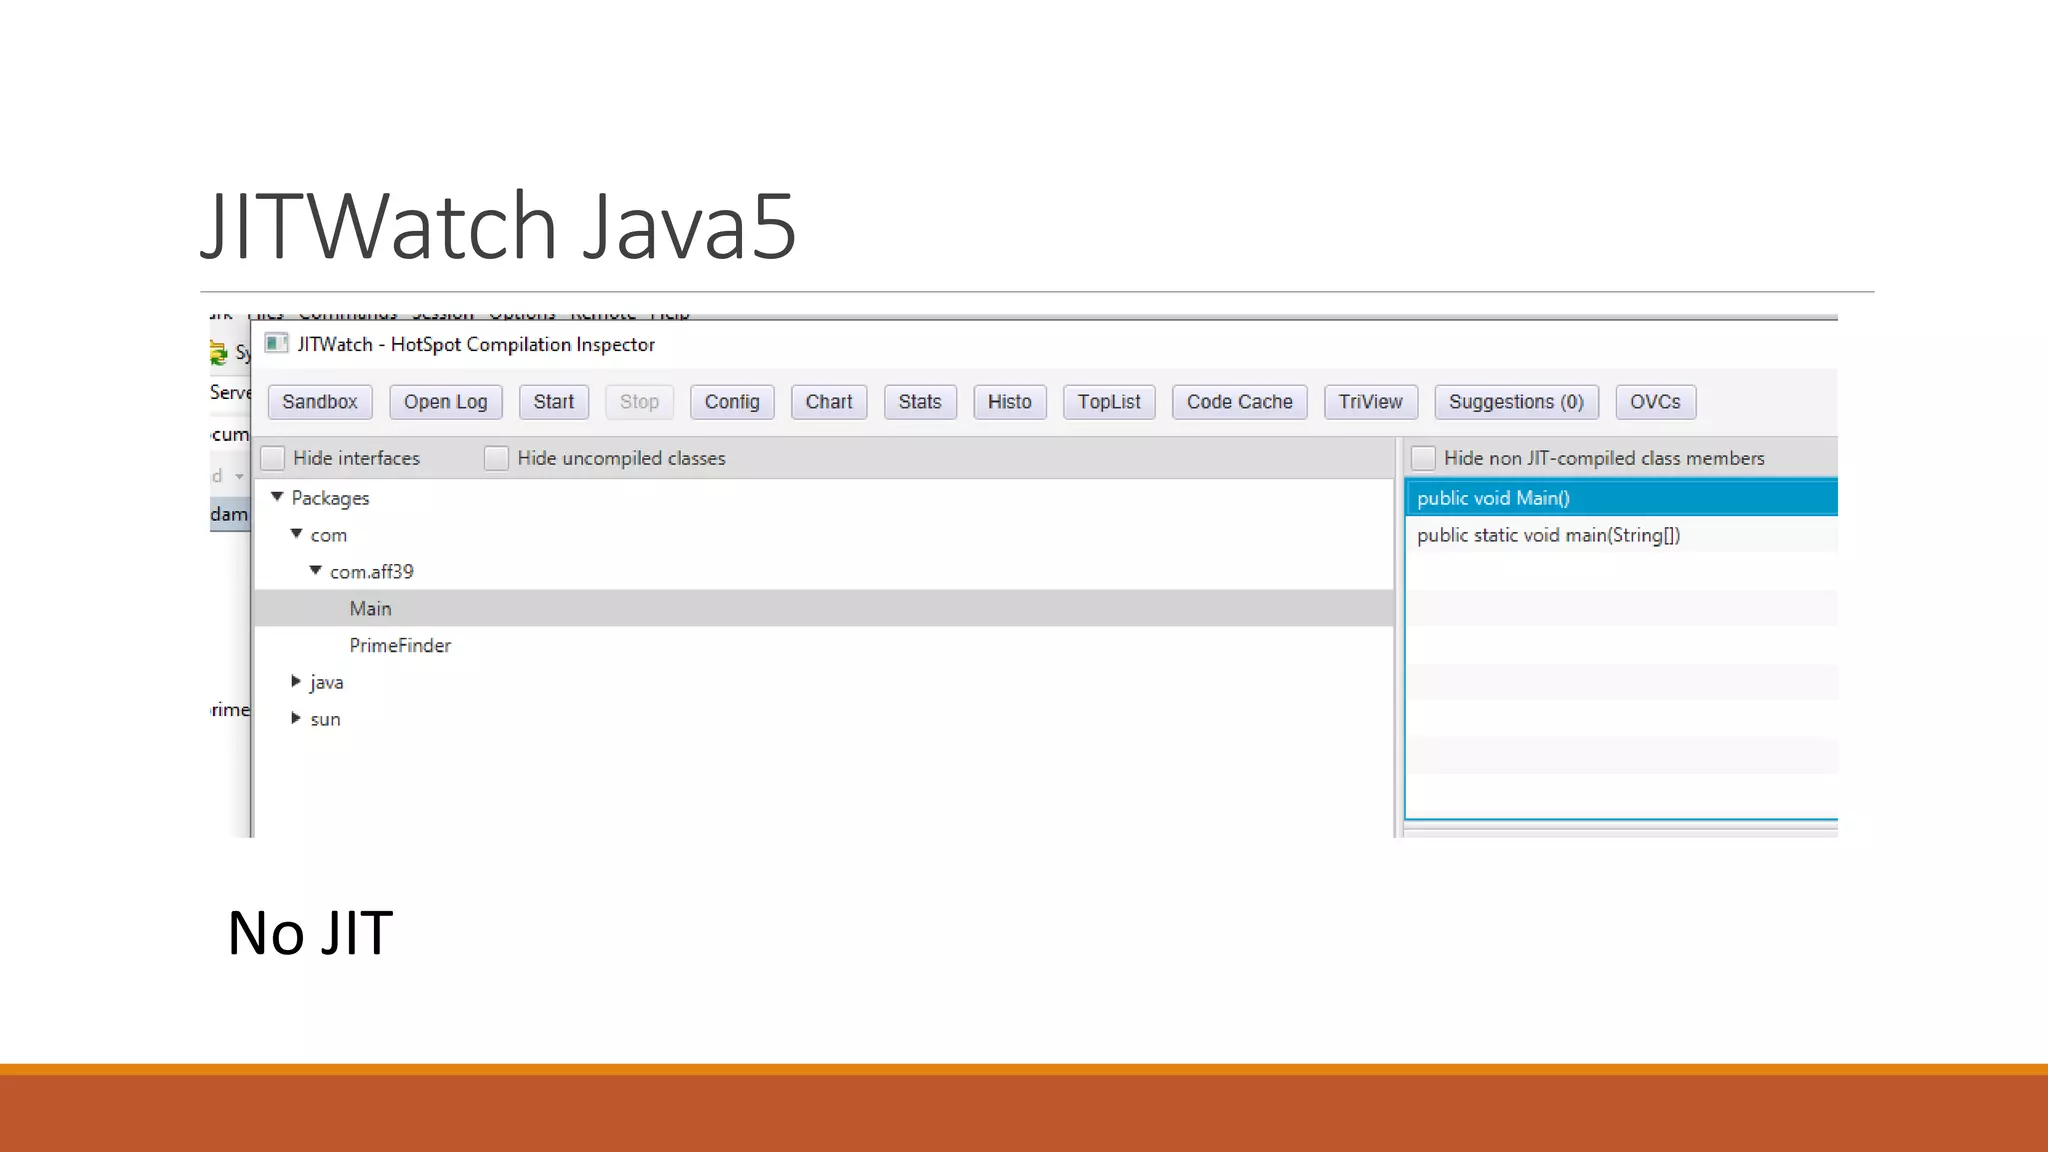
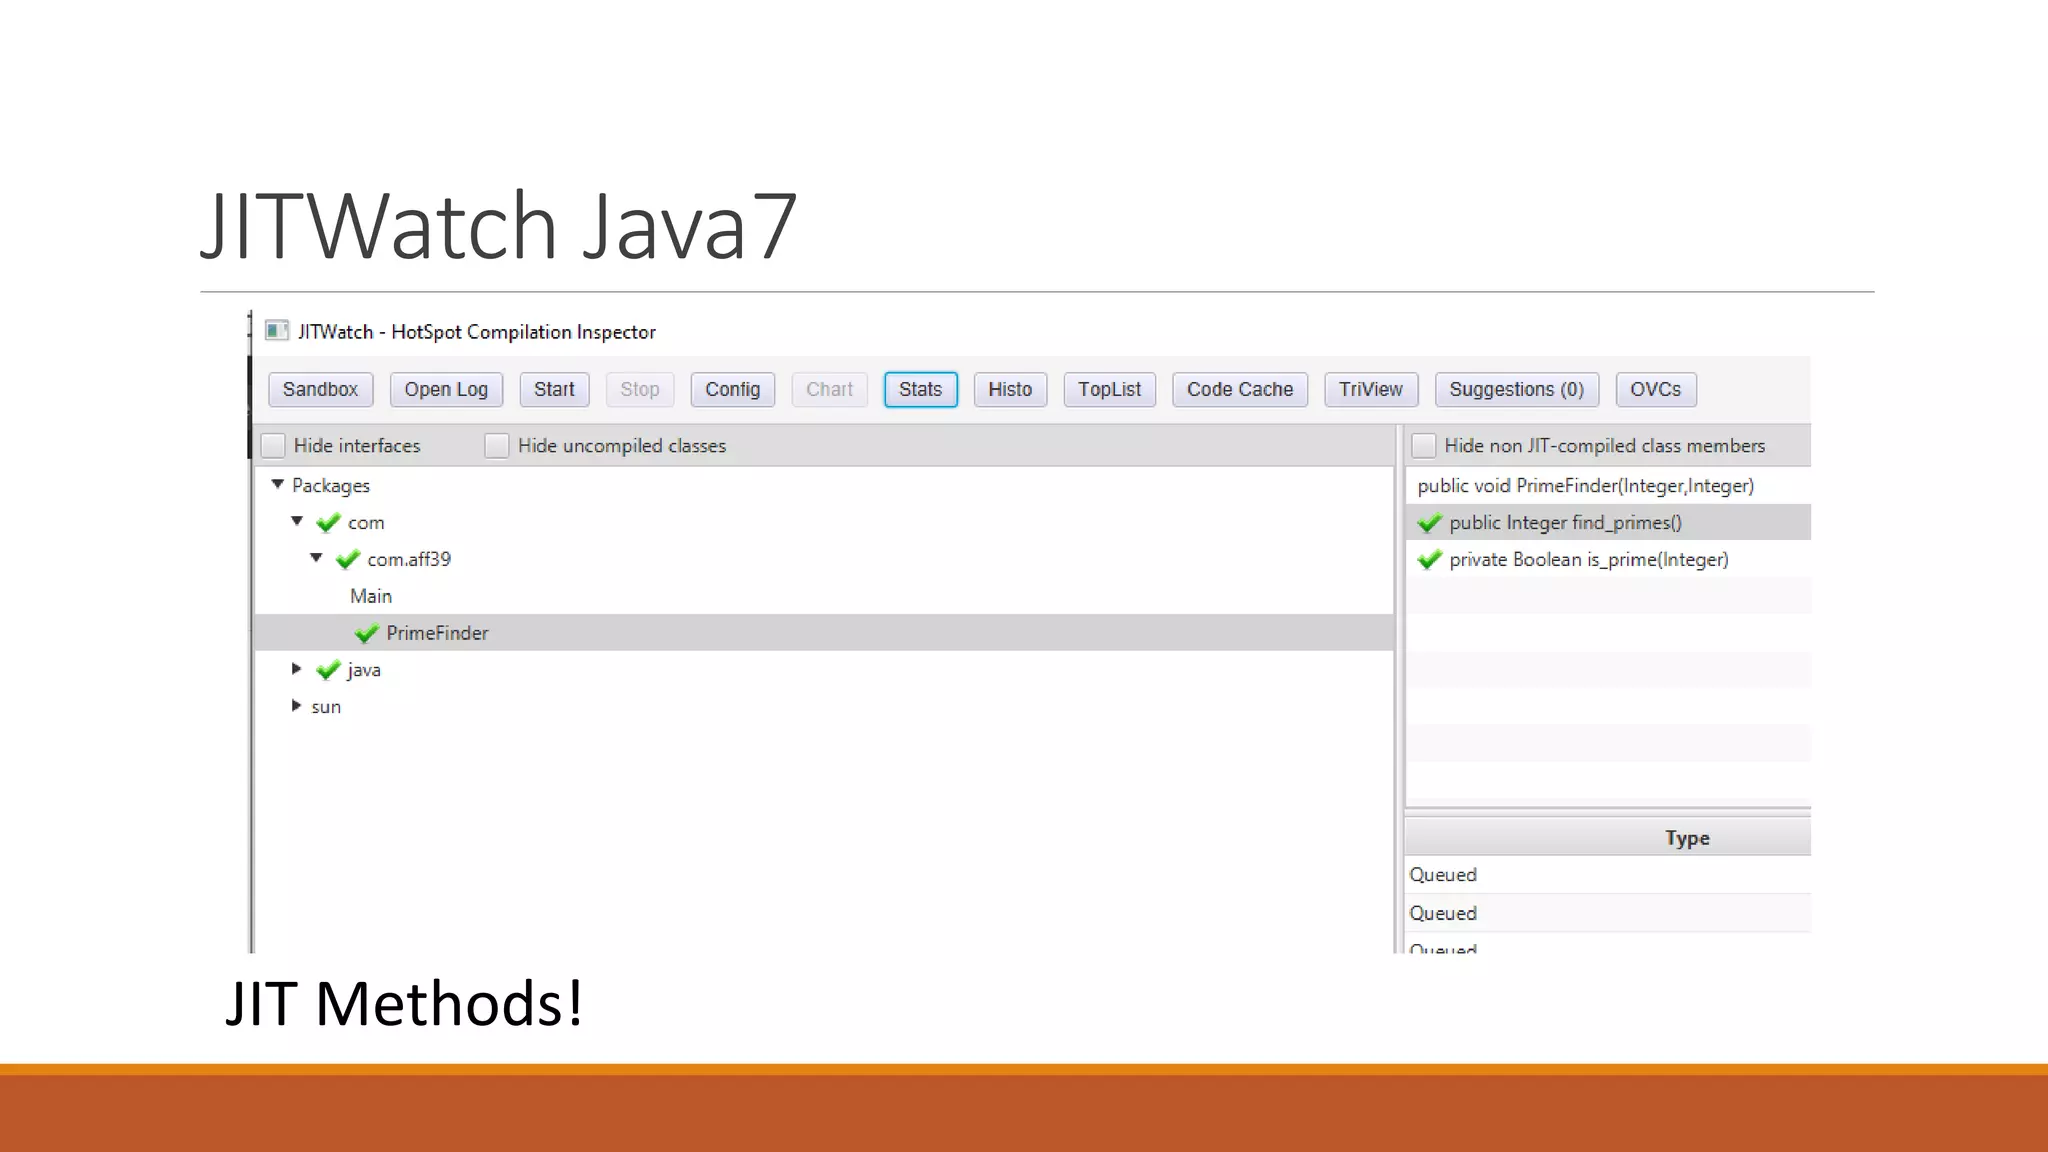
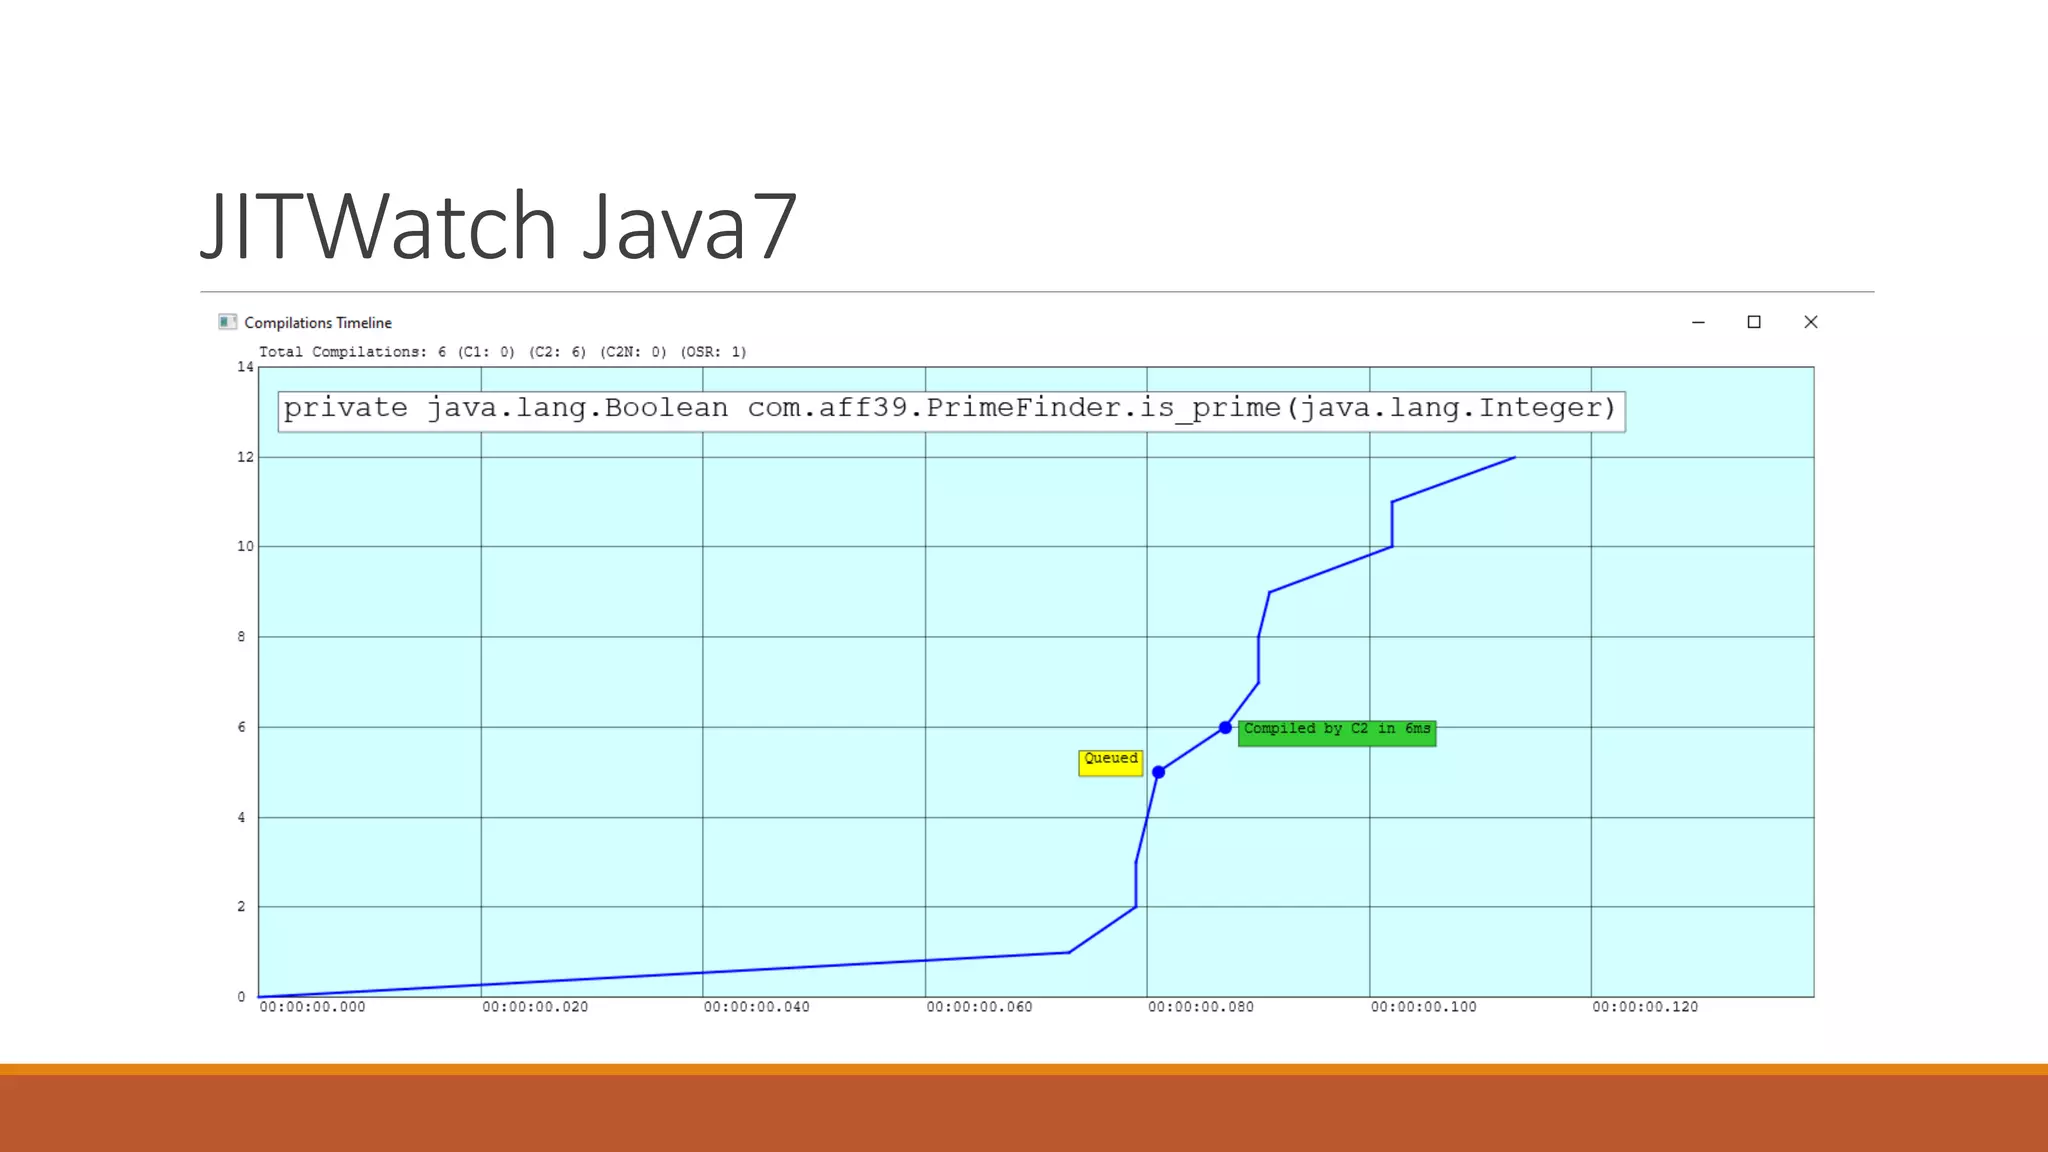
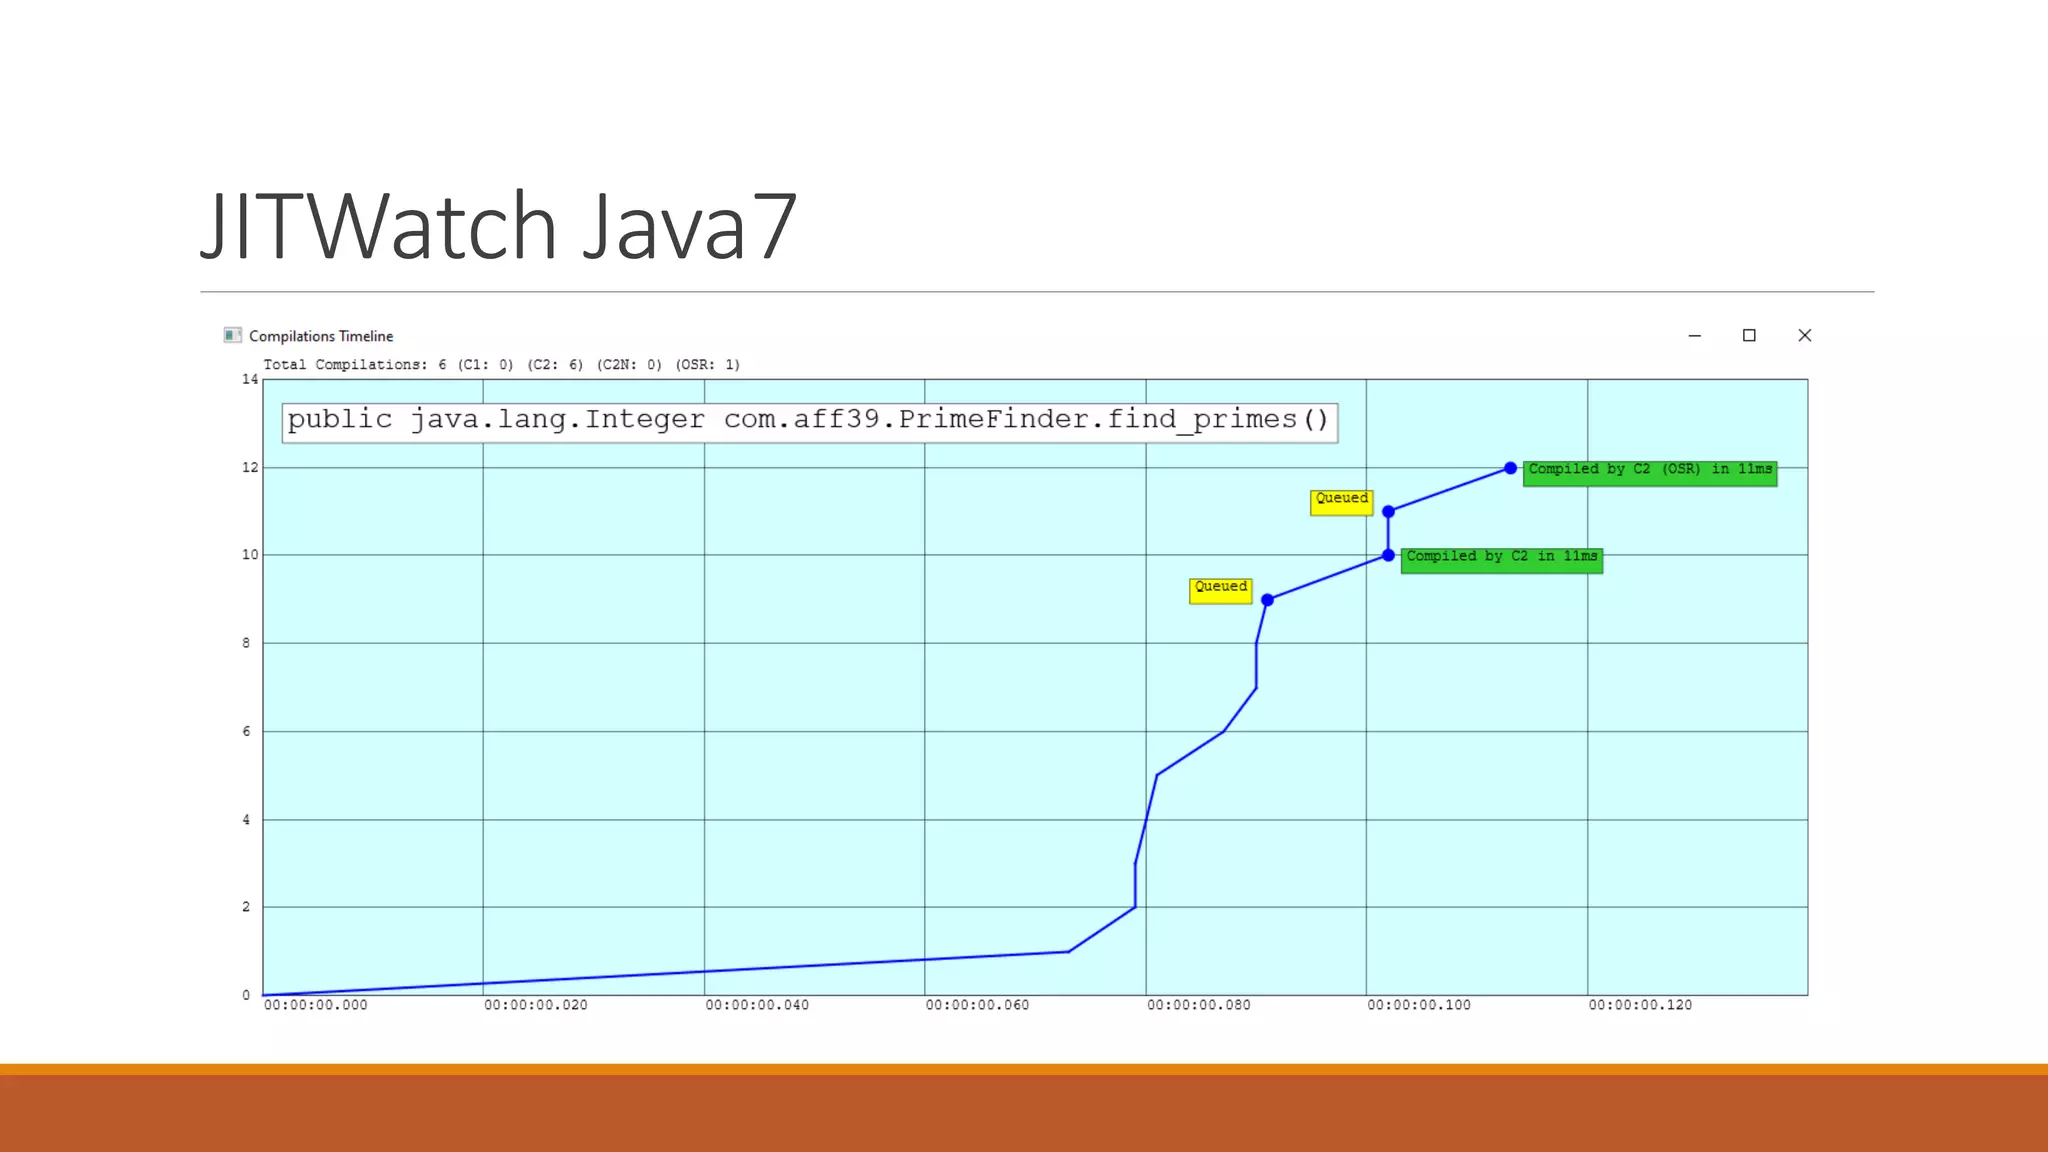
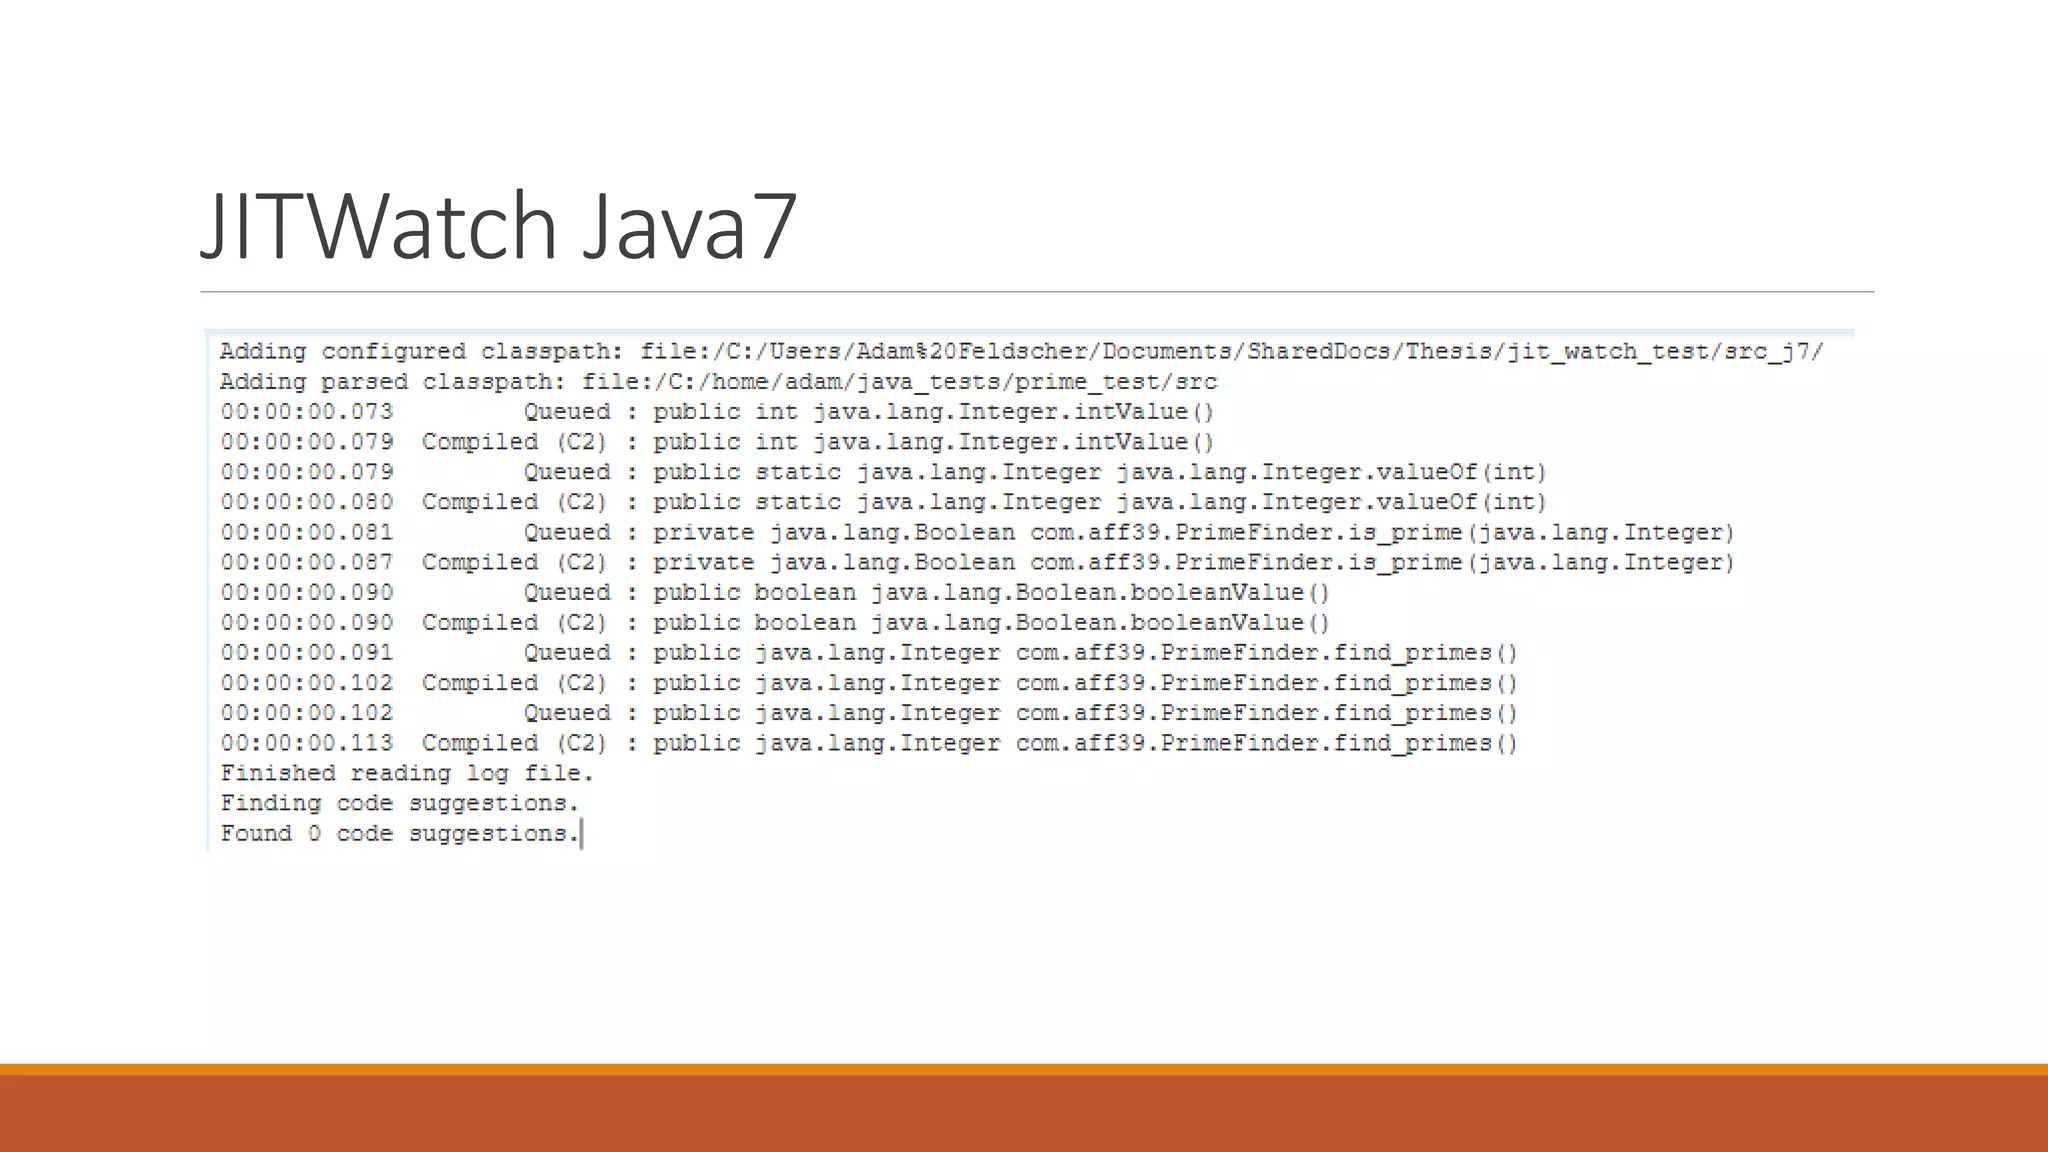
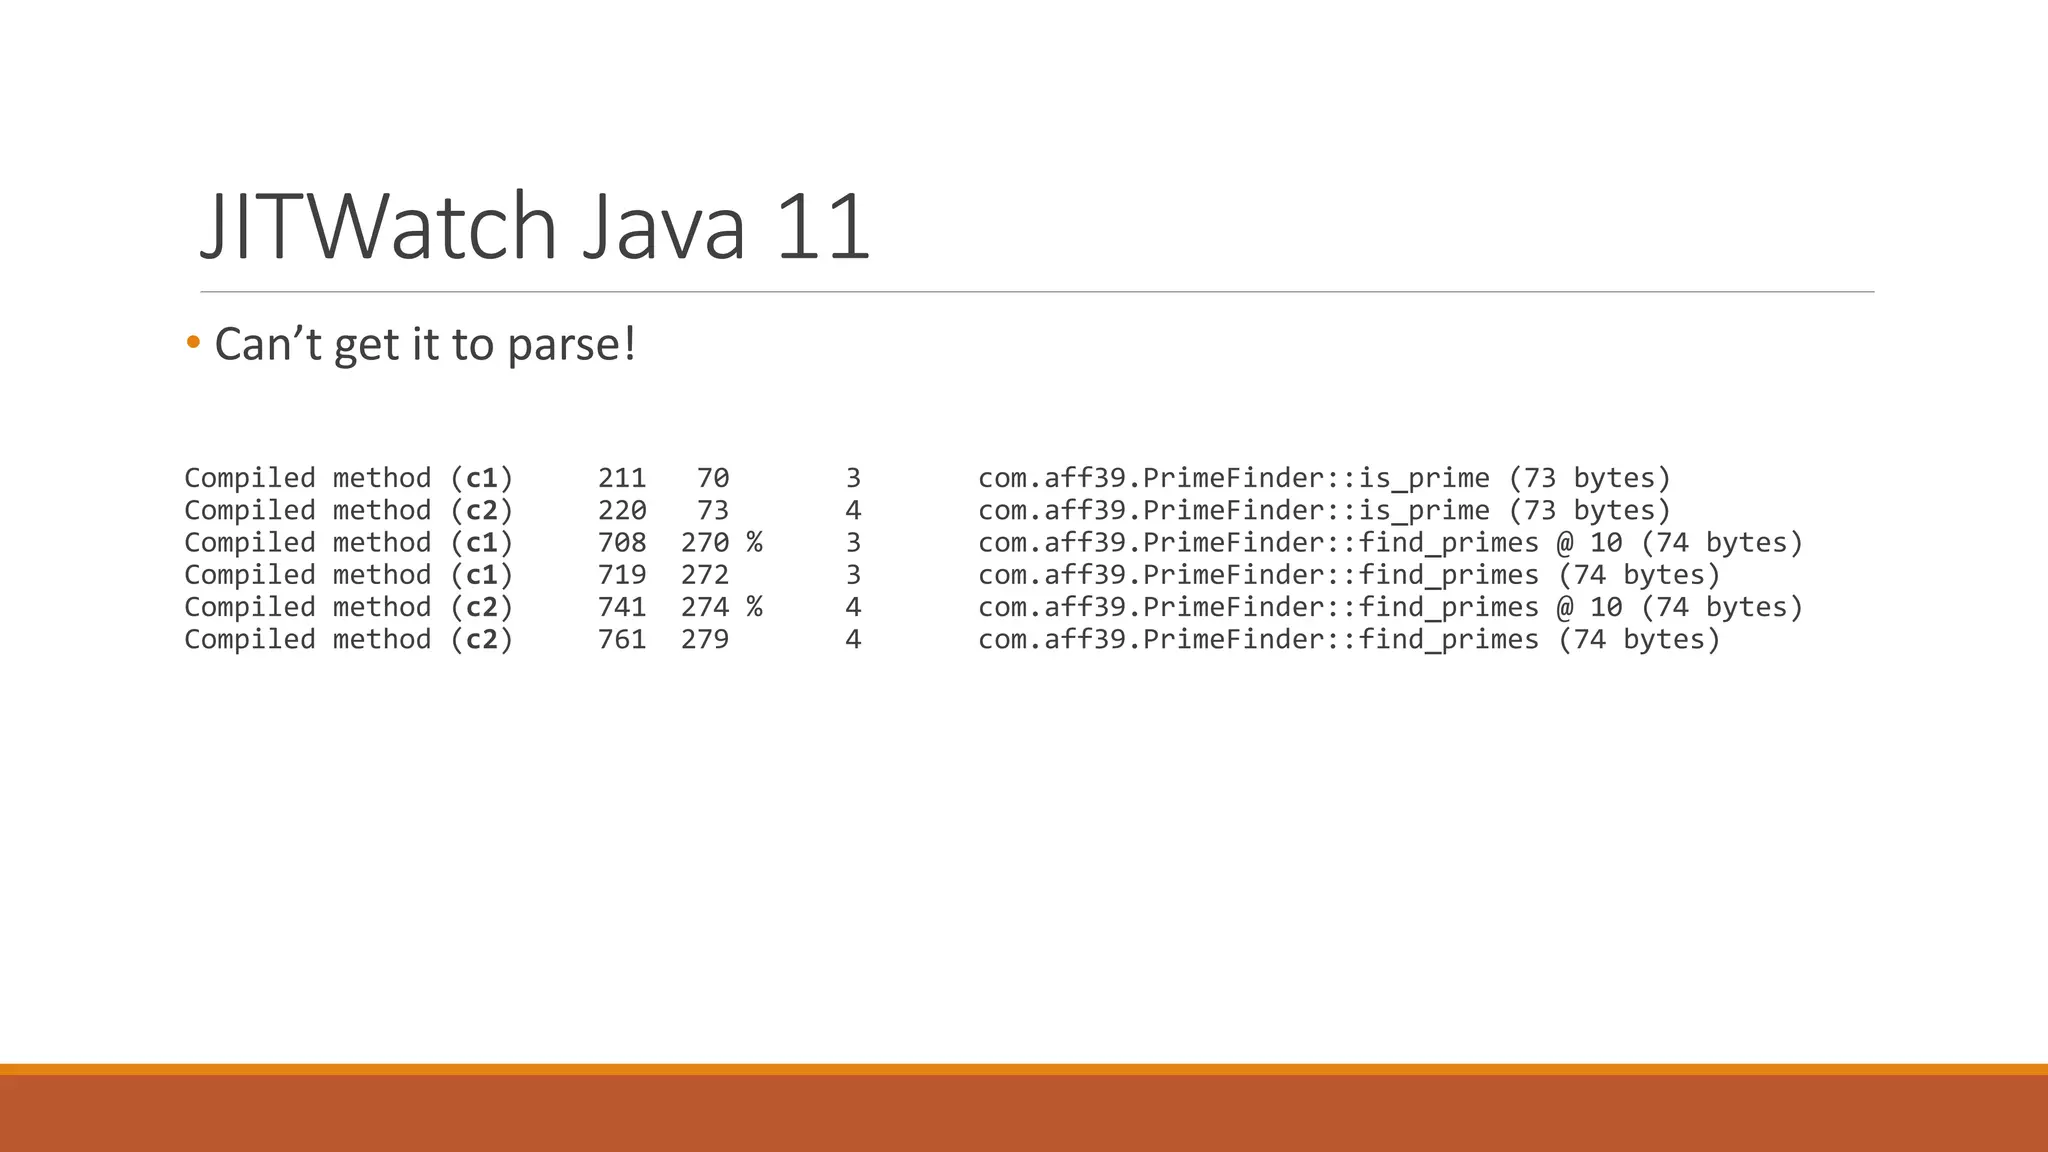
Java JIT Testing
ADAM FELDSCHER
CSI699 PERFORMANCE DESIGN II 10/29/2019
IEEE 2003
Random Program Generator for
Java JIT Compiler Test System
Yoshikawa, T., Shimura, K., & Ozawa, T. (2003). Random Program Generator For Java JIT
Compiler Test System. Third International Conference On Quality Software, 2003.
Proceedings. Doi: 10.1109/Qsic.2003.1319081
How to Test JIT?
• Developed random test program generator
◦ Generates random, but executable class files
◦ Generating human readable byte-code, not Java!
◦ Runs on target JIT compiler
◦ Compares results between compilers
• Number of classes decided randomly
◦ Makes random, acyclic, parenthood relationships
• Produces random methods in each class
◦ Random params
◦ Has them call each other, with priorities to avoid recursion
◦ INVOKESTATIC / INVOKEVIRTUAL
◦ Creates interfaces for some classes
Control Flow
• Adds branches in each method
◦ Including loops
• Field accesses are produced
◦ GETSTATIC/GETFIELD
• Adds other local variables
◦ And fills in with more byte codes
◦ Lots of Stack operations
Implementation and Evaluation
Can’t find the code…
OverOps Bullshifier 2016
• “built internally for heavy duty testing of monitoring tools on random Java
code”
• Generates large projects
◦ Flag for number of classes 500 – 20,000
◦ Deep call stacks
◦ Lots of code and logging
• Generated methods have:
◦ Variable definition, random types, random names
◦ Random exception throwing / Logging
◦ Calls to next method
◦ Unexecutable code
• https://github.com/takipi/java-bullshifier
Running their example
Sample Generations
• Black (color leveled, 2nd worst)
◦ 1000 Classes
◦ 50 Entry Points
◦ Switcher 200 max routes
◦ 1 Method per class
◦ 1 Log per method
• Arguments:
◦ java -cp black/build/libs/black.jar helpers.Main -ec 10000 -im 0 -hs
◦ Throw 10,000 exceptions
◦ 0 gap in-between
◦ Hide stack traces
Old Versions of Java
• JDK 1.1 – February 1997 -- No Linux
• JDK 1.2 Playground – December 1998 -- No 64 bit
• J2SE 5.0 Tiger – September 2004
• JDK 7 Dolphin – July 2011
• JDK 11 – September 2018
Test Machine
• Intel(R) Core(TM)2 Duo CPU E6550
◦ 64 Bit
◦ 2.33GHz
• 2GB Ram
• Ubuntu 18.04.3 LTS
Results
0
500
1000
1500
2000
2500
3000
3500
4000
4500
11 11 11 11 11 7 7 7 7 7 5 5 5 5 5
Runtime(ms)
JRE Version
Time to 10,000 Exceptions Bullshifer
Execution Time Average
Same Test, Prime Code
0
0.005
0.01
0.015
0.02
0.025
1 4 7 10 13 16 19 22 25 28 31 34 37 40 43 46 49 52 55 58 61 64 67 70 73 76 79 82 85 88 91 94 97 100
ExecutionTime(sec)
Iterations
Prime Finder JRE Comparison
Java 5
Java 7
Java 11
Zoomed Start
0
0.005
0.01
0.015
0.02
0.025
1 2 3 4 5 6 7 8
ExecutionTime
Iterations
Prime Finder JRE Comparison (zoomed)
Java 5
Java 7
Java 11
Total Times
0.164
0.166
0.168
0.17
0.172
0.174
0.176
0.178
0.18
0.182
Java 5 Java 7 Java 11
ExecutionTime
Prime Finder Total Times
Zoomed End
0
0.0005
0.001
0.0015
0.002
0.0025
0.003
0.0035
87 88 89 90 91 92 93 94 95 96 97 98 99
ExecutionTime(sec)
Iterations
Prime Finder JRE Comparison
Java 5
Java 7
Java 11
Average Time, after iteration 10
0.00135
0.0014
0.00145
0.0015
0.00155
0.0016
Java 5 Java 7 Java 11
ExecutionTime
Prime Finder Average Times
Mean
Median
JITWatch Java5
No JIT
JITWatch Java7
JIT Methods!
JITWatch Java7
JITWatch Java7
JITWatch Java7
JITWatch Java 11
• Can’t get it to parse!
Compiled method (c1) 211 70 3 com.aff39.PrimeFinder::is_prime (73 bytes)
Compiled method (c2) 220 73 4 com.aff39.PrimeFinder::is_prime (73 bytes)
Compiled method (c1) 708 270 % 3 com.aff39.PrimeFinder::find_primes @ 10 (74 bytes)
Compiled method (c1) 719 272 3 com.aff39.PrimeFinder::find_primes (74 bytes)
Compiled method (c2) 741 274 % 4 com.aff39.PrimeFinder::find_primes @ 10 (74 bytes)
Compiled method (c2) 761 279 4 com.aff39.PrimeFinder::find_primes (74 bytes)

Java JIT Performance Testing and Results

  • 1.
    Java JIT Testing ADAMFELDSCHER CSI699 PERFORMANCE DESIGN II 10/29/2019
  • 2.
    IEEE 2003 Random ProgramGenerator for Java JIT Compiler Test System Yoshikawa, T., Shimura, K., & Ozawa, T. (2003). Random Program Generator For Java JIT Compiler Test System. Third International Conference On Quality Software, 2003. Proceedings. Doi: 10.1109/Qsic.2003.1319081
  • 3.
    How to TestJIT? • Developed random test program generator ◦ Generates random, but executable class files ◦ Generating human readable byte-code, not Java! ◦ Runs on target JIT compiler ◦ Compares results between compilers • Number of classes decided randomly ◦ Makes random, acyclic, parenthood relationships • Produces random methods in each class ◦ Random params ◦ Has them call each other, with priorities to avoid recursion ◦ INVOKESTATIC / INVOKEVIRTUAL ◦ Creates interfaces for some classes
  • 4.
    Control Flow • Addsbranches in each method ◦ Including loops • Field accesses are produced ◦ GETSTATIC/GETFIELD • Adds other local variables ◦ And fills in with more byte codes ◦ Lots of Stack operations
  • 5.
  • 6.
  • 7.
    OverOps Bullshifier 2016 •“built internally for heavy duty testing of monitoring tools on random Java code” • Generates large projects ◦ Flag for number of classes 500 – 20,000 ◦ Deep call stacks ◦ Lots of code and logging • Generated methods have: ◦ Variable definition, random types, random names ◦ Random exception throwing / Logging ◦ Calls to next method ◦ Unexecutable code • https://github.com/takipi/java-bullshifier
  • 8.
  • 9.
    Sample Generations • Black(color leveled, 2nd worst) ◦ 1000 Classes ◦ 50 Entry Points ◦ Switcher 200 max routes ◦ 1 Method per class ◦ 1 Log per method • Arguments: ◦ java -cp black/build/libs/black.jar helpers.Main -ec 10000 -im 0 -hs ◦ Throw 10,000 exceptions ◦ 0 gap in-between ◦ Hide stack traces
  • 10.
    Old Versions ofJava • JDK 1.1 – February 1997 -- No Linux • JDK 1.2 Playground – December 1998 -- No 64 bit • J2SE 5.0 Tiger – September 2004 • JDK 7 Dolphin – July 2011 • JDK 11 – September 2018
  • 11.
    Test Machine • Intel(R)Core(TM)2 Duo CPU E6550 ◦ 64 Bit ◦ 2.33GHz • 2GB Ram • Ubuntu 18.04.3 LTS
  • 12.
    Results 0 500 1000 1500 2000 2500 3000 3500 4000 4500 11 11 1111 11 7 7 7 7 7 5 5 5 5 5 Runtime(ms) JRE Version Time to 10,000 Exceptions Bullshifer Execution Time Average
  • 13.
    Same Test, PrimeCode 0 0.005 0.01 0.015 0.02 0.025 1 4 7 10 13 16 19 22 25 28 31 34 37 40 43 46 49 52 55 58 61 64 67 70 73 76 79 82 85 88 91 94 97 100 ExecutionTime(sec) Iterations Prime Finder JRE Comparison Java 5 Java 7 Java 11
  • 14.
    Zoomed Start 0 0.005 0.01 0.015 0.02 0.025 1 23 4 5 6 7 8 ExecutionTime Iterations Prime Finder JRE Comparison (zoomed) Java 5 Java 7 Java 11
  • 15.
    Total Times 0.164 0.166 0.168 0.17 0.172 0.174 0.176 0.178 0.18 0.182 Java 5Java 7 Java 11 ExecutionTime Prime Finder Total Times
  • 16.
    Zoomed End 0 0.0005 0.001 0.0015 0.002 0.0025 0.003 0.0035 87 8889 90 91 92 93 94 95 96 97 98 99 ExecutionTime(sec) Iterations Prime Finder JRE Comparison Java 5 Java 7 Java 11
  • 17.
    Average Time, afteriteration 10 0.00135 0.0014 0.00145 0.0015 0.00155 0.0016 Java 5 Java 7 Java 11 ExecutionTime Prime Finder Average Times Mean Median
  • 18.
  • 19.
  • 20.
  • 21.
  • 22.
  • 23.
    JITWatch Java 11 •Can’t get it to parse! Compiled method (c1) 211 70 3 com.aff39.PrimeFinder::is_prime (73 bytes) Compiled method (c2) 220 73 4 com.aff39.PrimeFinder::is_prime (73 bytes) Compiled method (c1) 708 270 % 3 com.aff39.PrimeFinder::find_primes @ 10 (74 bytes) Compiled method (c1) 719 272 3 com.aff39.PrimeFinder::find_primes (74 bytes) Compiled method (c2) 741 274 % 4 com.aff39.PrimeFinder::find_primes @ 10 (74 bytes) Compiled method (c2) 761 279 4 com.aff39.PrimeFinder::find_primes (74 bytes)

Editor's Notes

  • #13 Its exception handling code! So maybe java 11 is doing more for exceptions? Or we’re not optimizing in the same ways
  • #15 7, 5, 11
  • #16 7, 5, 11 still, JIT being the biggest factor
  • #17 5, 11, 7 now
  • #18 5, 11, 7 7 Spent more time Jit-ing, maybe it compiled lower, or used more in depth optimizations