What is Excel?
•• Microsoft Excel is a spreadsheet application
used to store, organize, and analyze data.
• • Part of the Microsoft Office Suite.
• • Used by individuals, students, and
businesses worldwide.
3.
Why Learn Excel?
•• Organize and store large data
• • Perform automatic calculations
• • Create charts & graphs
• • Analyze trends
• • Build reports, budgets, and invoices
• • Used in almost every profession
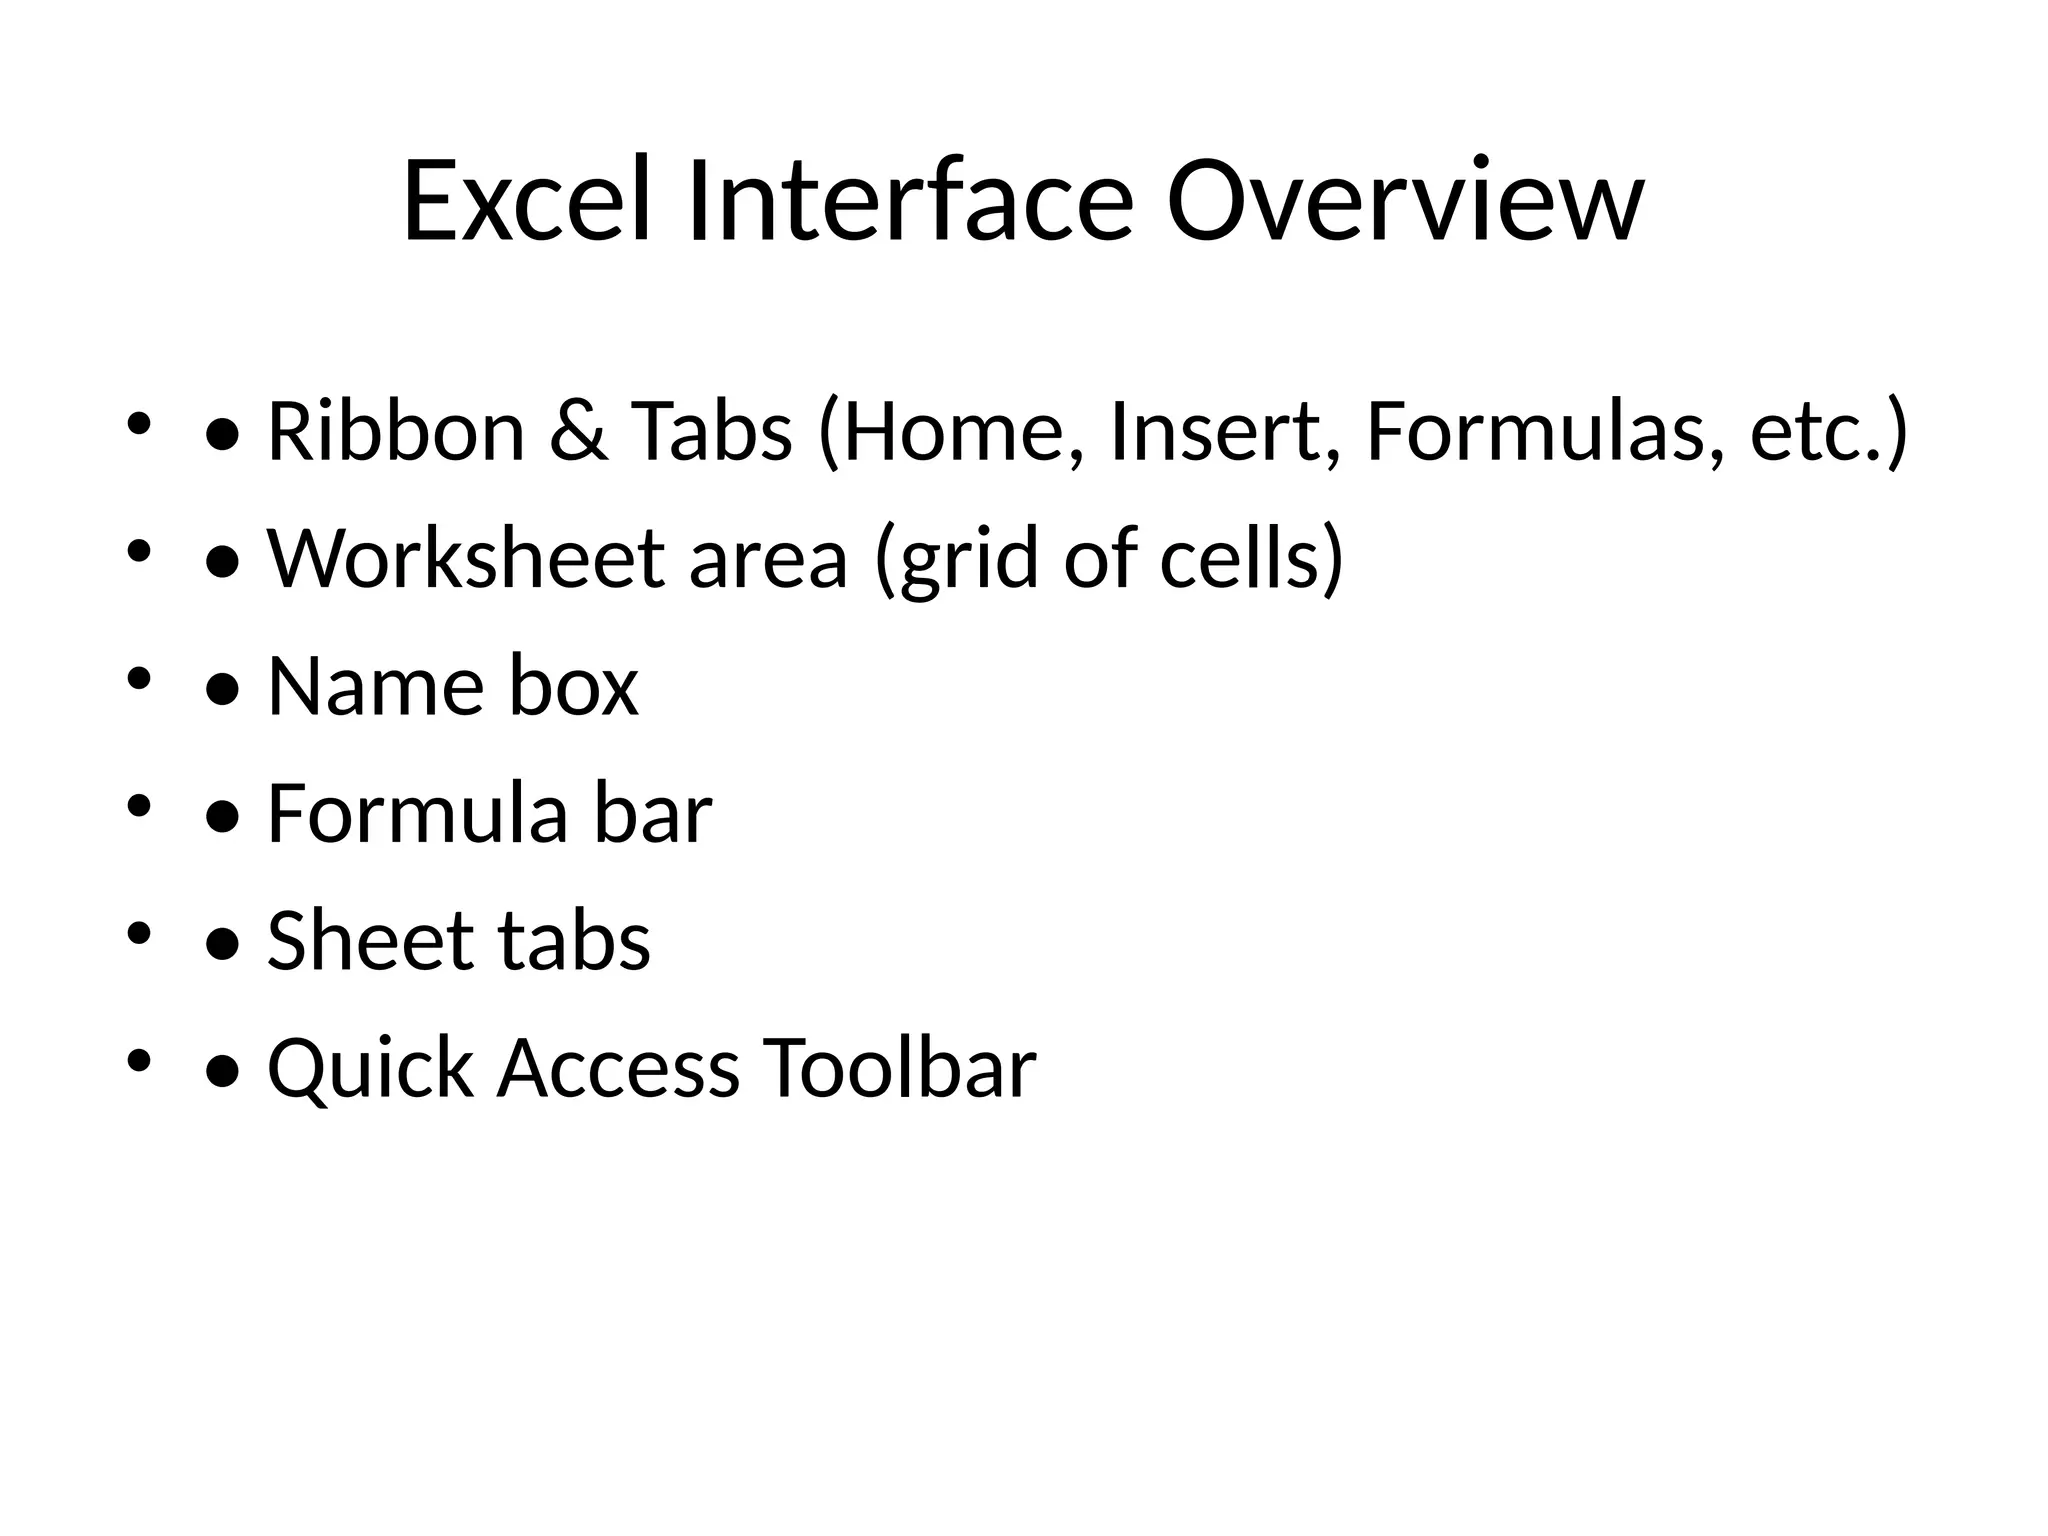
Excel Interface Overview
•• Ribbon & Tabs (Home, Insert, Formulas, etc.)
• • Worksheet area (grid of cells)
• • Name box
• • Formula bar
• • Sheet tabs
• • Quick Access Toolbar
6.
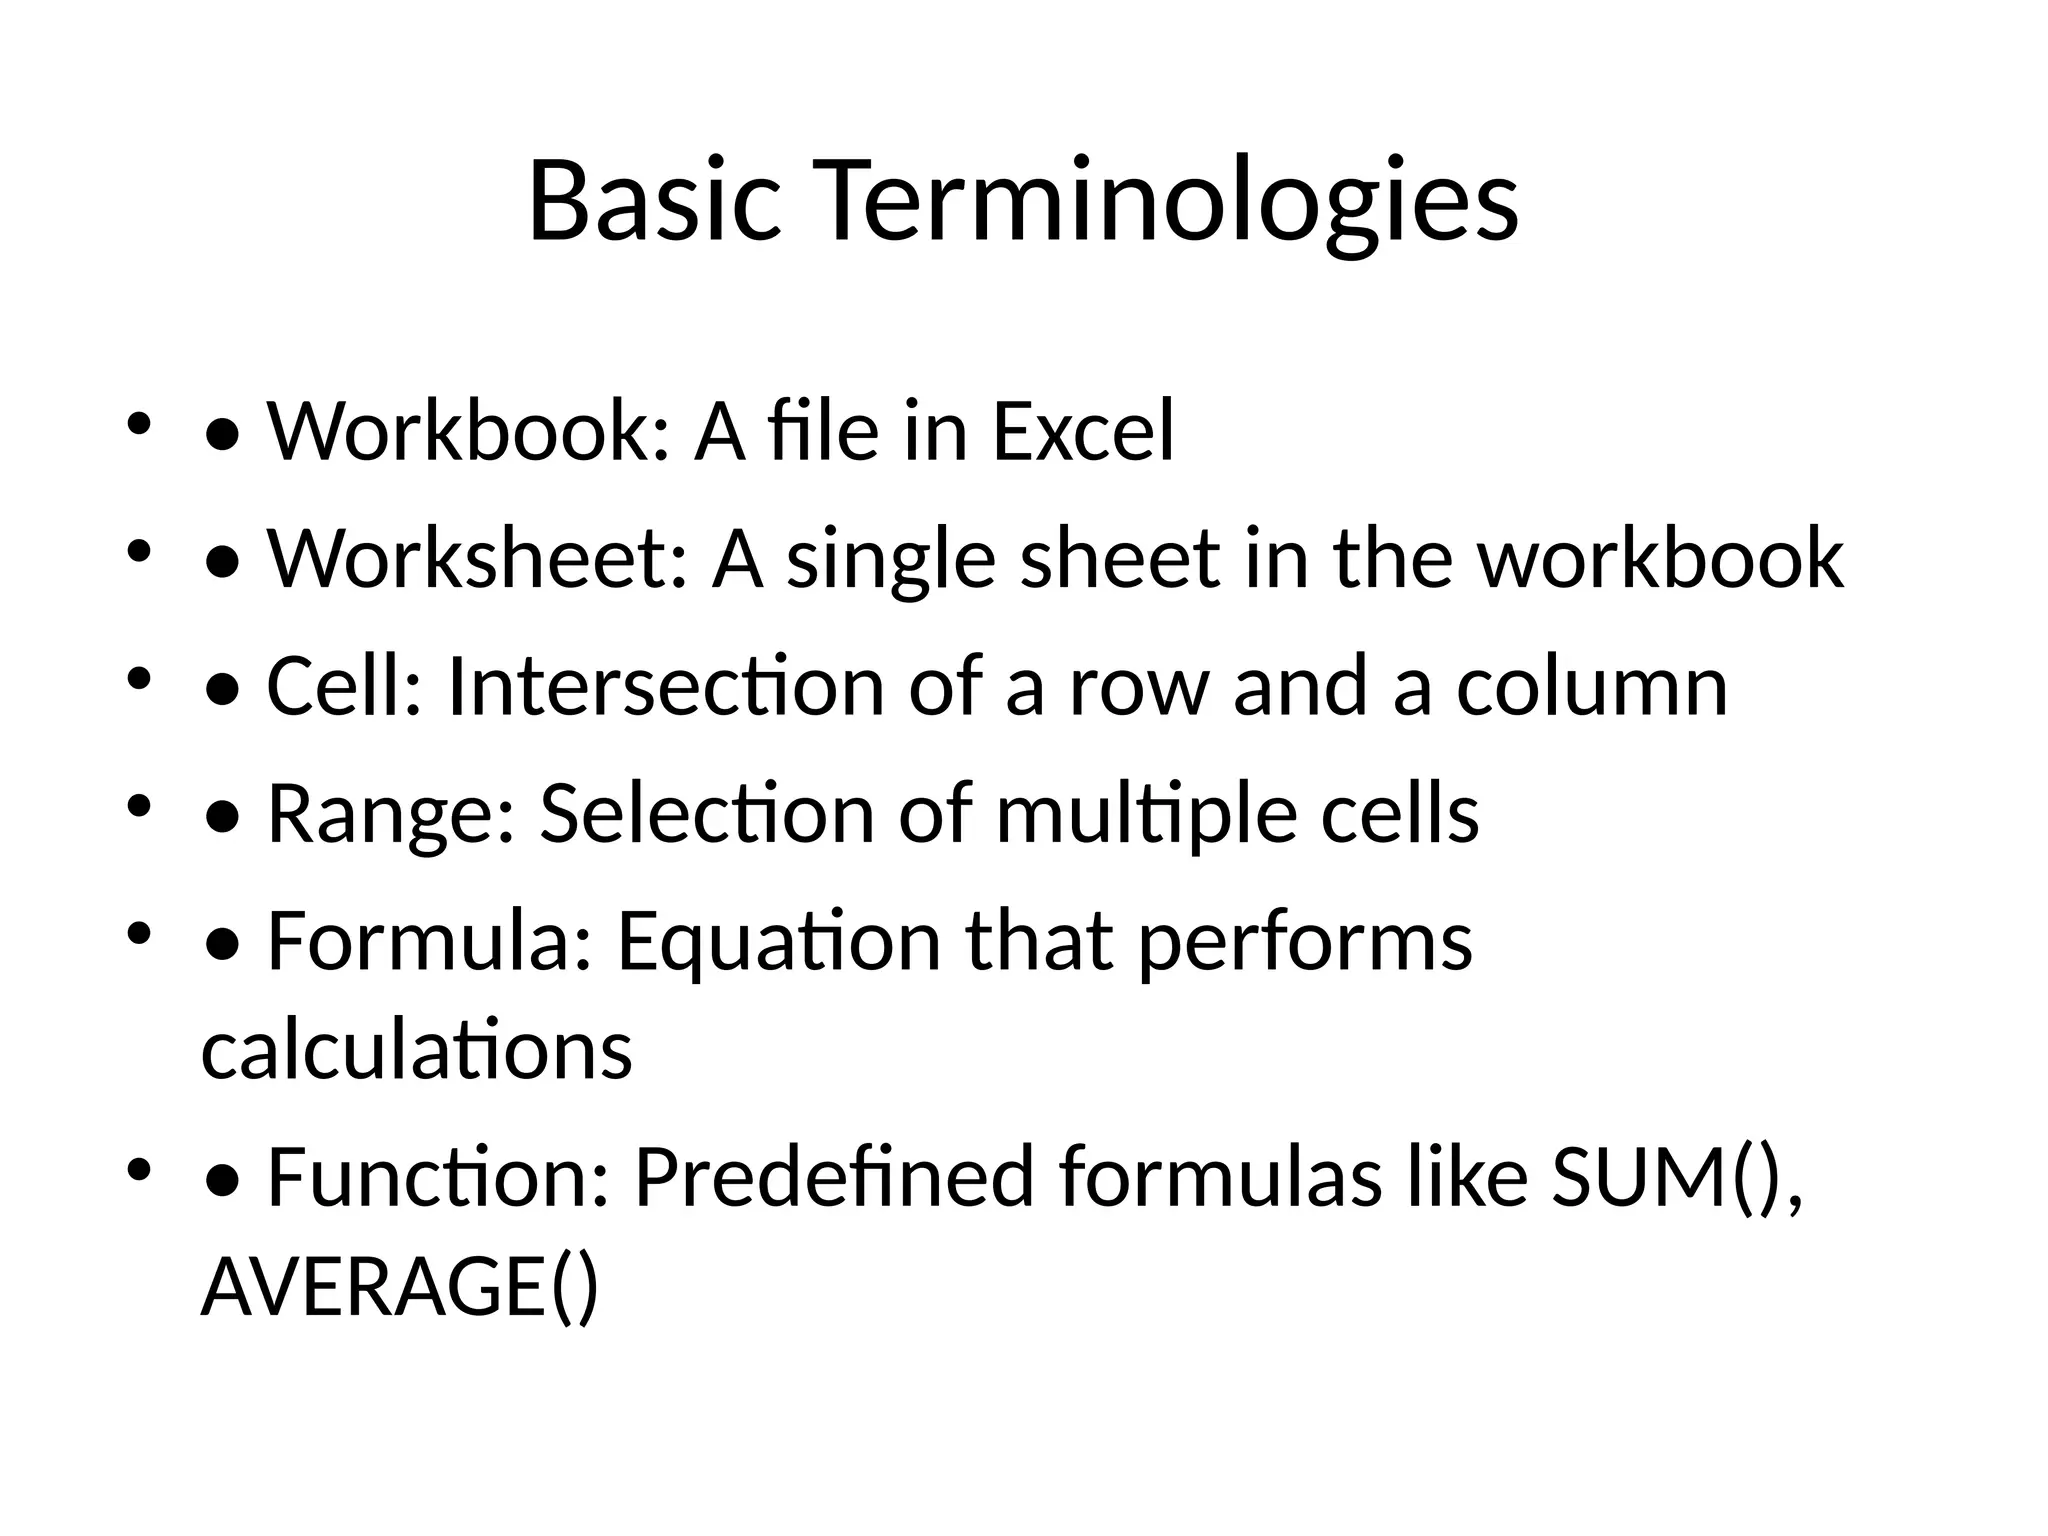
Basic Terminologies
• •Workbook: A file in Excel
• • Worksheet: A single sheet in the workbook
• • Cell: Intersection of a row and a column
• • Range: Selection of multiple cells
• • Formula: Equation that performs
calculations
• • Function: Predefined formulas like SUM(),
AVERAGE()
7.
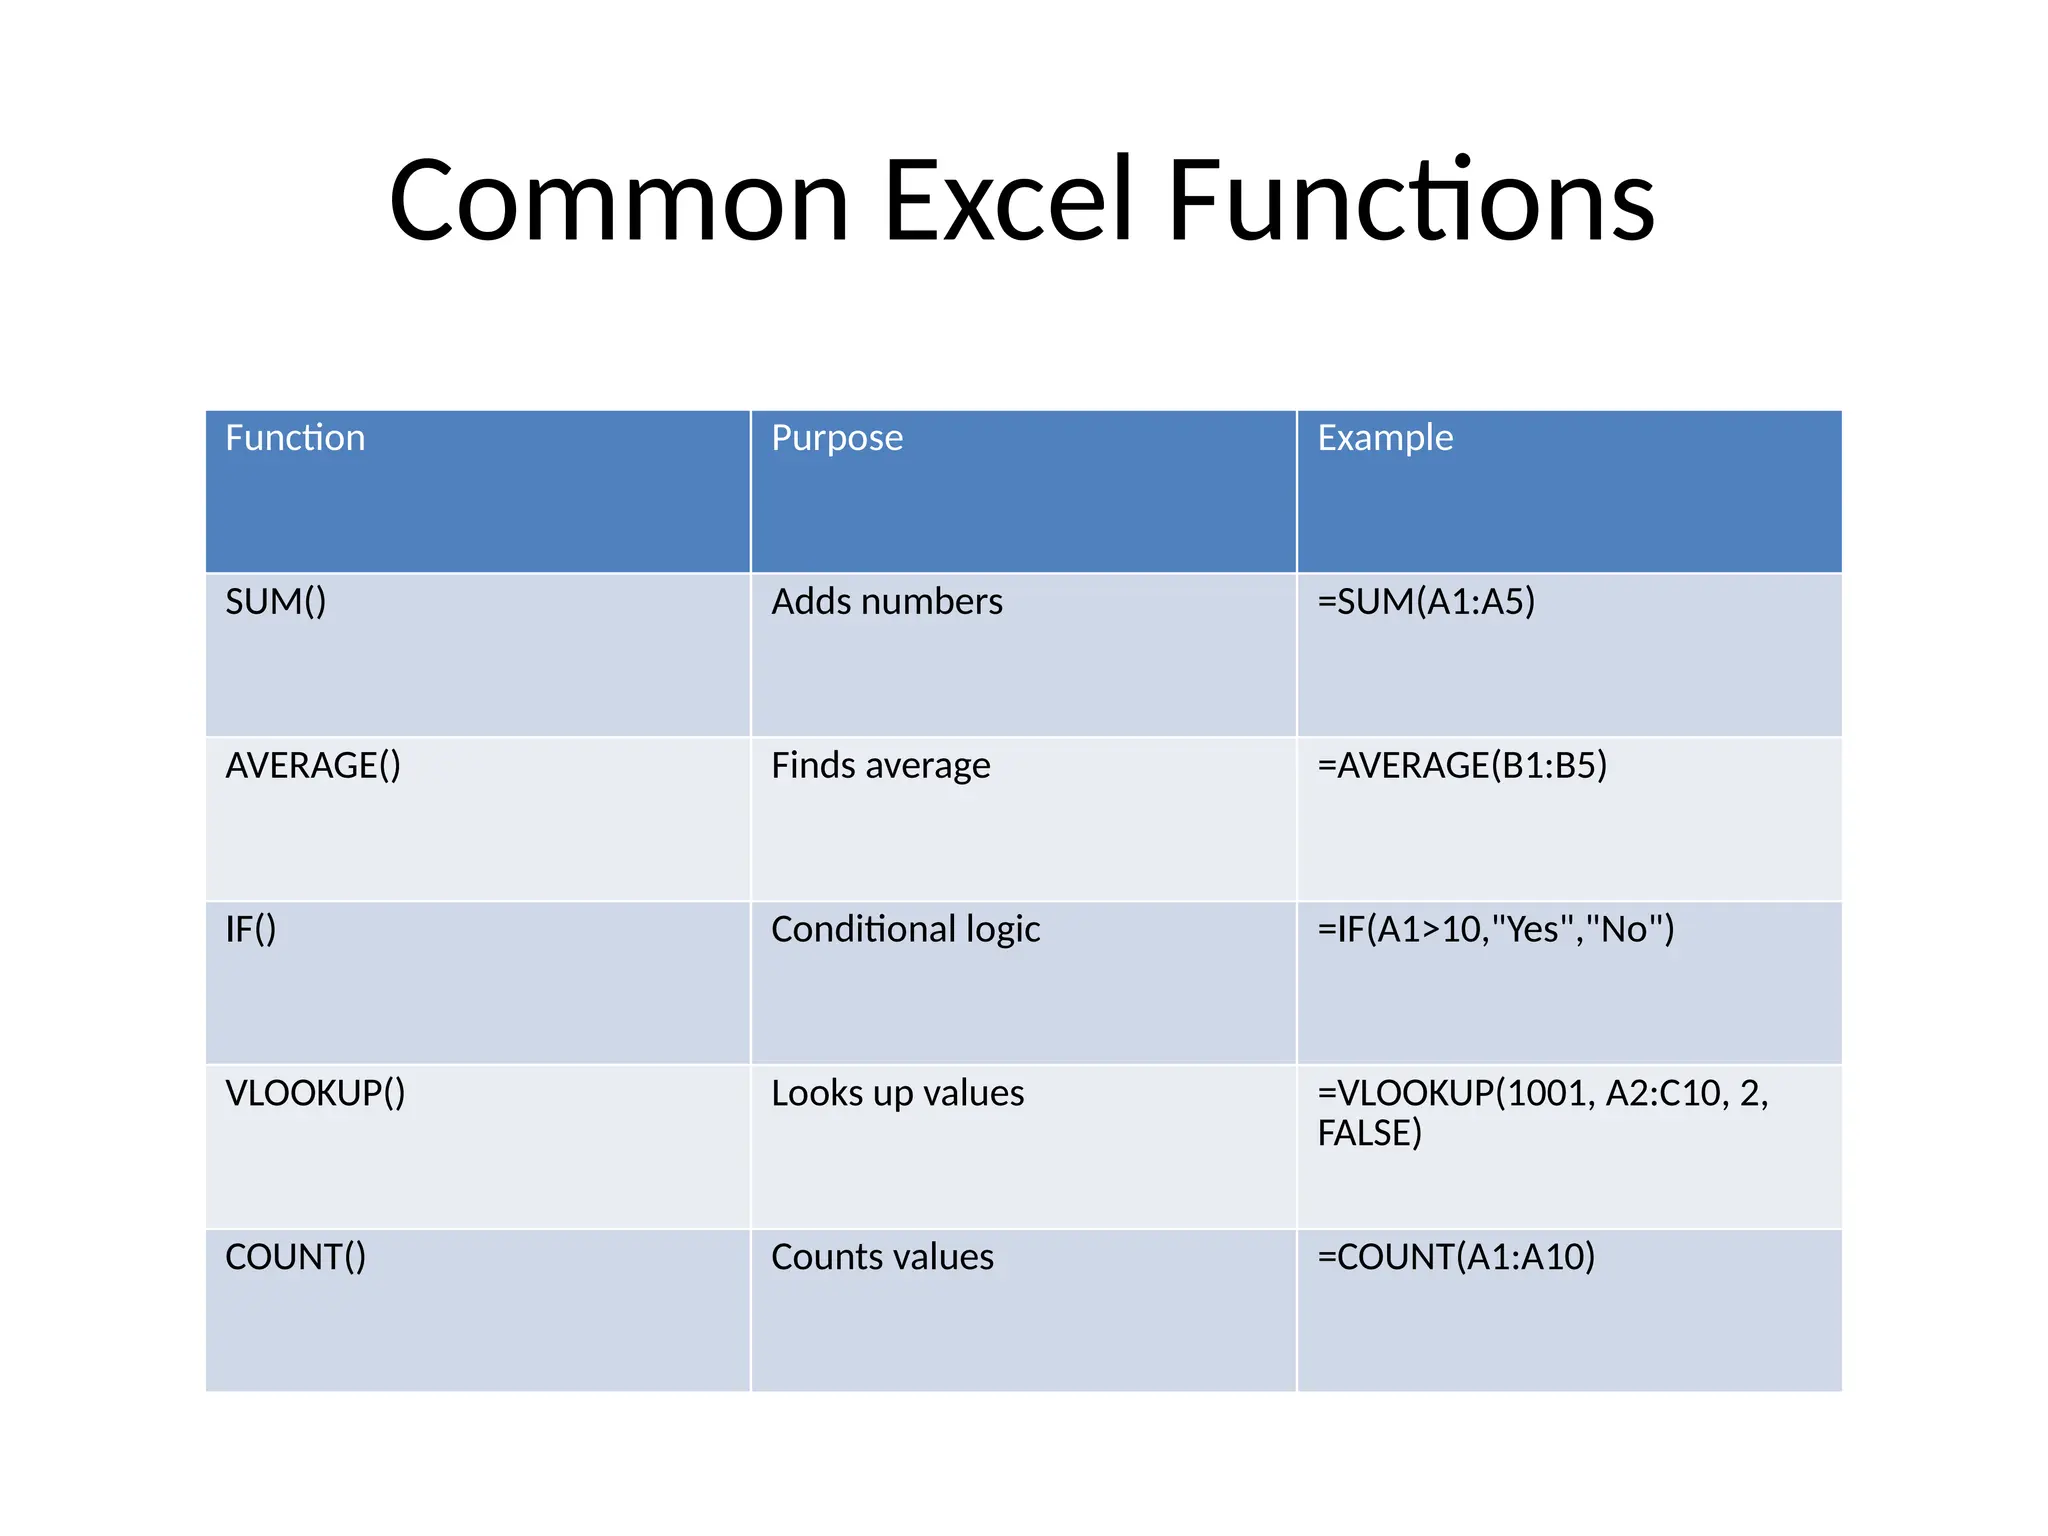
Common Excel Functions
FunctionPurpose Example
SUM() Adds numbers =SUM(A1:A5)
AVERAGE() Finds average =AVERAGE(B1:B5)
IF() Conditional logic =IF(A1>10,"Yes","No")
VLOOKUP() Looks up values =VLOOKUP(1001, A2:C10, 2,
FALSE)
COUNT() Counts values =COUNT(A1:A10)
8.
Charts in Excel
•• Used to represent data visually
• • Types of Charts:
• - Column Chart
• - Pie Chart
• - Line Graph
• - Bar Chart
• • Helps in data analysis and presentation
Fun Fact!
• Didyou know?
• Excel can handle over 1 million rows and
16,000 columns in a single sheet!
11.
Tips to Excelin Excel!
• • Practice formulas daily
• • Learn shortcuts (e.g., Ctrl + Z, Ctrl + C)
• • Use templates
• • Try data visualization
• • Explore Pivot Tables
• • Don’t be afraid to make mistakes – Undo is
your friend!
12.
Summary
• • Excelis powerful and user-friendly
• • Learn step-by-step – start from basics
• • It’s a must-have skill in academics and work
• • With Excel, data becomes easy!
![Thank You
• • Stay curious and keep exploring Excel!
• • [Your Contact Info or Institution Logo]](https://image.slidesharecdn.com/introductiontoexcelpresentation-250829155947-d1376a1b/75/Introduction_to_Excel_Presentations-pptx-14-2048.jpg)


![[DSC Europe 25] Ivan Peric - Intelligence Swarm Logic and Techno-Functional M...](https://cdn.slidesharecdn.com/ss_thumbnails/7my7c97fsduiccadgavw-2-251212103249-5a03f7c6-thumbnail.jpg?width=640&height=640&fit=bounds)


![[DSC Europe 25] Tatevik Maytesyan - How to actually use AI in marketing: gett...](https://cdn.slidesharecdn.com/ss_thumbnails/tjo626lsqdgfntbgl2mw-4-251216103155-e36cd239-thumbnail.jpg?width=640&height=640&fit=bounds)

![[DSC Europe 25] Jon Dajci - Bridging TradFi and DeFi: Building the Future of ...](https://cdn.slidesharecdn.com/ss_thumbnails/fqmhfvlbqhkihjvqvhmu-7-251211083849-6af7e325-thumbnail.jpg?width=640&height=640&fit=bounds)


![[DSC Europe 25] Katherine Forrest - AI NOW: Understanding the Velocity of Cha...](https://cdn.slidesharecdn.com/ss_thumbnails/wvvbruqfrci0sfq9xwgb-4-251212104007-e5ad1987-thumbnail.jpg?width=640&height=640&fit=bounds)
![[DSC Europe 25] Branko Urosevic -Rethinking Financial Talent: Integrating Cod...](https://cdn.slidesharecdn.com/ss_thumbnails/8jjrus8ttko6qj64f58f-3-251212103250-642c6374-thumbnail.jpg?width=640&height=640&fit=bounds)


![[DSC Europe 25] Dusan Nesic - Securing Tomorrow’s Infrastructure: Why Cyber-P...](https://cdn.slidesharecdn.com/ss_thumbnails/qikbszfftyowjm2q6duw-1-251211083848-8f2ead6b-thumbnail.jpg?width=640&height=640&fit=bounds)
![[DSC Europe 25] Bassam Maharmeh - Artificial Intelligence: Opportunities and ...](https://cdn.slidesharecdn.com/ss_thumbnails/thhfmr2fqpawzj7hsjpg-5-251211083048-2c23204f-thumbnail.jpg?width=640&height=640&fit=bounds)


