Intoducing why we need TIme series,date time module,converting the type of date,Resampling,Time Series Analysis,Indexing and Selection,Date Ranges and Frequencies,Time Zone Handling ,Common Tasks in Time Series Analysisin Python
Time Series
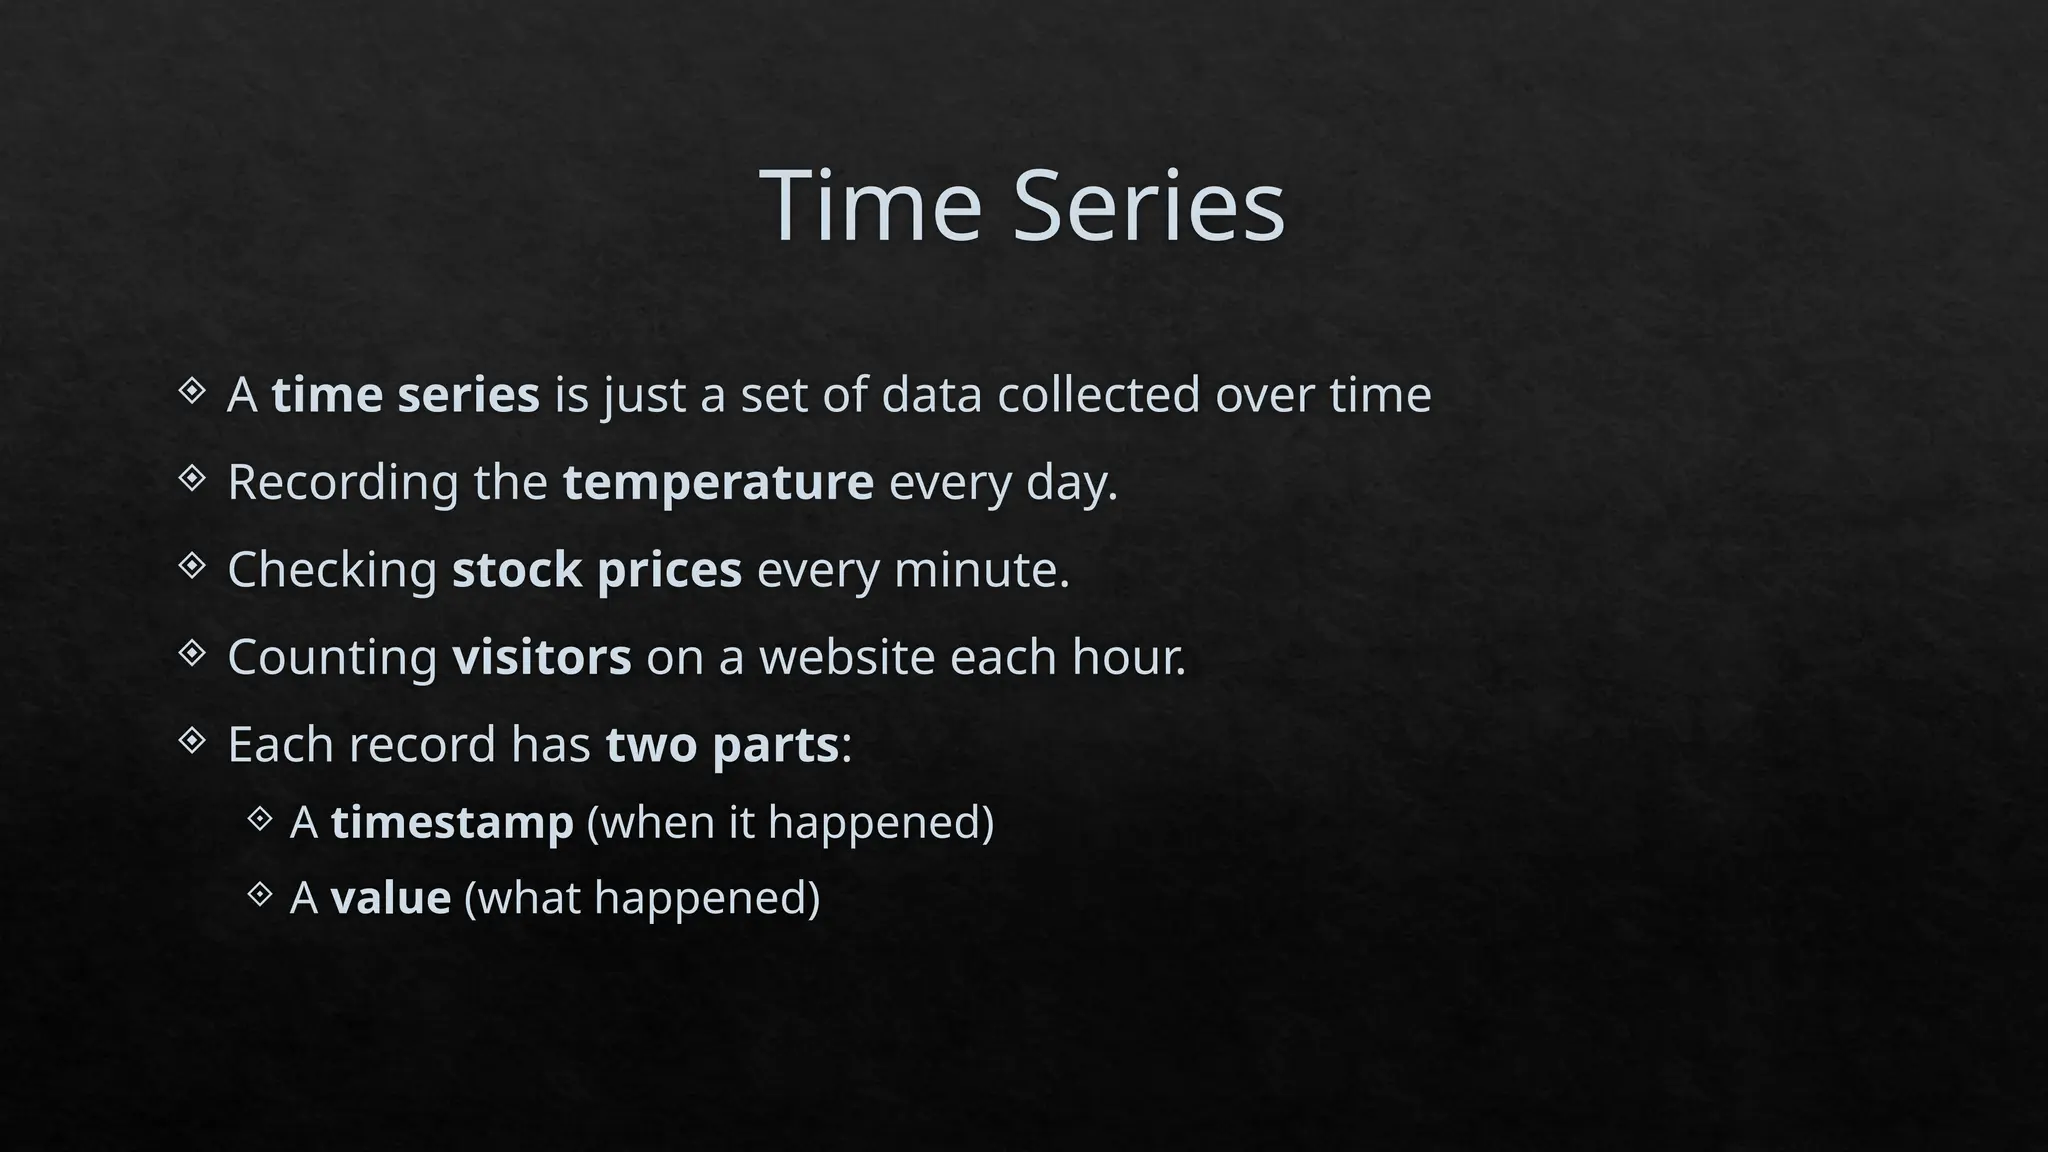
Atime series is just a set of data collected over time
Recording the temperature every day.
Checking stock prices every minute.
Counting visitors on a website each hour.
Each record has two parts:
A timestamp (when it happened)
A value (what happened)
3.
Example
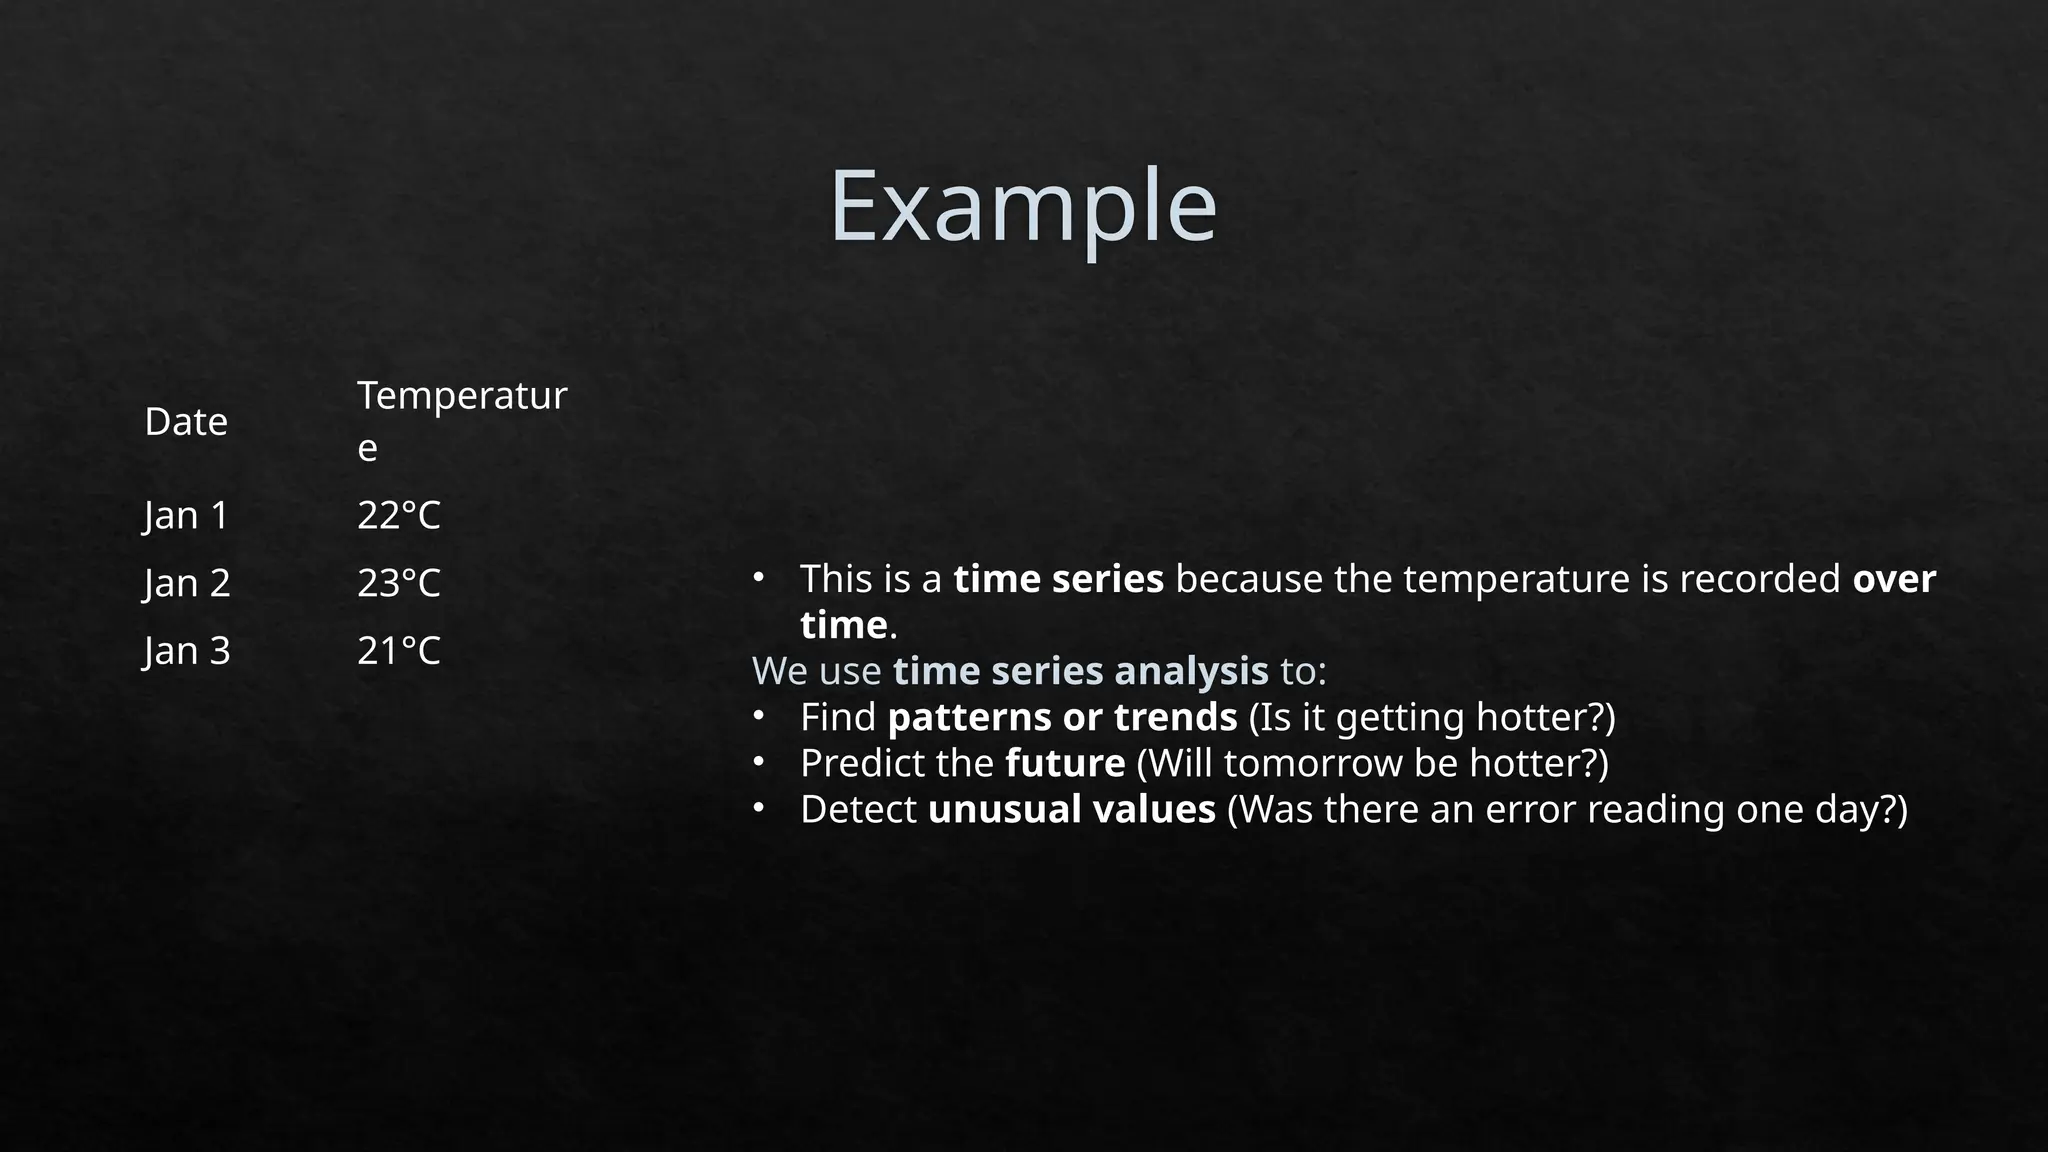
Date
Temperatur
e
Jan 1 22°C
Jan2 23°C
Jan 3 21°C
• This is a time series because the temperature is recorded over
time.
We use time series analysis to:
• Find patterns or trends (Is it getting hotter?)
• Predict the future (Will tomorrow be hotter?)
• Detect unusual values (Was there an error reading one day?)
4.
Date and TimeData Types and Tools
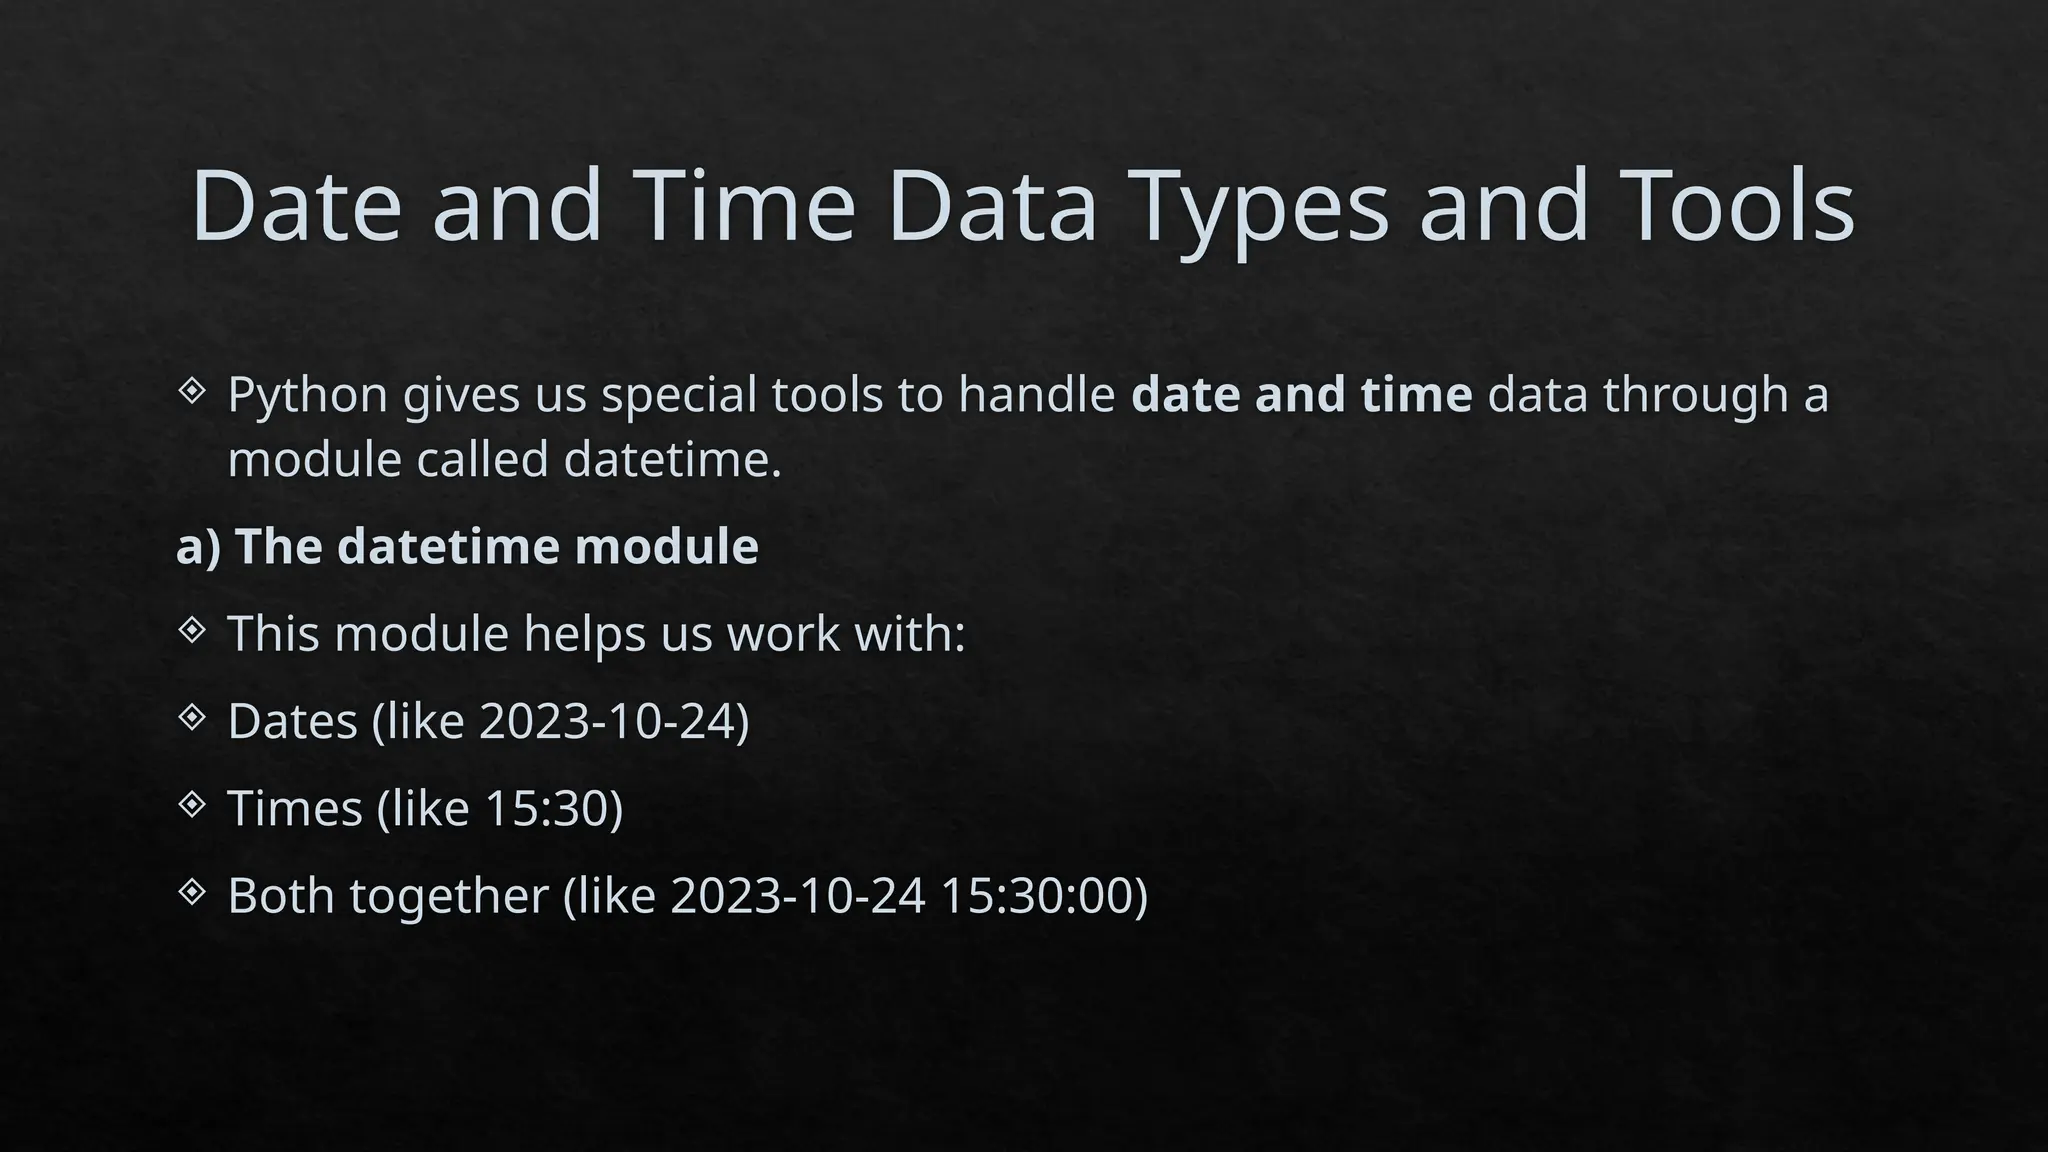
Python gives us special tools to handle date and time data through a
module called datetime.
a) The datetime module
This module helps us work with:
Dates (like 2023-10-24)
Times (like 15:30)
Both together (like 2023-10-24 15:30:00)
5.
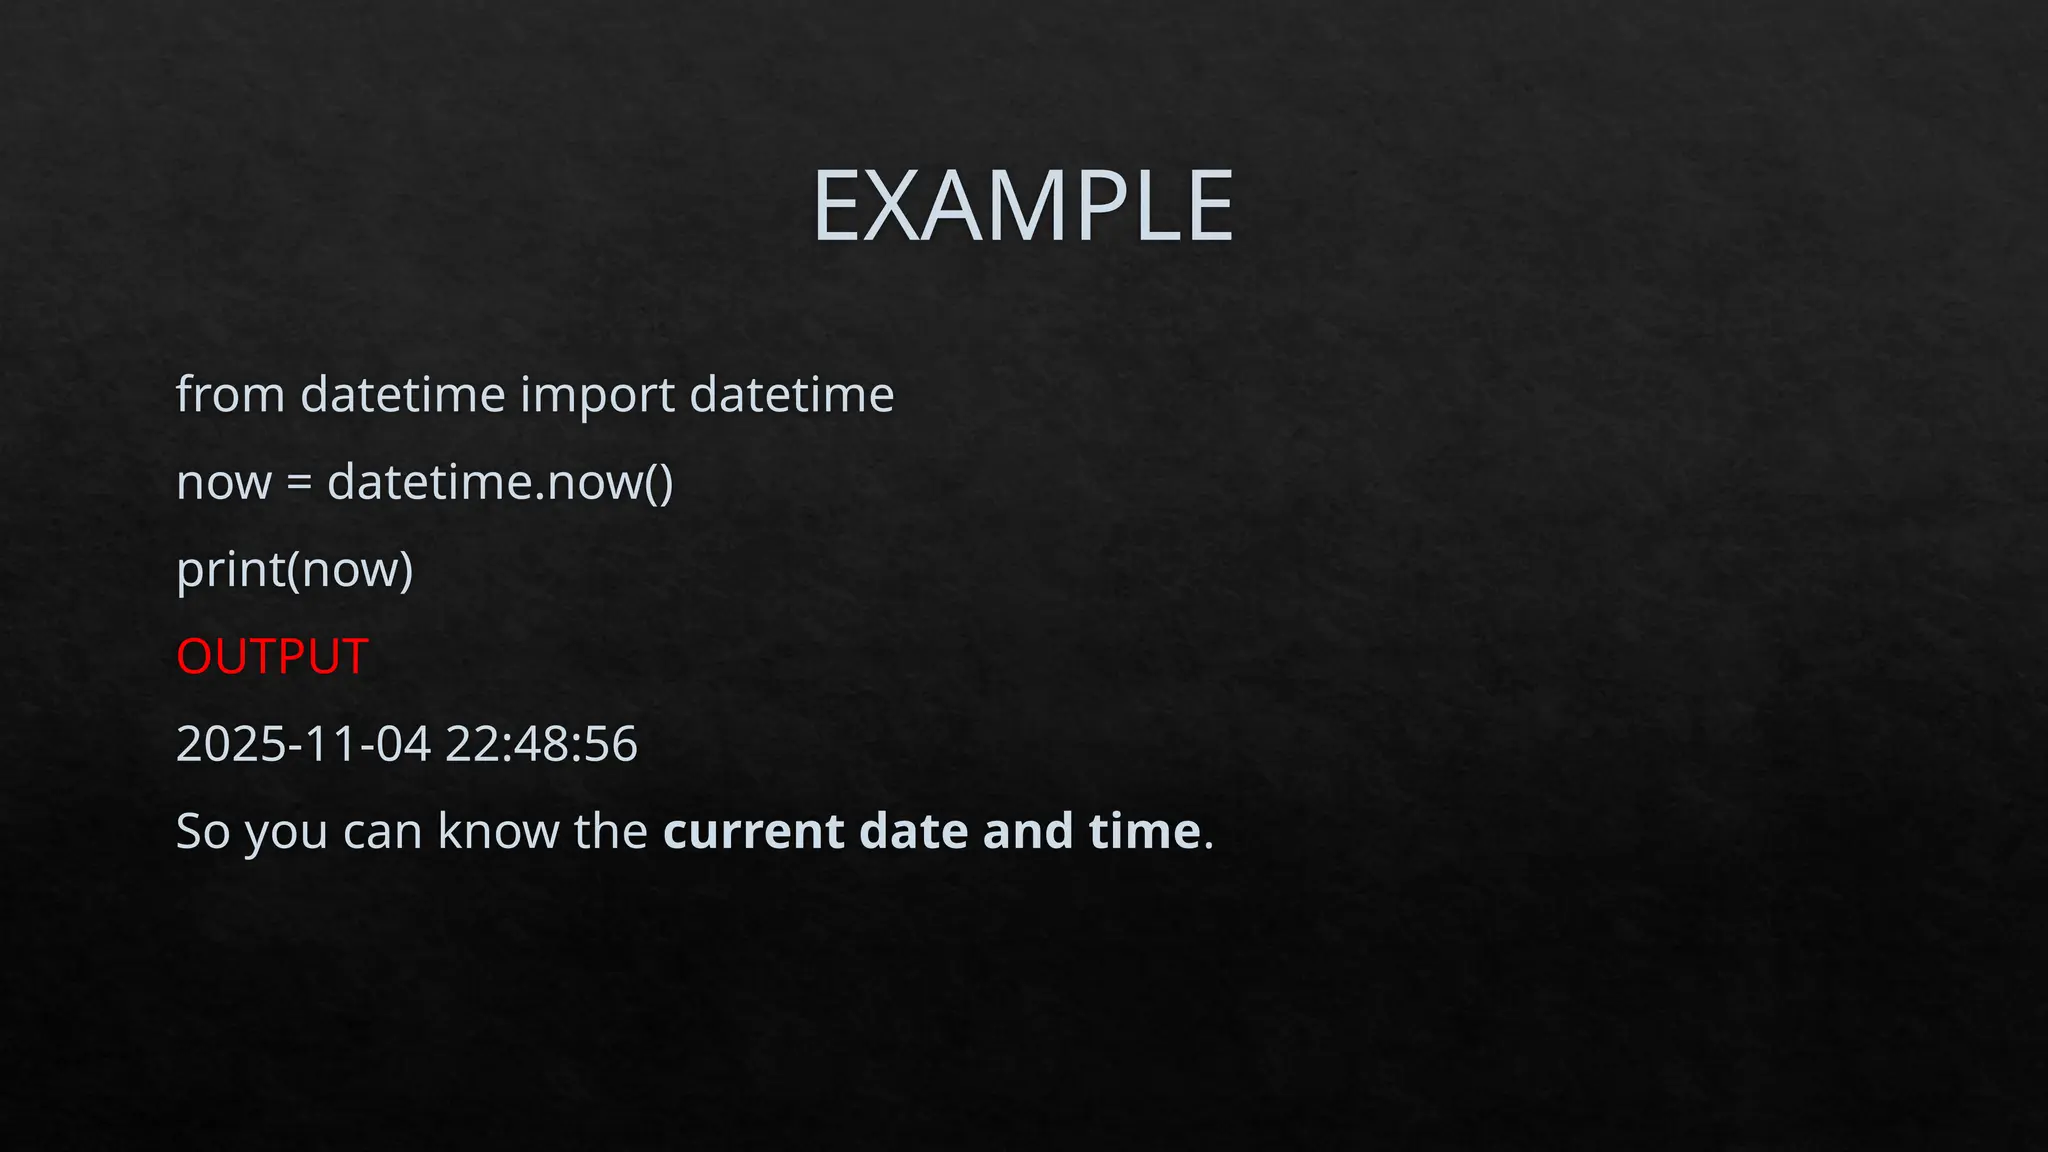
EXAMPLE
from datetime importdatetime
now = datetime.now()
print(now)
OUTPUT
2025-11-04 22:48:56
So you can know the current date and time.
6.
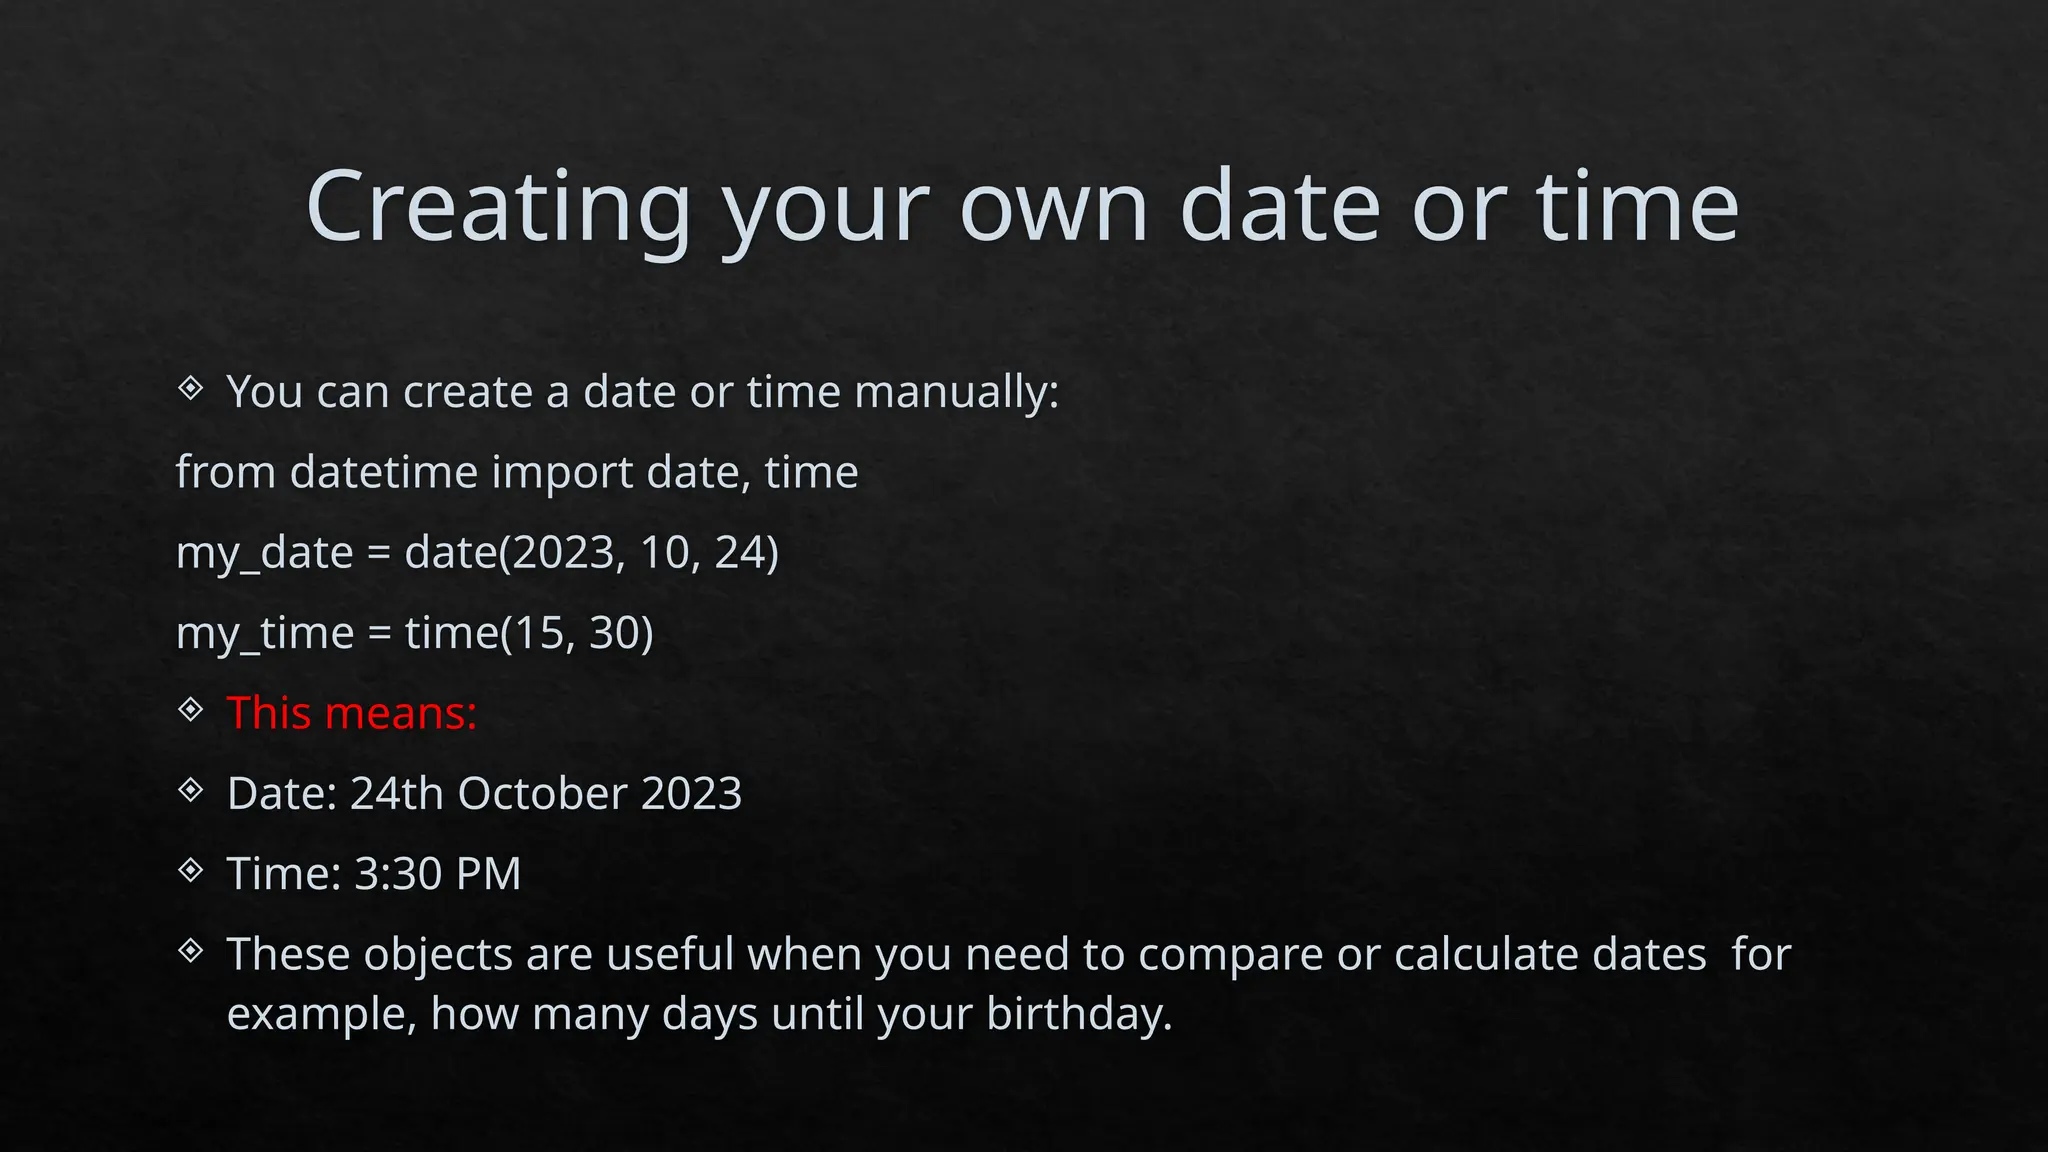
Creating your owndate or time
You can create a date or time manually:
from datetime import date, time
my_date = date(2023, 10, 24)
my_time = time(15, 30)
This means:
Date: 24th October 2023
Time: 3:30 PM
These objects are useful when you need to compare or calculate dates for
example, how many days until your birthday.
7.
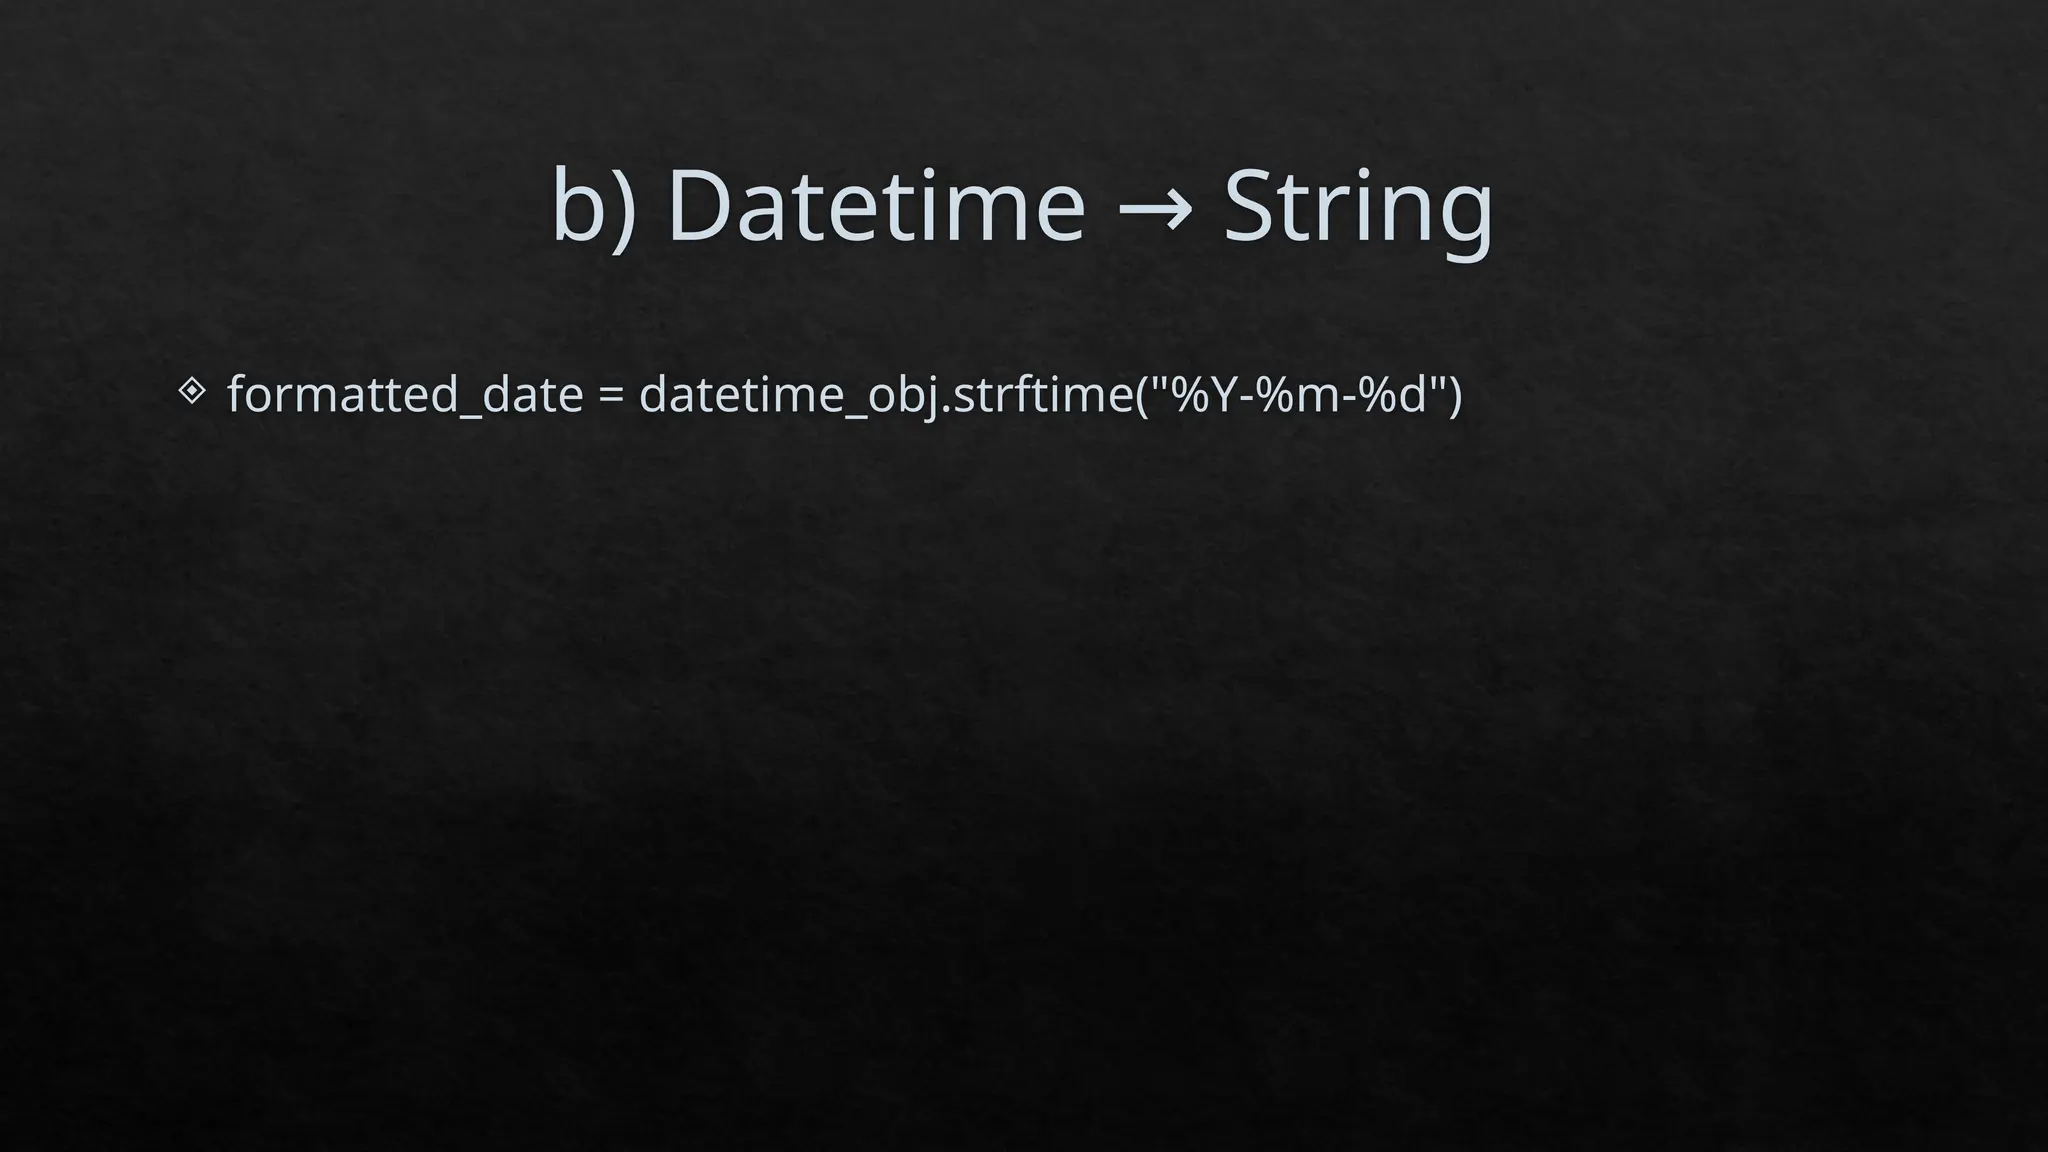
Converting Between Stringsand
Datetime
Many times, dates come as text (like from a file or website).
Example: "2023-10-24" — this is just a string, not a real date object.
To work with it, we must convert it to a datetime object.
Time Series Basicsin Python
In Python, the most powerful tool for handling time series is the pandas
library.
import pandas as pd
time_series_data = pd.Series(
[10, 20, 30, 40],
index=pd.date_range(start='2023-10-01', periods=4, freq='D’)
)
Date Value
2023-10-01 10
2023-10-02 20
2023-10-03 30
2023-10-04 40
11.
Time Resampling (ChangingData
Frequency)
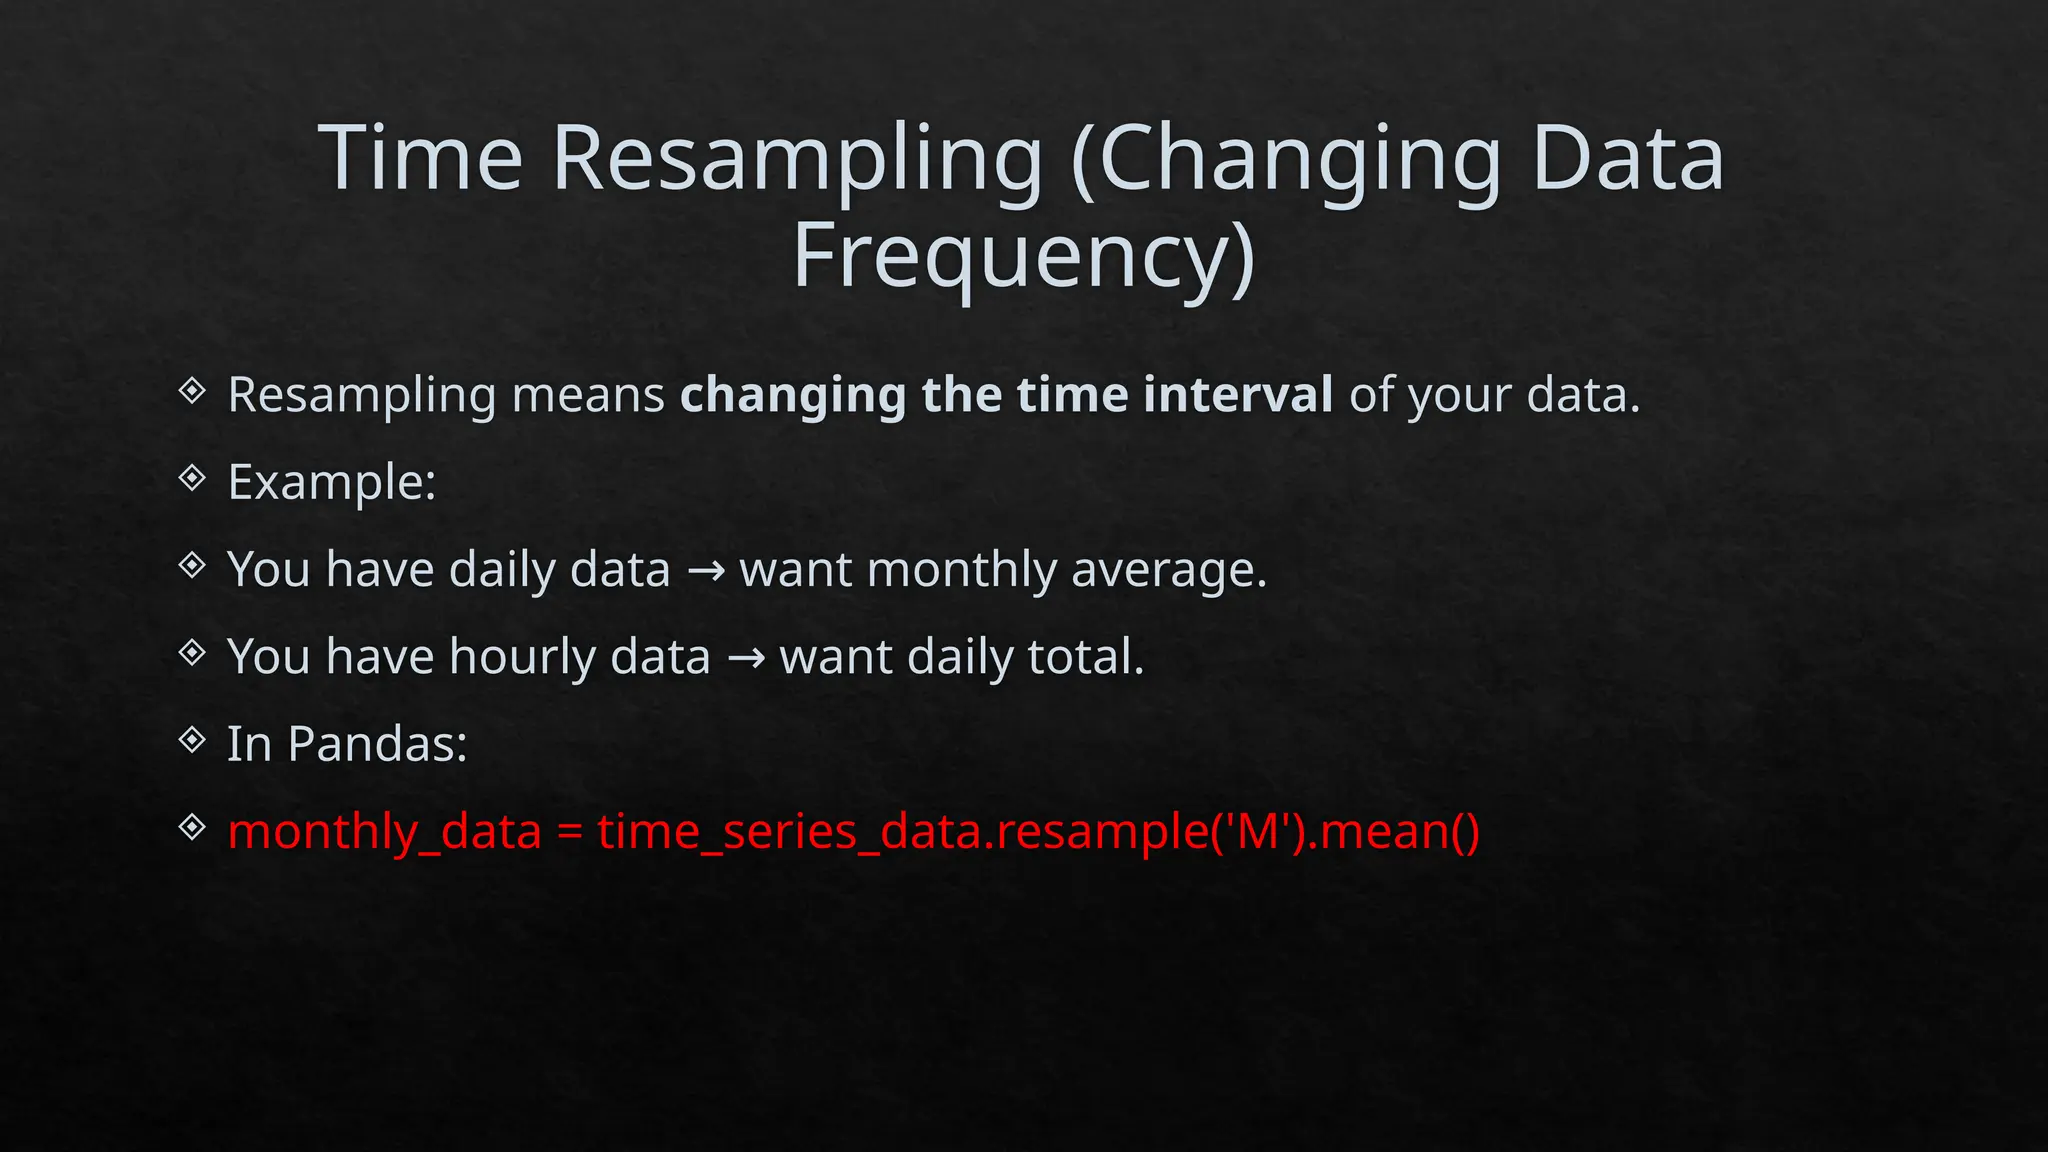
Resampling means changing the time interval of your data.
Example:
You have daily data want monthly average.
→
You have hourly data want daily total.
→
In Pandas:
monthly_data = time_series_data.resample('M').mean()
12.
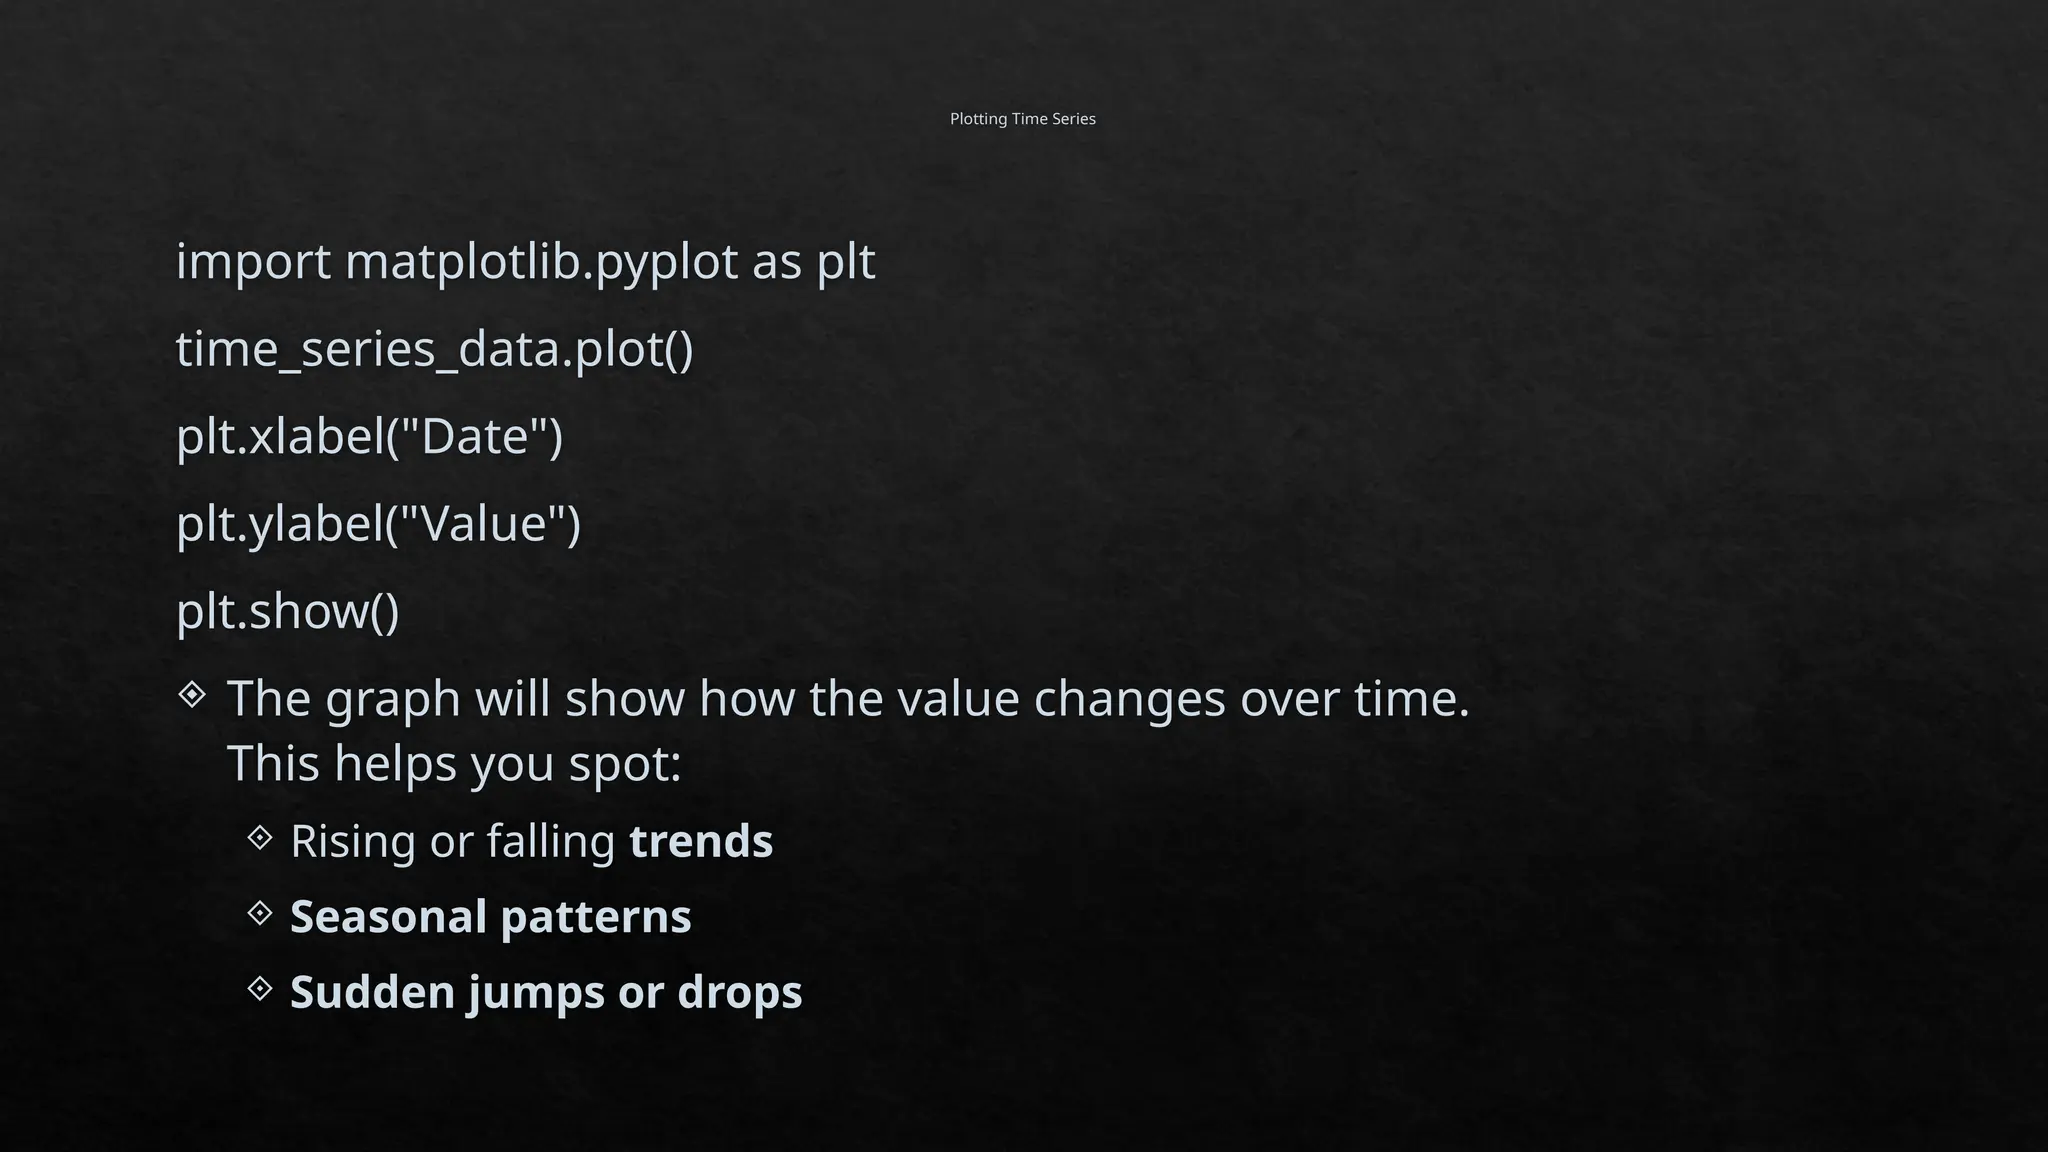
Plotting Time Series
importmatplotlib.pyplot as plt
time_series_data.plot()
plt.xlabel("Date")
plt.ylabel("Value")
plt.show()
The graph will show how the value changes over time.
This helps you spot:
Rising or falling trends
Seasonal patterns
Sudden jumps or drops
13.
Time Series Analysis
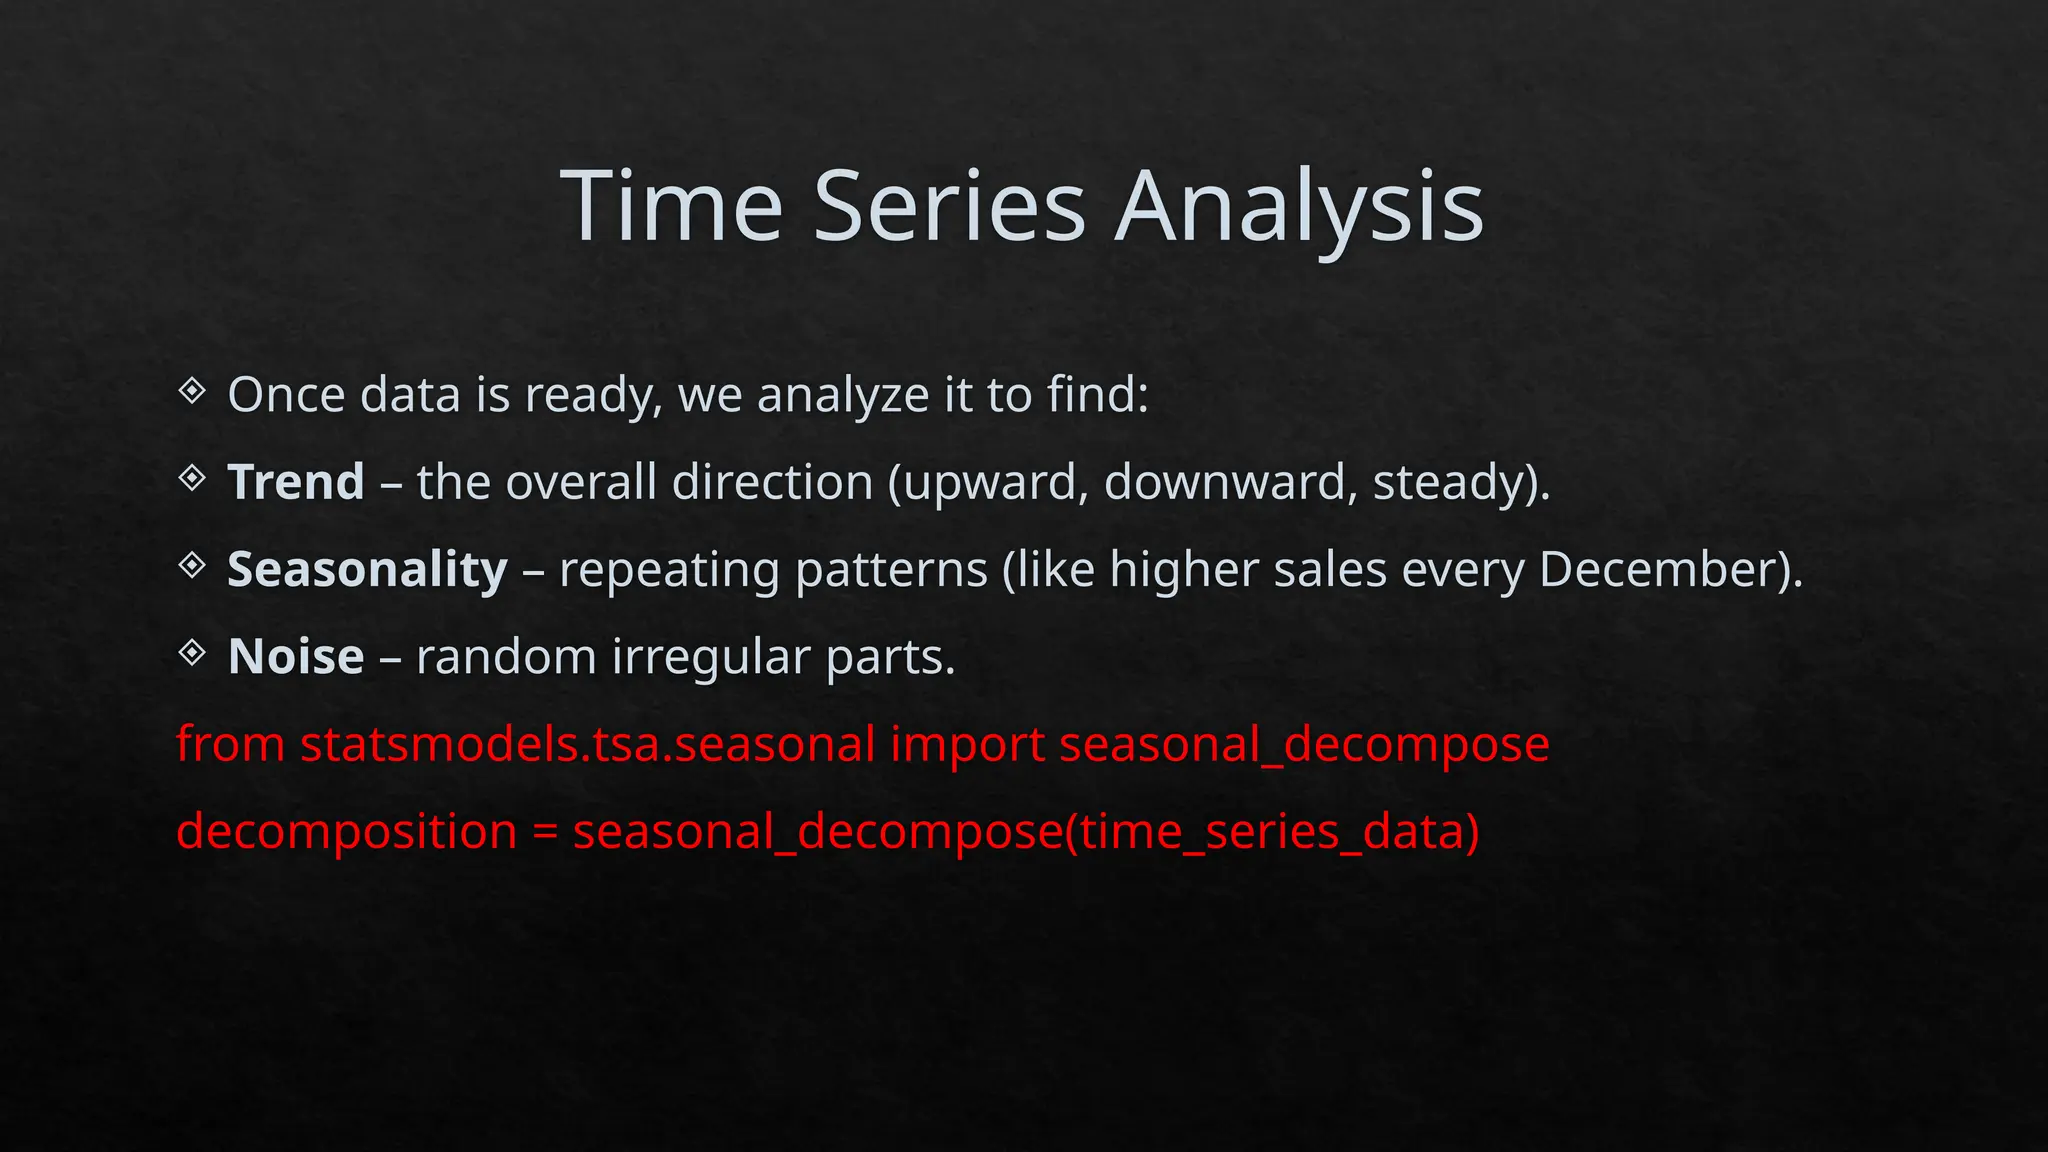
Once data is ready, we analyze it to find:
Trend – the overall direction (upward, downward, steady).
Seasonality – repeating patterns (like higher sales every December).
Noise – random irregular parts.
from statsmodels.tsa.seasonal import seasonal_decompose
decomposition = seasonal_decompose(time_series_data)
14.
Indexing and Selection
a)Select by a single date:
selected_data = time_series_data['2023-10-01']
b) Select by a date range:
selected_range = time_series_data['2023-10-01':'2023-10-03']
c) Select by condition:
subset = time_series_data[time_series_data > 20]
15.
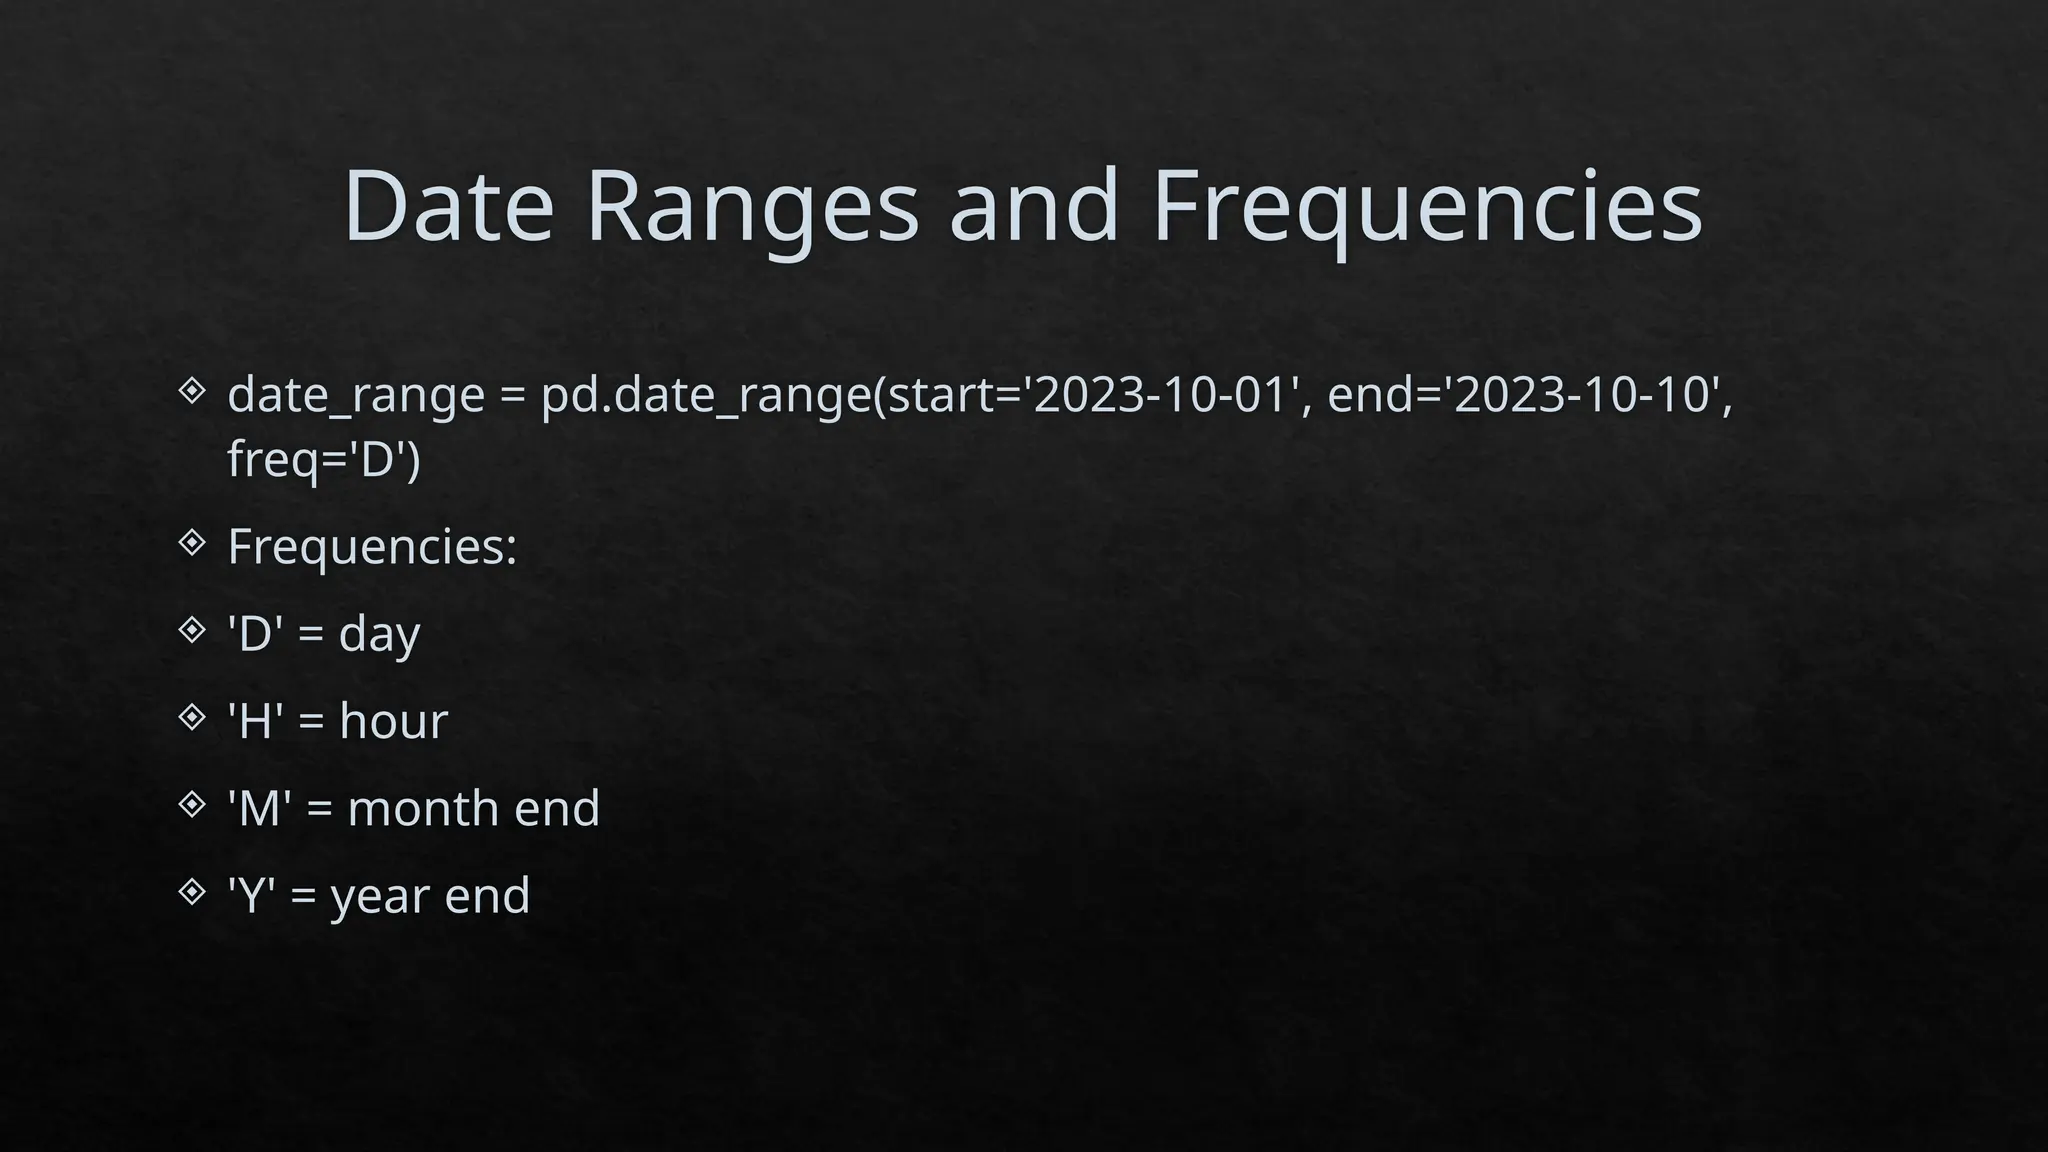
Date Ranges andFrequencies
date_range = pd.date_range(start='2023-10-01', end='2023-10-10',
freq='D')
Frequencies:
'D' = day
'H' = hour
'M' = month end
'Y' = year end
16.
Shifting Data (MovingForward or
Backward)
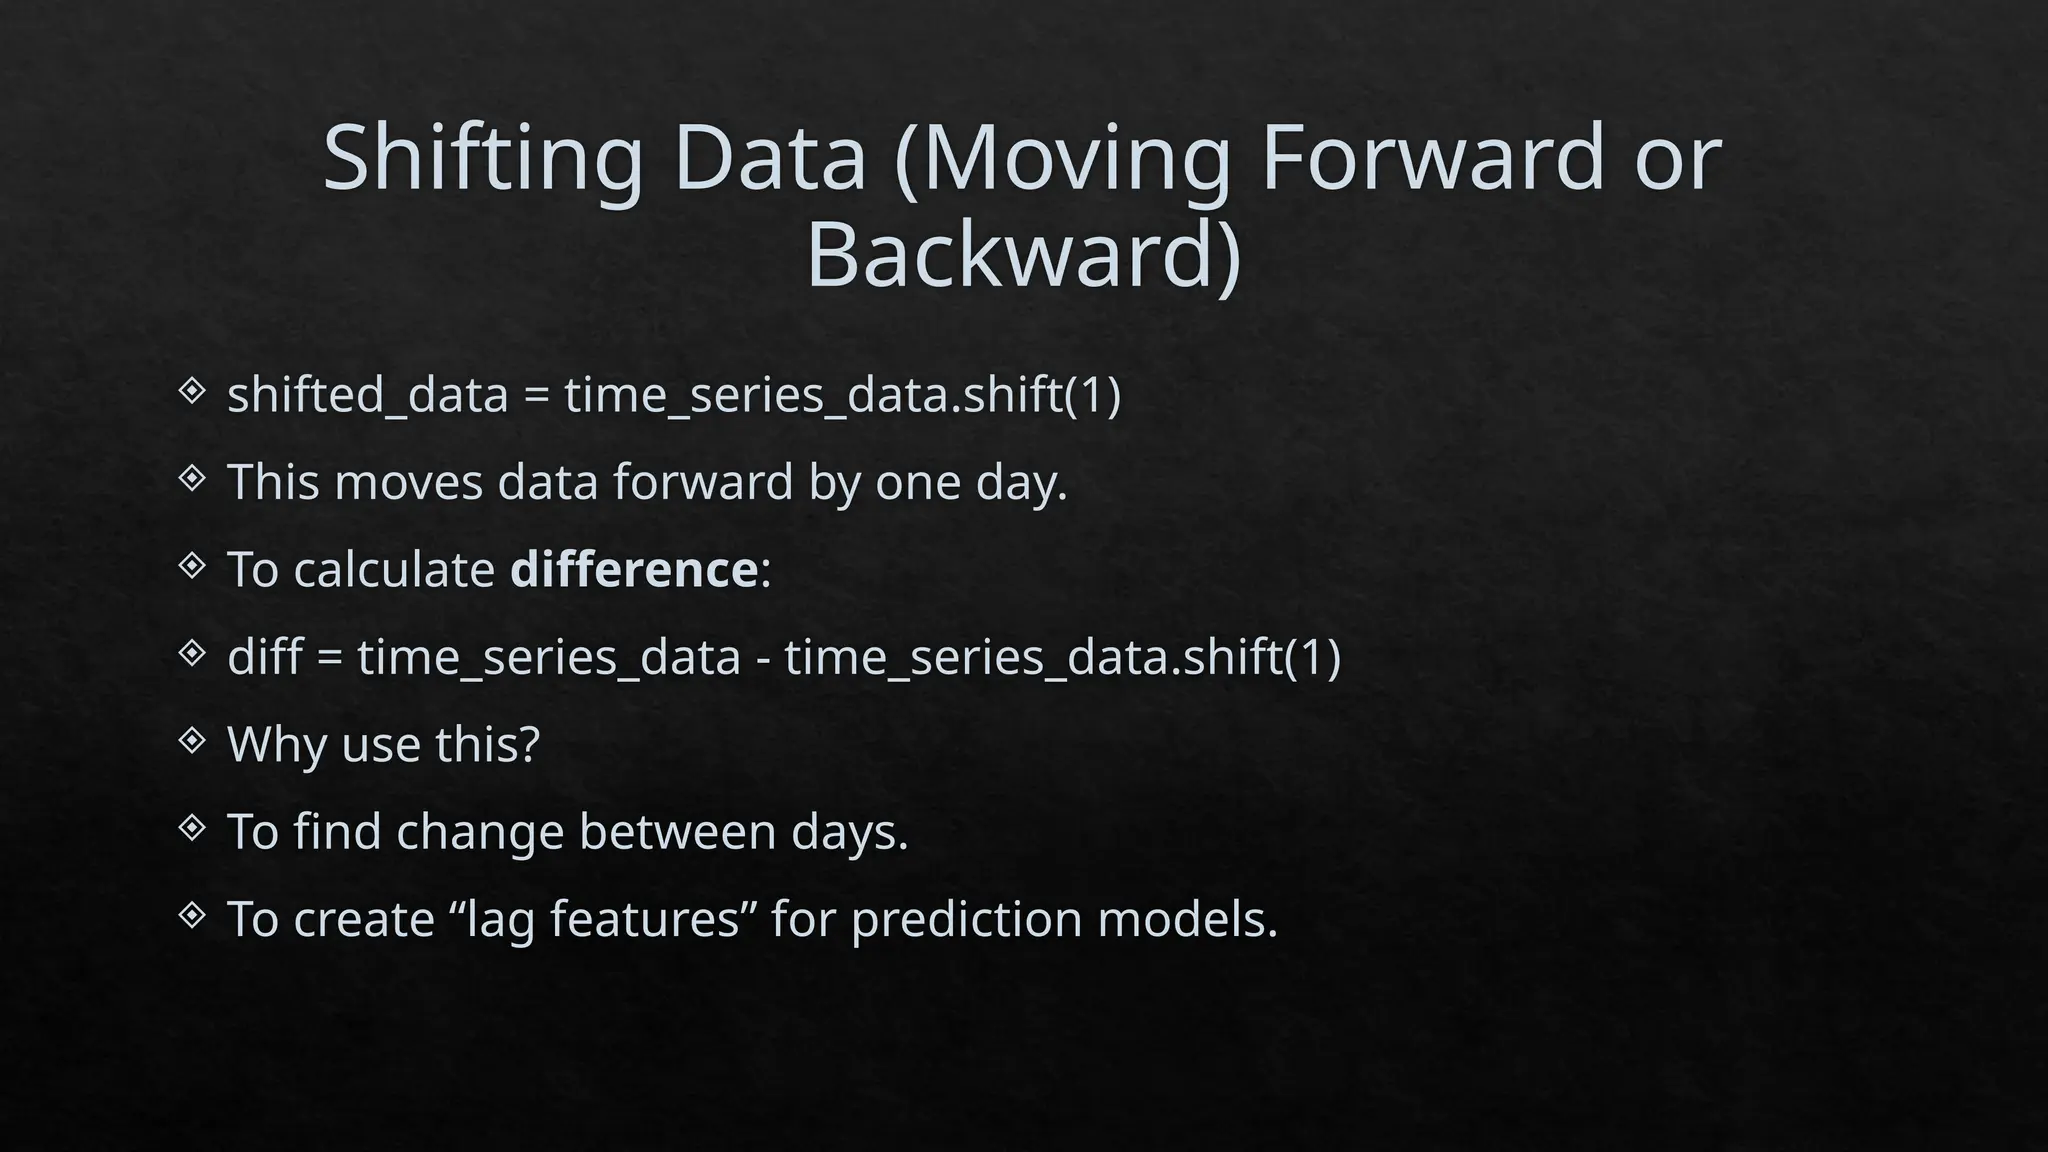
shifted_data = time_series_data.shift(1)
This moves data forward by one day.
To calculate difference:
diff = time_series_data - time_series_data.shift(1)
Why use this?
To find change between days.
To create “lag features” for prediction models.
17.
Time Zone Handling
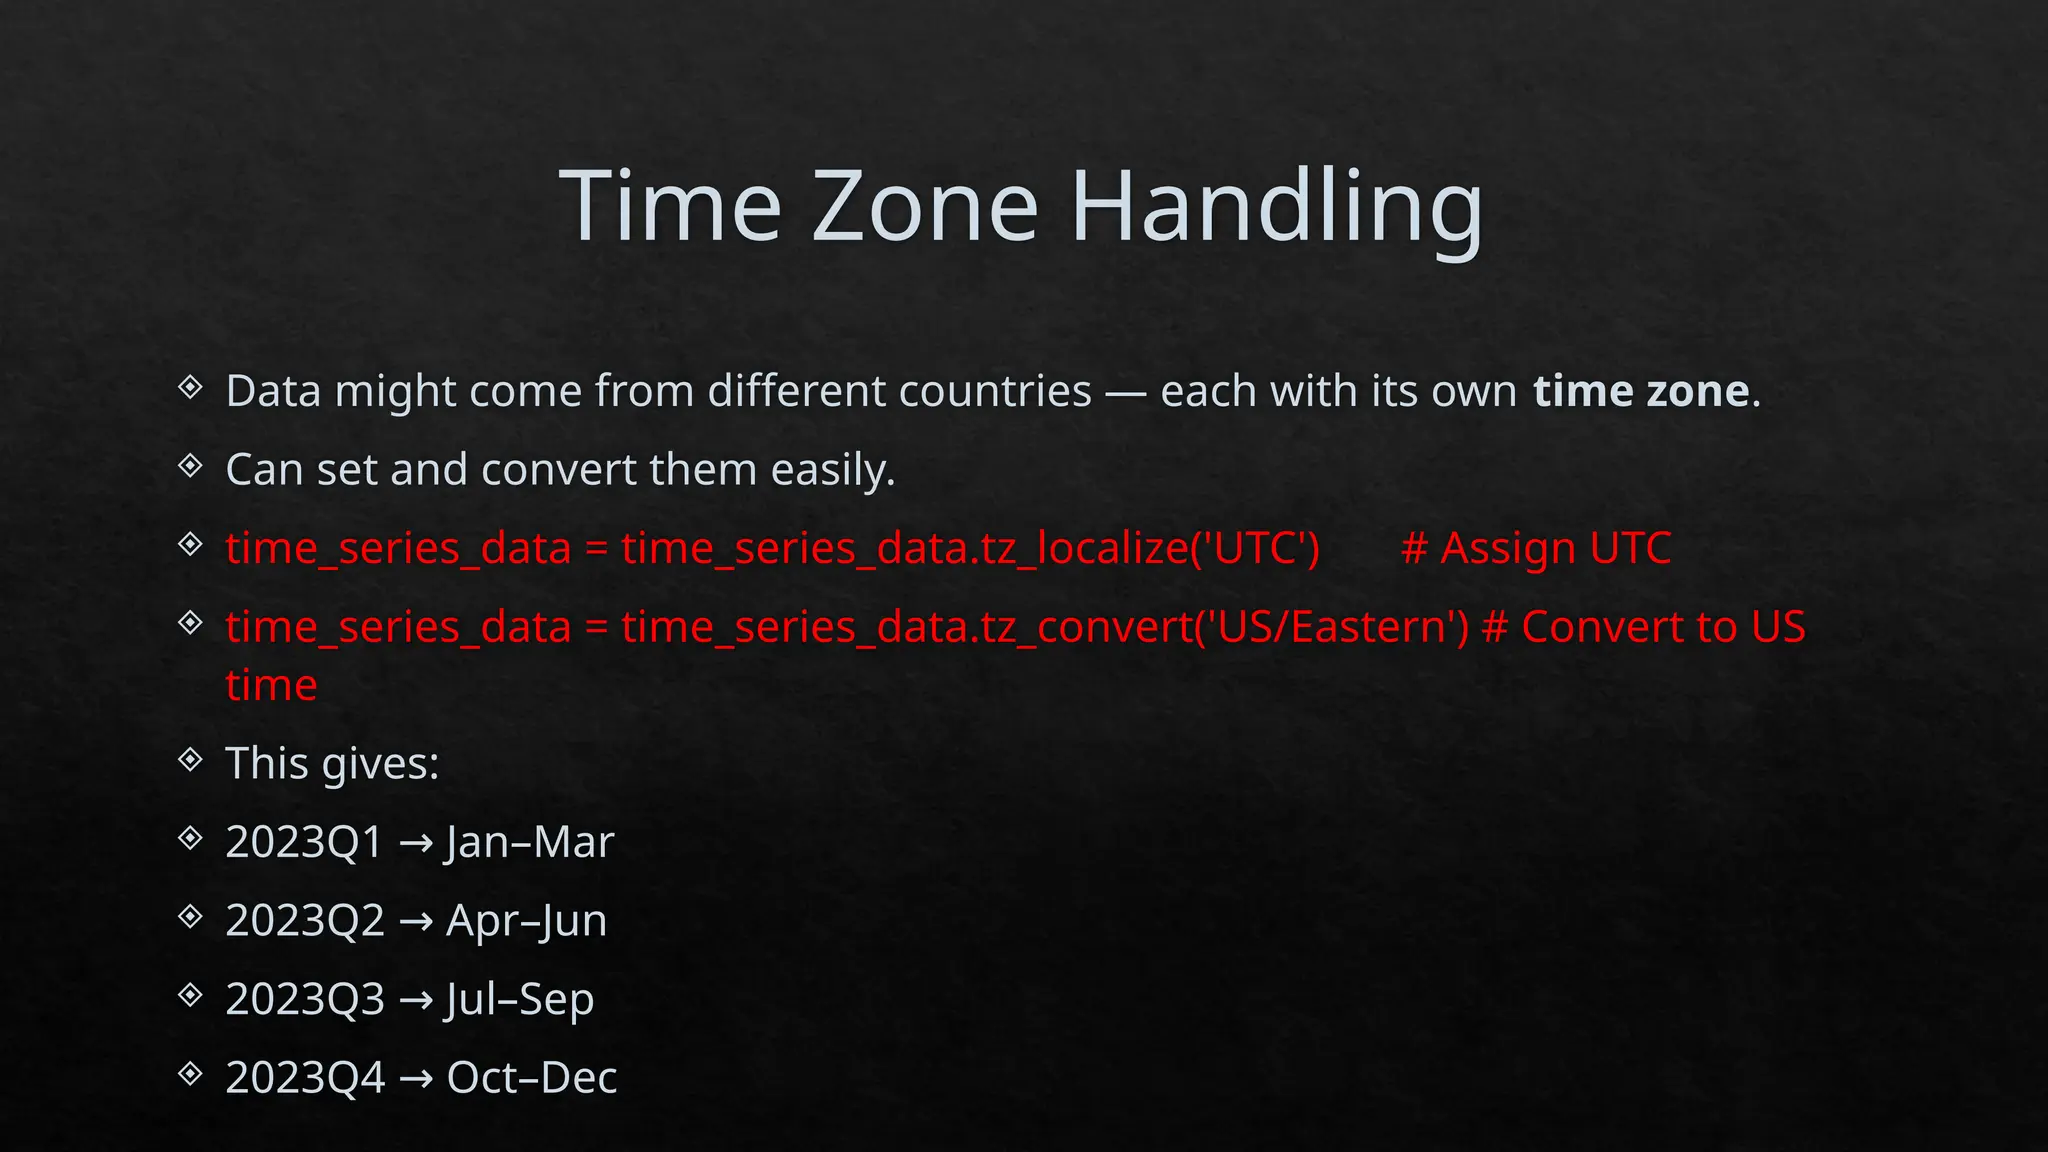
Data might come from different countries — each with its own time zone.
Can set and convert them easily.
time_series_data = time_series_data.tz_localize('UTC') # Assign UTC
time_series_data = time_series_data.tz_convert('US/Eastern') # Convert to US
time
This gives:
2023Q1 Jan–Mar
→
2023Q2 Apr–Jun
→
2023Q3 Jul–Sep
→
2023Q4 Oct–Dec
→
18.
Common Tasks inTime Series Analysis
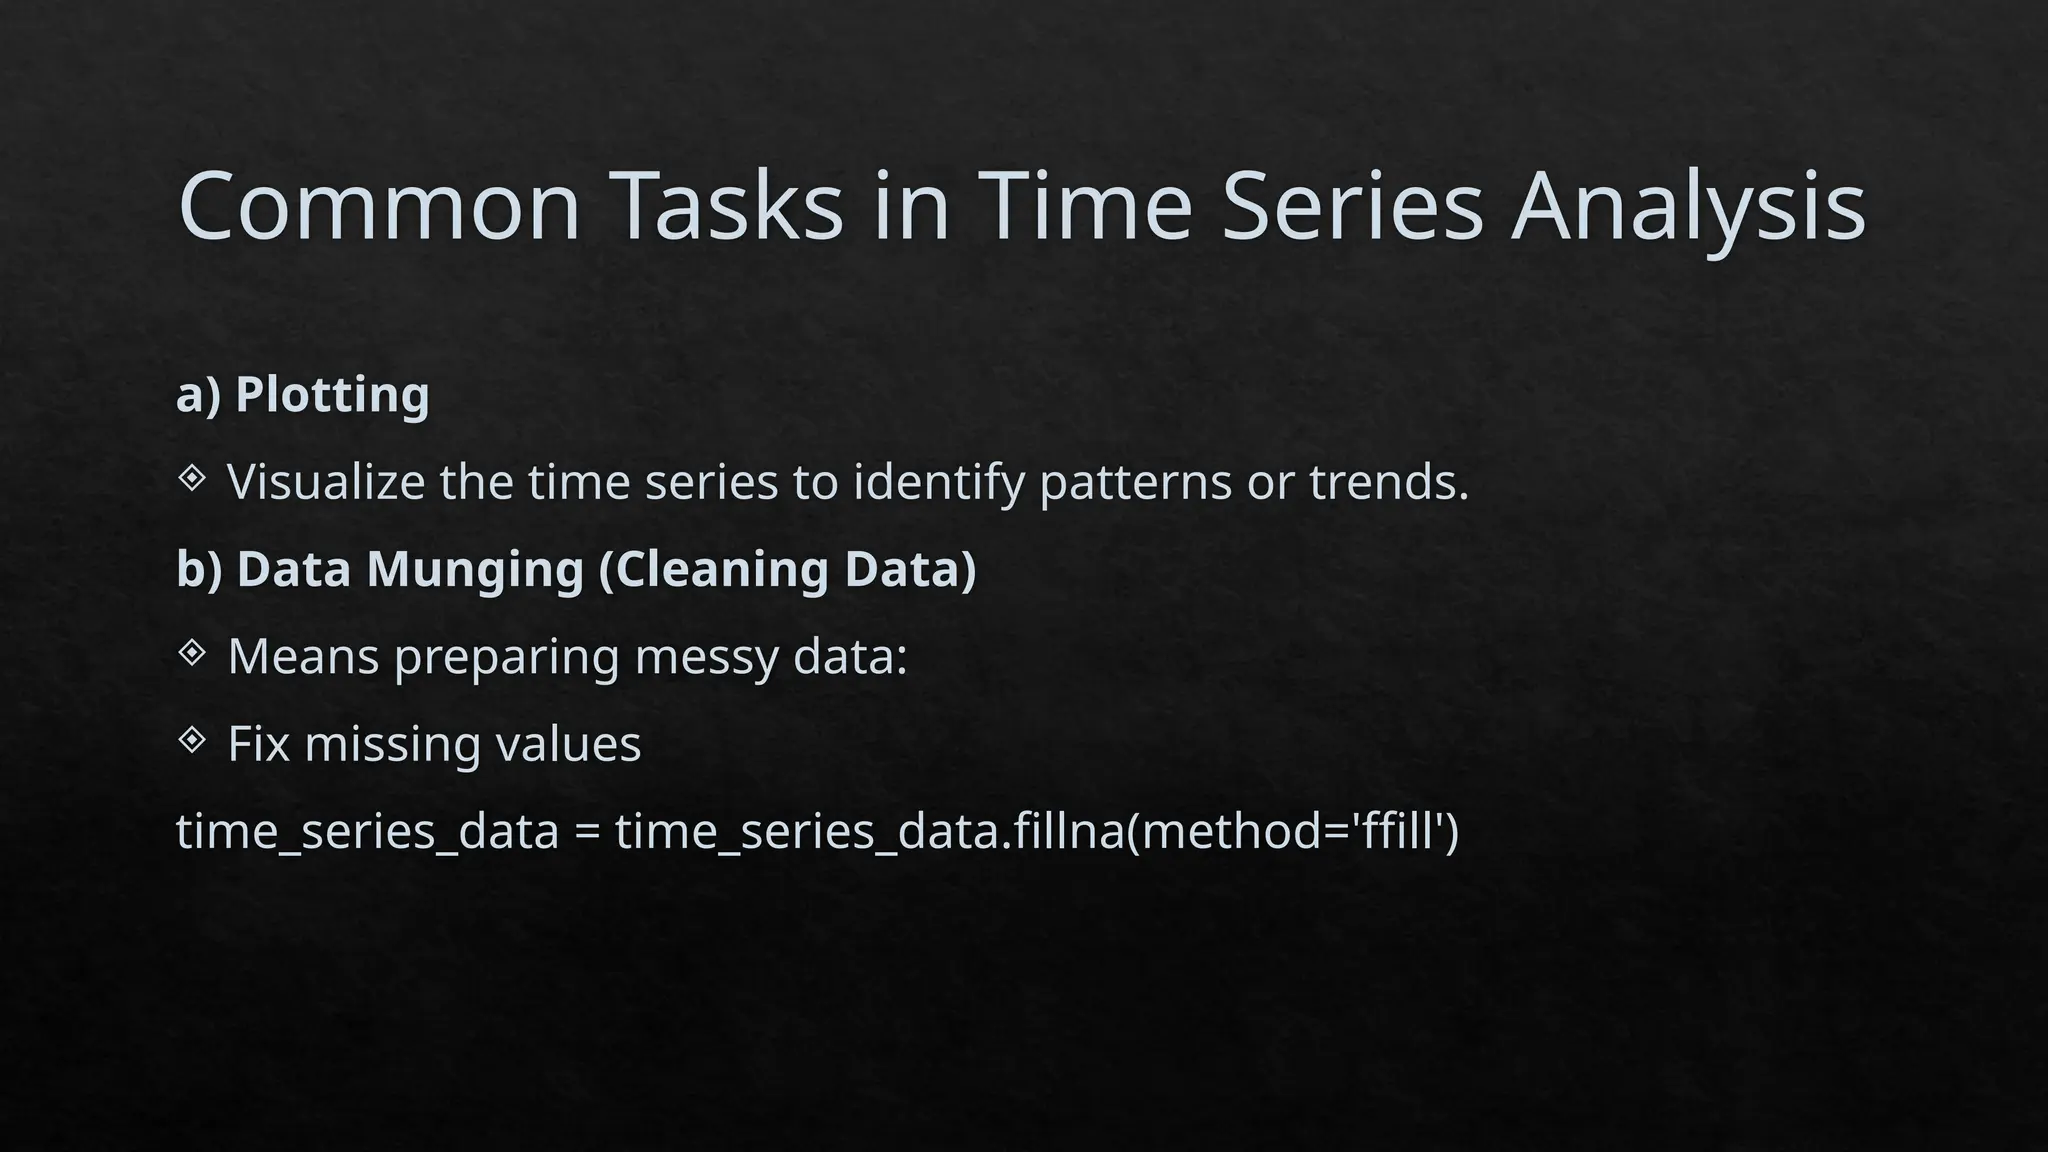
a) Plotting
Visualize the time series to identify patterns or trends.
b) Data Munging (Cleaning Data)
Means preparing messy data:
Fix missing values
time_series_data = time_series_data.fillna(method='ffill')
19.
Adjust frequency:
resampled_data = time_series_data.resample('W').mean()
c) Combining multiple data sources
If data comes from different files:
combined_data = pd.concat([data_source1, data_source2])
d) Decile and Quartile Analysis
Helps understand how data is spread.
Example:
quartiles = time_series_data.quantile([0.25, 0.5, 0.75])
deciles = time_series_data.quantile([i/10 for i in range(1, 10)])
Quartiles divide data into 4 equal parts.
Deciles divide data into 10 parts.
20.
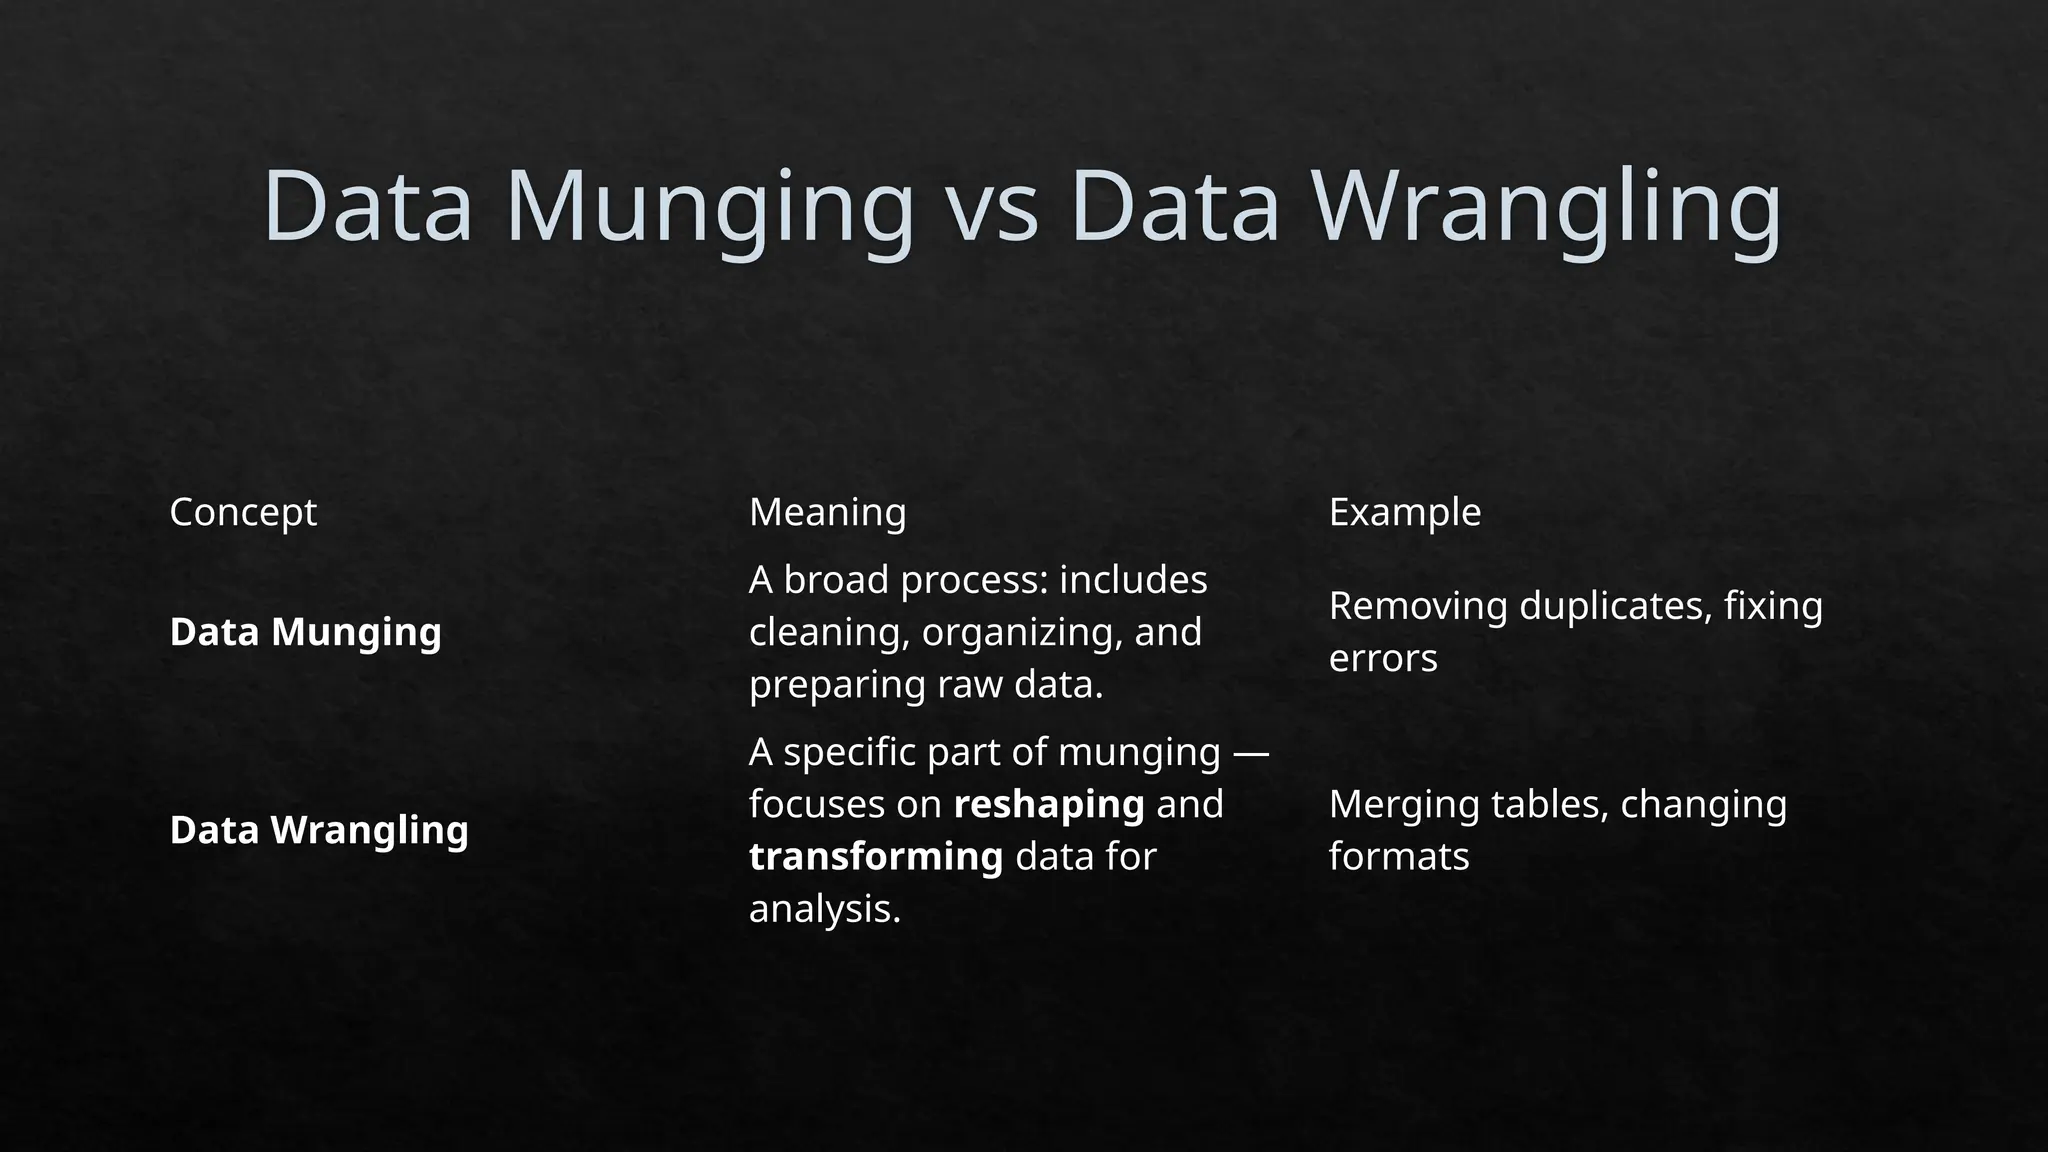
Data Munging vsData Wrangling
Concept Meaning Example
Data Munging
A broad process: includes
cleaning, organizing, and
preparing raw data.
Removing duplicates, fixing
errors
Data Wrangling
A specific part of munging —
focuses on reshaping and
transforming data for
analysis.
Merging tables, changing
formats

![Time Series Basics in Python
In Python, the most powerful tool for handling time series is the pandas
library.
import pandas as pd
time_series_data = pd.Series(
[10, 20, 30, 40],
index=pd.date_range(start='2023-10-01', periods=4, freq='D’)
)
Date Value
2023-10-01 10
2023-10-02 20
2023-10-03 30
2023-10-04 40](https://image.slidesharecdn.com/unit5-251114034904-d98a587a/75/Introduction-to-RealTime-Data-Analysis-in-Python-10-2048.jpg)
![Indexing and Selection
a) Select by a single date:
selected_data = time_series_data['2023-10-01']
b) Select by a date range:
selected_range = time_series_data['2023-10-01':'2023-10-03']
c) Select by condition:
subset = time_series_data[time_series_data > 20]](https://image.slidesharecdn.com/unit5-251114034904-d98a587a/75/Introduction-to-RealTime-Data-Analysis-in-Python-14-2048.jpg)
![ Adjust frequency:
resampled_data = time_series_data.resample('W').mean()
c) Combining multiple data sources
If data comes from different files:
combined_data = pd.concat([data_source1, data_source2])
d) Decile and Quartile Analysis
Helps understand how data is spread.
Example:
quartiles = time_series_data.quantile([0.25, 0.5, 0.75])
deciles = time_series_data.quantile([i/10 for i in range(1, 10)])
Quartiles divide data into 4 equal parts.
Deciles divide data into 10 parts.](https://image.slidesharecdn.com/unit5-251114034904-d98a587a/75/Introduction-to-RealTime-Data-Analysis-in-Python-19-2048.jpg)


![Introduction to Pandas and Time Series Analysis [Budapest BI Forum]](https://cdn.slidesharecdn.com/ss_thumbnails/introductiontopandasandtimeseriesanalysis-170617163829-thumbnail.jpg?width=640&height=640&fit=bounds)


![Introduction to Pandas and Time Series Analysis [PyCon DE]](https://cdn.slidesharecdn.com/ss_thumbnails/introductiontopandasandtimeseriesanalysispyconde-170617163724-thumbnail.jpg?width=640&height=640&fit=bounds)
![Introduction to Data Analtics with Pandas [PyCon Cz]](https://cdn.slidesharecdn.com/ss_thumbnails/introductiontodataanalticswithpandaspyconcz-170617163446-thumbnail.jpg?width=640&height=640&fit=bounds)