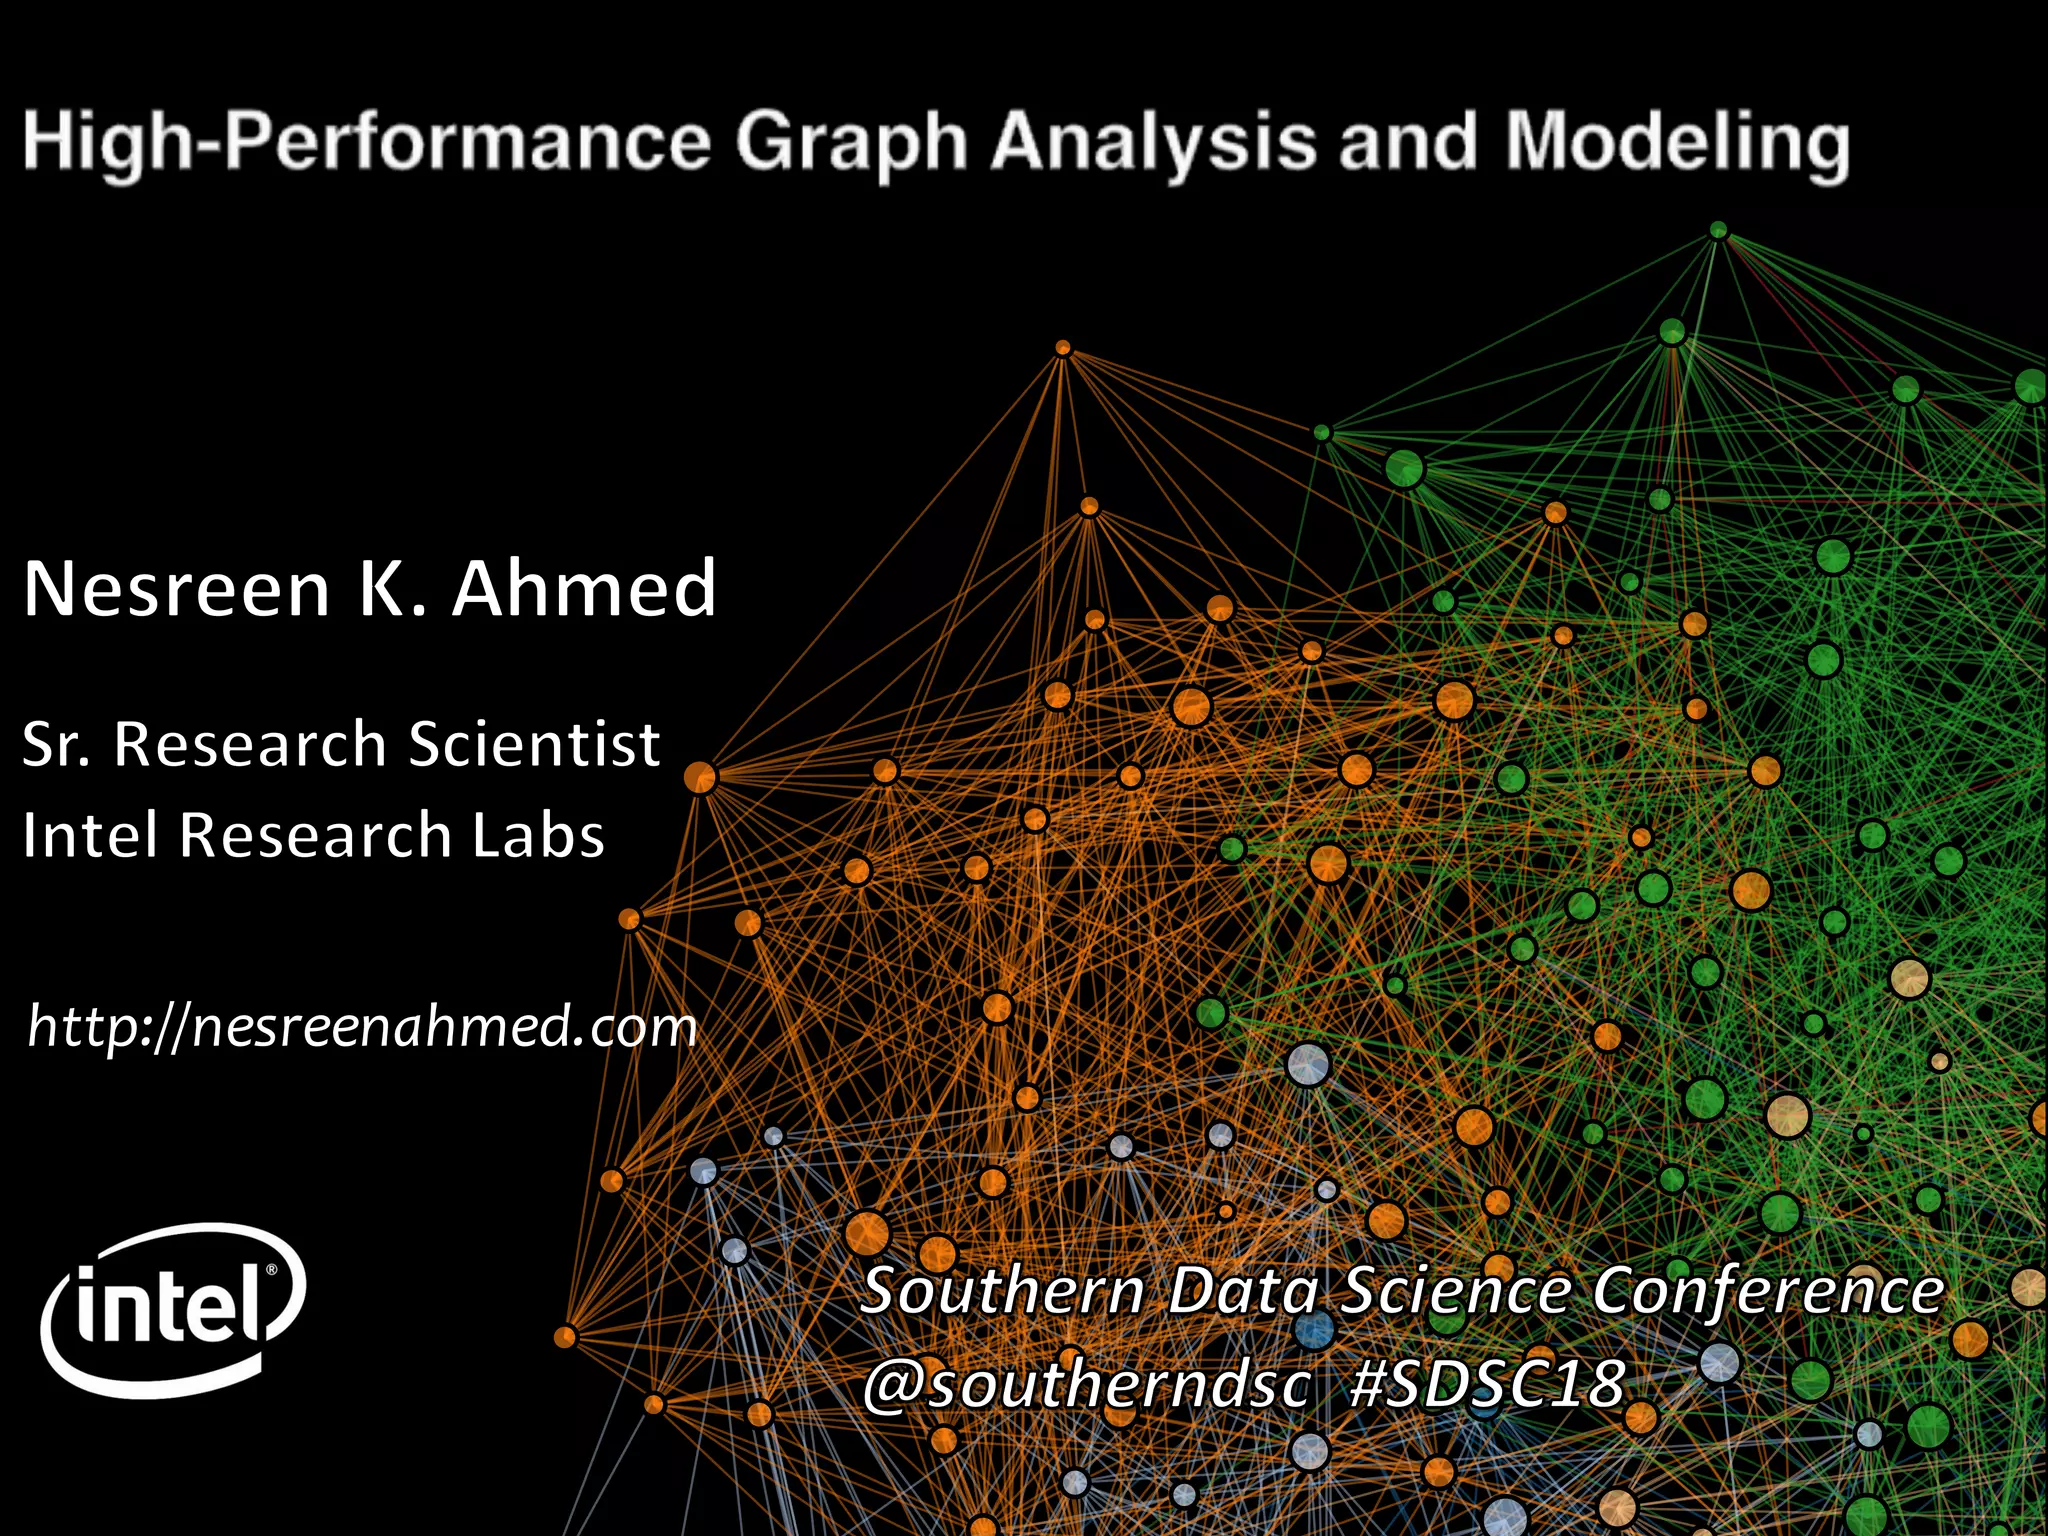
Download as PDF, PPTX

![-‐
-‐
-‐
-‐
-‐
Social network
Human Disease Network
[Barabasi 2007]
Food Web [2007]
Terrorist Network
[Krebs 2002]Internet (AS) [2005]
Gene Regulatory Network
[Decourty 2008]
Protein Interactions
[breast cancer]
Political blogs
Power grid](https://image.slidesharecdn.com/sdsc2018-180417220838/75/High-Performance-Graph-Analysis-and-Modeling-9-2048.jpg)
![Network Motifs: Simple Building Blocks of Complex Networks – [Milo et. al – Science 2002]
The Structure and Function of Complex Networks – [Newman – Siam Review 2003]
2-node
Graphlets
3-node
Graphlets
4-node
Graphlets
Connected
Disconnected](https://image.slidesharecdn.com/sdsc2018-180417220838/75/High-Performance-Graph-Analysis-and-Modeling-24-2048.jpg)
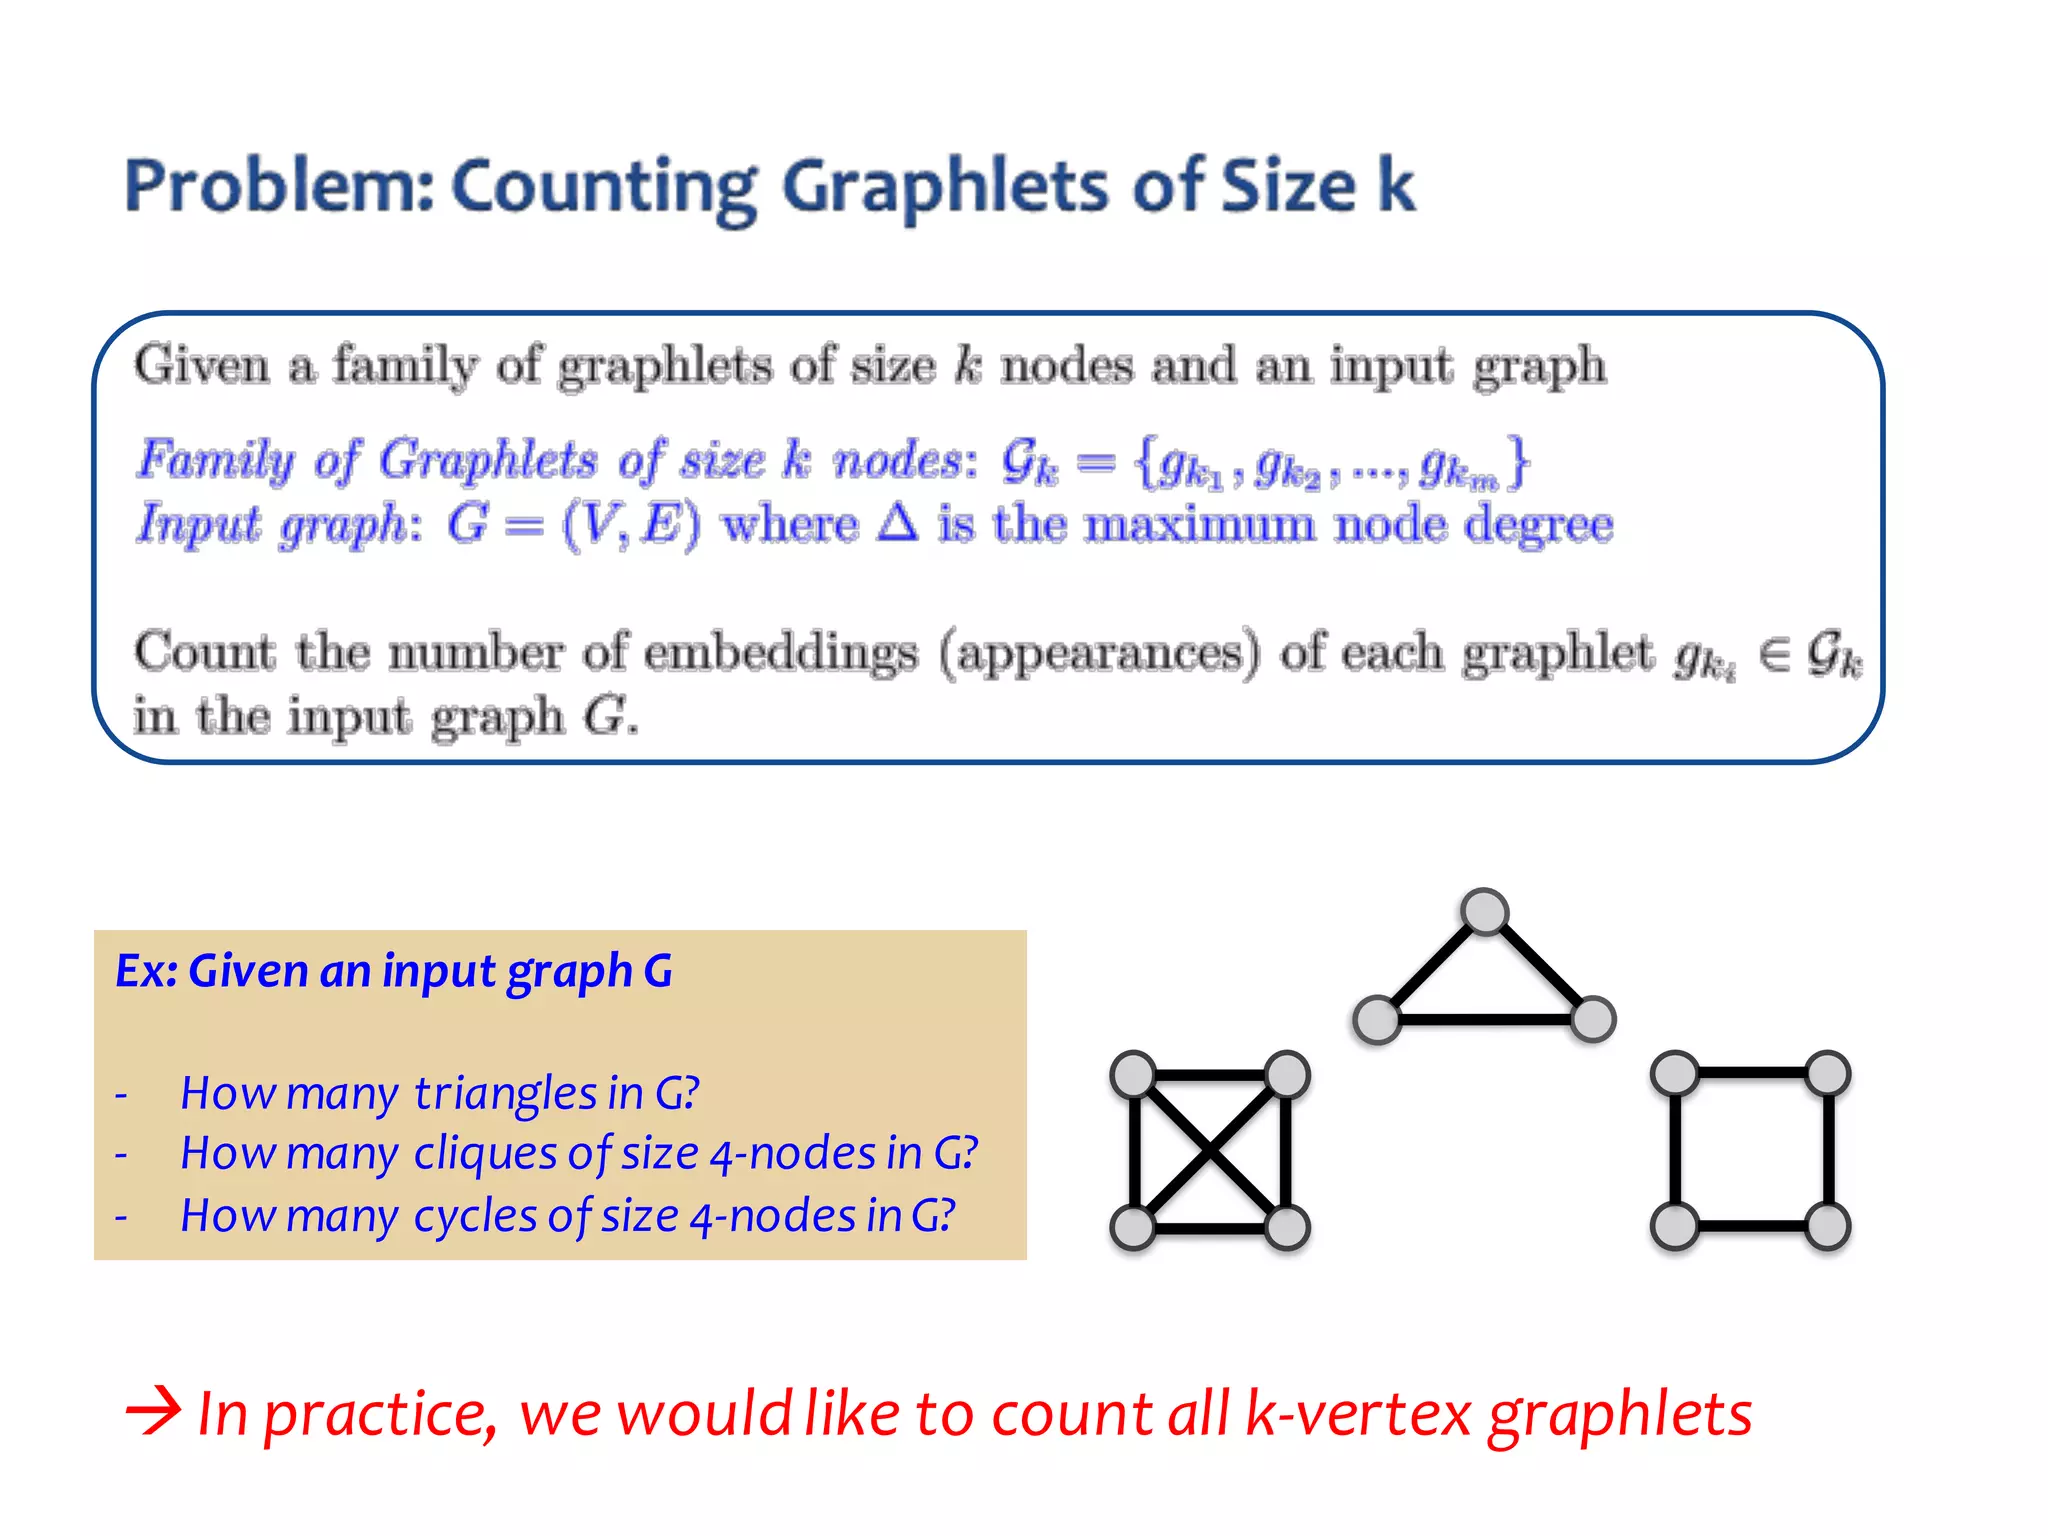
![§ Enumerate all possible graphlets
à Exhaustive enumeration is too expensive
§ Count graphlets for each node – and combine all node counts
à Still expensive for relatively large k [Shervashidze et. al – AISTAT 2009]
§ Other recent work counts only connected graphlets of size k=4
[Marcus & Shavitt – Computer Networks 2012]
Not practical – scales only for small graphs with few
hundred/thousand nodes/edges
-‐ taking 2400 secs for a graph with 26K nodes](https://image.slidesharecdn.com/sdsc2018-180417220838/75/High-Performance-Graph-Analysis-and-Modeling-27-2048.jpg)
![§ Efficient estimation of word representations in vector space. ICLR 2013 [Mikolov et. al]
§ A Framework for Generalizing Graph-‐based Representation Learning Methods. arXiv:1709.04596 2017 [Ahmed et. al]
§ Role Discovery in Networks. TKDE 2015 [Rossi & Ahmed]
§ A Higher-‐order Latent Space Network Model. AAAI 2017 [Ahmed, Rossi, Willke, Zhou]
§ node2vec: Scalable Feature Learning for Networks. KDD 2016 [Grover, Leskovec]
§ DeepWalk: online learning of social representations. KDD 2014 [Perozzi, Al-‐Rafou, Skiena]
§ Efficient Graphlet Counting for Large Networks. ICDM 2015, [Ahmed et al.]
§ Graphlet Decomposition: Framework, Algorithms, and Applications. J. Know. & Info. 2016 [Ahmed et al.]
§ Network Motifs: Simple Building Blocks of Complex Networks. Science 2002, [Milo et al.]
§ Uncovering Biological Network Function via Graphlet Degree Signatures. Cancer Informatics 2008 [Milenković-‐Pržulj]
§ Graph Kernels. JMLR 2010, [Vishwanathan et al.]
§ The Structure and Function of Complex Networks. SIAM Review 2003, [Newman]
§ Biological network comparison using graphlet degree distribution. Bioinformatics 2007 [Pržulj]
§ Efficient Graphlet Kernels for Large Graph Comparison. AISTAT 2009 [Shervashidze et al.]
§ Local structure in social networks. Sociological methodology 1976, [Holland-‐Leinhardt]
§ The strength of weak ties: A network theory revisited. Sociological theory 1983 [Granovetter]](https://image.slidesharecdn.com/sdsc2018-180417220838/75/High-Performance-Graph-Analysis-and-Modeling-47-2048.jpg)

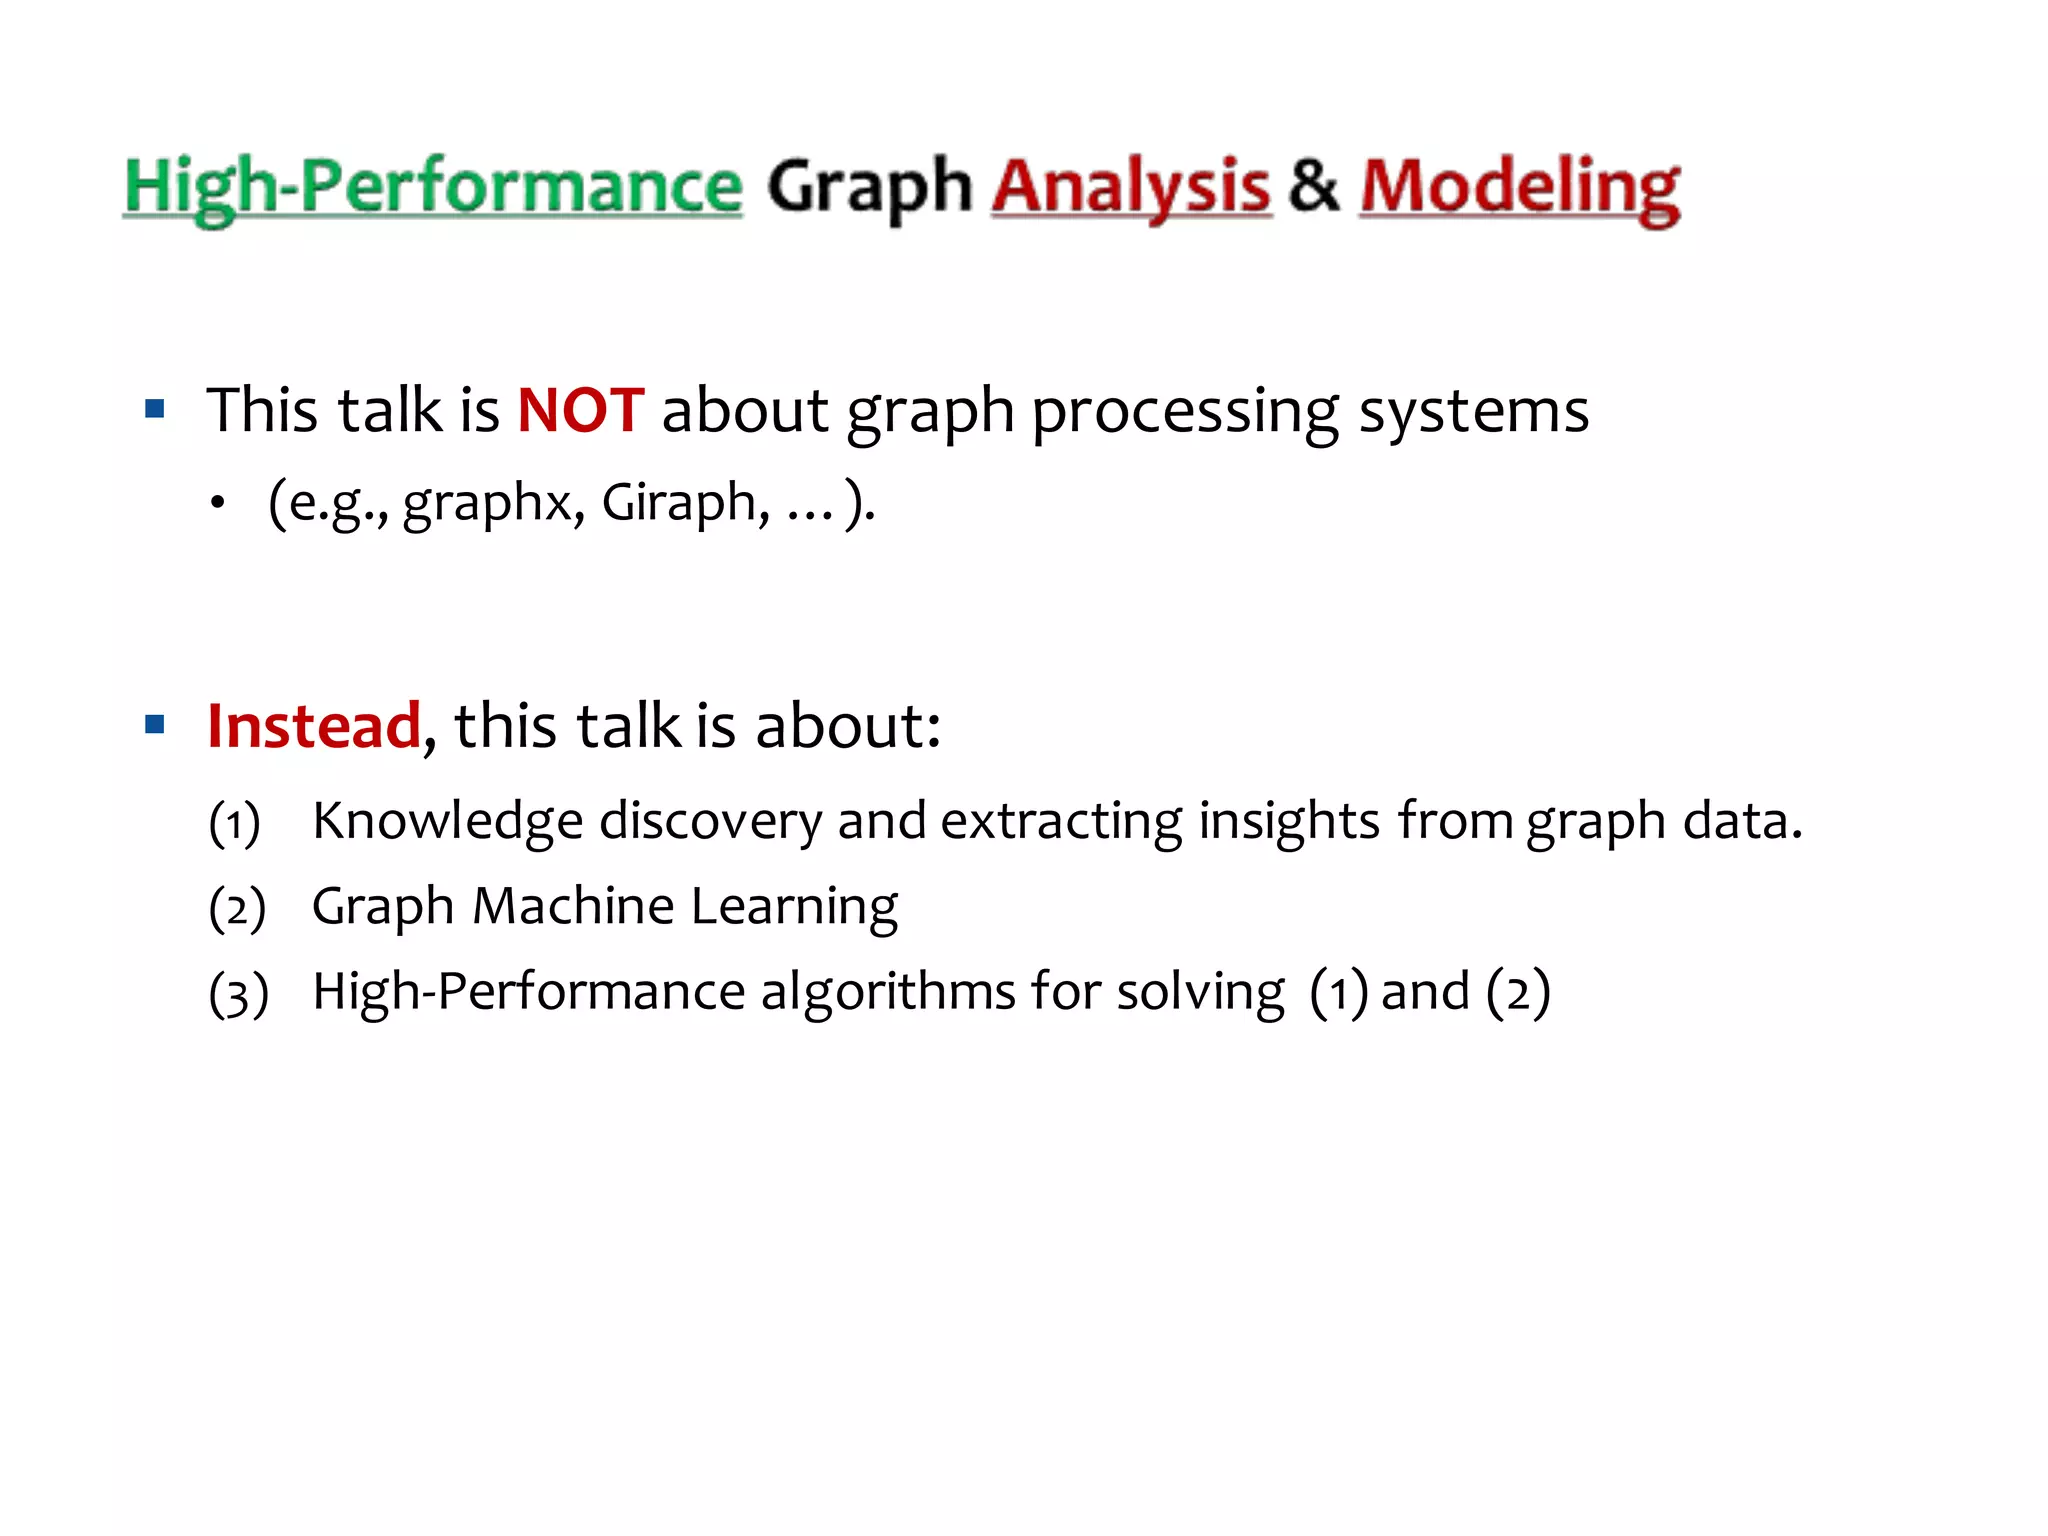
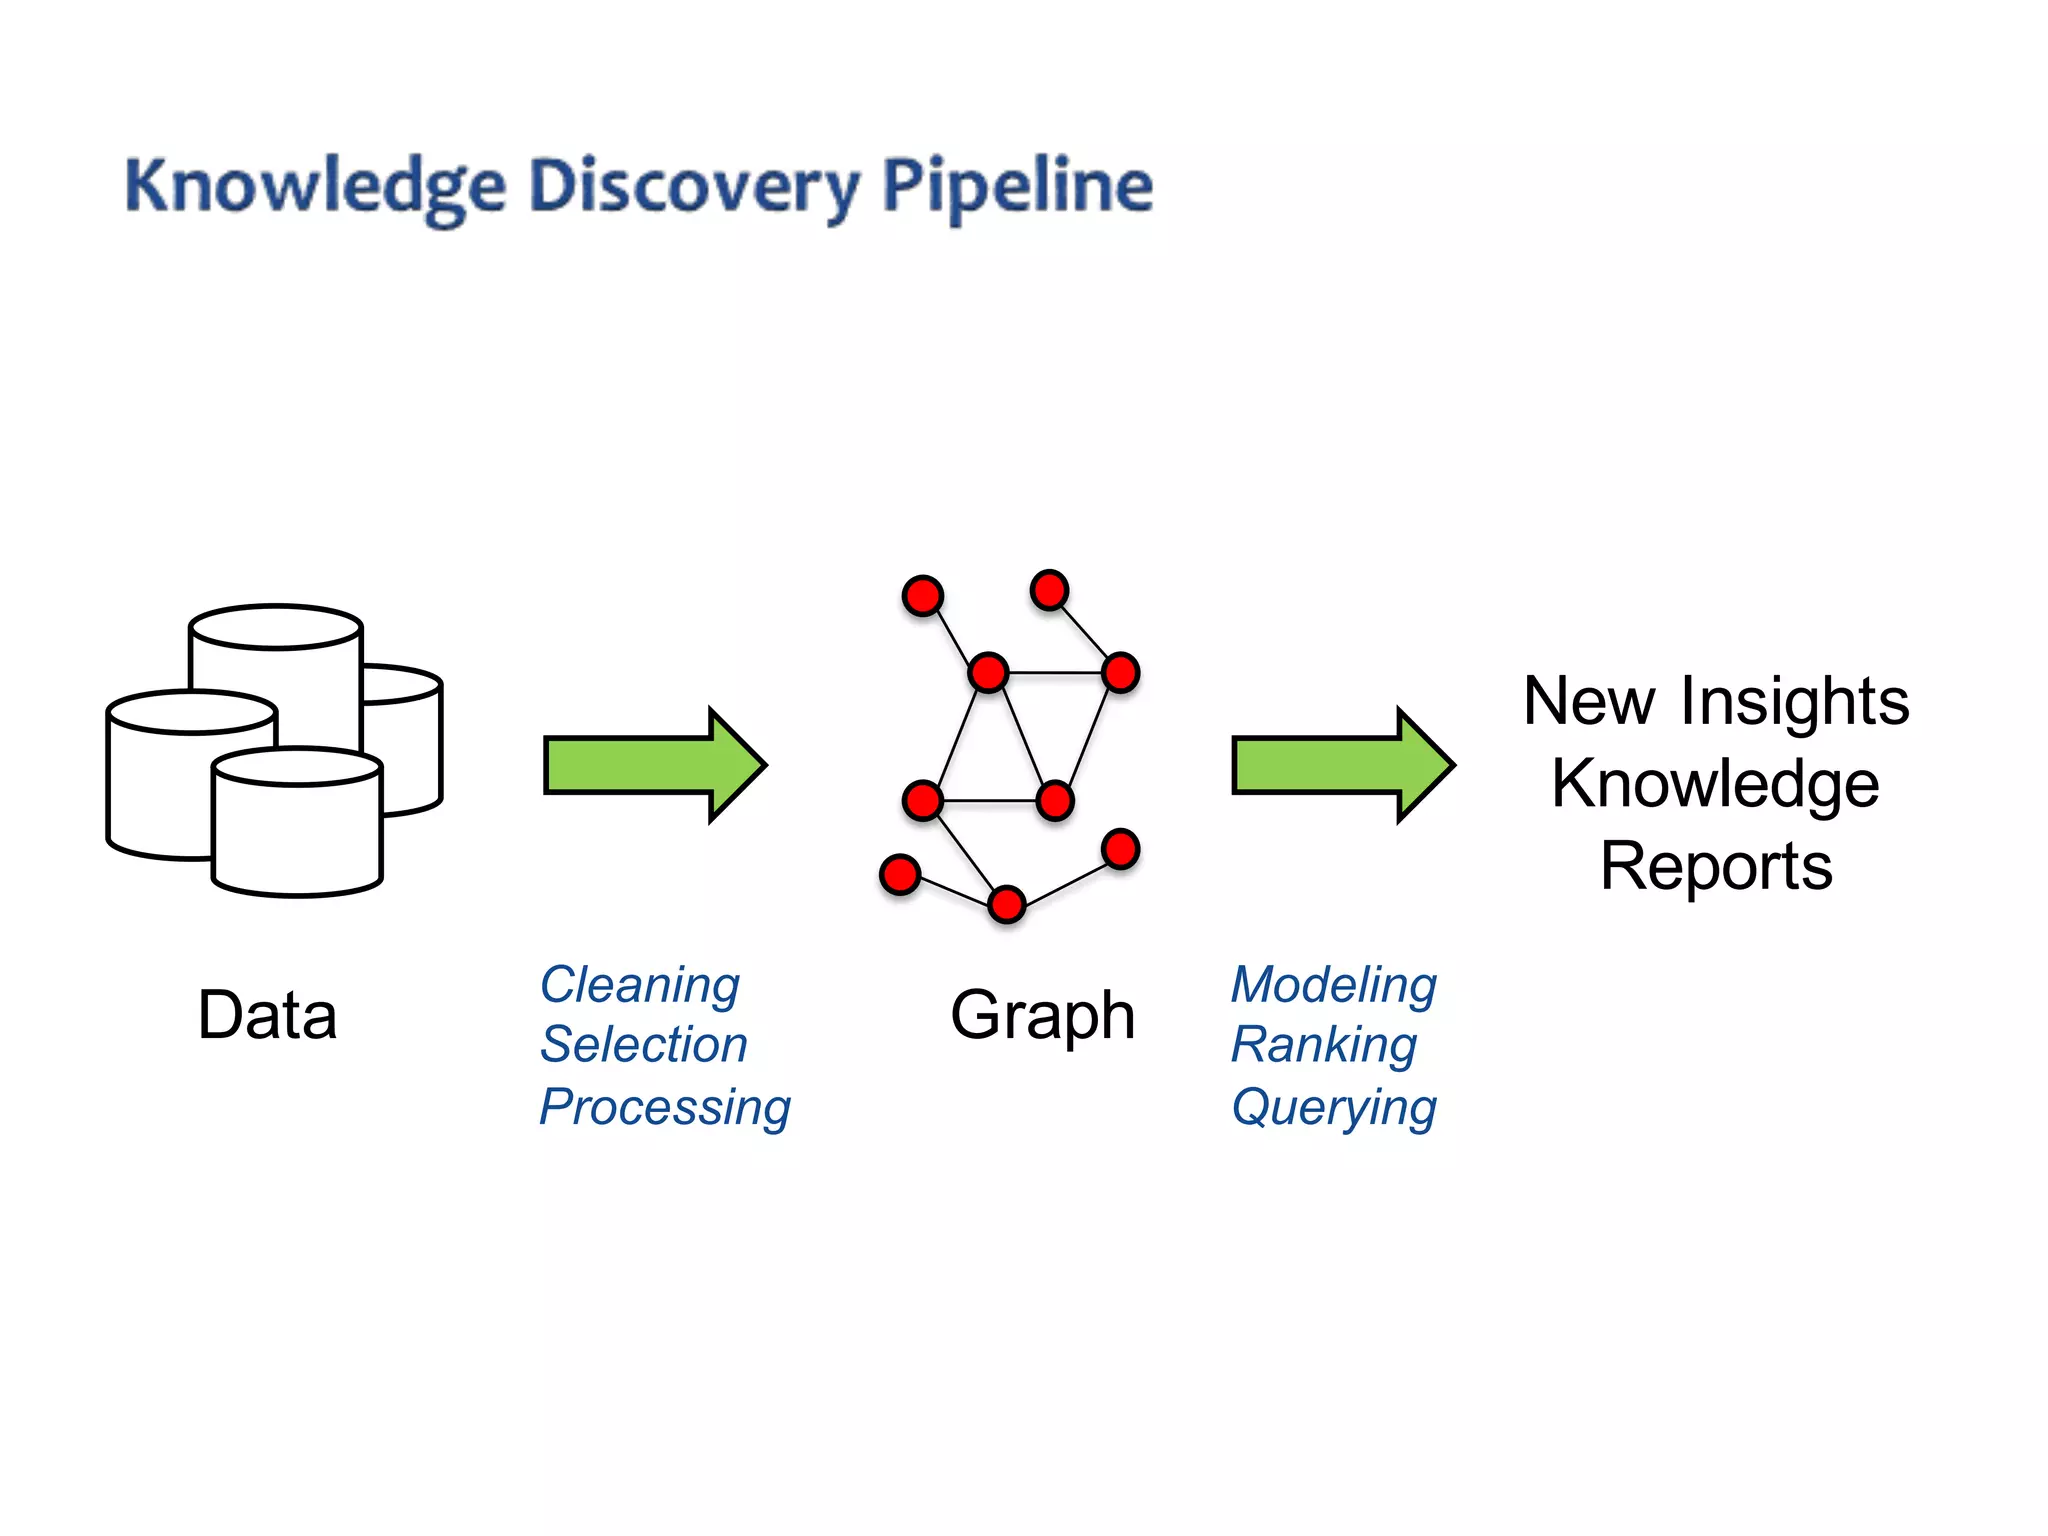
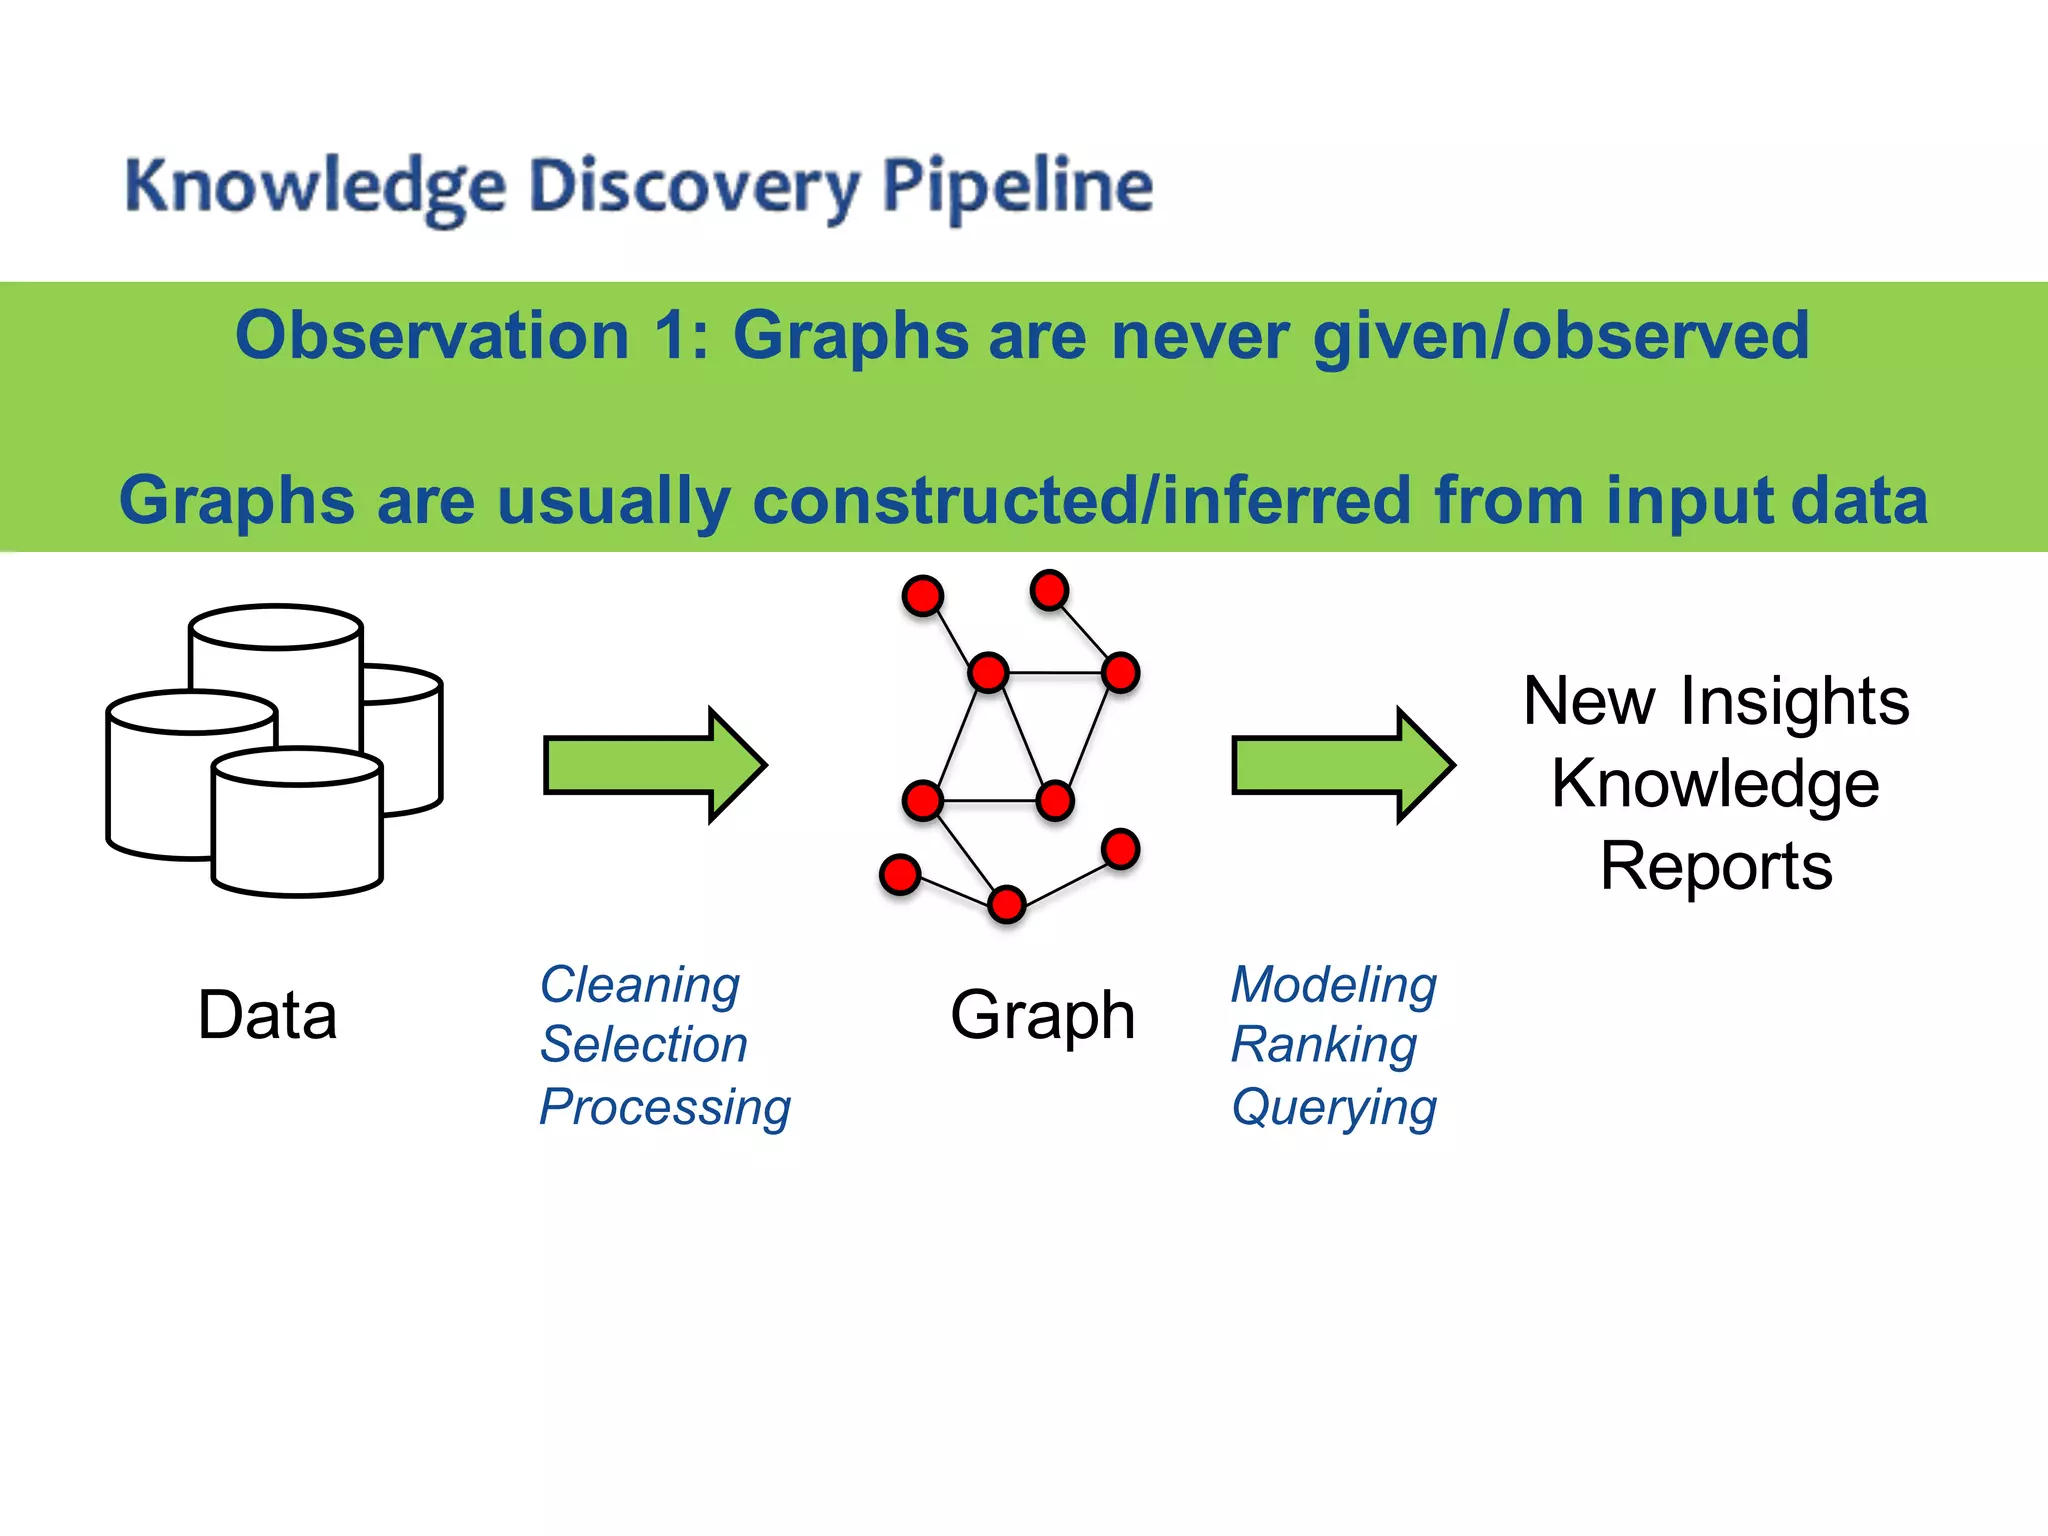
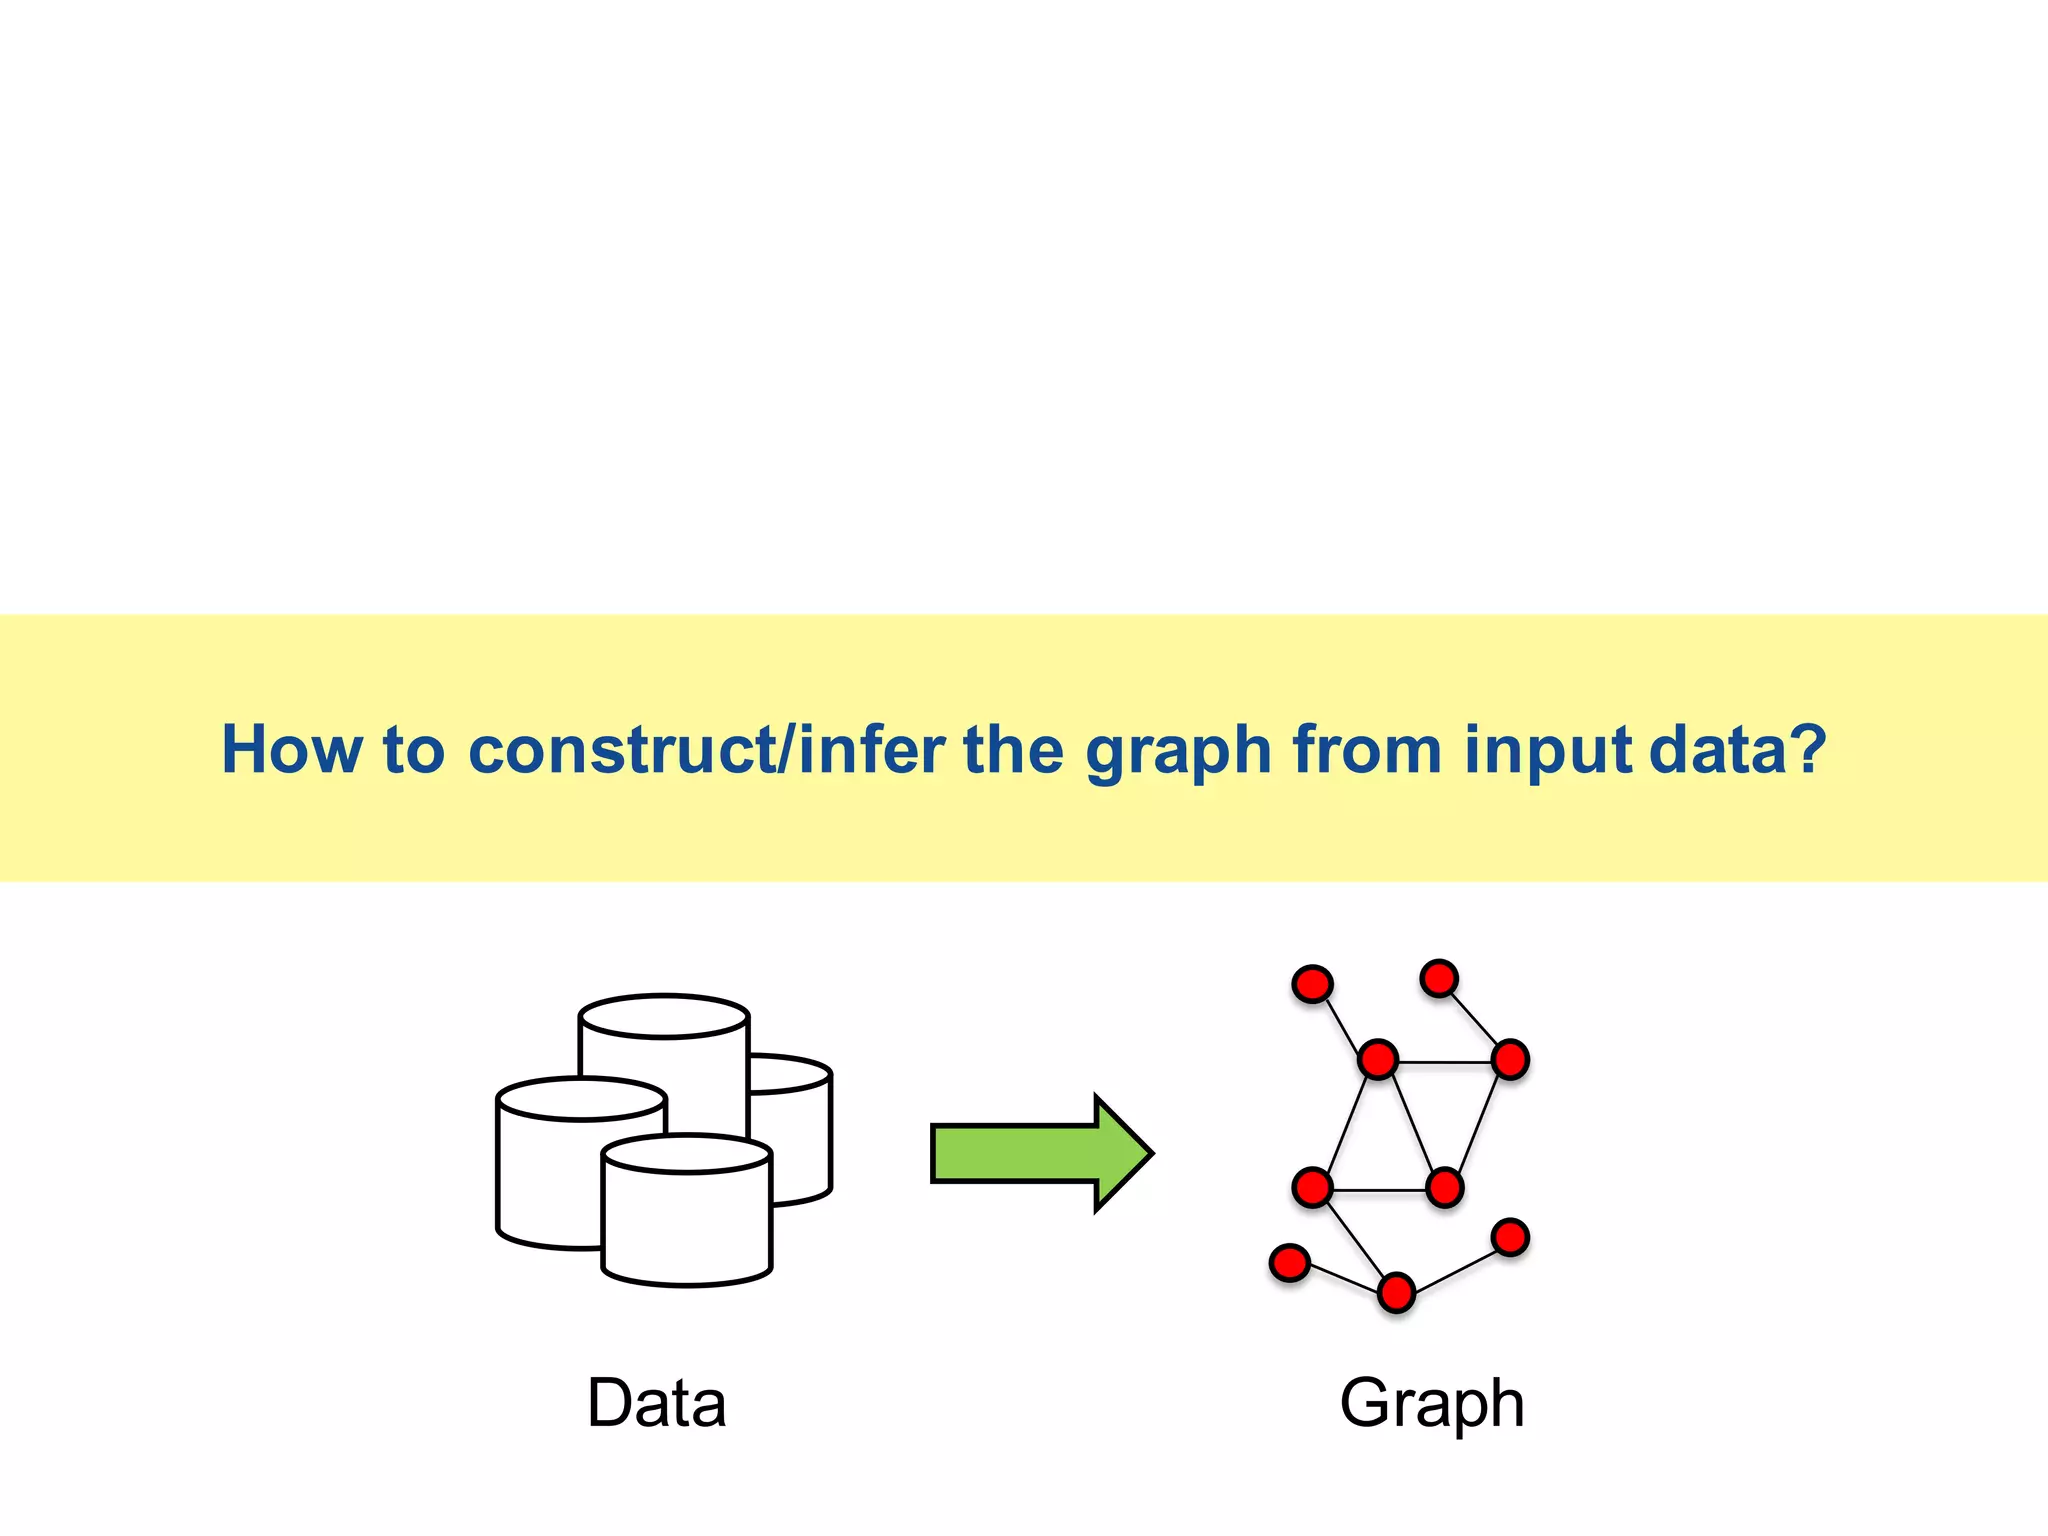
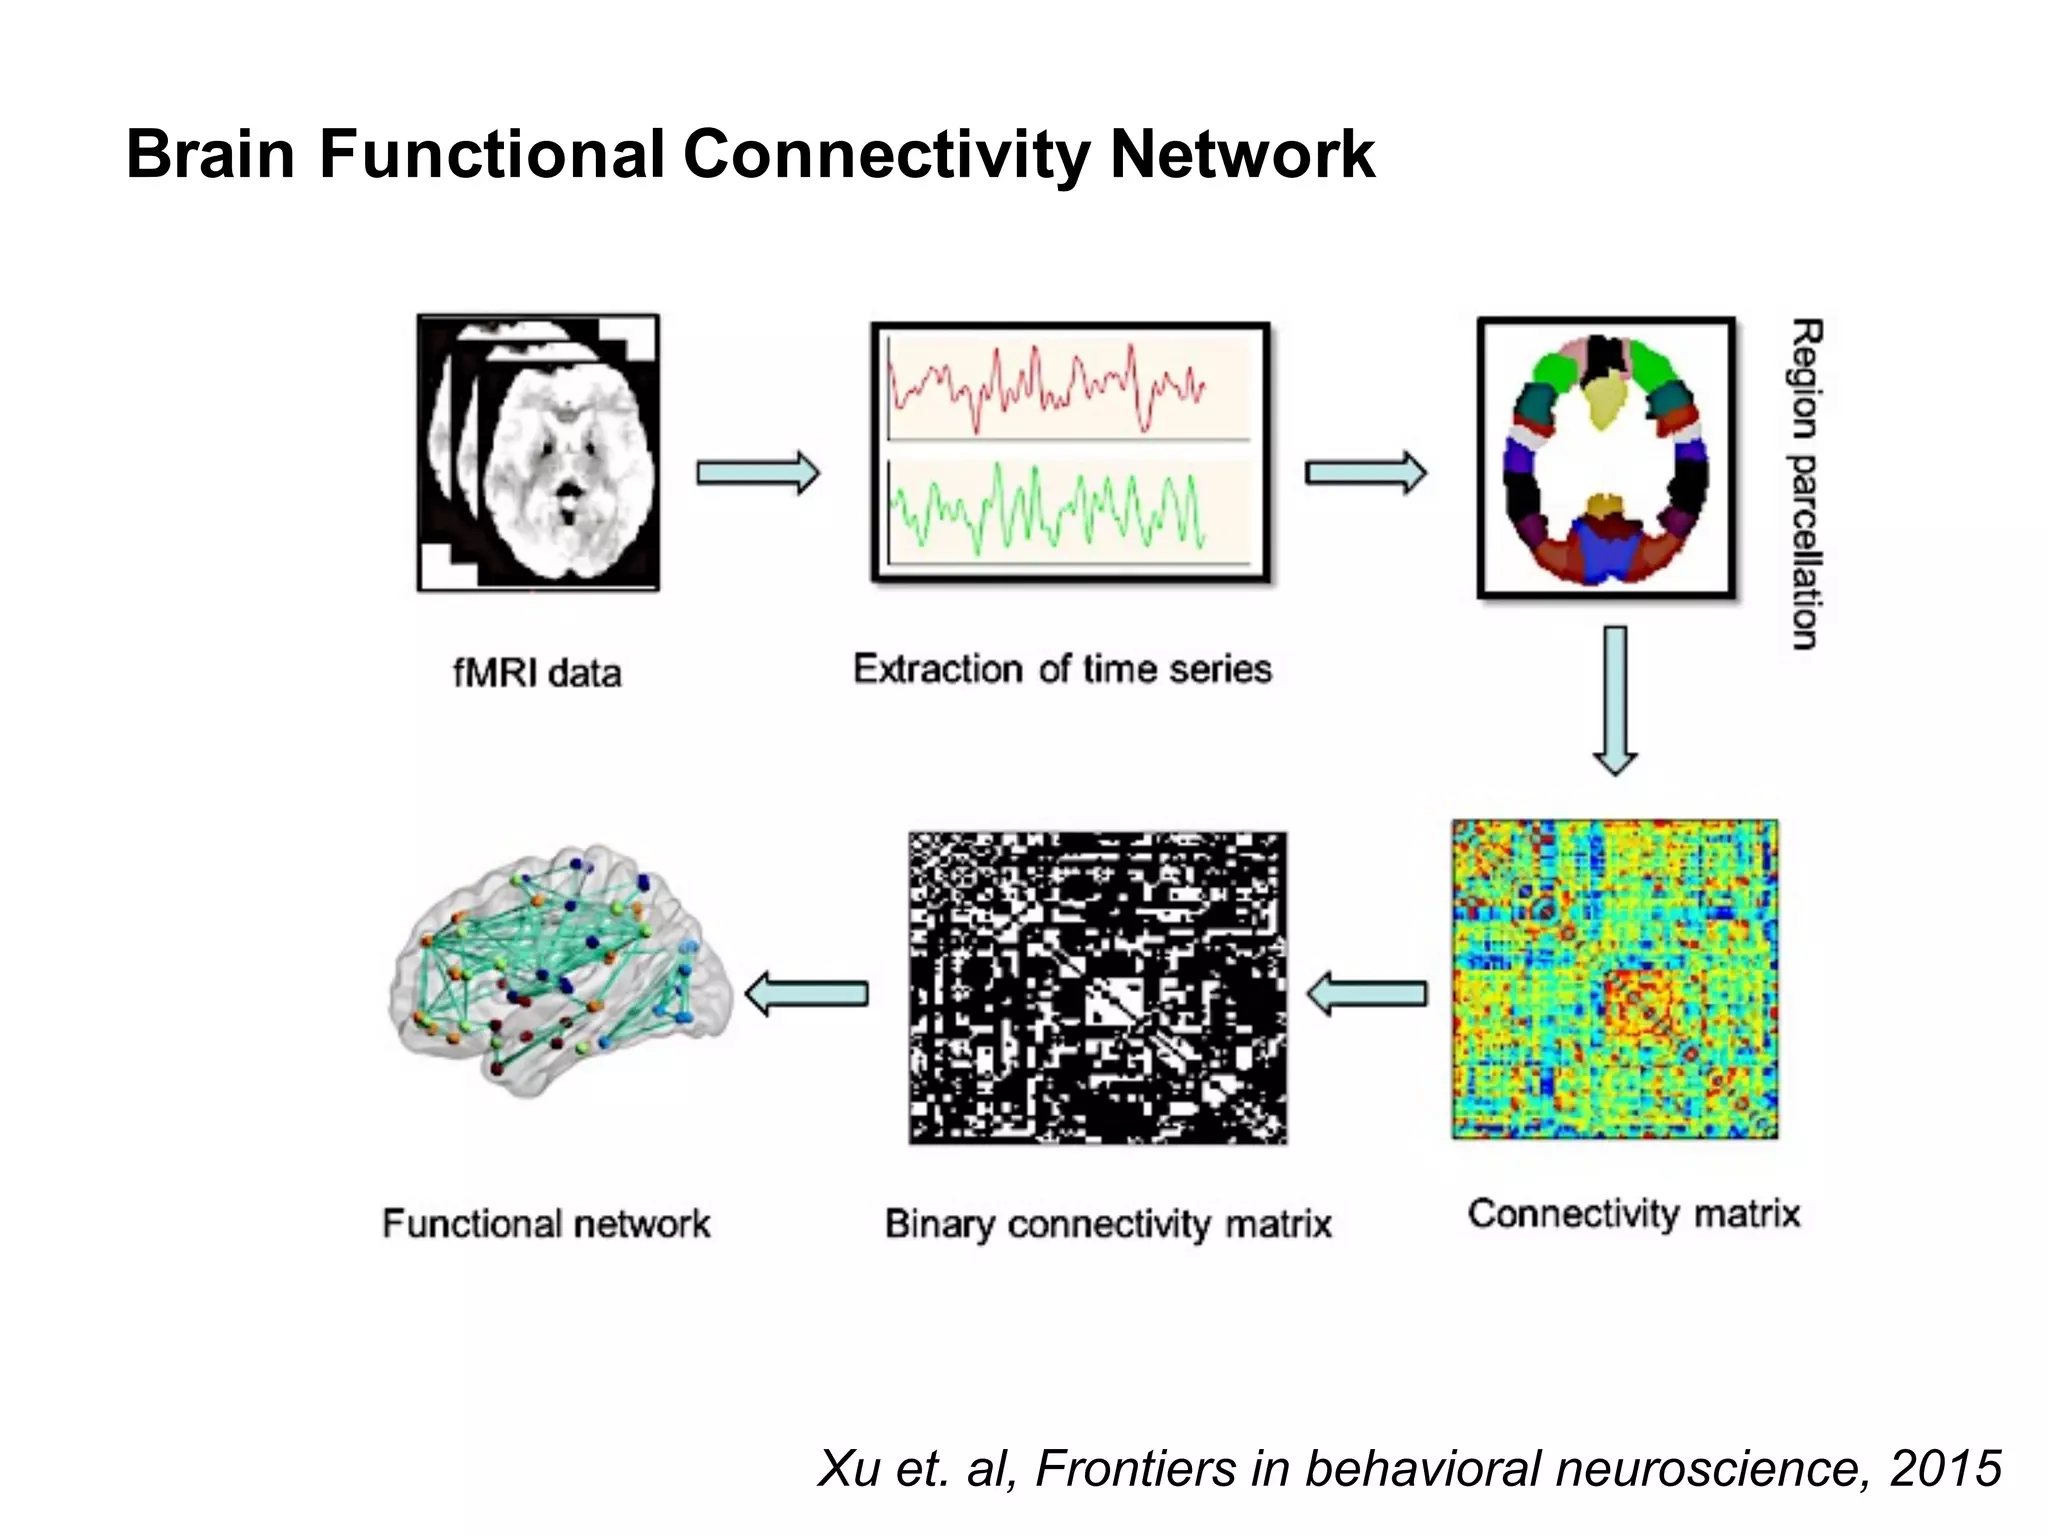
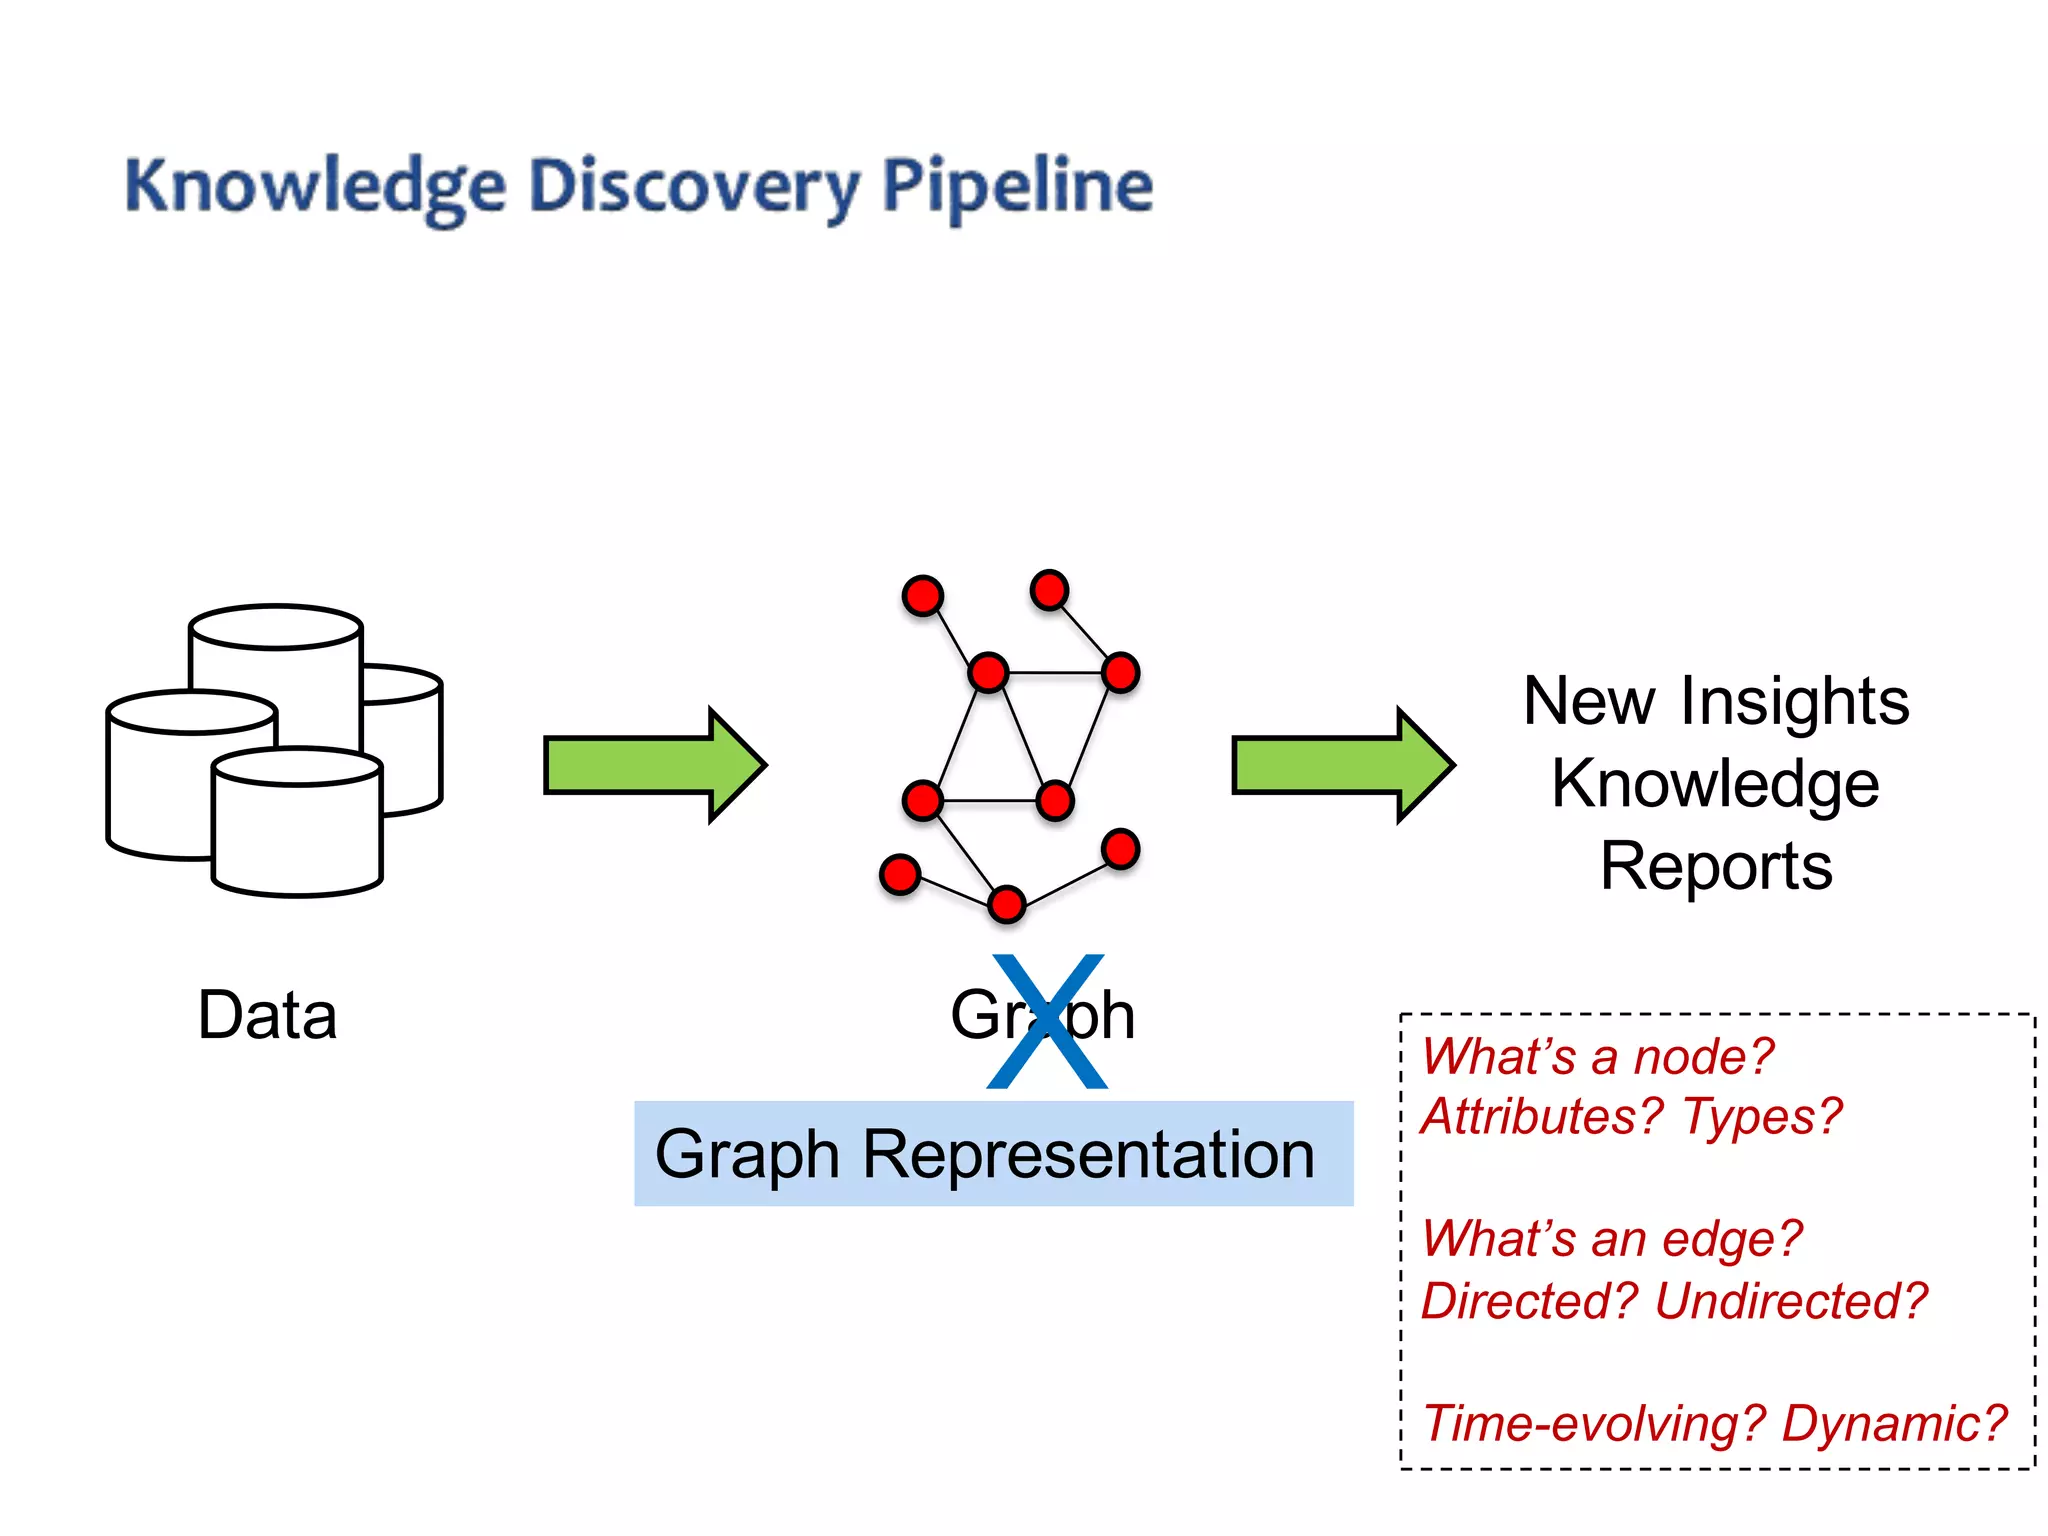
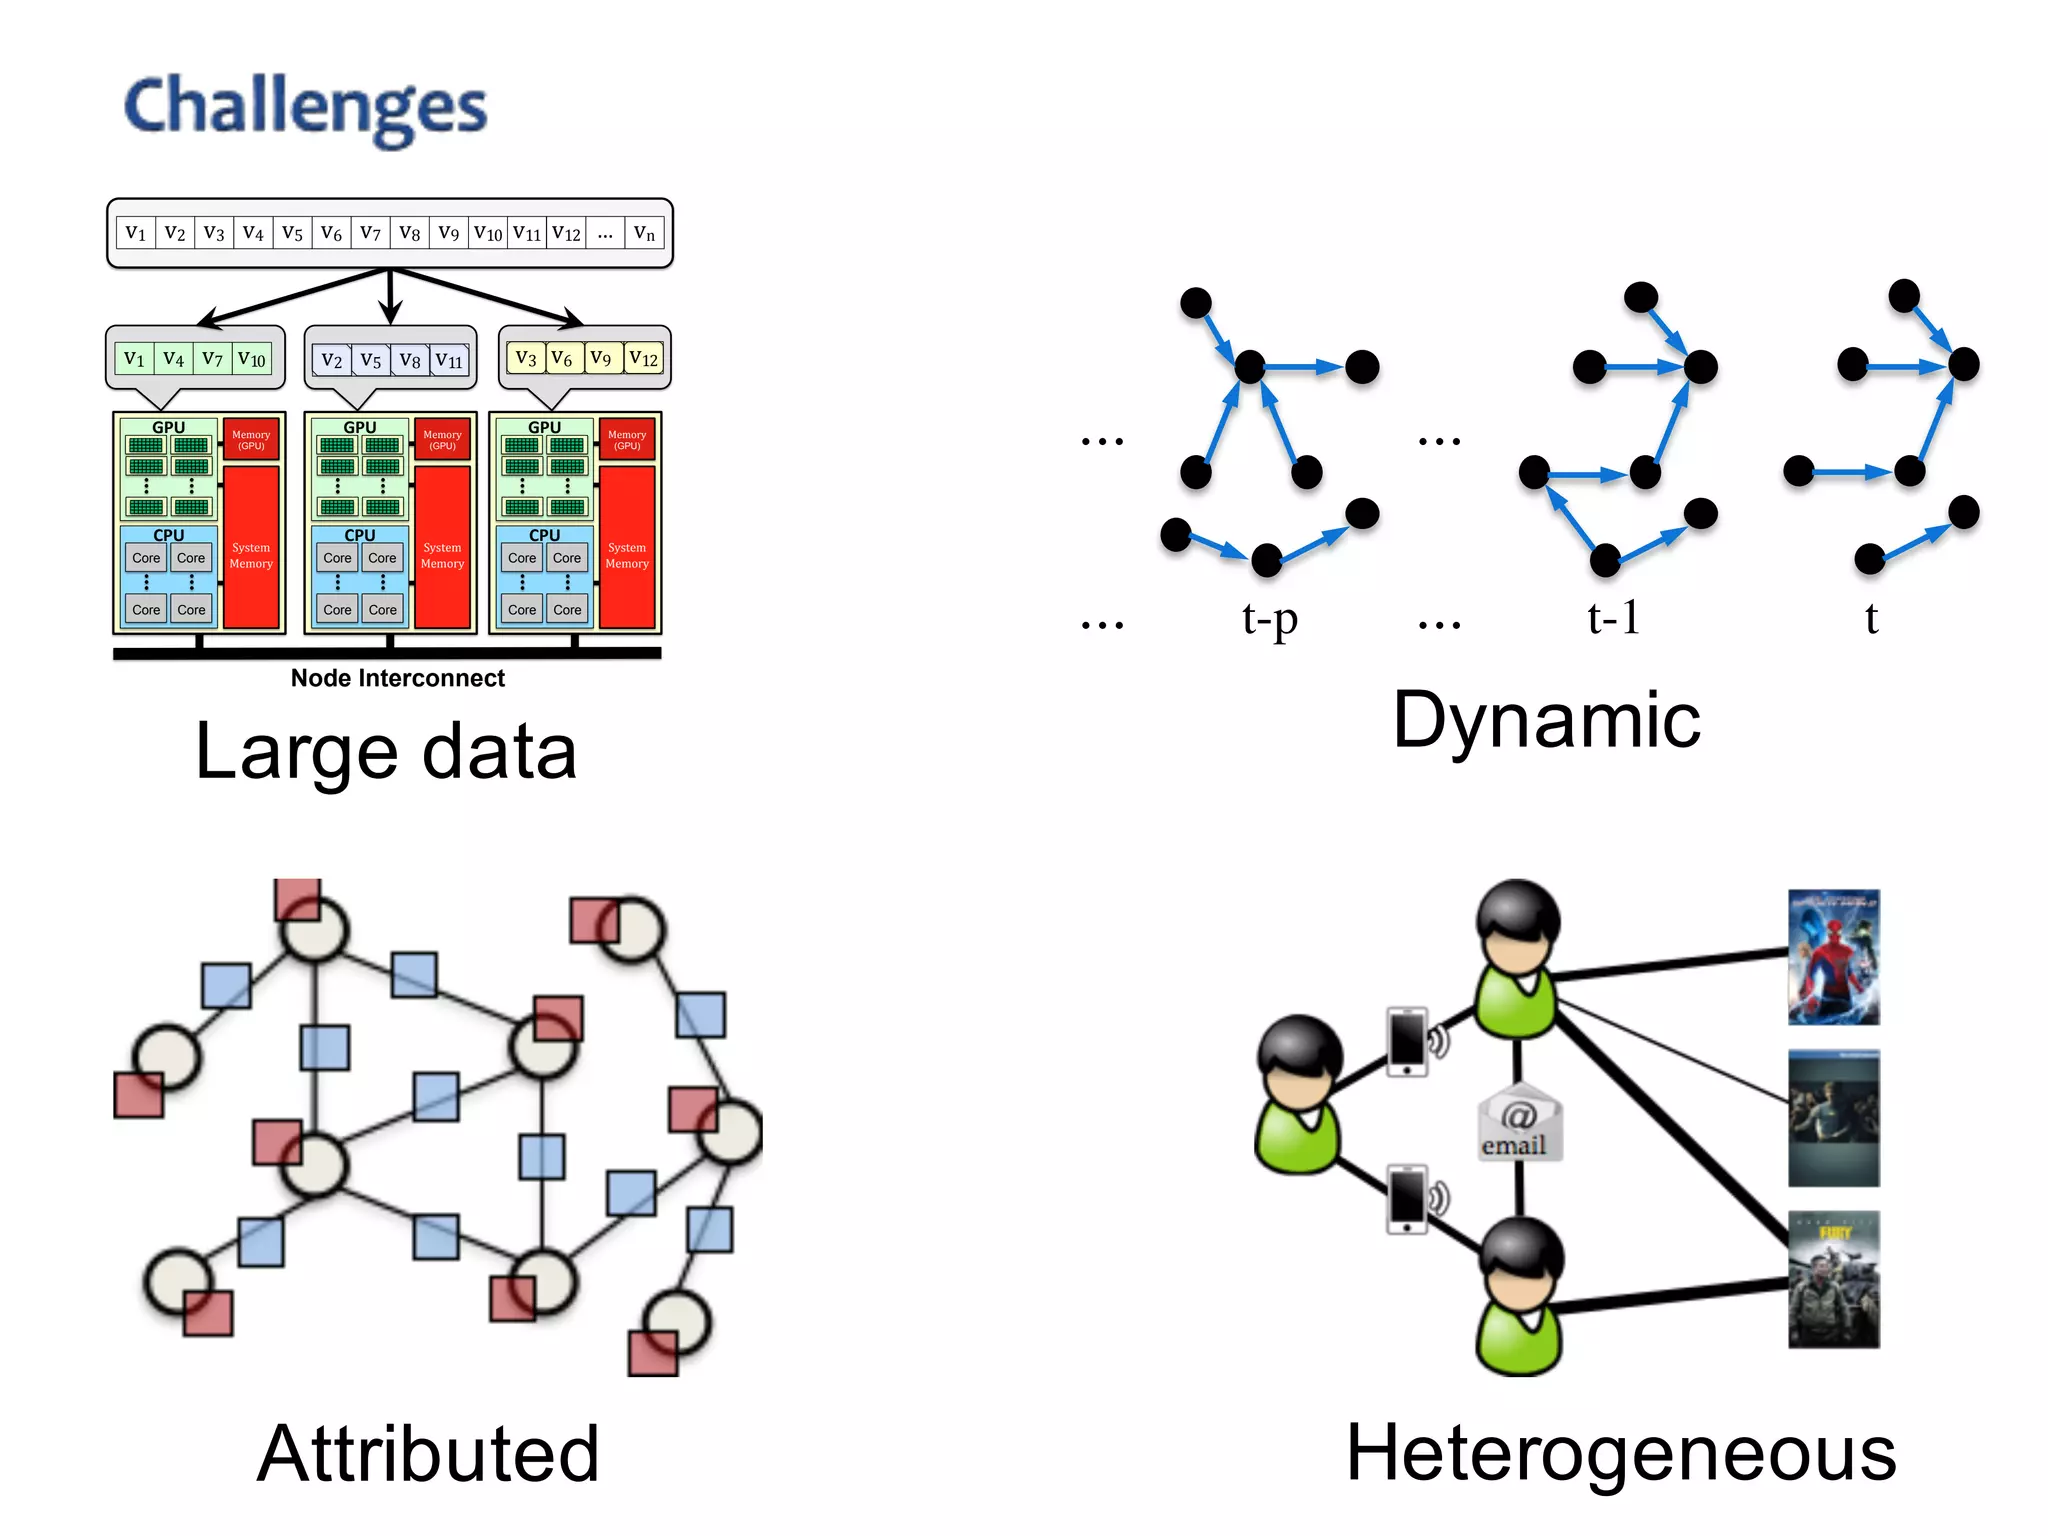
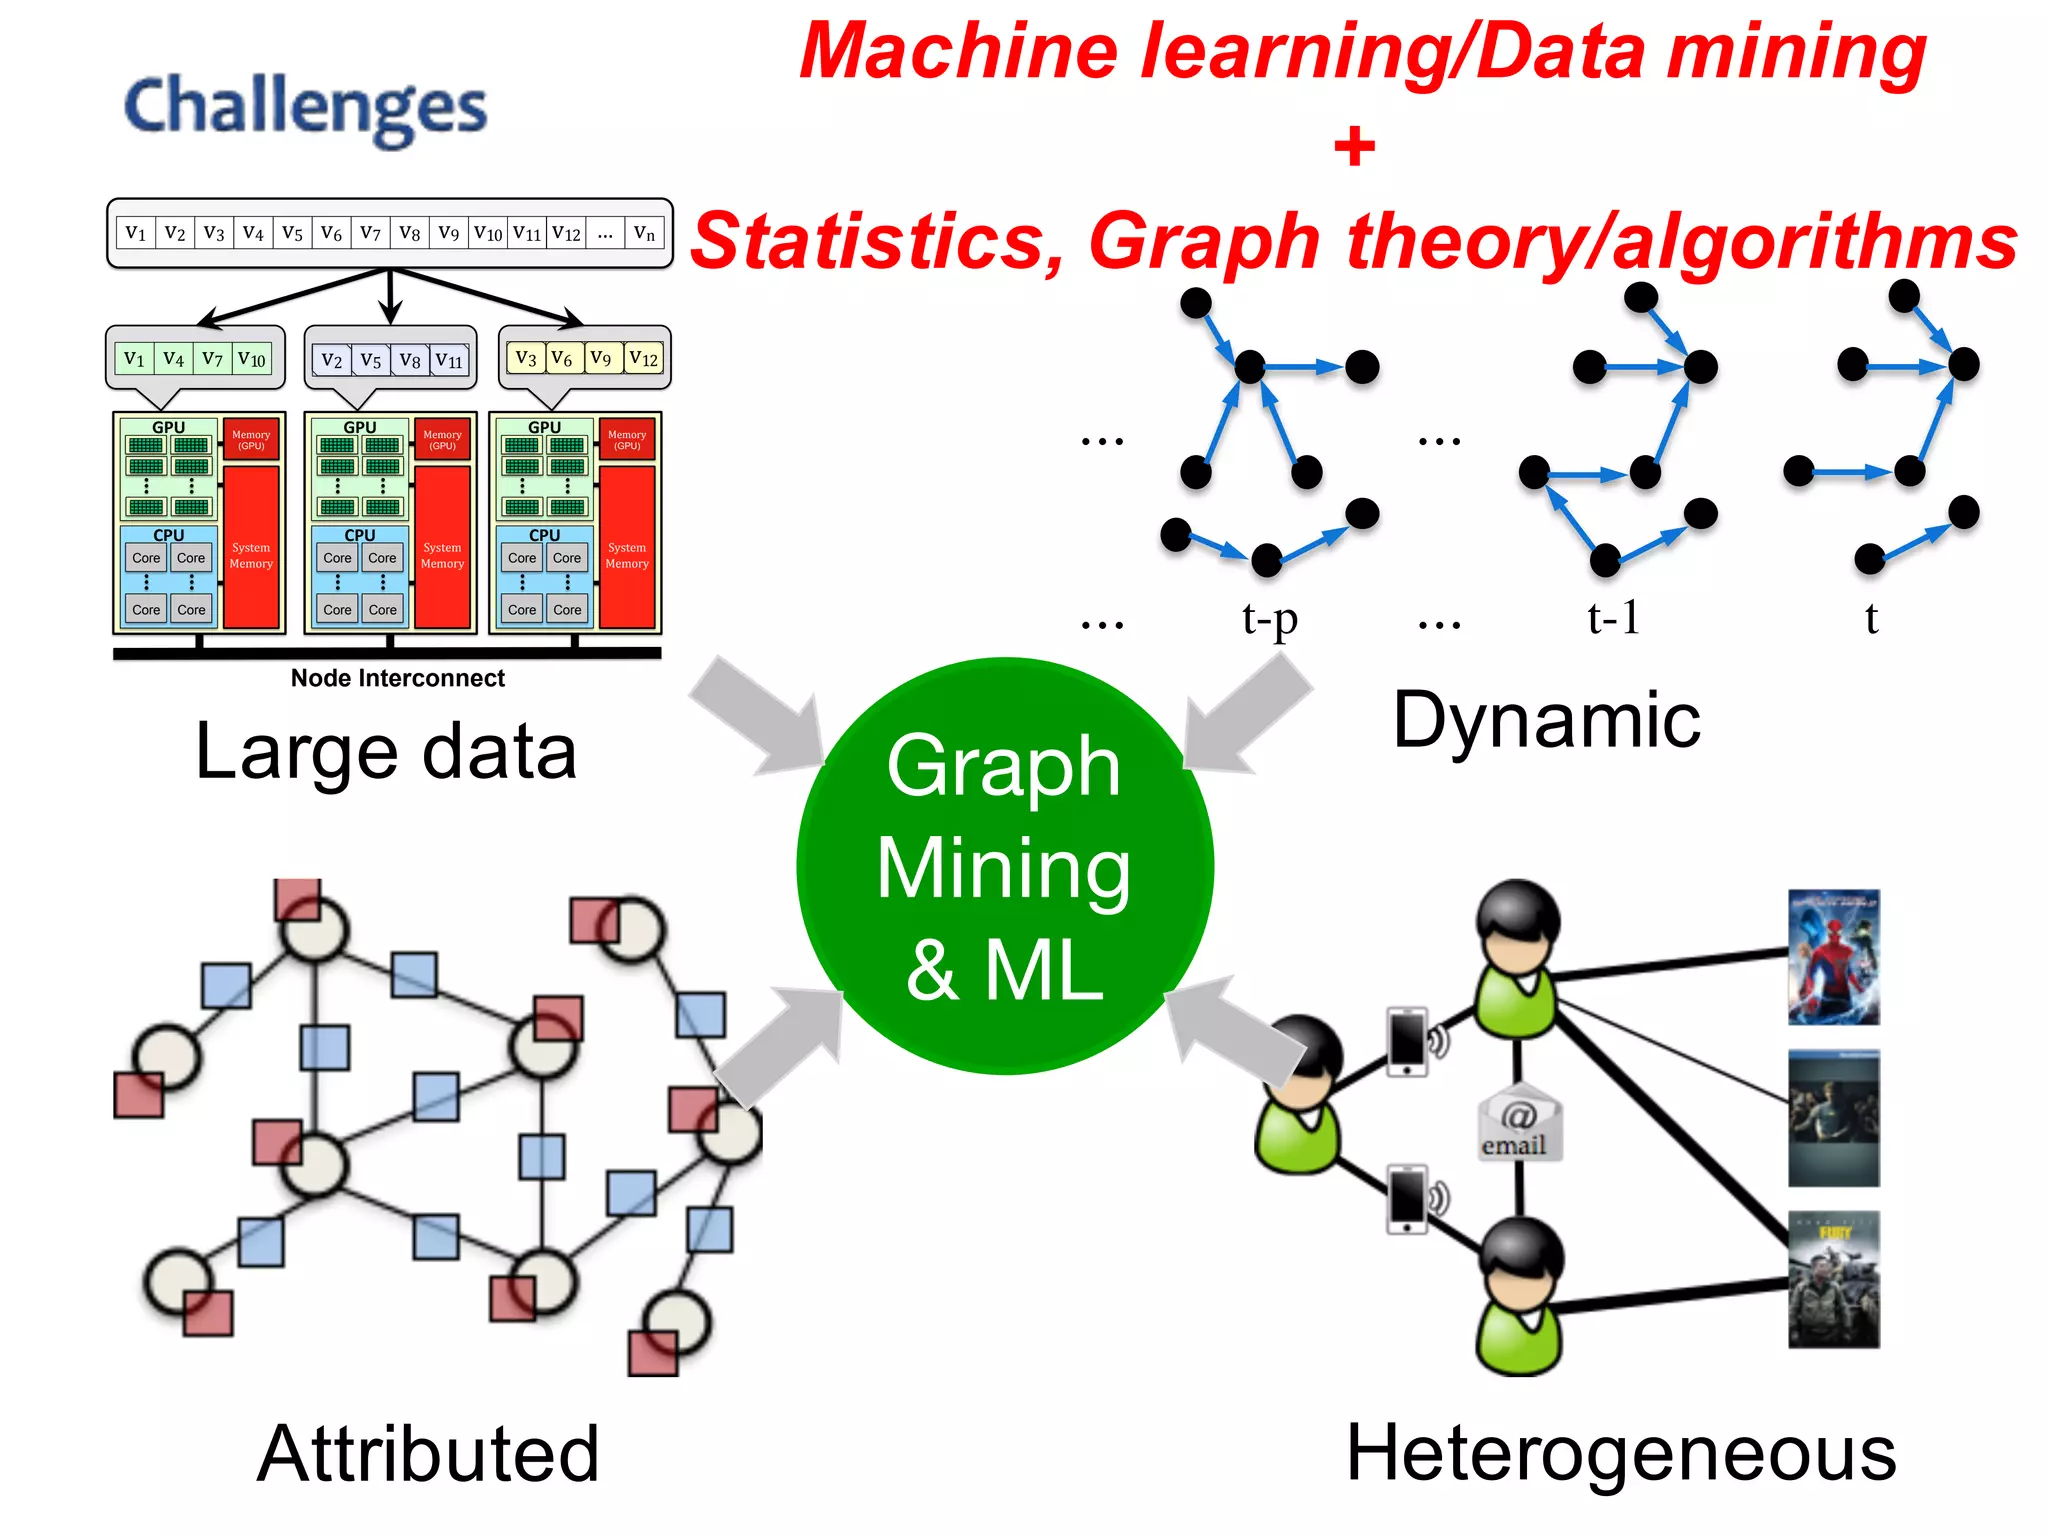
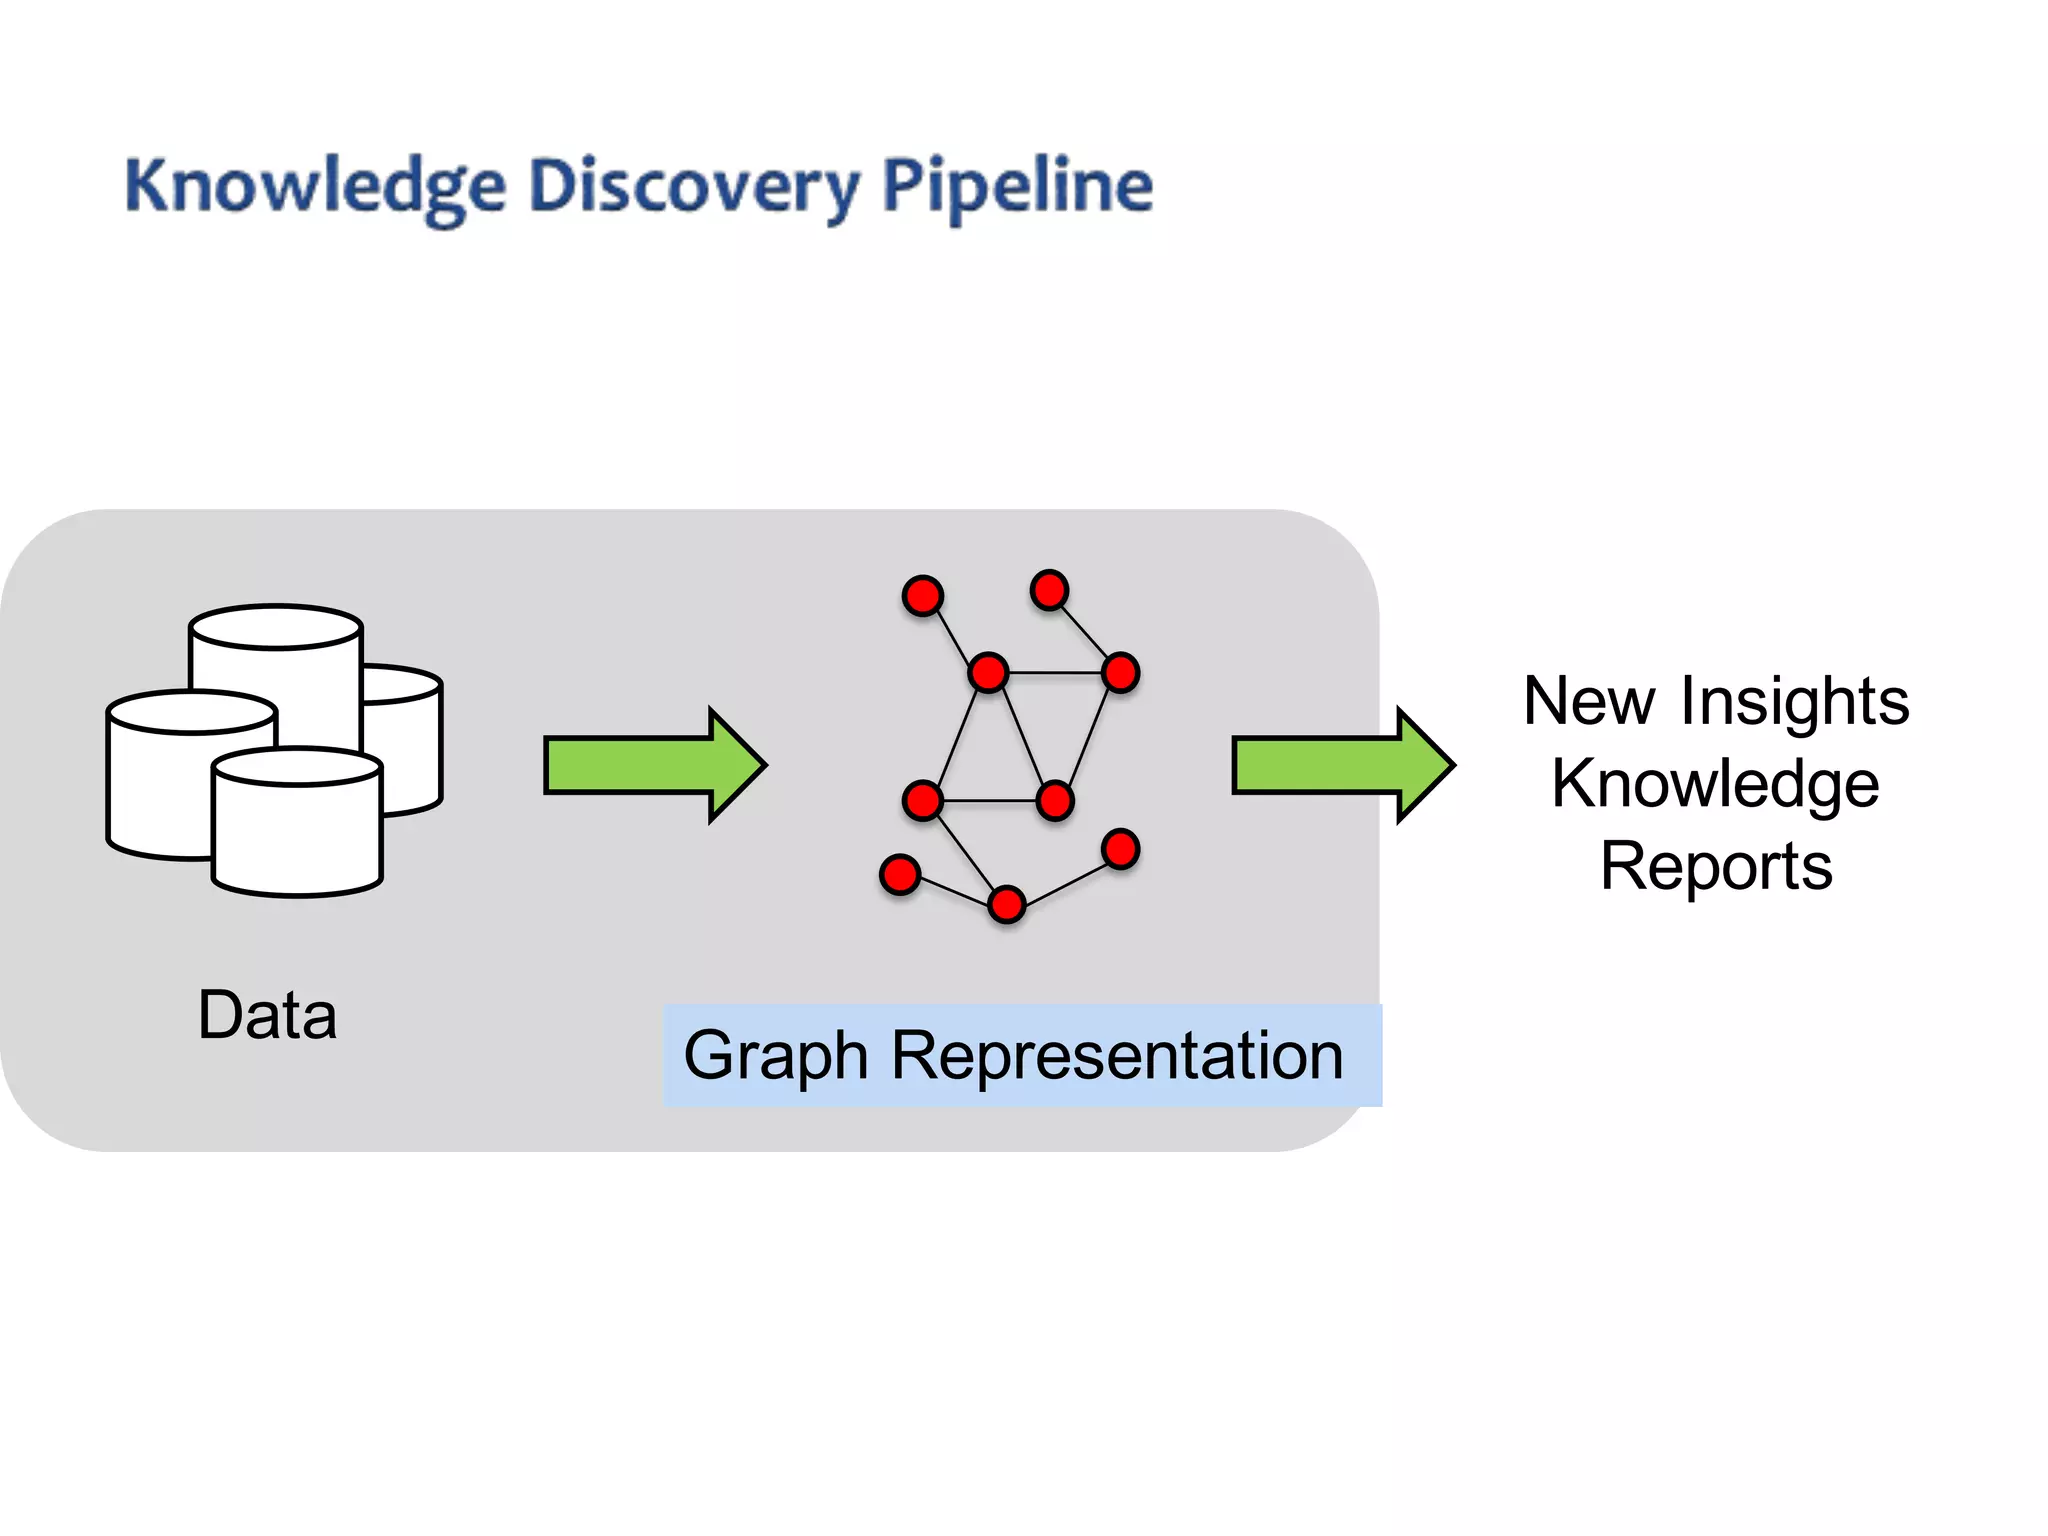
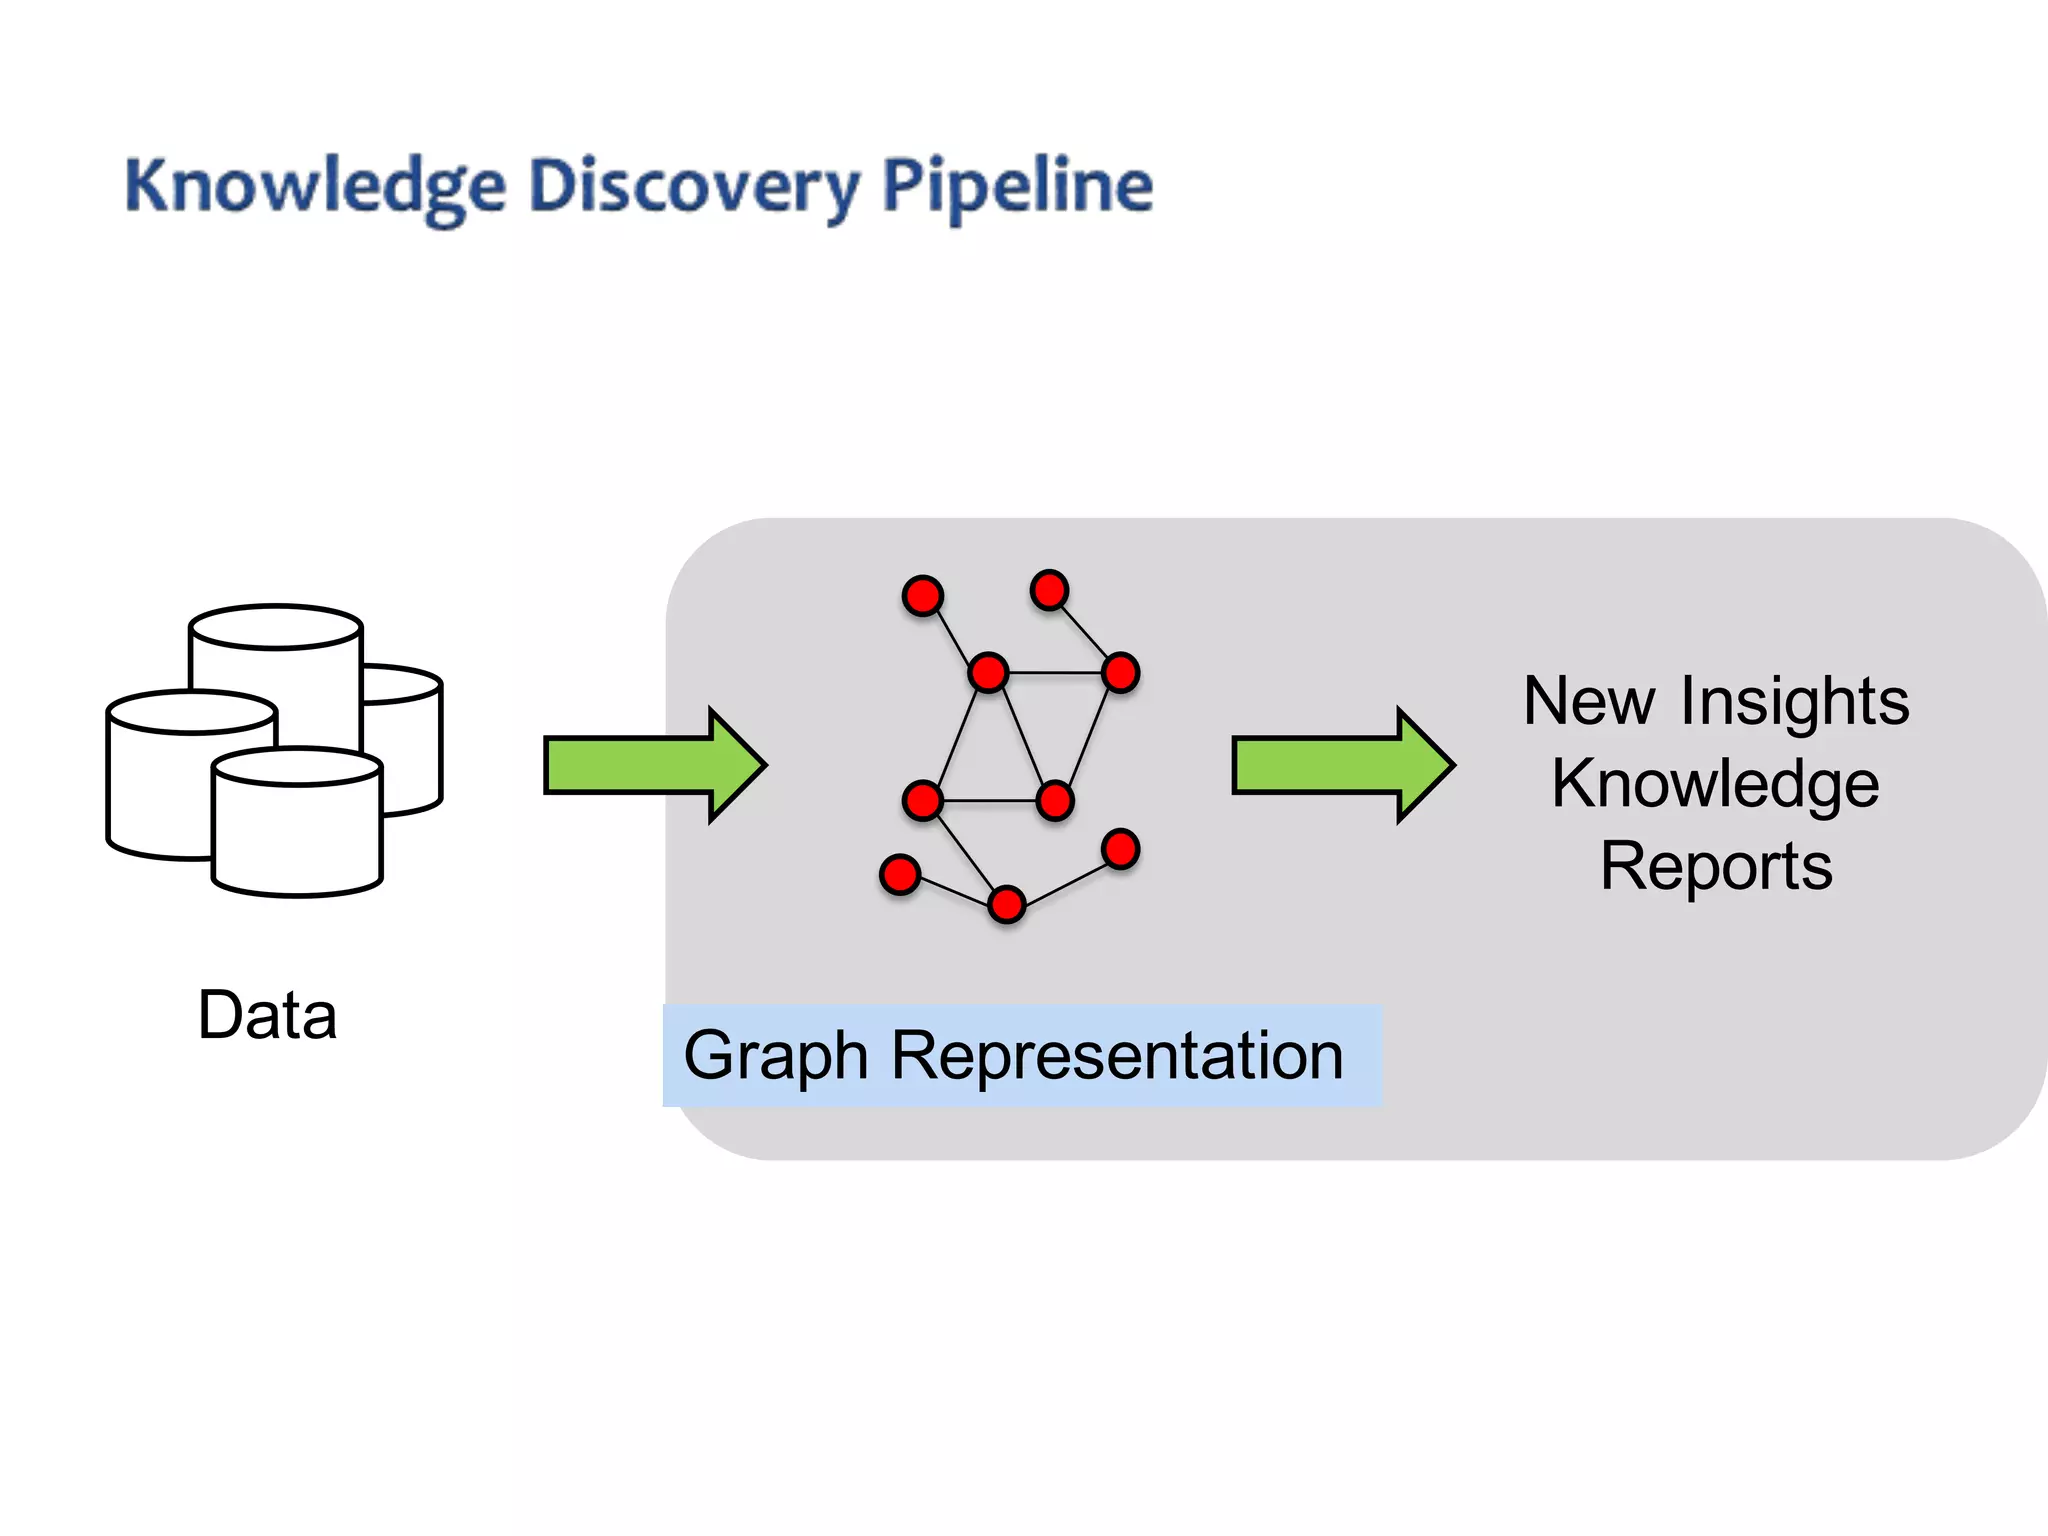
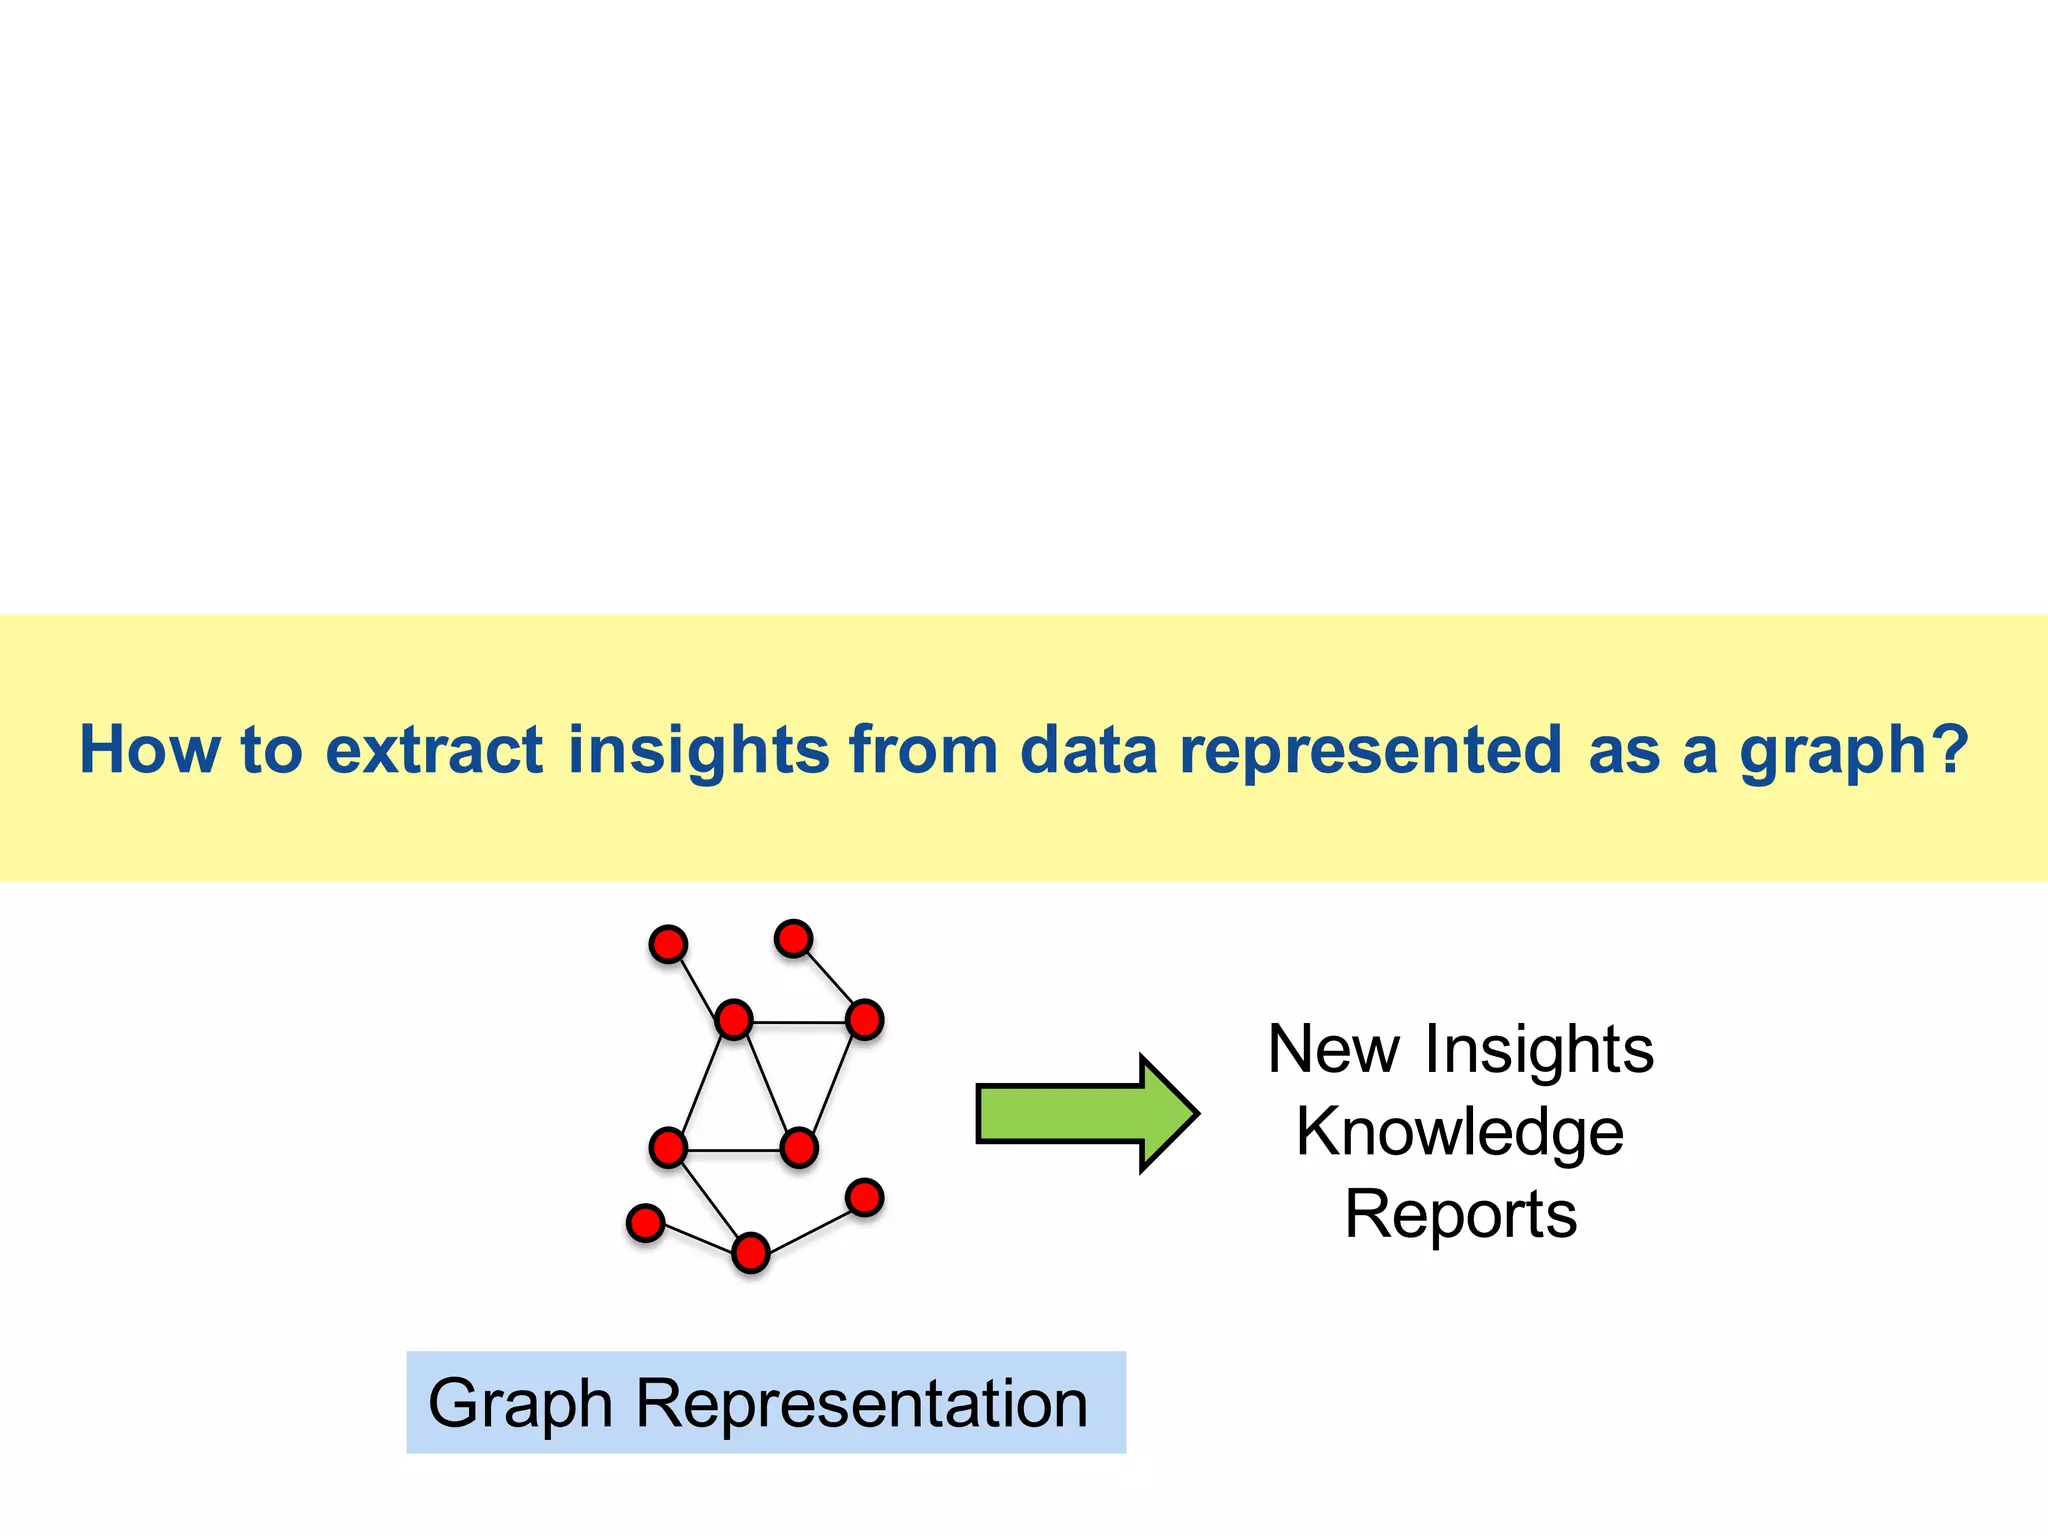
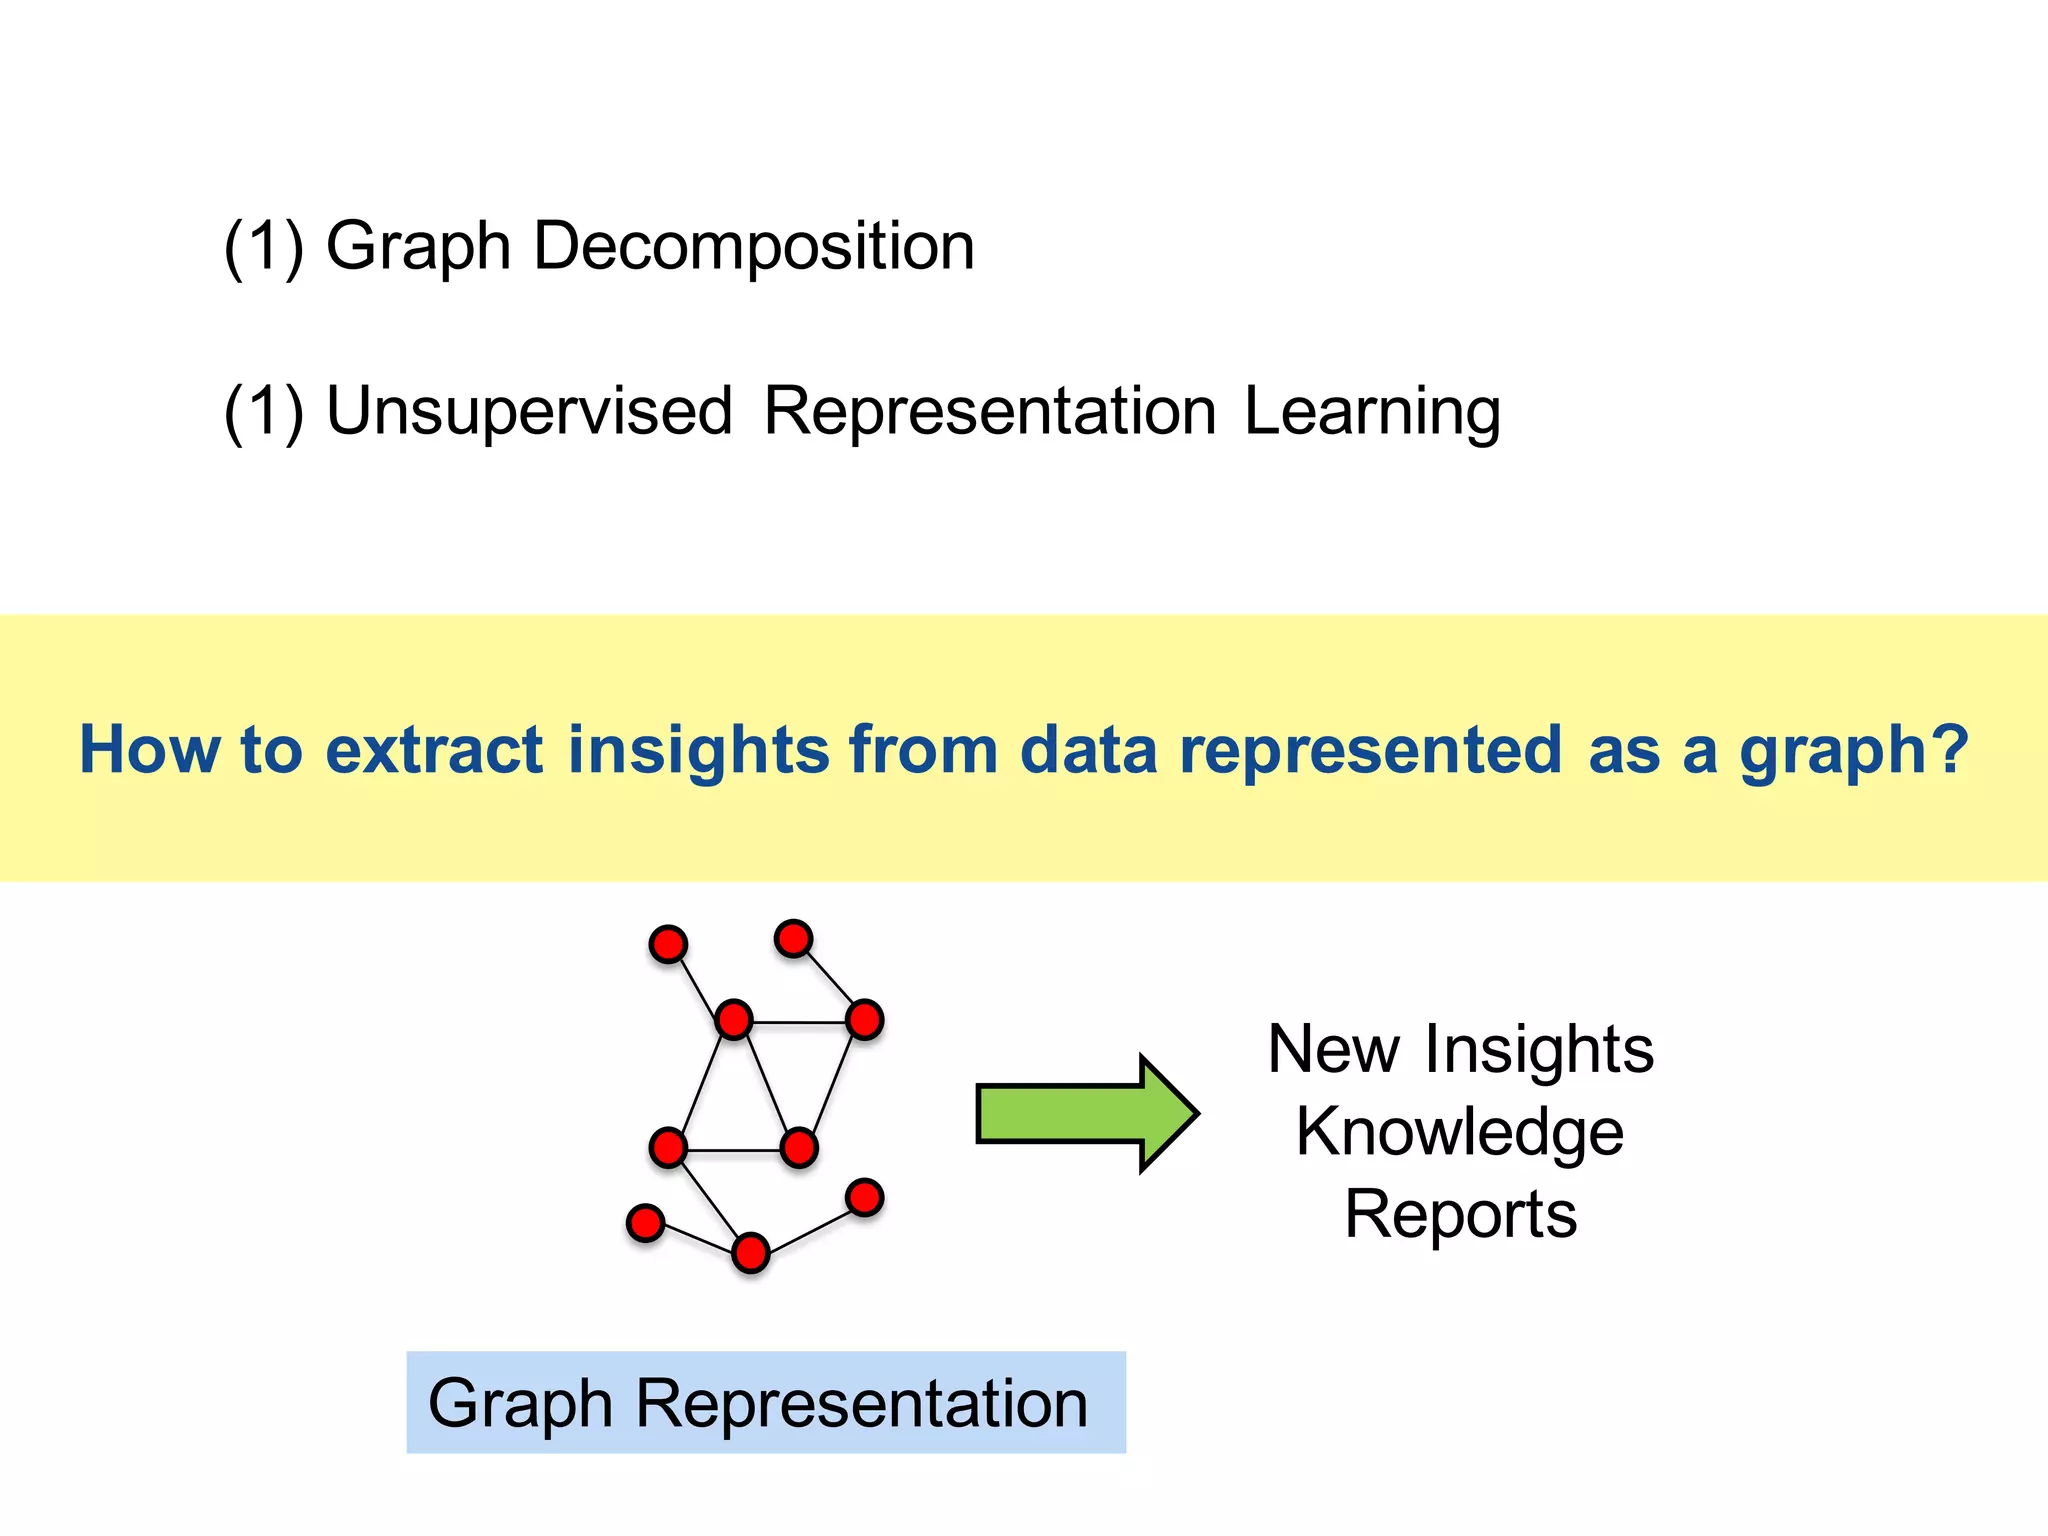
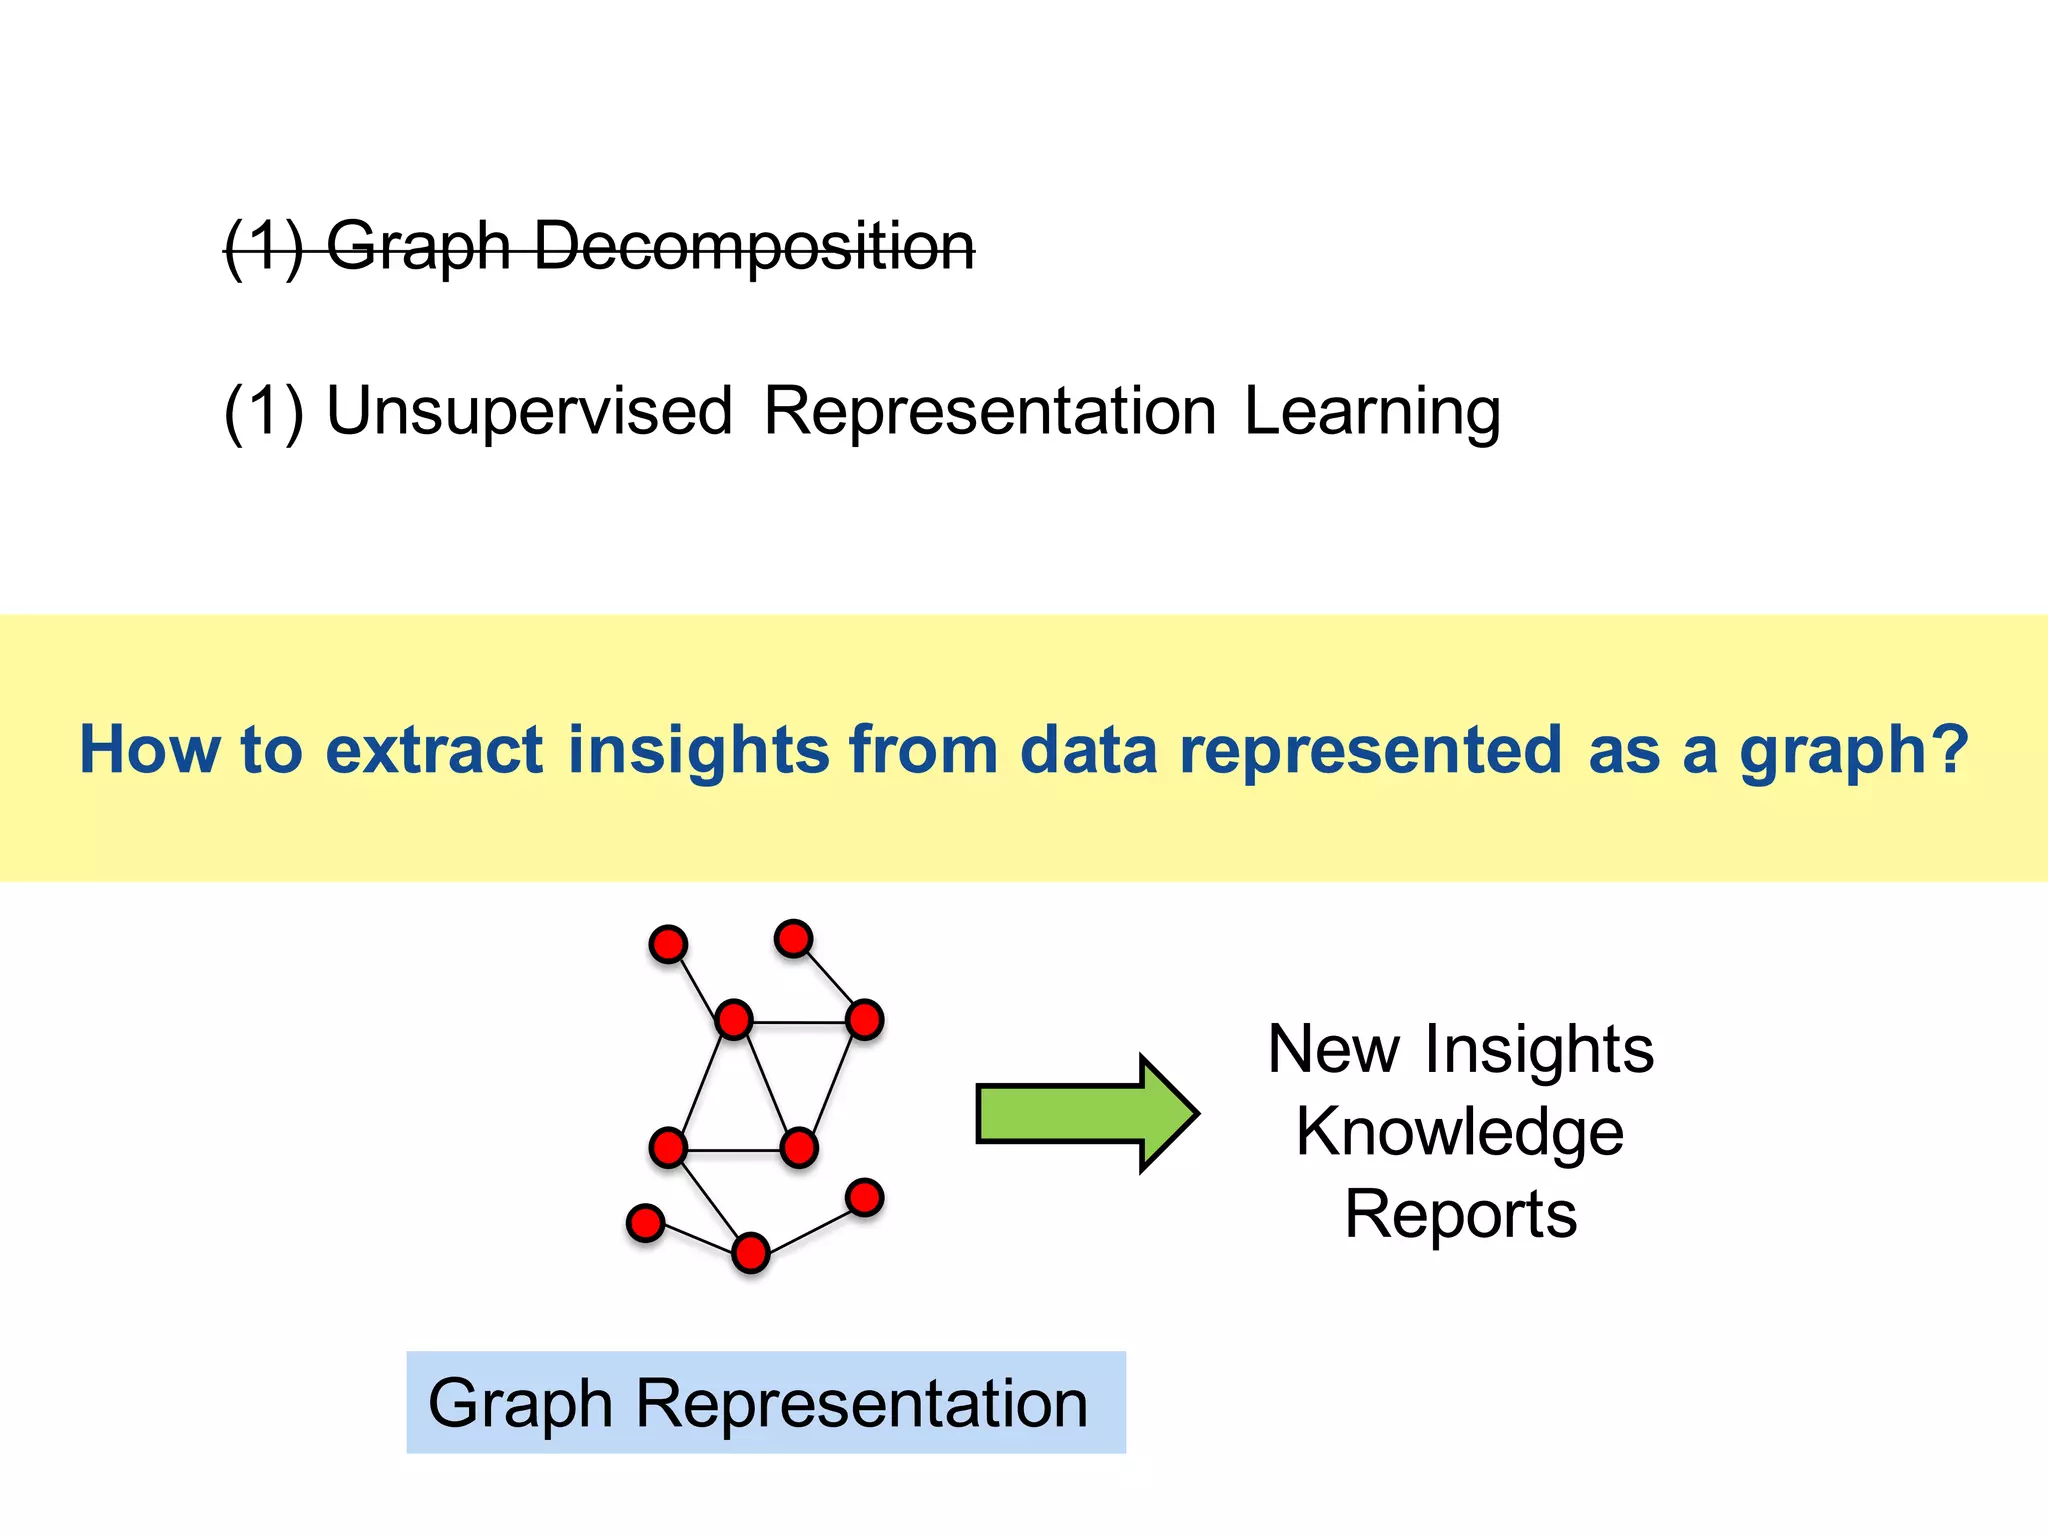
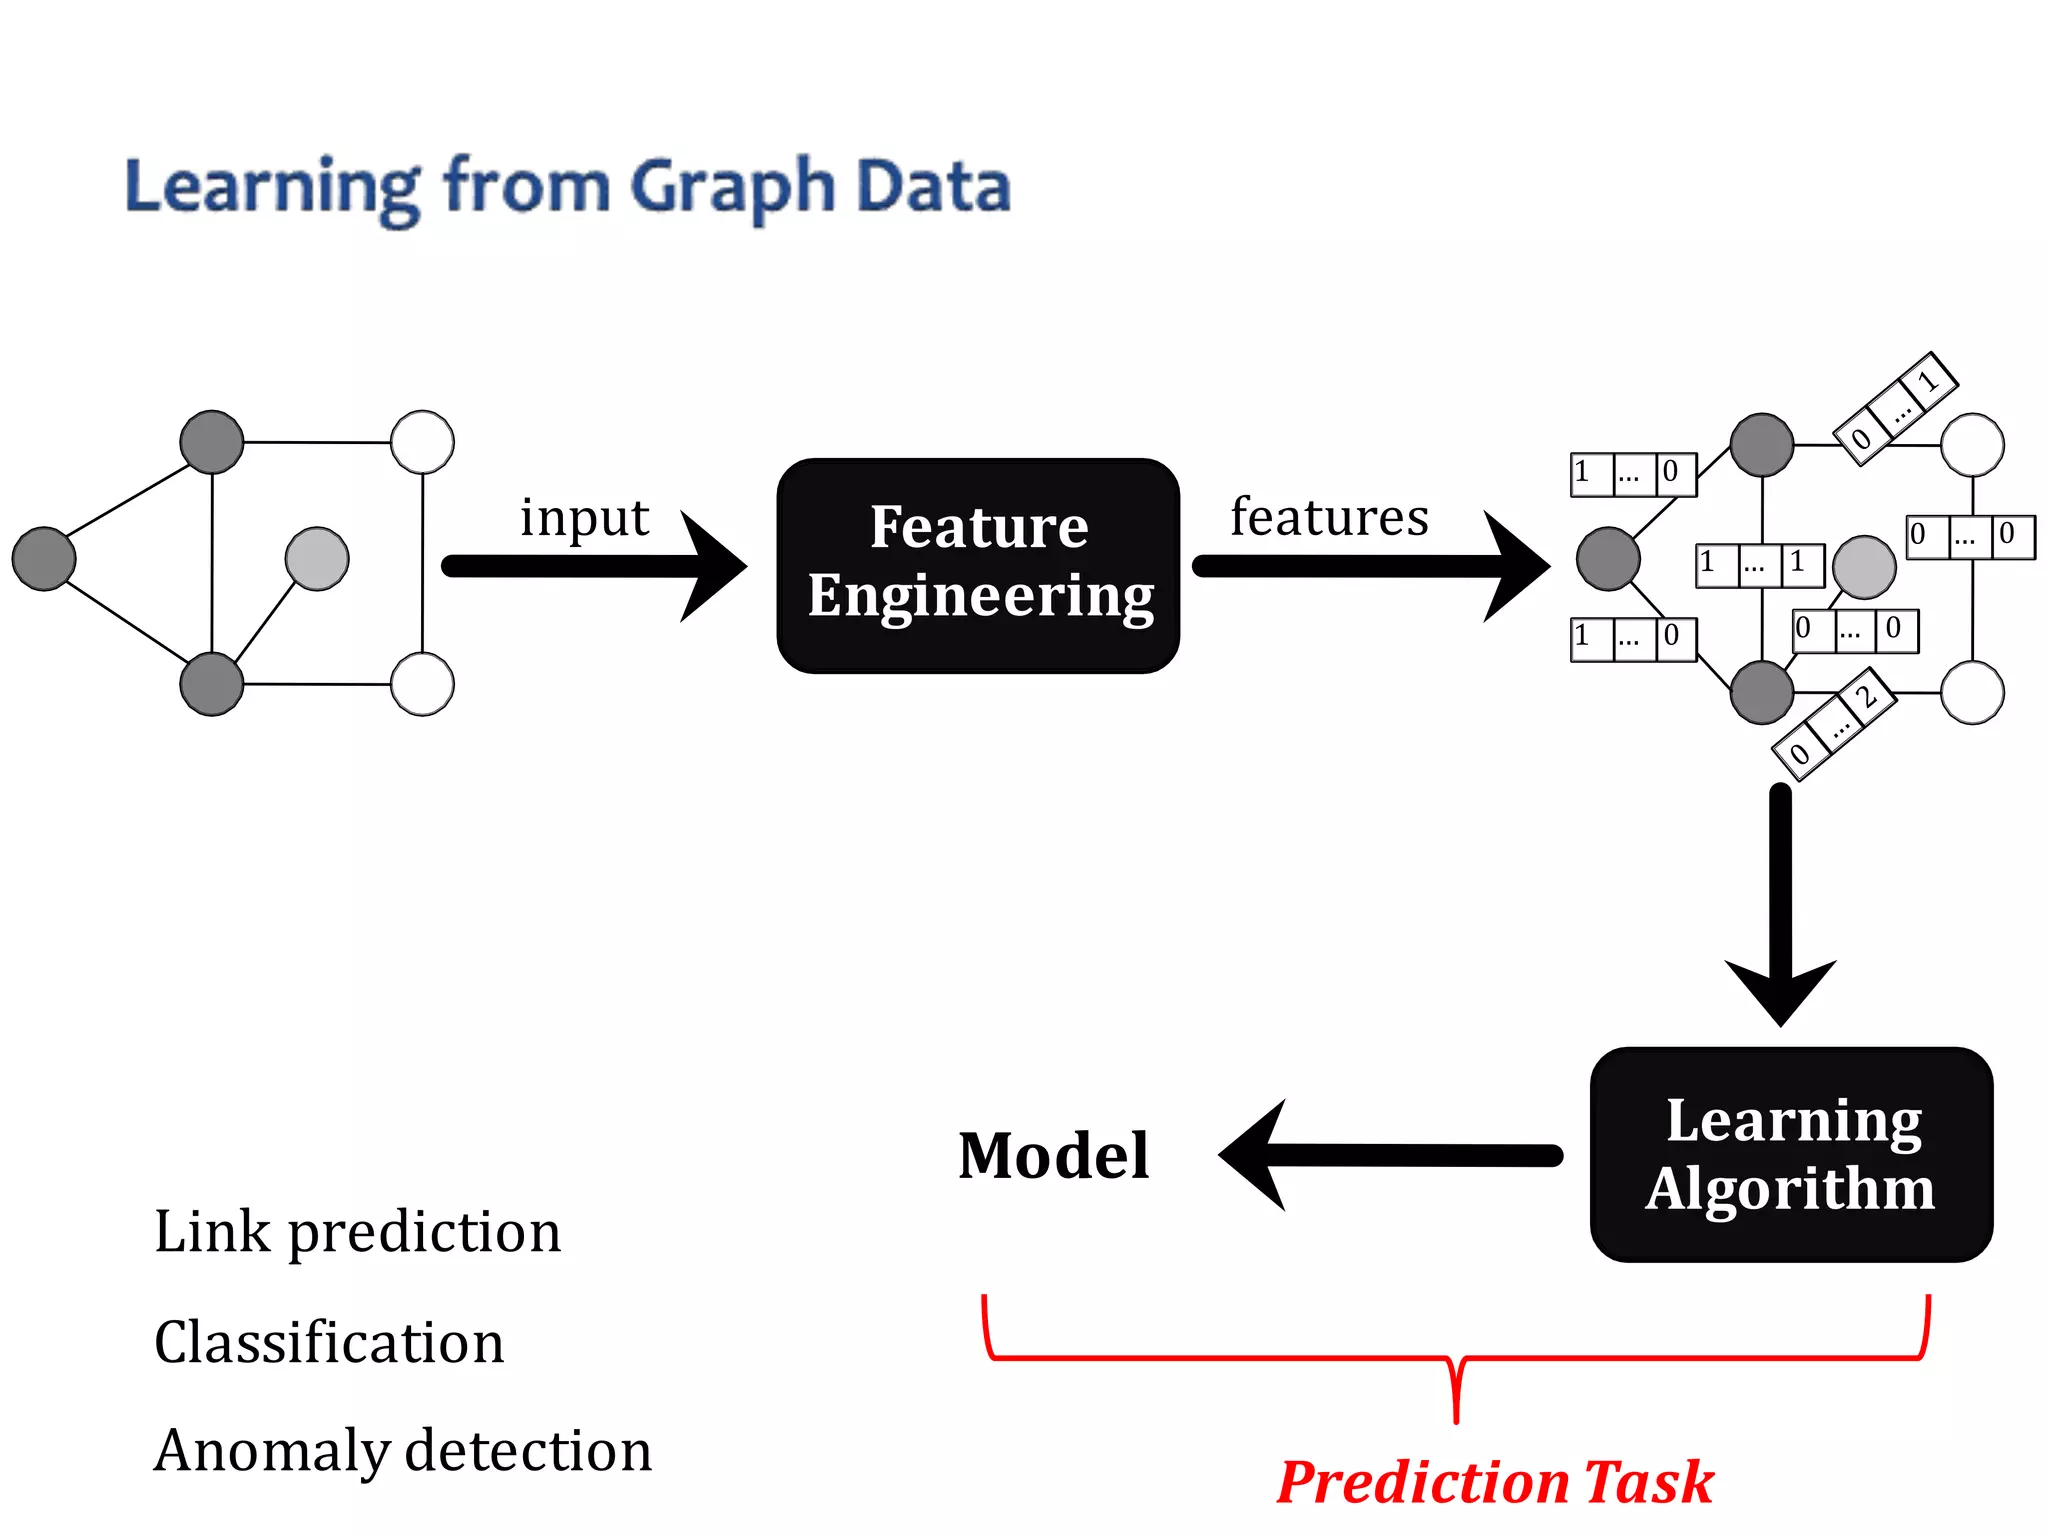
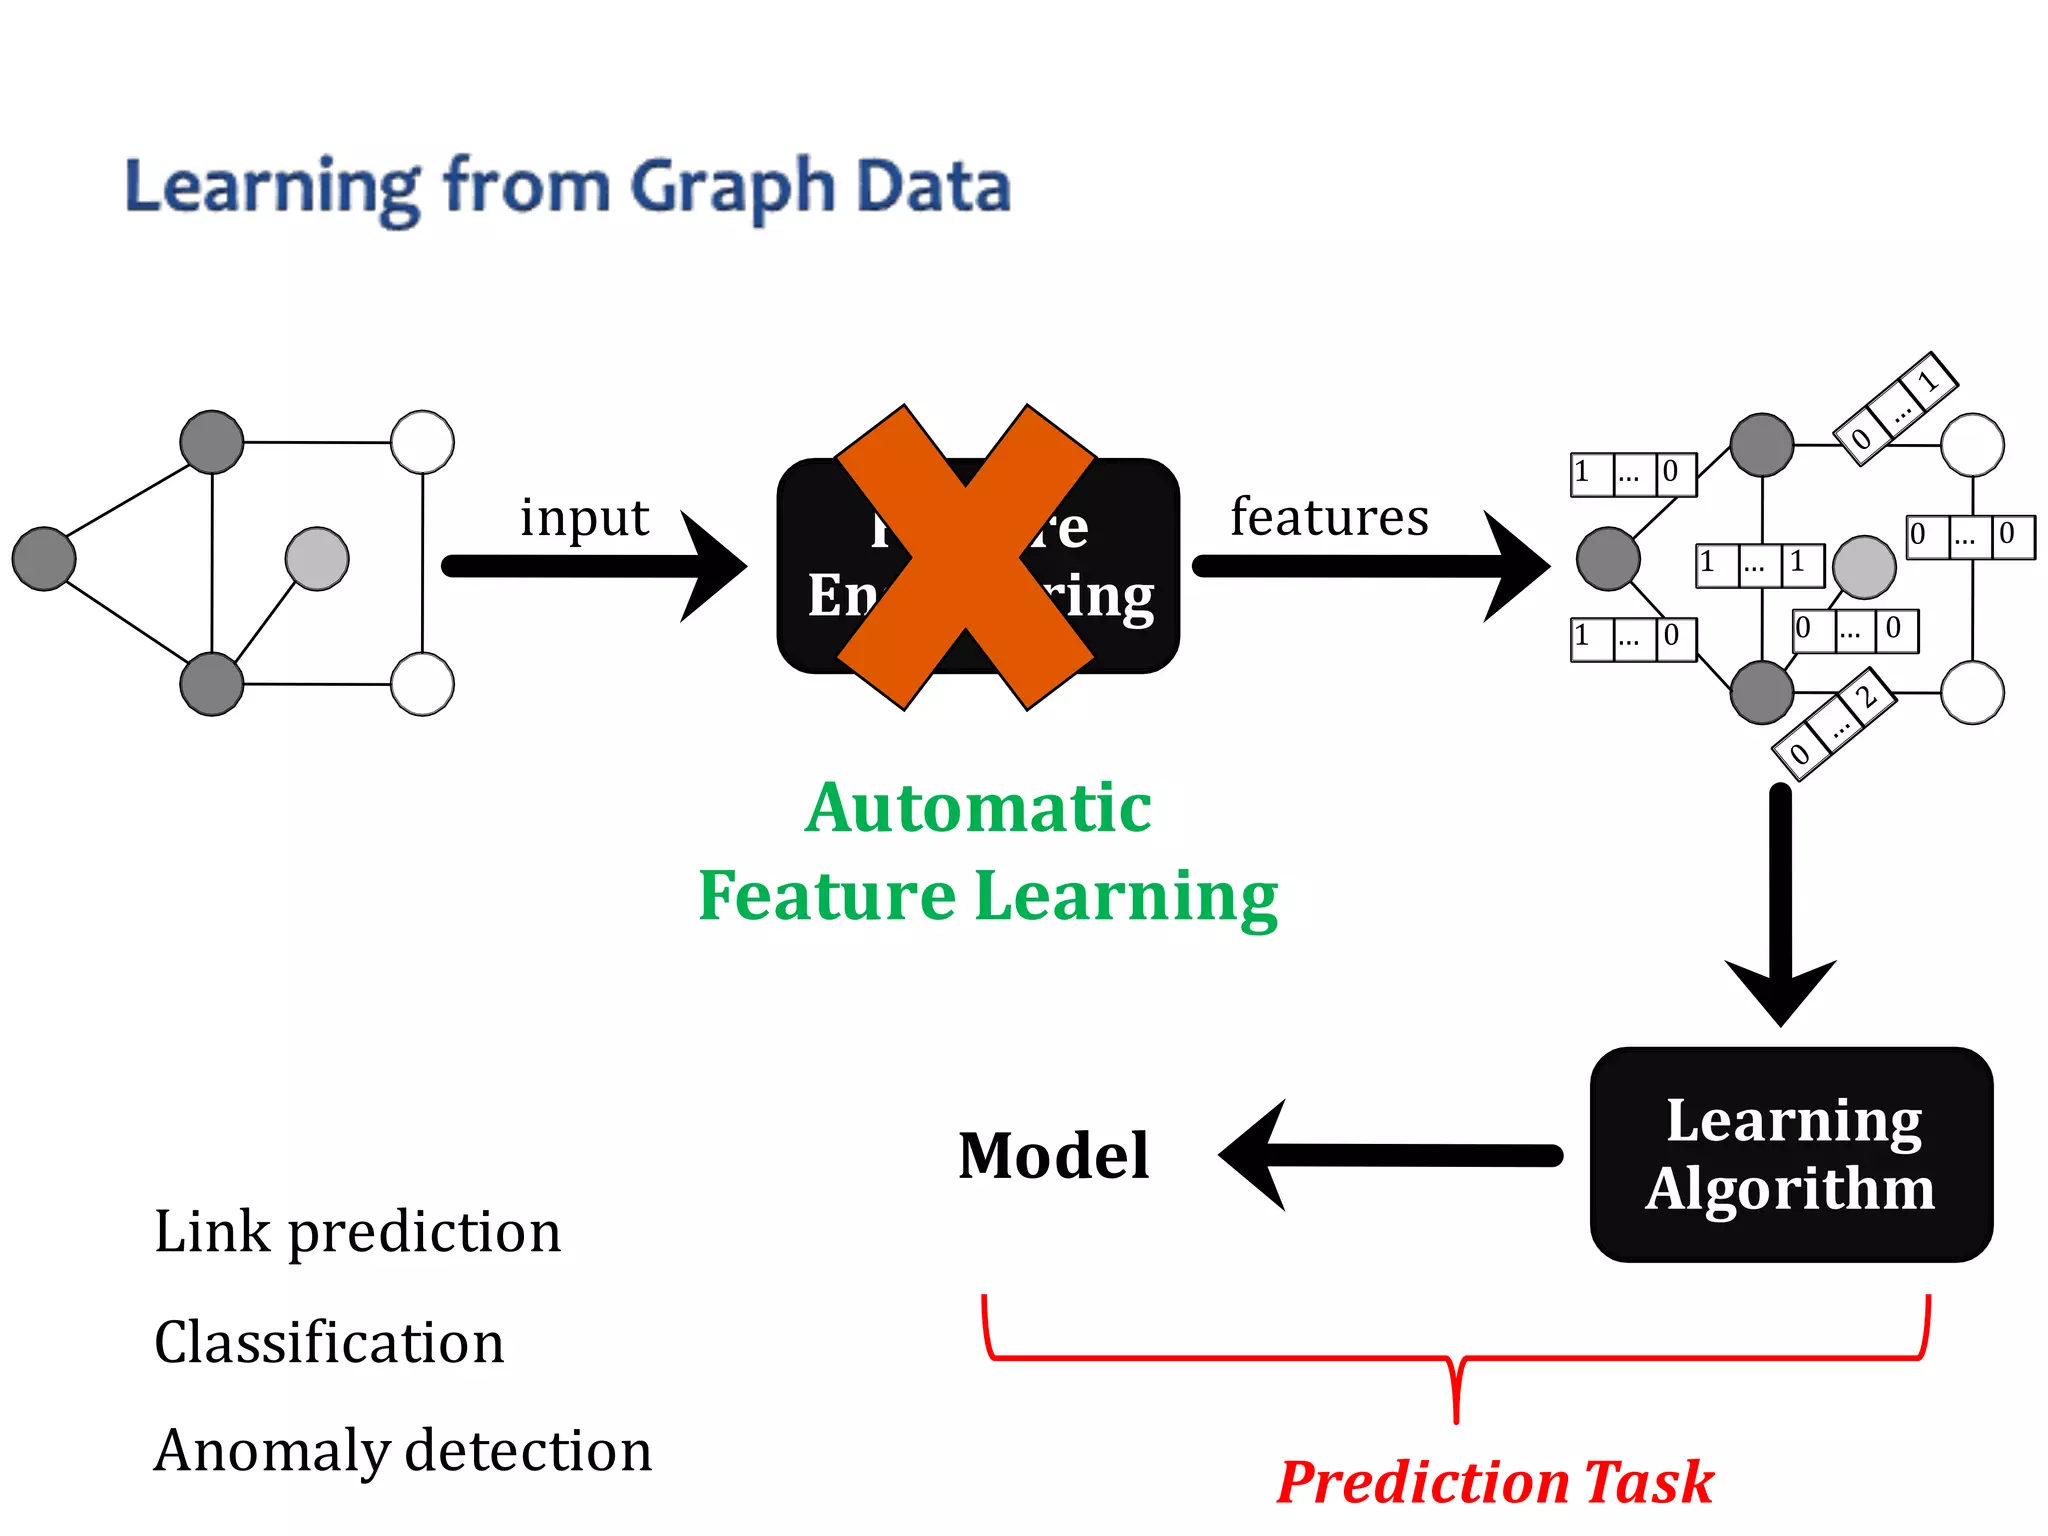
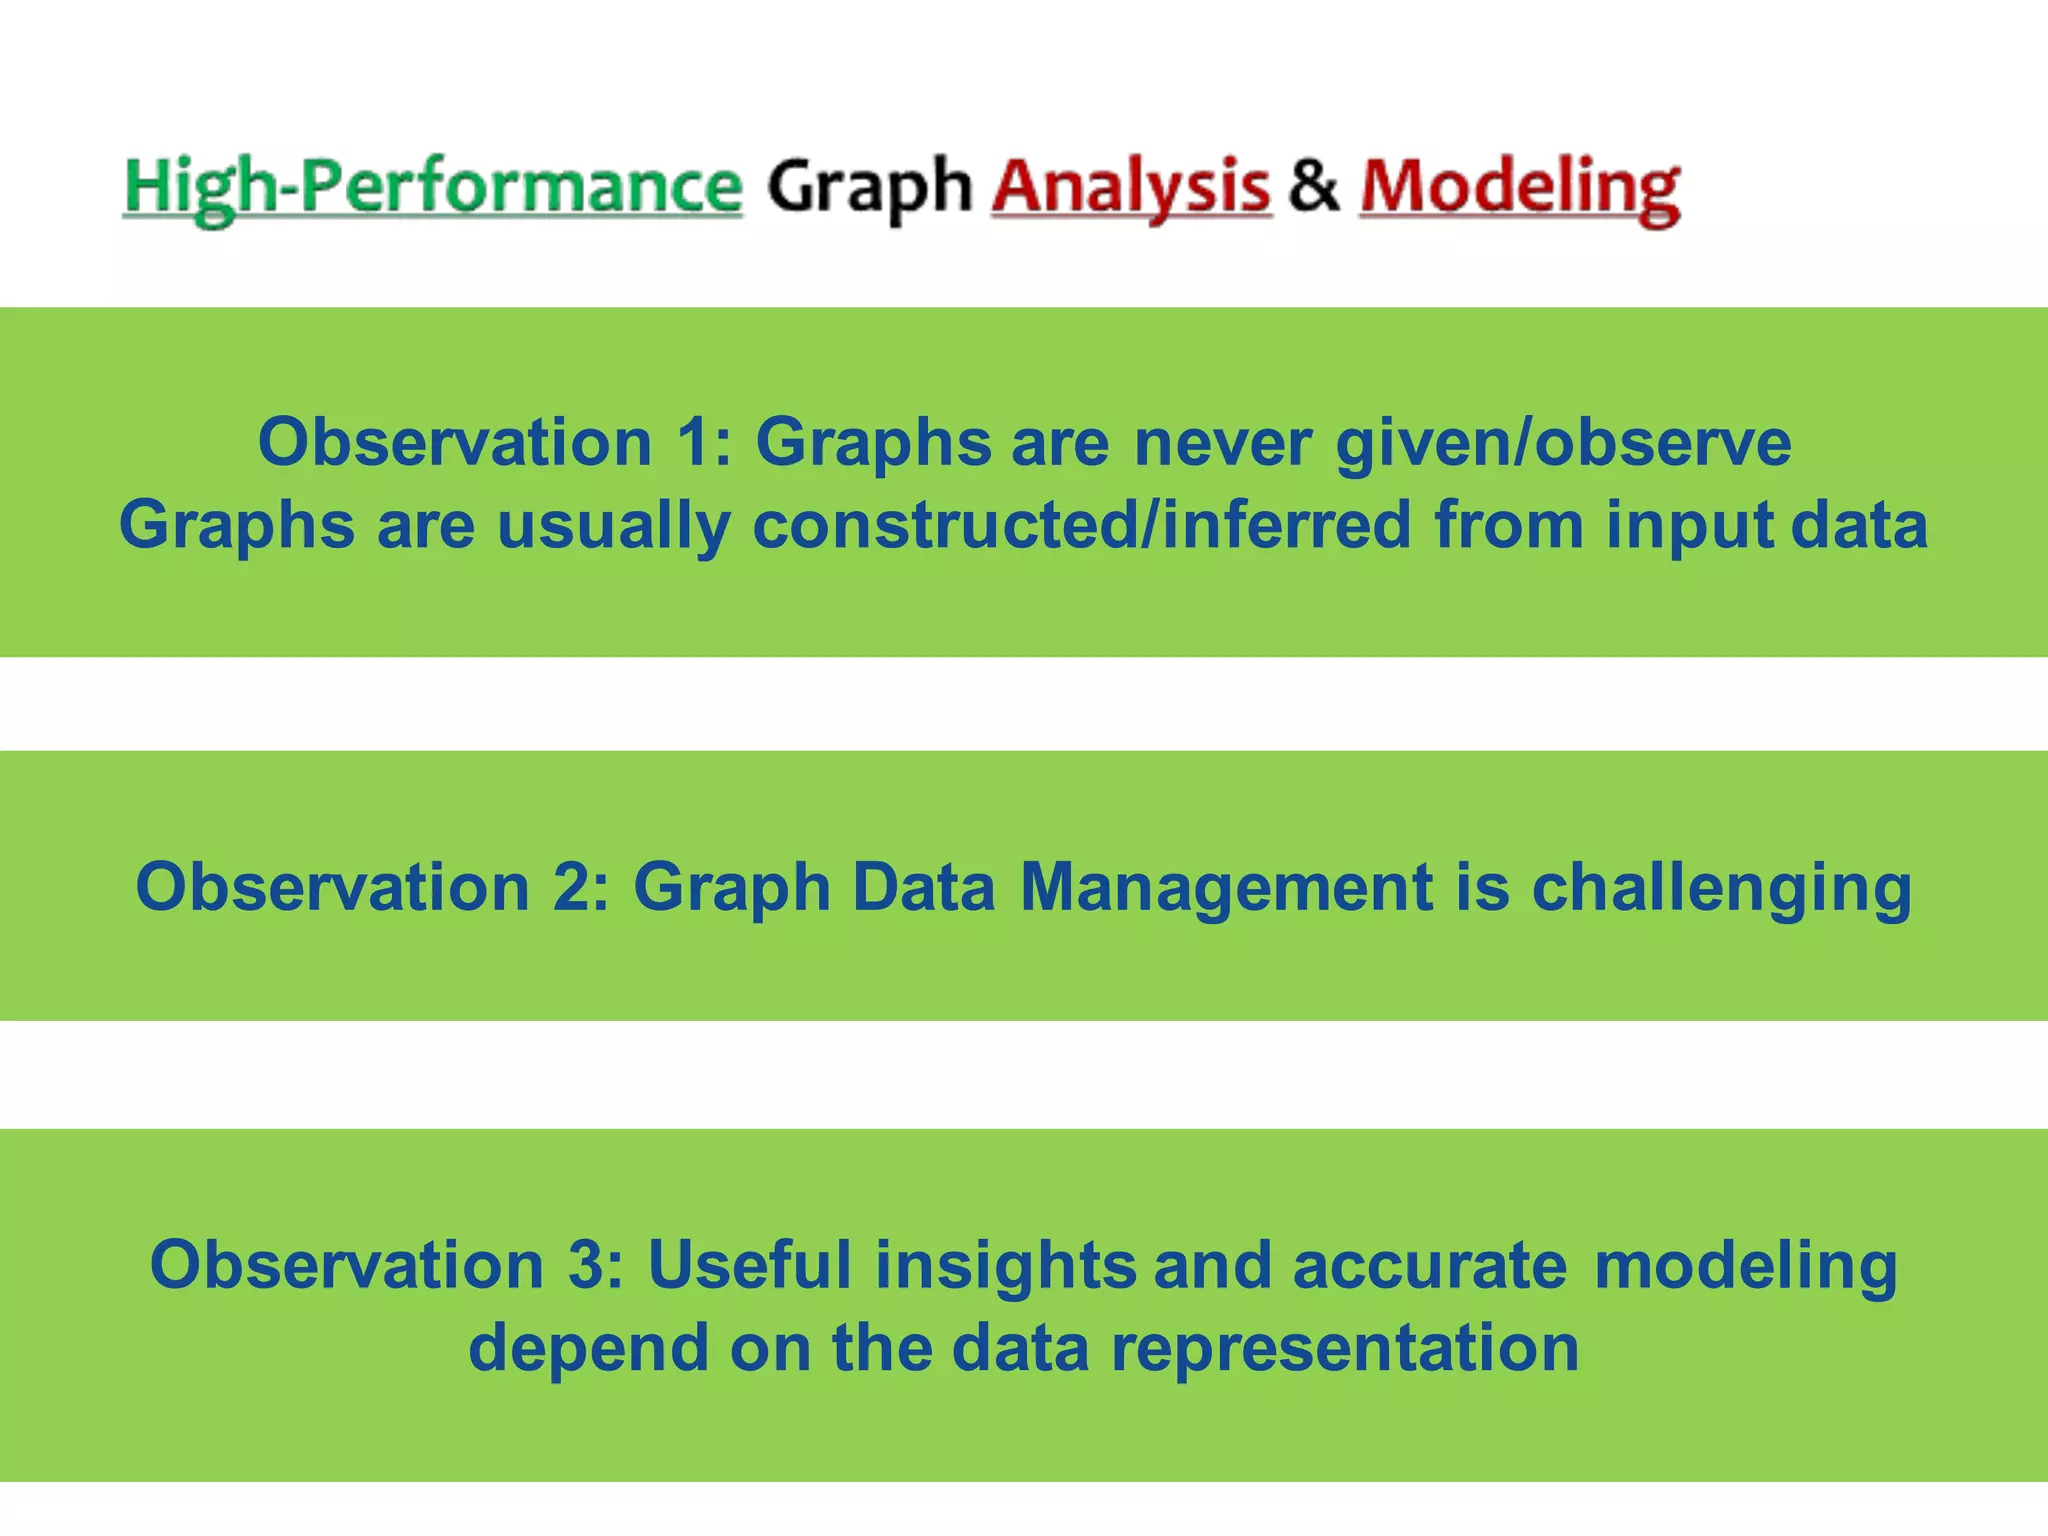
This document discusses knowledge discovery and machine learning on graph data. It makes three main observations: 1) Graphs are typically constructed from input data rather than given directly, as relationships must be inferred. 2) Graph data management is challenging due to issues like large size, dynamic nature, heterogeneity and attribution. 3) Useful insights and accurate modeling depend on the representation of the data as a graph, such as through decomposition, feature learning or other techniques.


![[DSC Europe 25] Behzad Hosseini - AI Agents in the Wild: Deploying Models tha...](https://cdn.slidesharecdn.com/ss_thumbnails/3qtejajvsjqrzwfept2c-10-251212103250-7f2b1068-thumbnail.jpg?width=640&height=640&fit=bounds)
![[DSC Europe 25] Miodrag Pesovic & Vladislav Radonjic - Federated Data Archite...](https://cdn.slidesharecdn.com/ss_thumbnails/gsbe3y5it5uhndi4e08e-1-251212103249-f1008e0c-thumbnail.jpg?width=640&height=640&fit=bounds)

![[DSC Europe 25] Debmalya Biswas - Agentification: the art of transforming man...](https://cdn.slidesharecdn.com/ss_thumbnails/r5azlggvtqiaiiusrqdr-4-251212103249-5a12c89b-thumbnail.jpg?width=640&height=640&fit=bounds)
![[DSC Europe 25] Branko Urosevic -Rethinking Financial Talent: Integrating Cod...](https://cdn.slidesharecdn.com/ss_thumbnails/8jjrus8ttko6qj64f58f-3-251212103250-642c6374-thumbnail.jpg?width=640&height=640&fit=bounds)

![[DSC Europe 25] Bassam Maharmeh - Artificial Intelligence: Opportunities and ...](https://cdn.slidesharecdn.com/ss_thumbnails/thhfmr2fqpawzj7hsjpg-5-251211083048-2c23204f-thumbnail.jpg?width=640&height=640&fit=bounds)


![[DSC Europe 25] Kaja Kandare - LLM as a judge.pptx](https://cdn.slidesharecdn.com/ss_thumbnails/arxyccaxsdsd1ba99wjw-7-251212104007-2b4e3f64-thumbnail.jpg?width=640&height=640&fit=bounds)

![[DSC Europe 25] Danica Soc - The Science Behind Marketing: Experimentation me...](https://cdn.slidesharecdn.com/ss_thumbnails/c0nofsggs9gw5ucmallr-3-251216103155-56bd64d1-thumbnail.jpg?width=640&height=640&fit=bounds)


