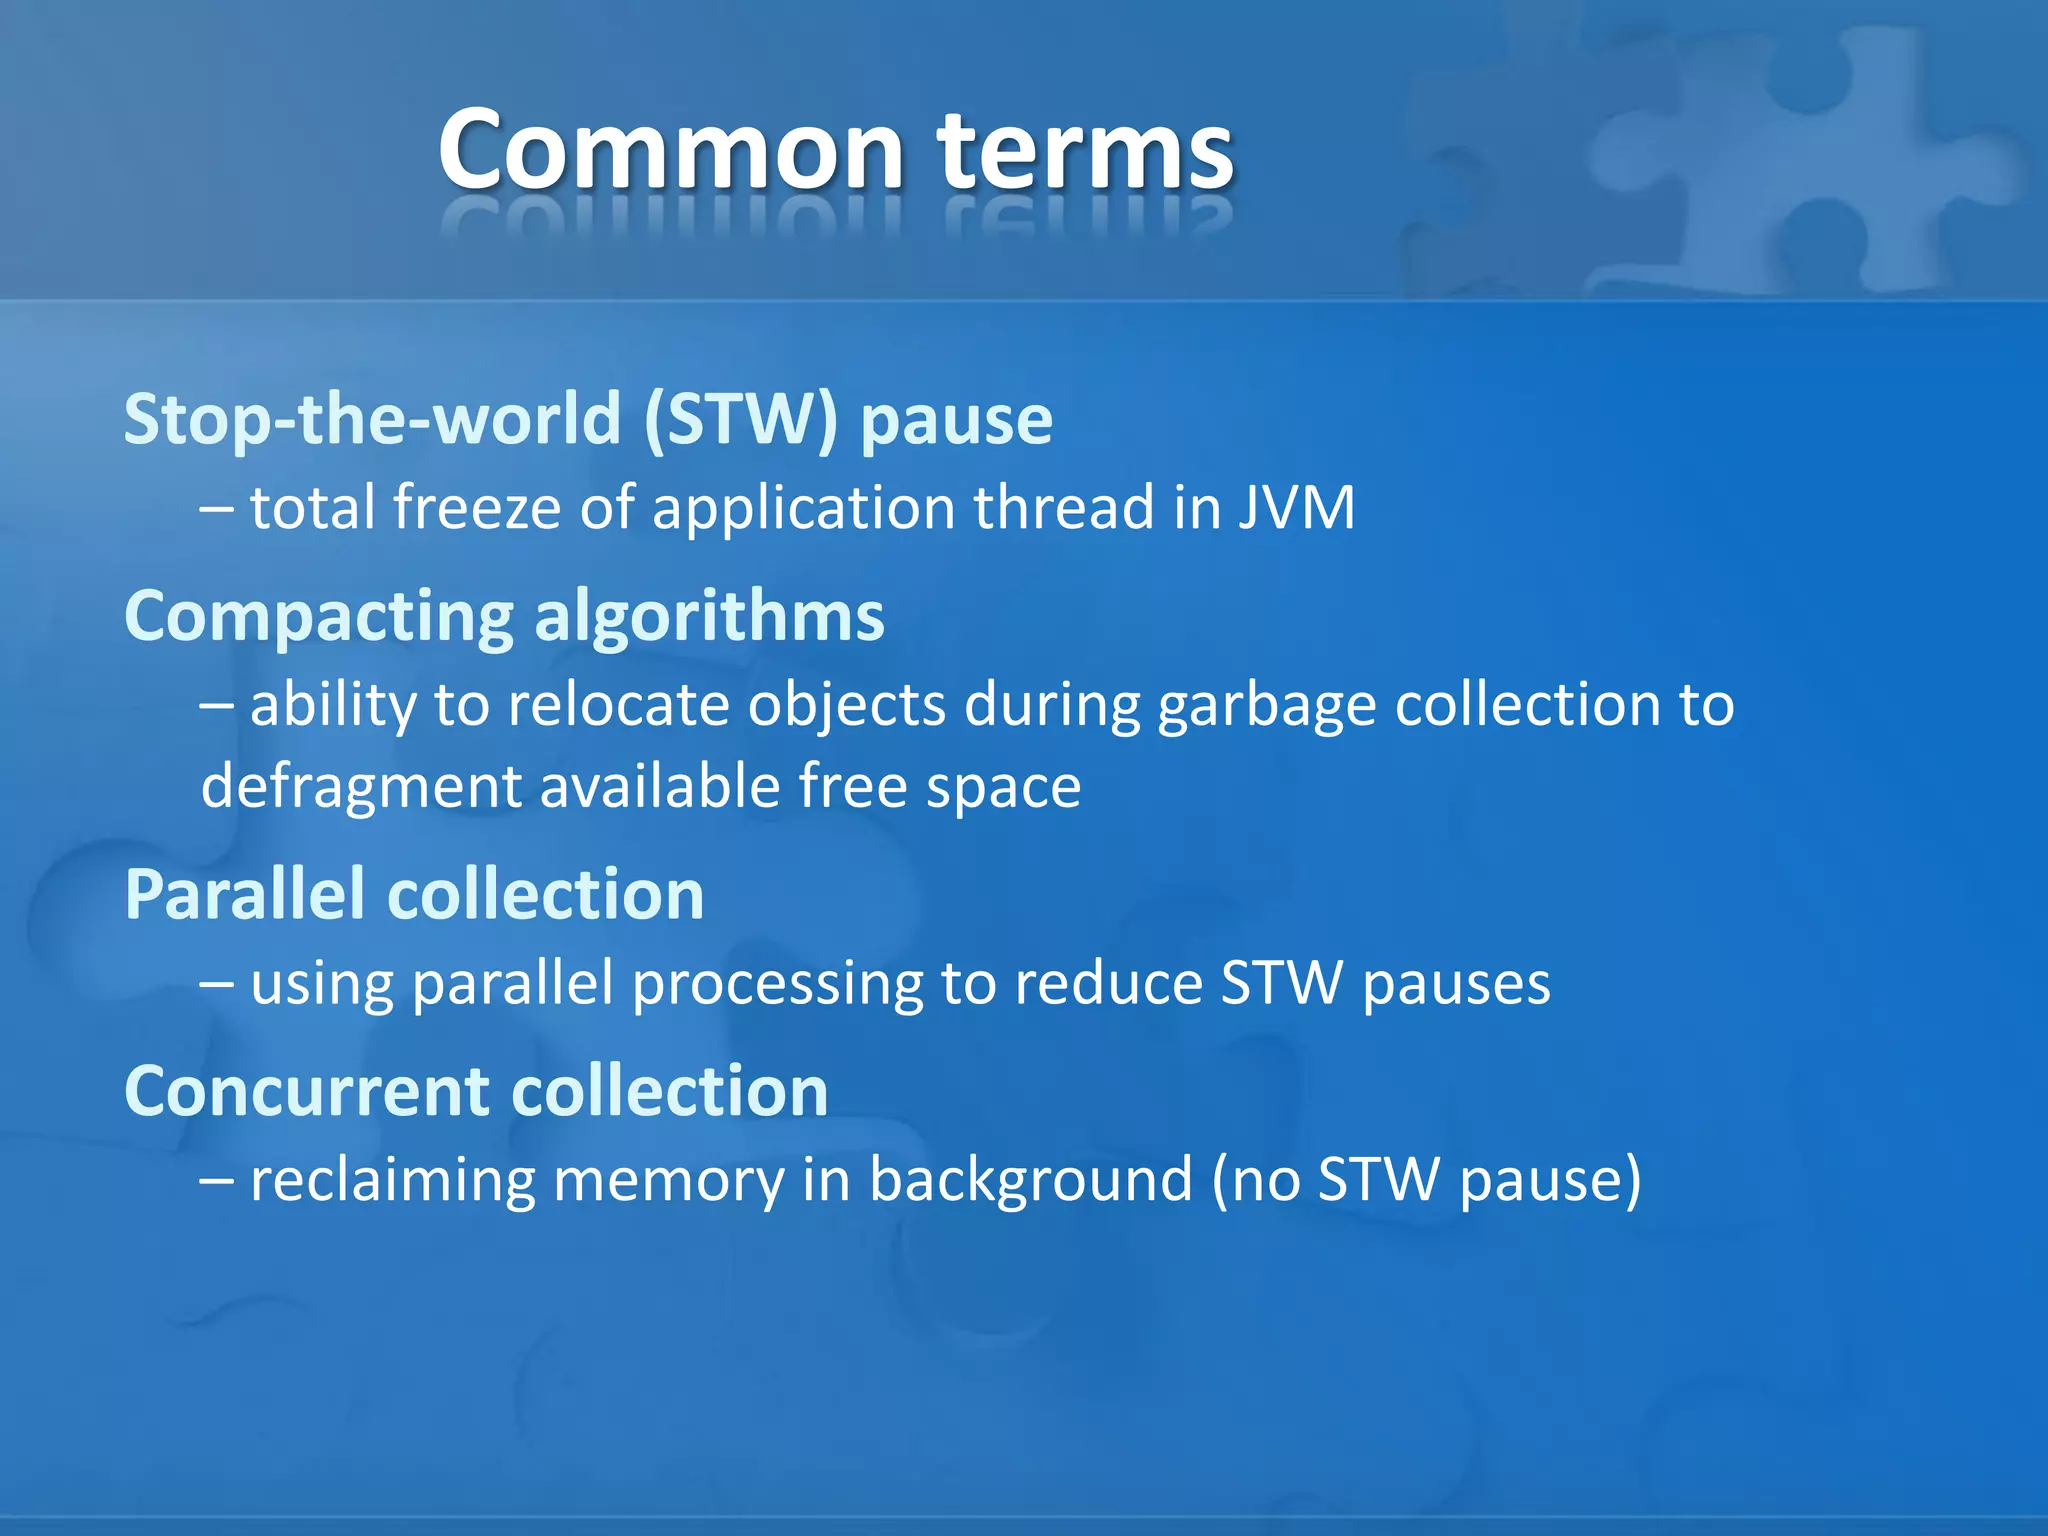
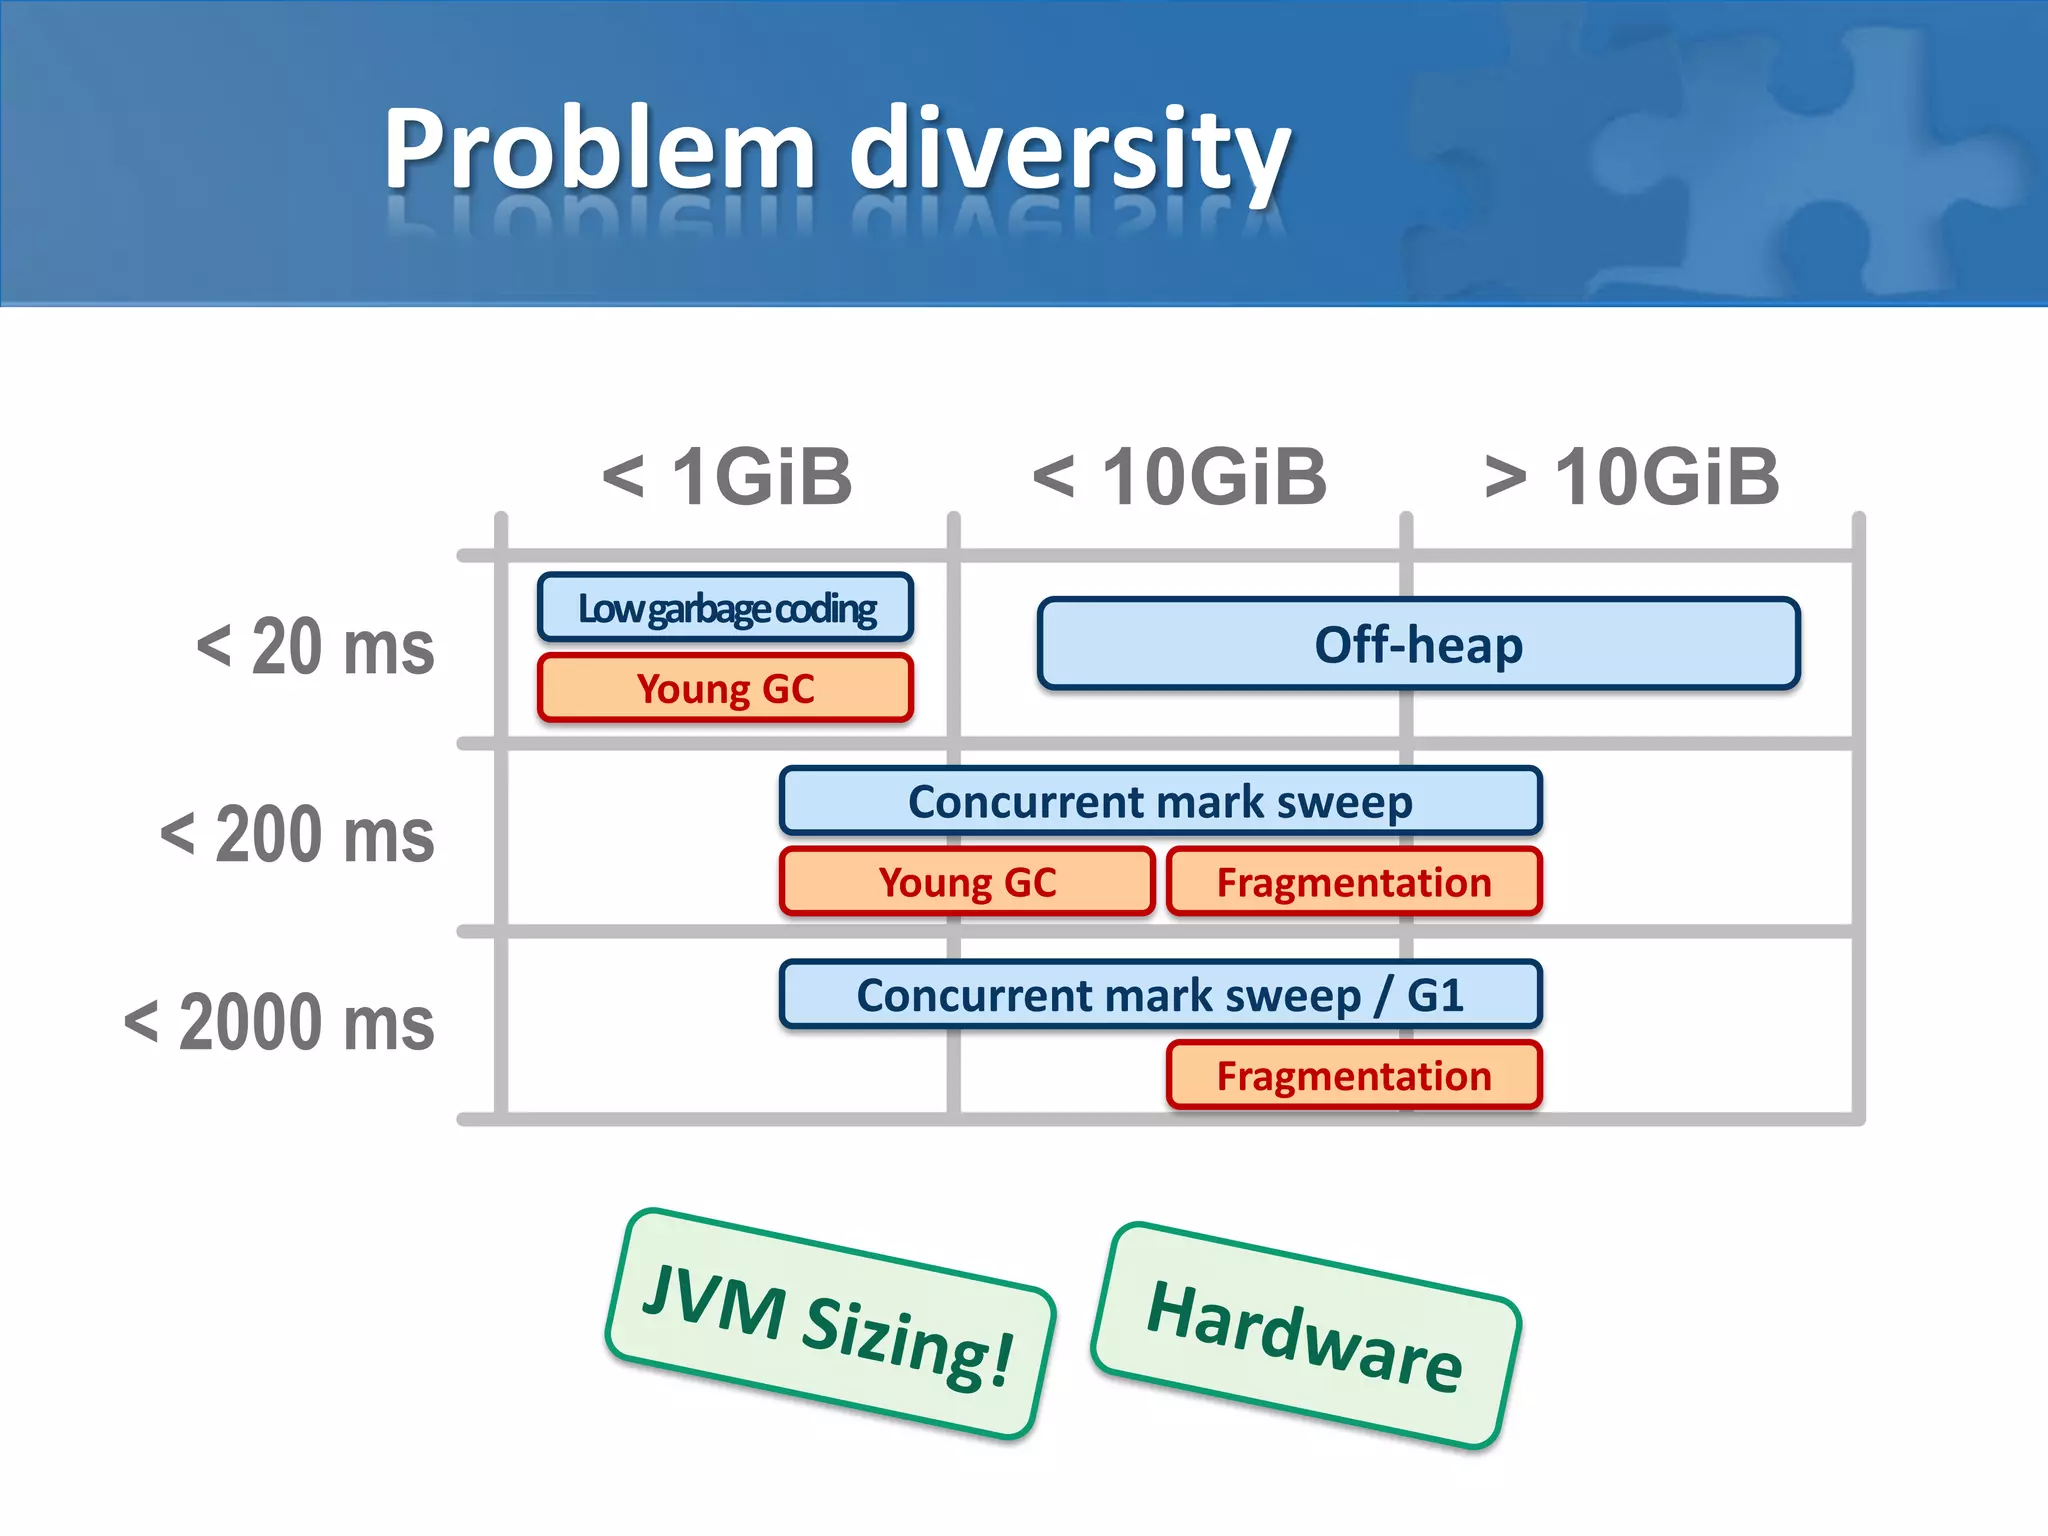
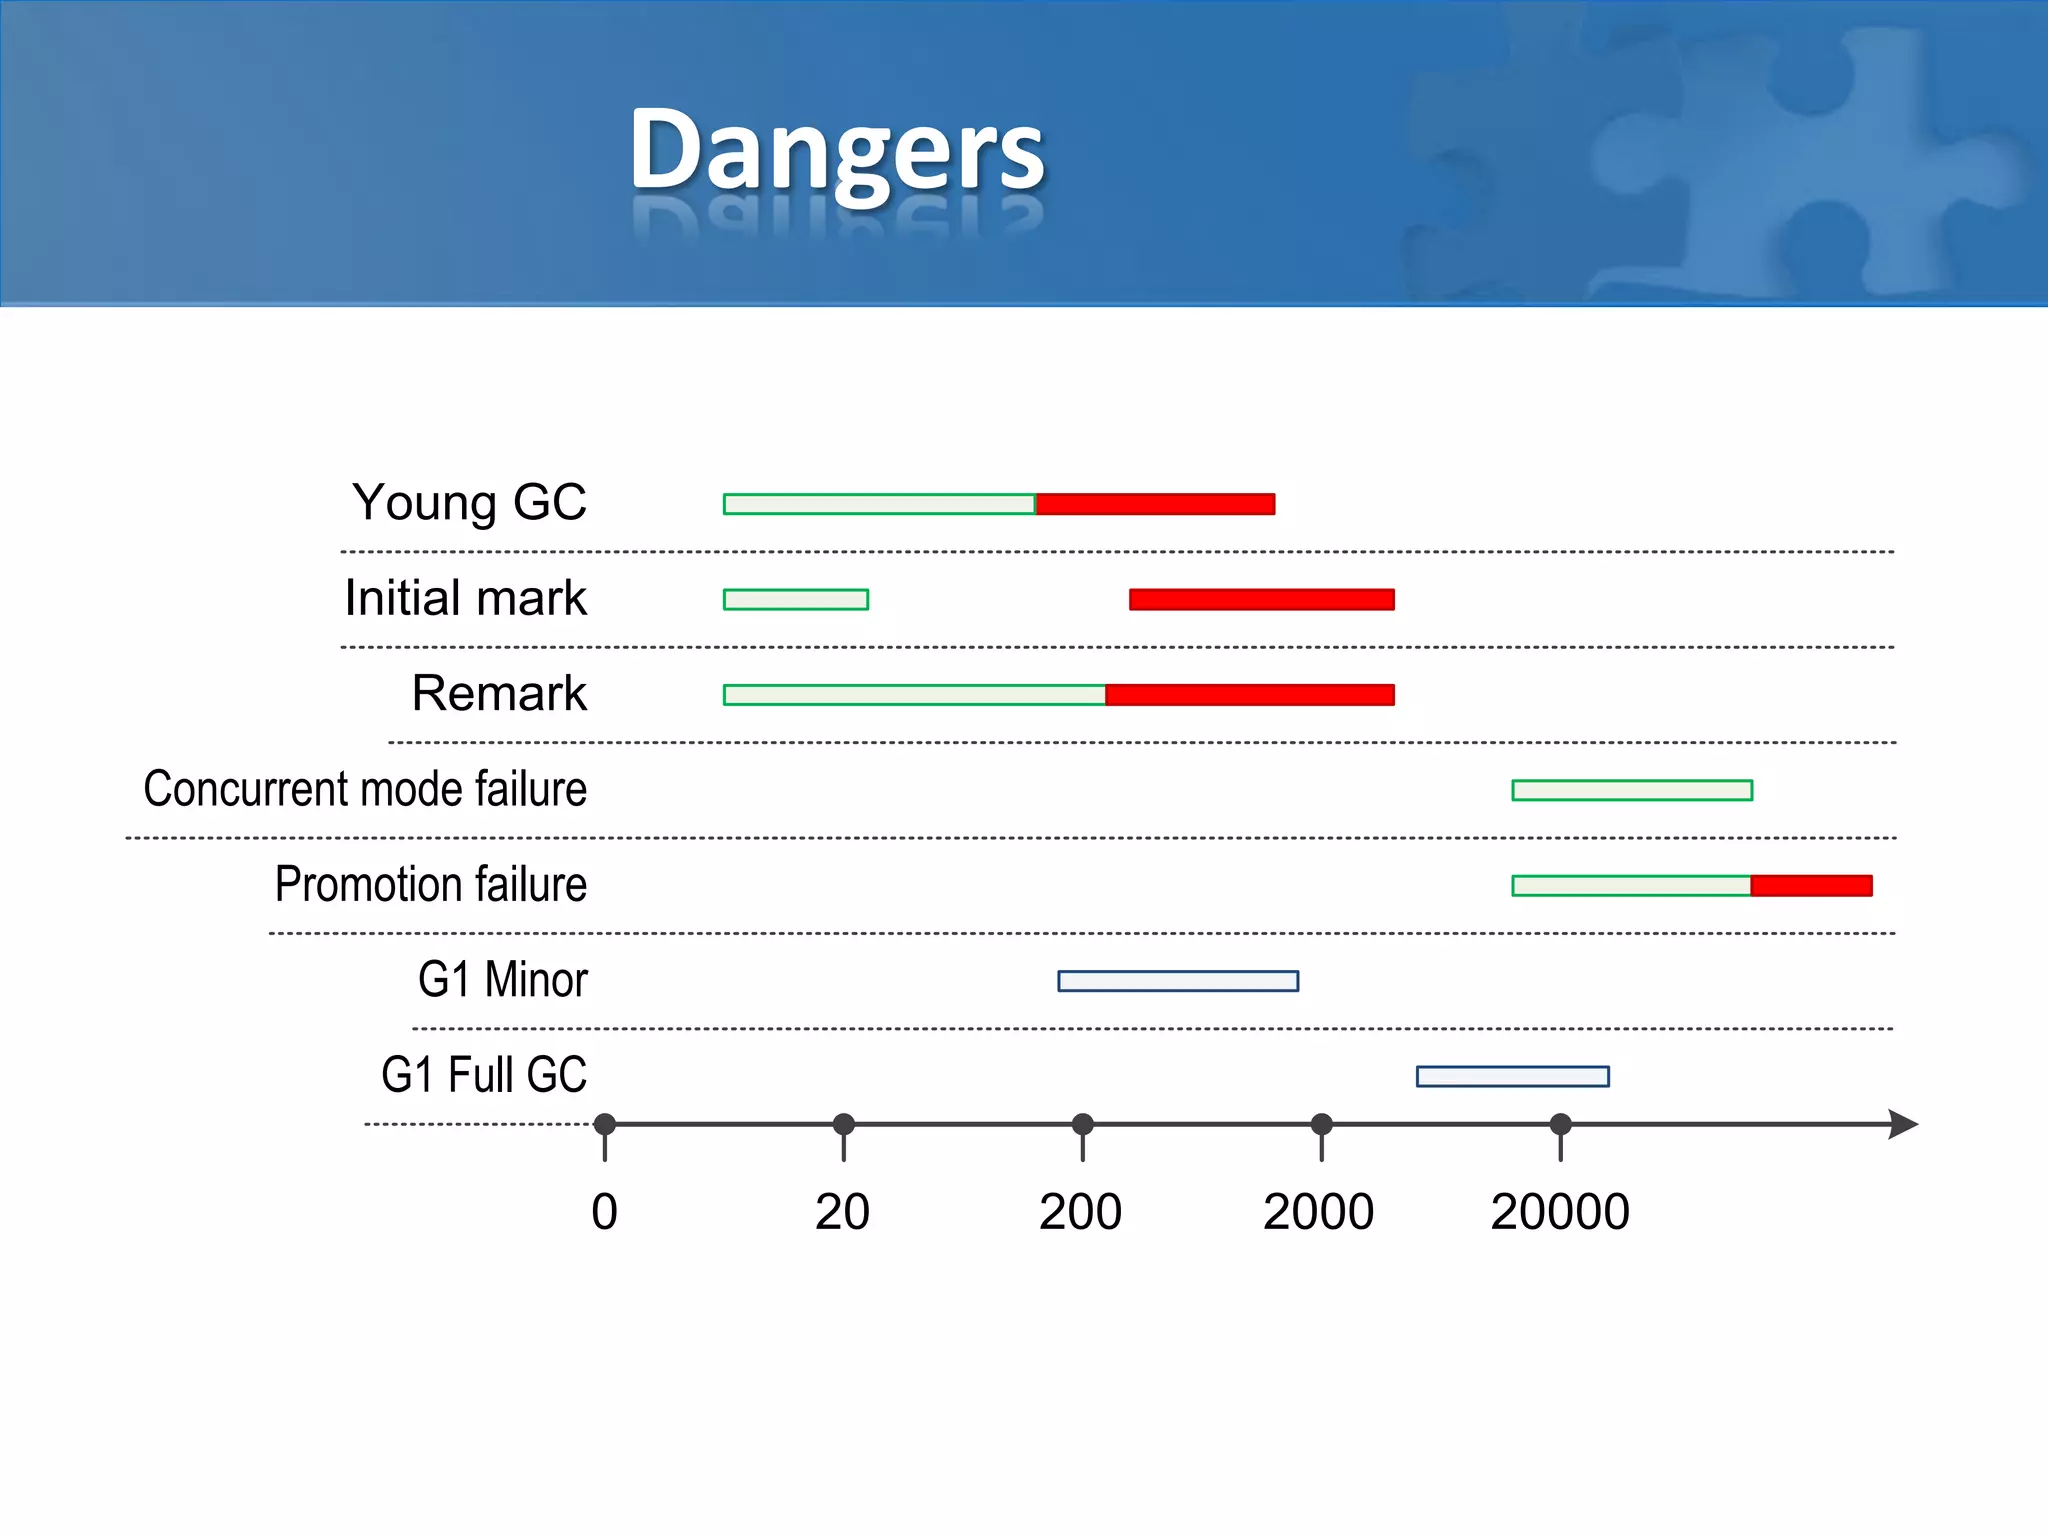
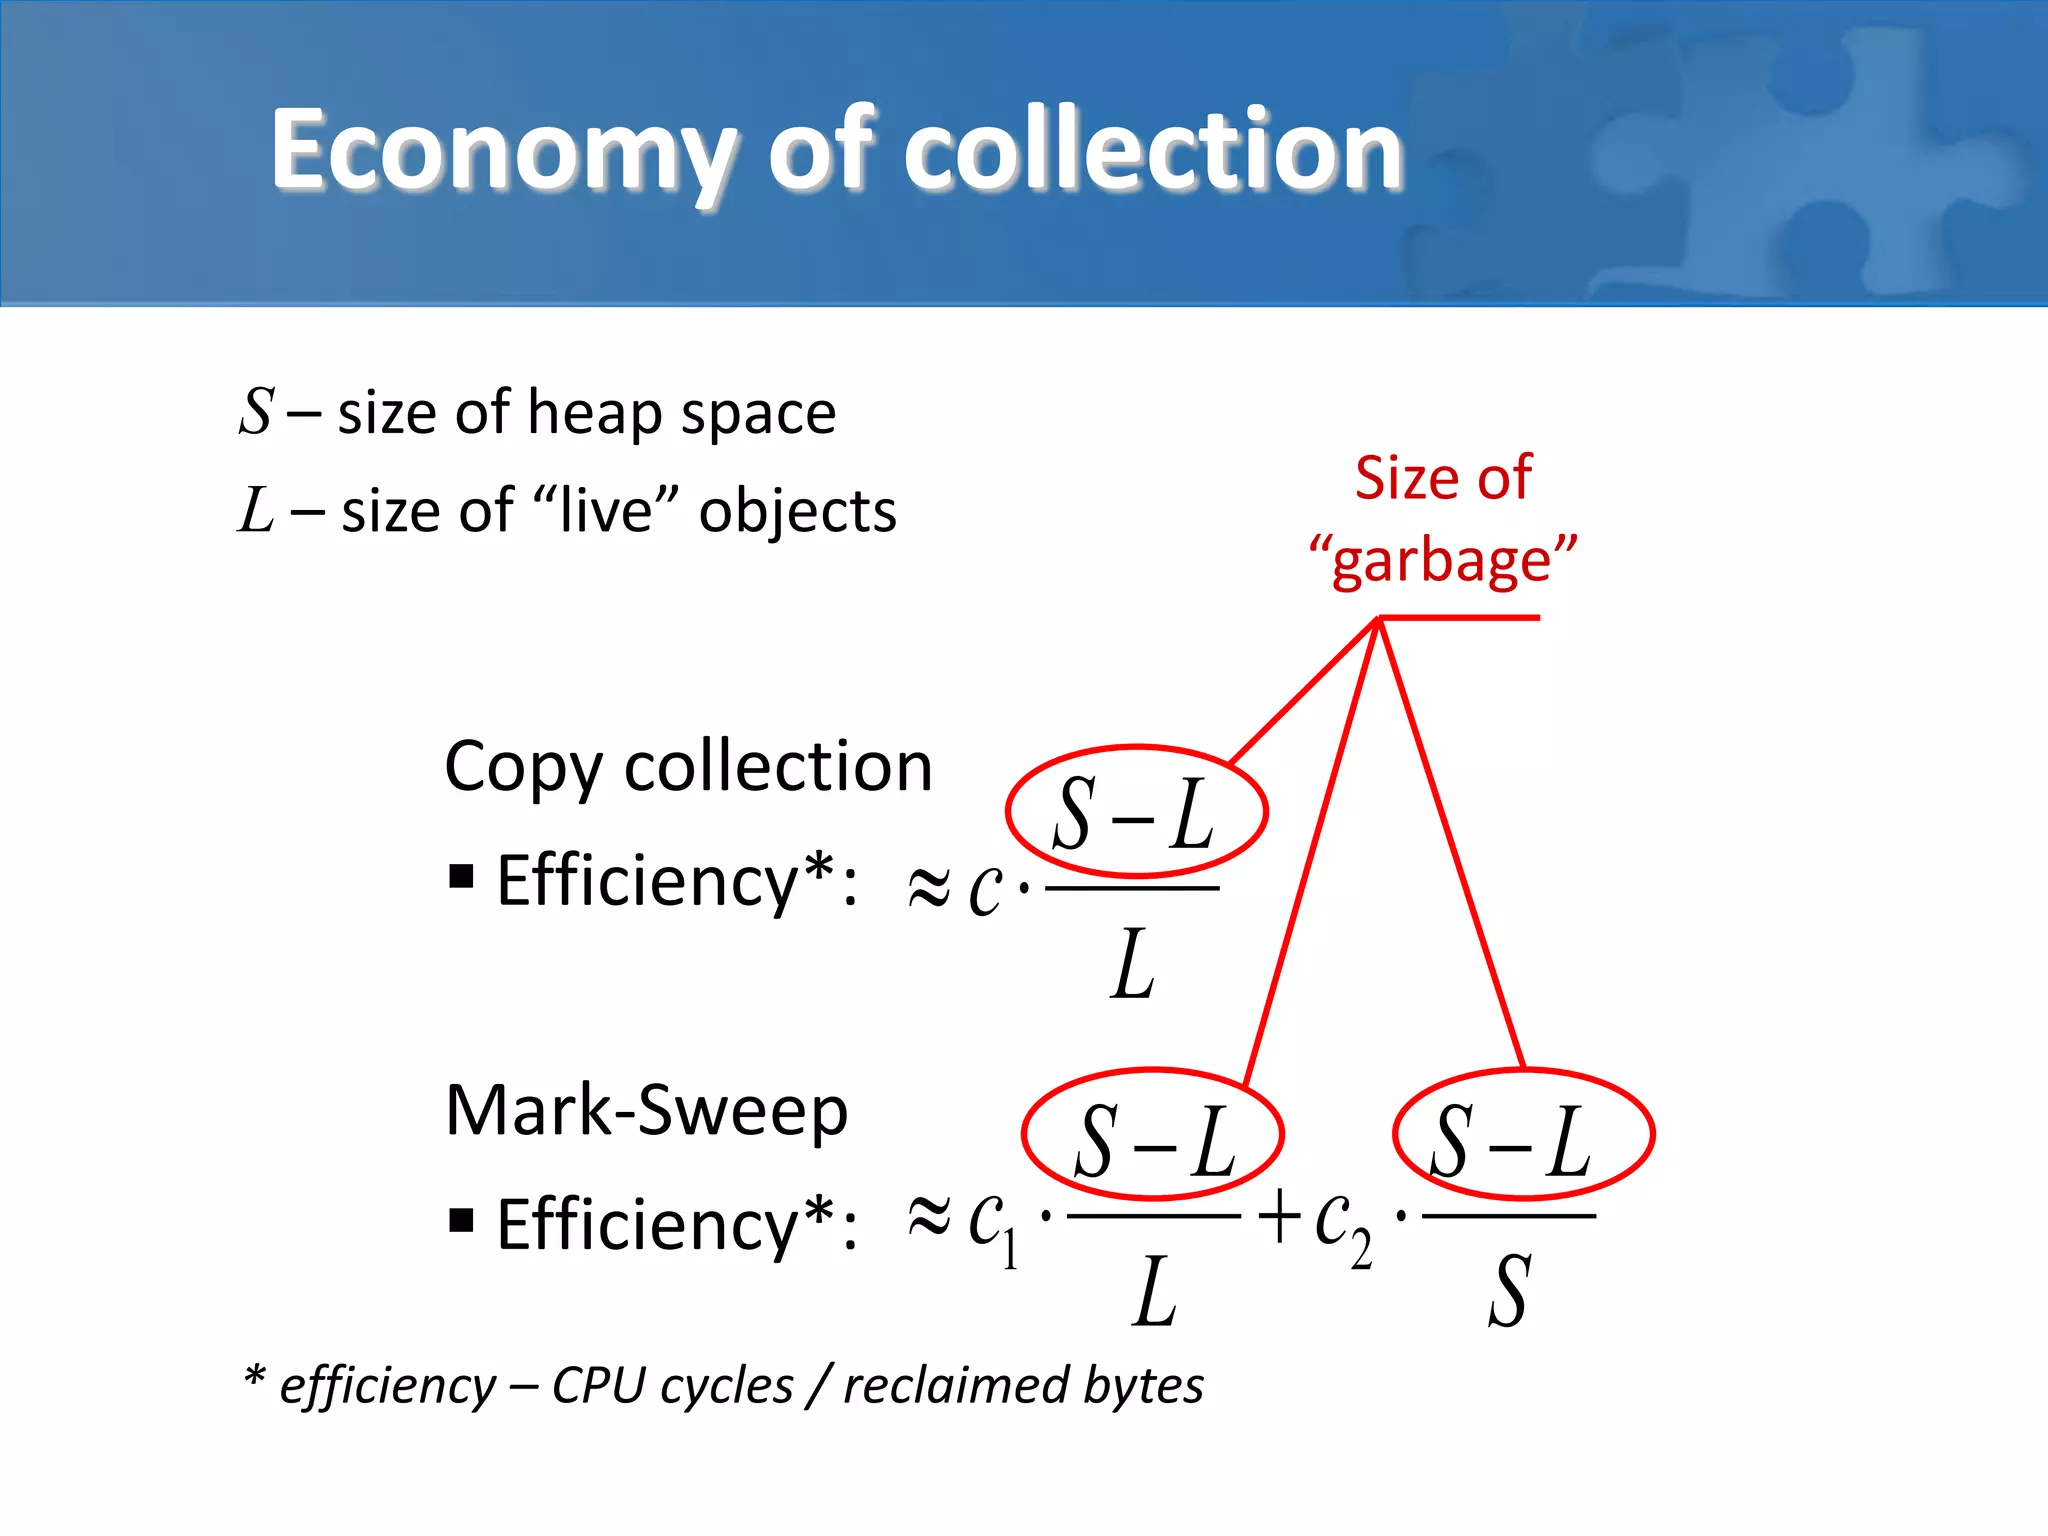
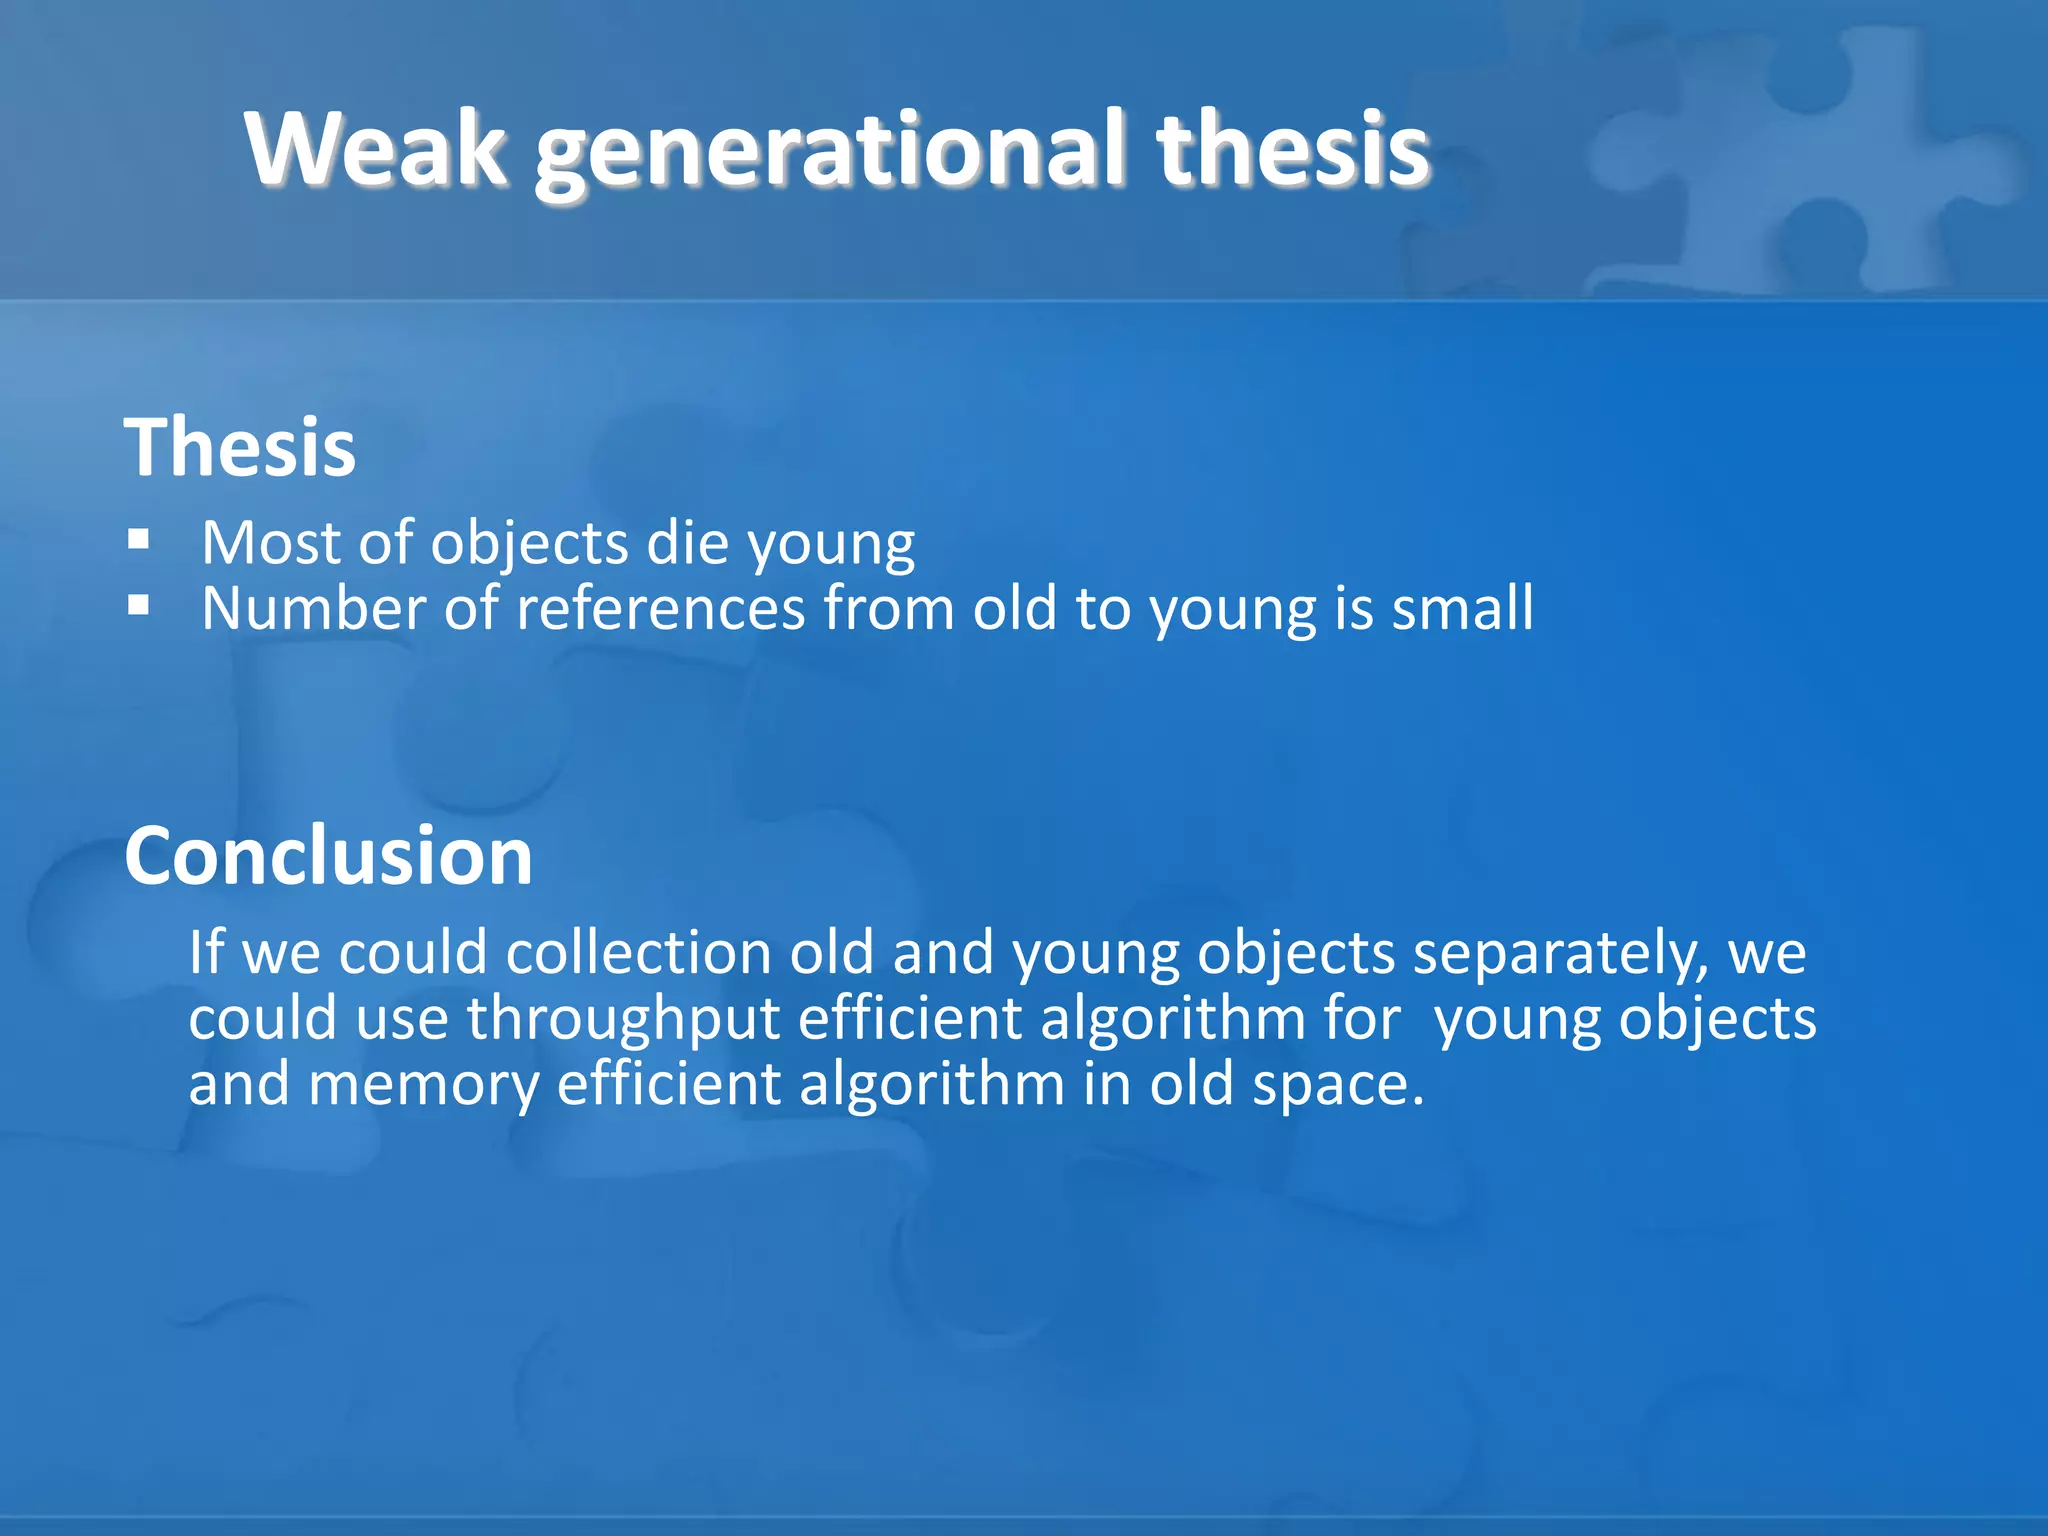
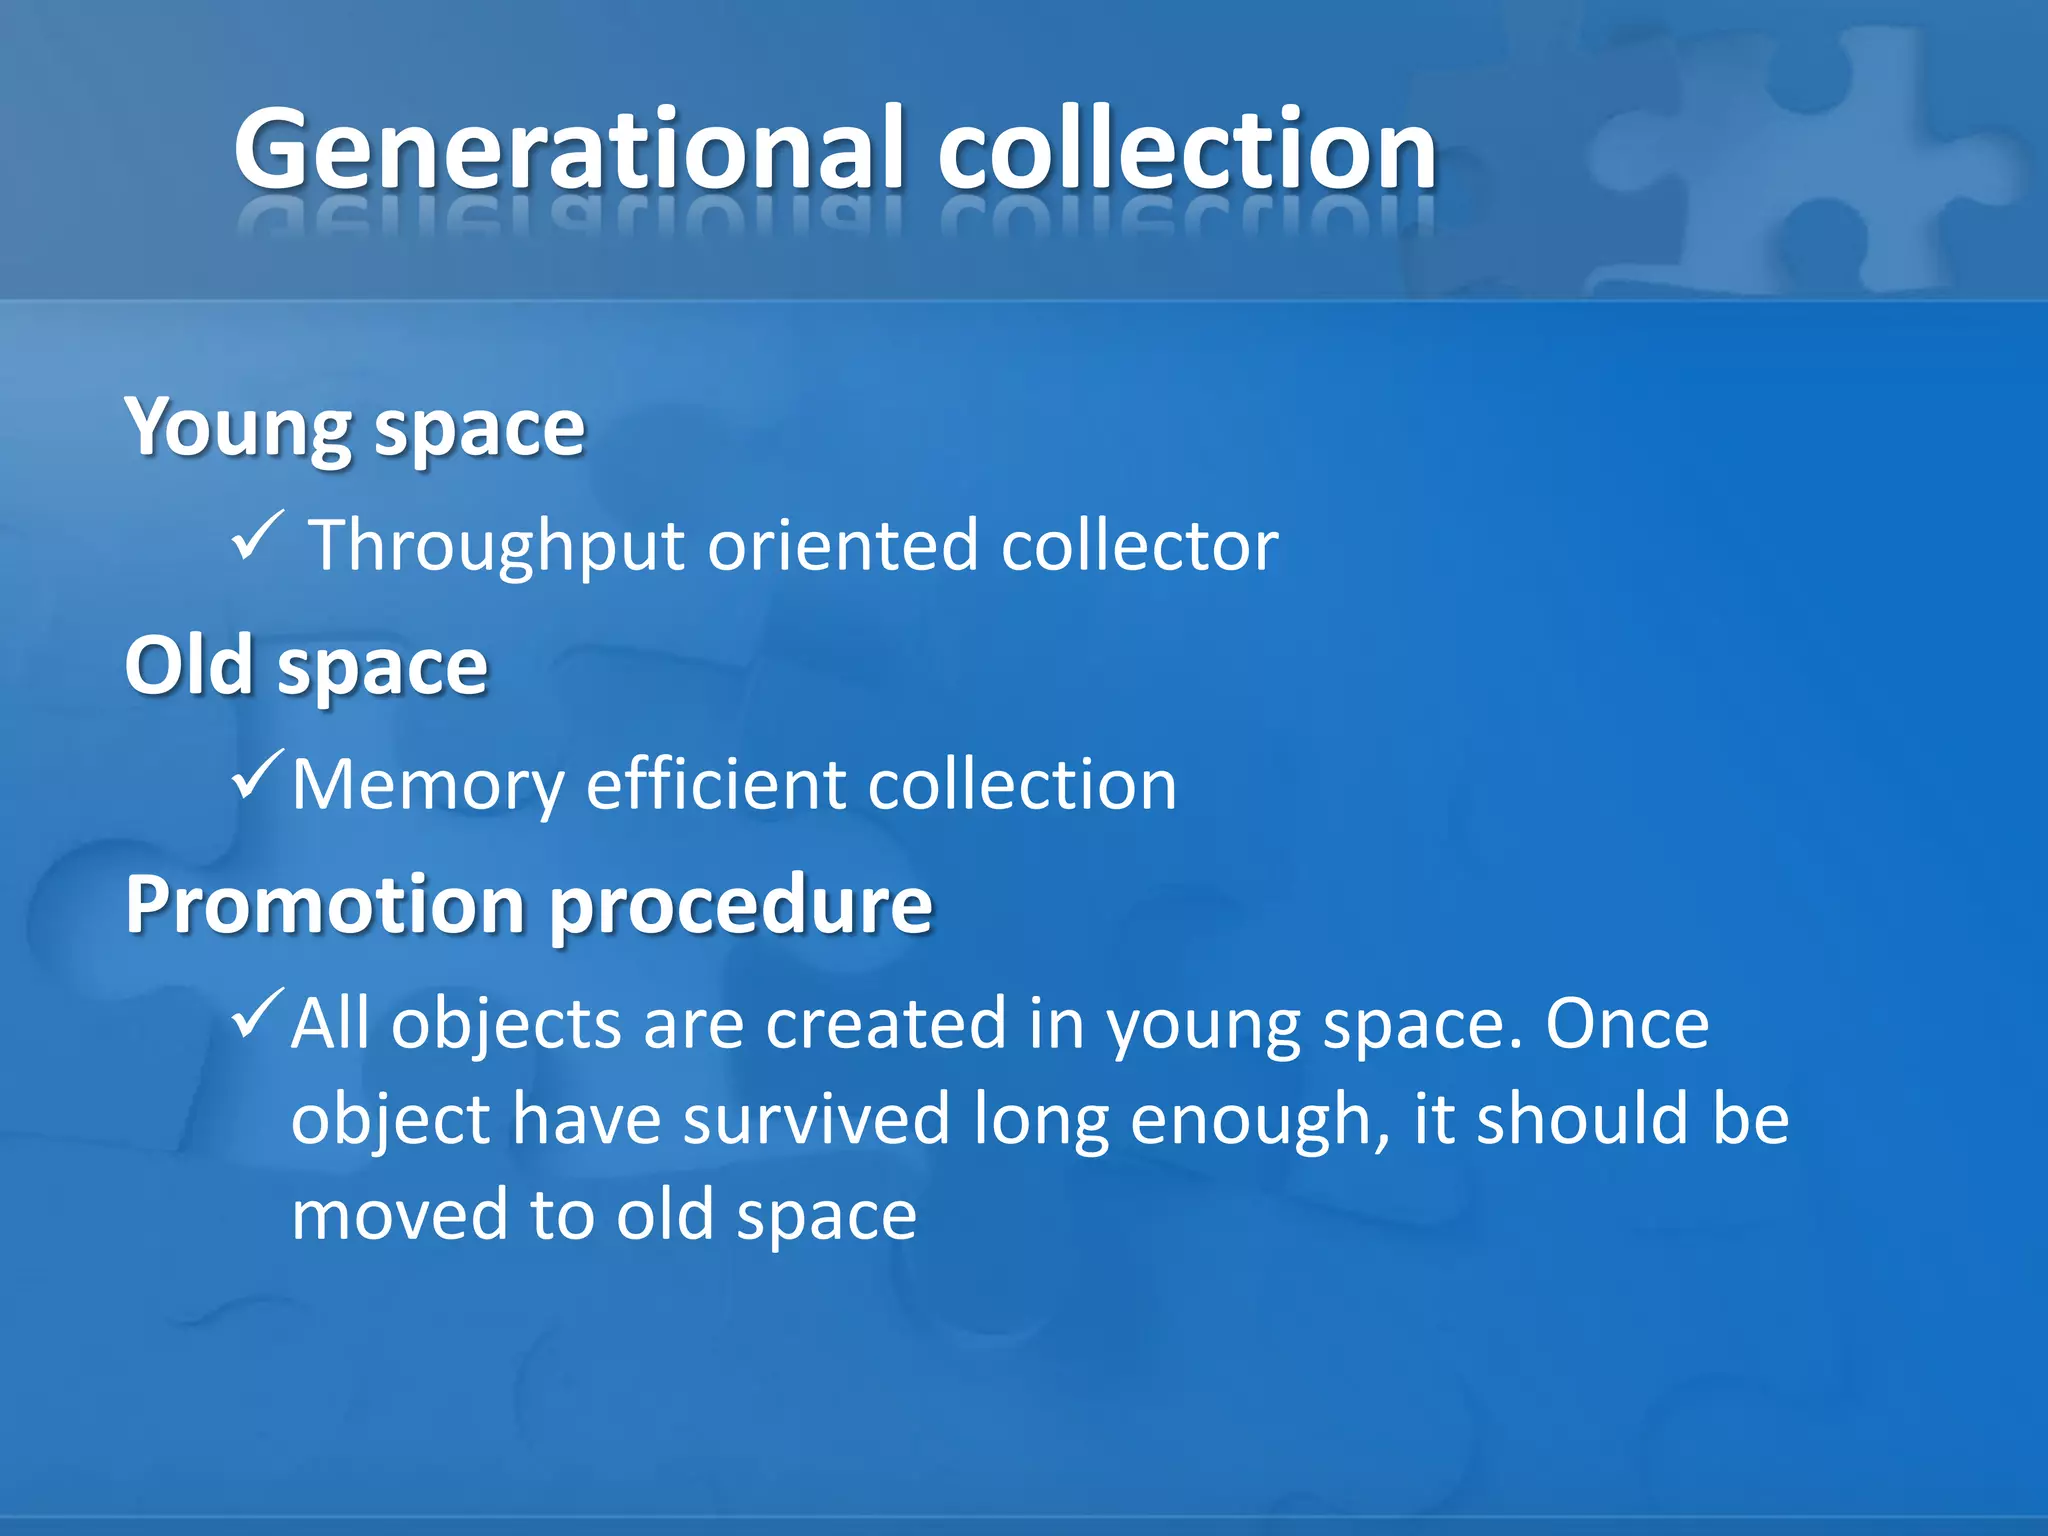
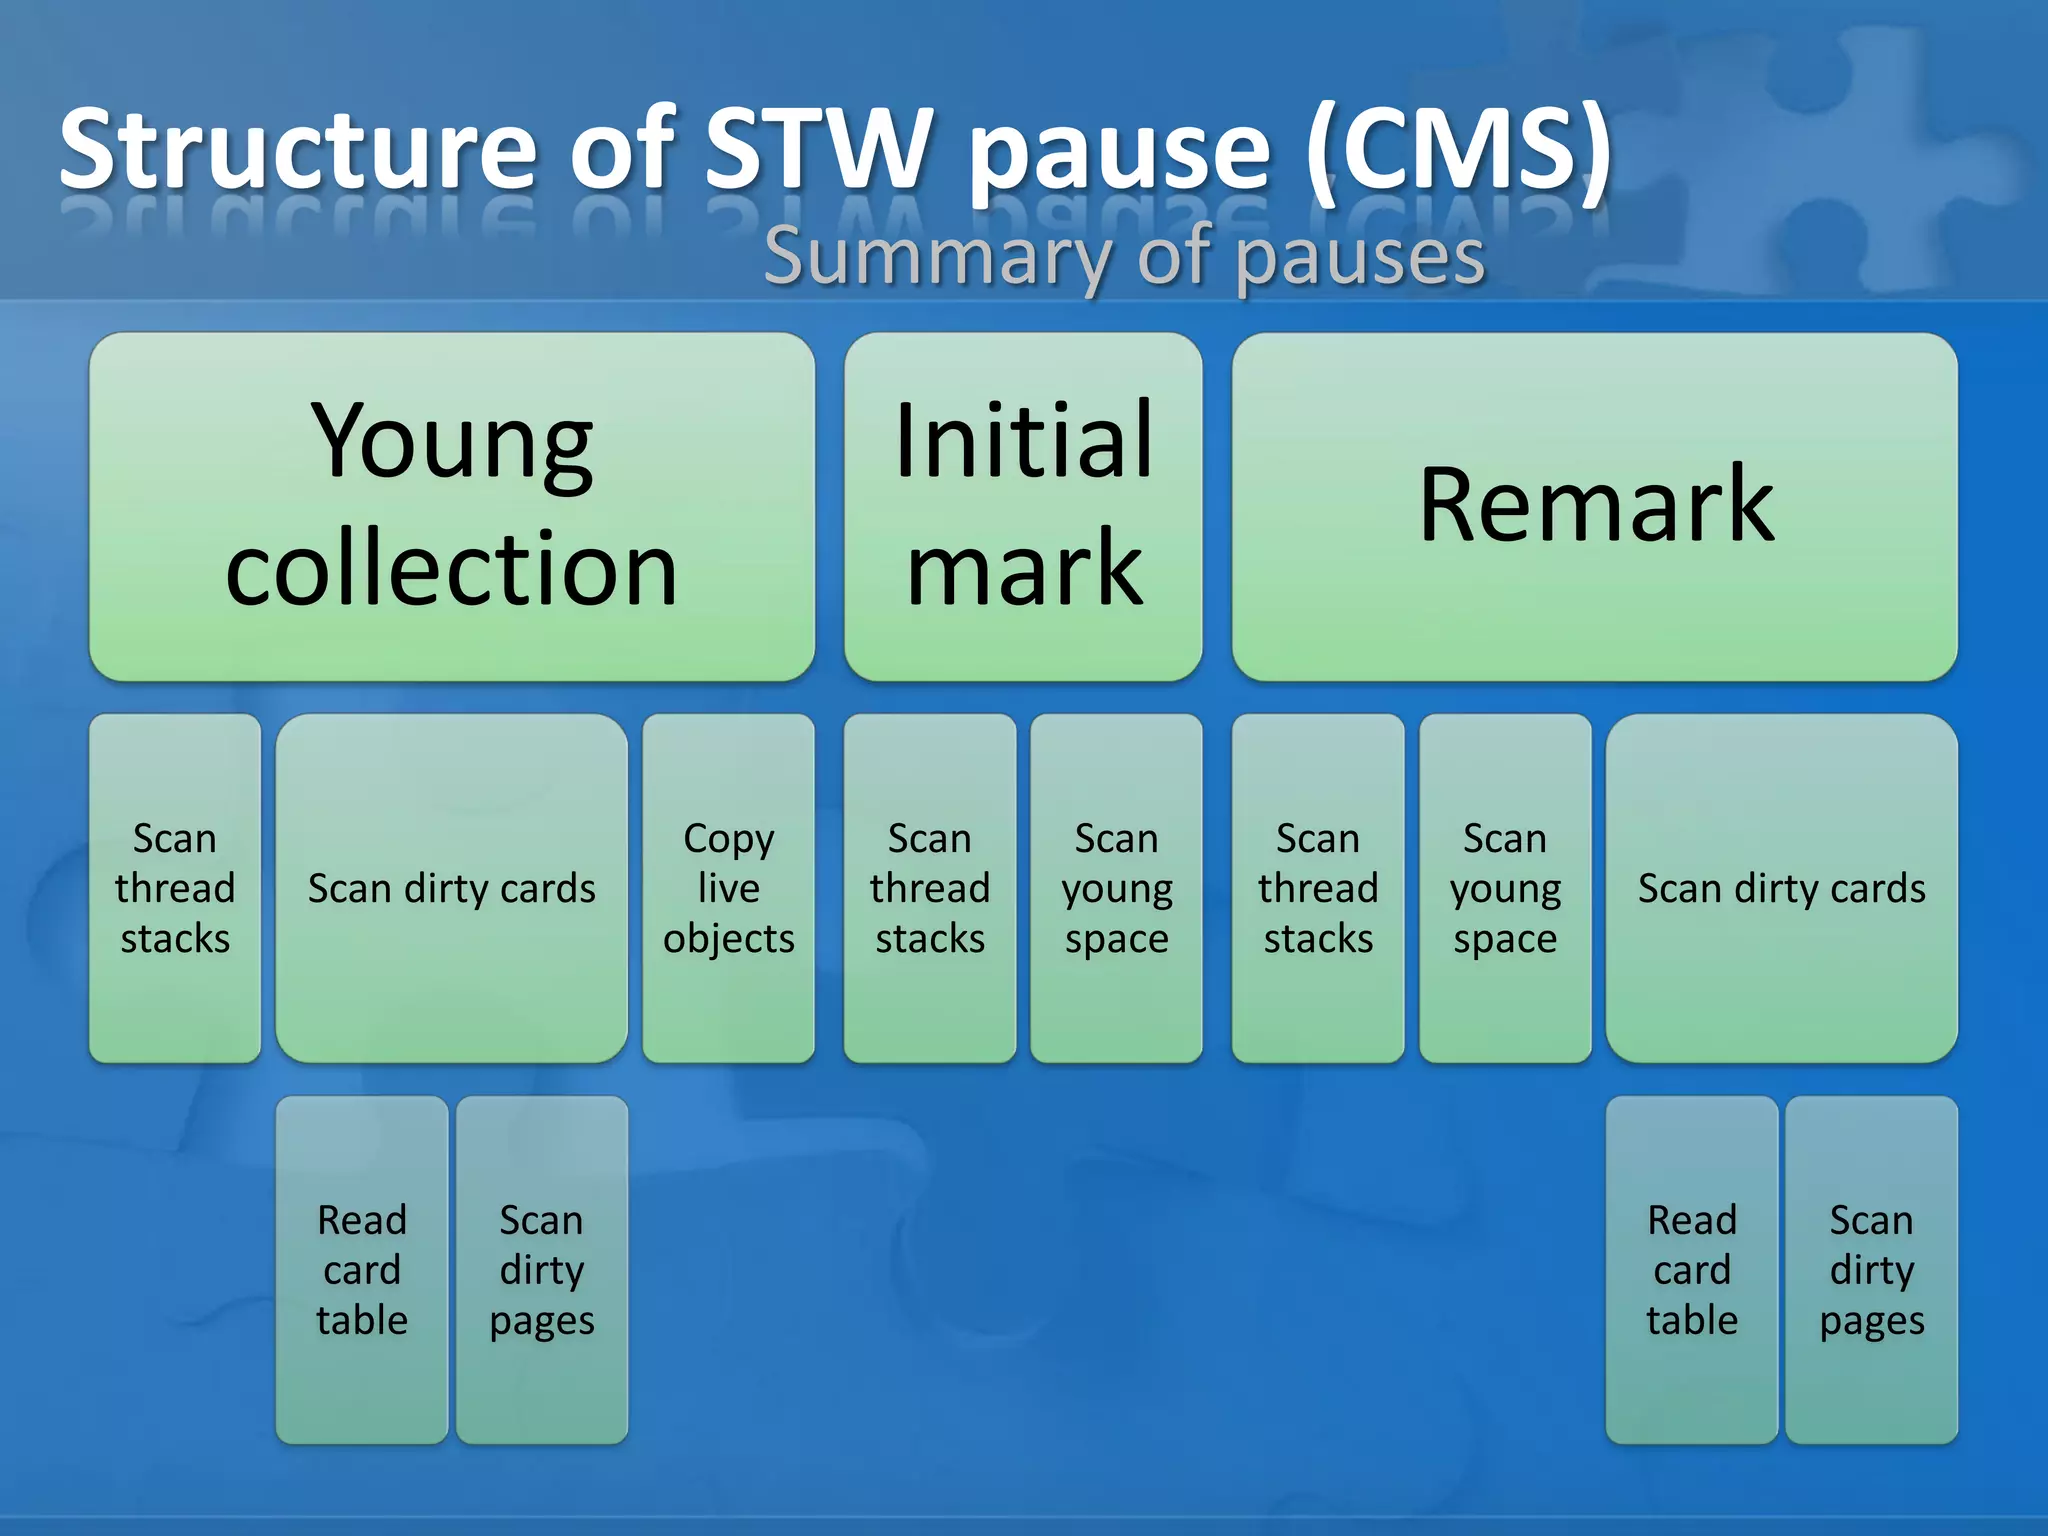
Garbage collection in JVM

Alexey Ragozin

Dec 2013
Common terms
Stop-the-world (STW) pause
– total freeze of application thread in JVM

Compacting algorithms
– ability to relocate objects during garbage collection to
defragment available free space

Parallel collection
– using parallel processing to reduce STW pauses

Concurrent collection
– reclaiming memory in background (no STW pause)
Problem diversity
< 1GiB
< 20 ms
< 200 ms
< 2000 ms

< 10GiB

Lowgarbagecoding

> 10GiB

Off-heap

Young GC

Concurrent mark sweep
Young GC

Fragmentation

Concurrent mark sweep / G1
Fragmentation
Dangers
Young GC
Initial mark
Remark
Concurrent mode failure
Promotion failure
G1 Minor
G1 Full GC
0

20

200

2000

20000
Economy of collection
S – size of heap space
L – size of “live” objects

Size of
“garbage”

Copy collection
SL
 Efficiency*:  c 

L

Mark-Sweep
 Efficiency*:

SL
SL
 c1 
 c2 
L
S

* efficiency – CPU cycles / reclaimed bytes
Weak generational thesis
Thesis
 Most of objects die young
 Number of references from old to young is small

Conclusion
If we could collection old and young objects separately, we
could use throughput efficient algorithm for young objects
and memory efficient algorithm in old space.
Generational collection
Young space
 Throughput oriented collector

Old space
Memory efficient collection

Promotion procedure
All objects are created in young space. Once
object have survived long enough, it should be
moved to old space
Concurrent Mark Sweep






[stop-the-world]
[concurrent]
[concurrent]
[stop-the-world]
[concurrent]

Collection of root references
Marking object graph
Remarking starting with “dirty” pages
Final remark
Sweep - all unmarked is free
Structure of STW pause (CMS)
Summary of pauses

Young
collection
Scan
thread
stacks

Scan dirty cards

Read
card
table

Scan
dirty
pages

Copy
live
objects

Initial
mark
Scan
thread
stacks

Scan
young
space

Remark
Scan
thread
stacks

Scan
young
space

Scan dirty cards

Read
card
table

Scan
dirty
pages
Pause asymptotics

http://blog.ragozin.info/2011/07/openjdk-patch-cutting-down-gc-pause.html
GC parallelism

http://blog.ragozin.info/2013/06/java-gc-in-numbers-parallel-young.html
GC parallelism

http://blog.ragozin.info/2013/06/java-gc-in-numbers-parallel-young.html
Other elements of STW pauses
“safe point” initiation time
Waiting JNI memory lock
Thread stacks scanning
Processing special references
• Weak • Soft • JNI • Finalizers
Heap sizing





-Xmx = -Xms
-Xmx = old space + new space
-Xmn = new space
Old space:
 Application data (jmap –histo)
 Reserve 30-50% for GC head room and fragmentation

 New space:
 According to your workloads
 Too large – risk of sporadic huge promotions
CMS fine tuning






Tuning young space geometry (eden / survivor sizes)
-XX:CMSWaitDuration=N
-XX:+CMSScavengeBeforeRemark
Do you need –XX:+ CMSIncrementalMode?
Do you need class unloading?

http://blog.ragozin.info/2011/07/gc-check-list-for-data-grid-nodes.html
Old space fragmentation

http://blog.ragozin.info/2011/10/cms-heap-fragmentation-follow-up-1.html
Old space fragmentation
Fatal fragmentation leads to
 Single threaded STW Mark Sweep Compact
 Very long promotion failure recovery
Increase old space – most efficient remedy
against fragmentation
Other possible issues
 Swapping
disk trashing is lethal for JVM performance

 Reference abuse
 Abnormally slow safepoints
 Abnormally large methods
 JNI locking memory
HotSpot GC tuning options

http://blog.ragozin.info/2013/11/hotspot-jvm-garbage-collection-options.html
SJK – JVM diagnostic tool
SJK - https://github.com/aragozin/jvm-tools
• Garbage class histogram
• Per thread heap allocation rate reporting
> java -jar sjk.jar ttop -p 6344 -n 20 -o CPU

2013-09-09T11:32:45.426+0300 Process summary
process cpu=31.08%
application cpu=28.90% (user=6.40% sys=22.49%)
other: cpu=2.19%
heap allocation rate 5260kb/s
[000001] user= 3.12% sys=11.40% alloc= 762kb/s –
[092016] user= 0.31% sys= 1.56% alloc= 1927kb/s [092007] user= 0.78% sys= 8.75% alloc= 860kb/s [092012] user= 0.31% sys= 0.31% alloc= 429kb/s [091966] user= 0.16% sys= 0.00% alloc=
90kb/s -

• Ad hoc “pseudo” GC logs
• and more …

main
SVN-WJGGZ
Worker-4863
Worker-4864
Worker-4859
Thank you
http://blog.ragozin.info
- my blog about JVM and other stuff
Alexey Ragozin
alexey.ragozin@gmail.com

Garbage collection in JVM