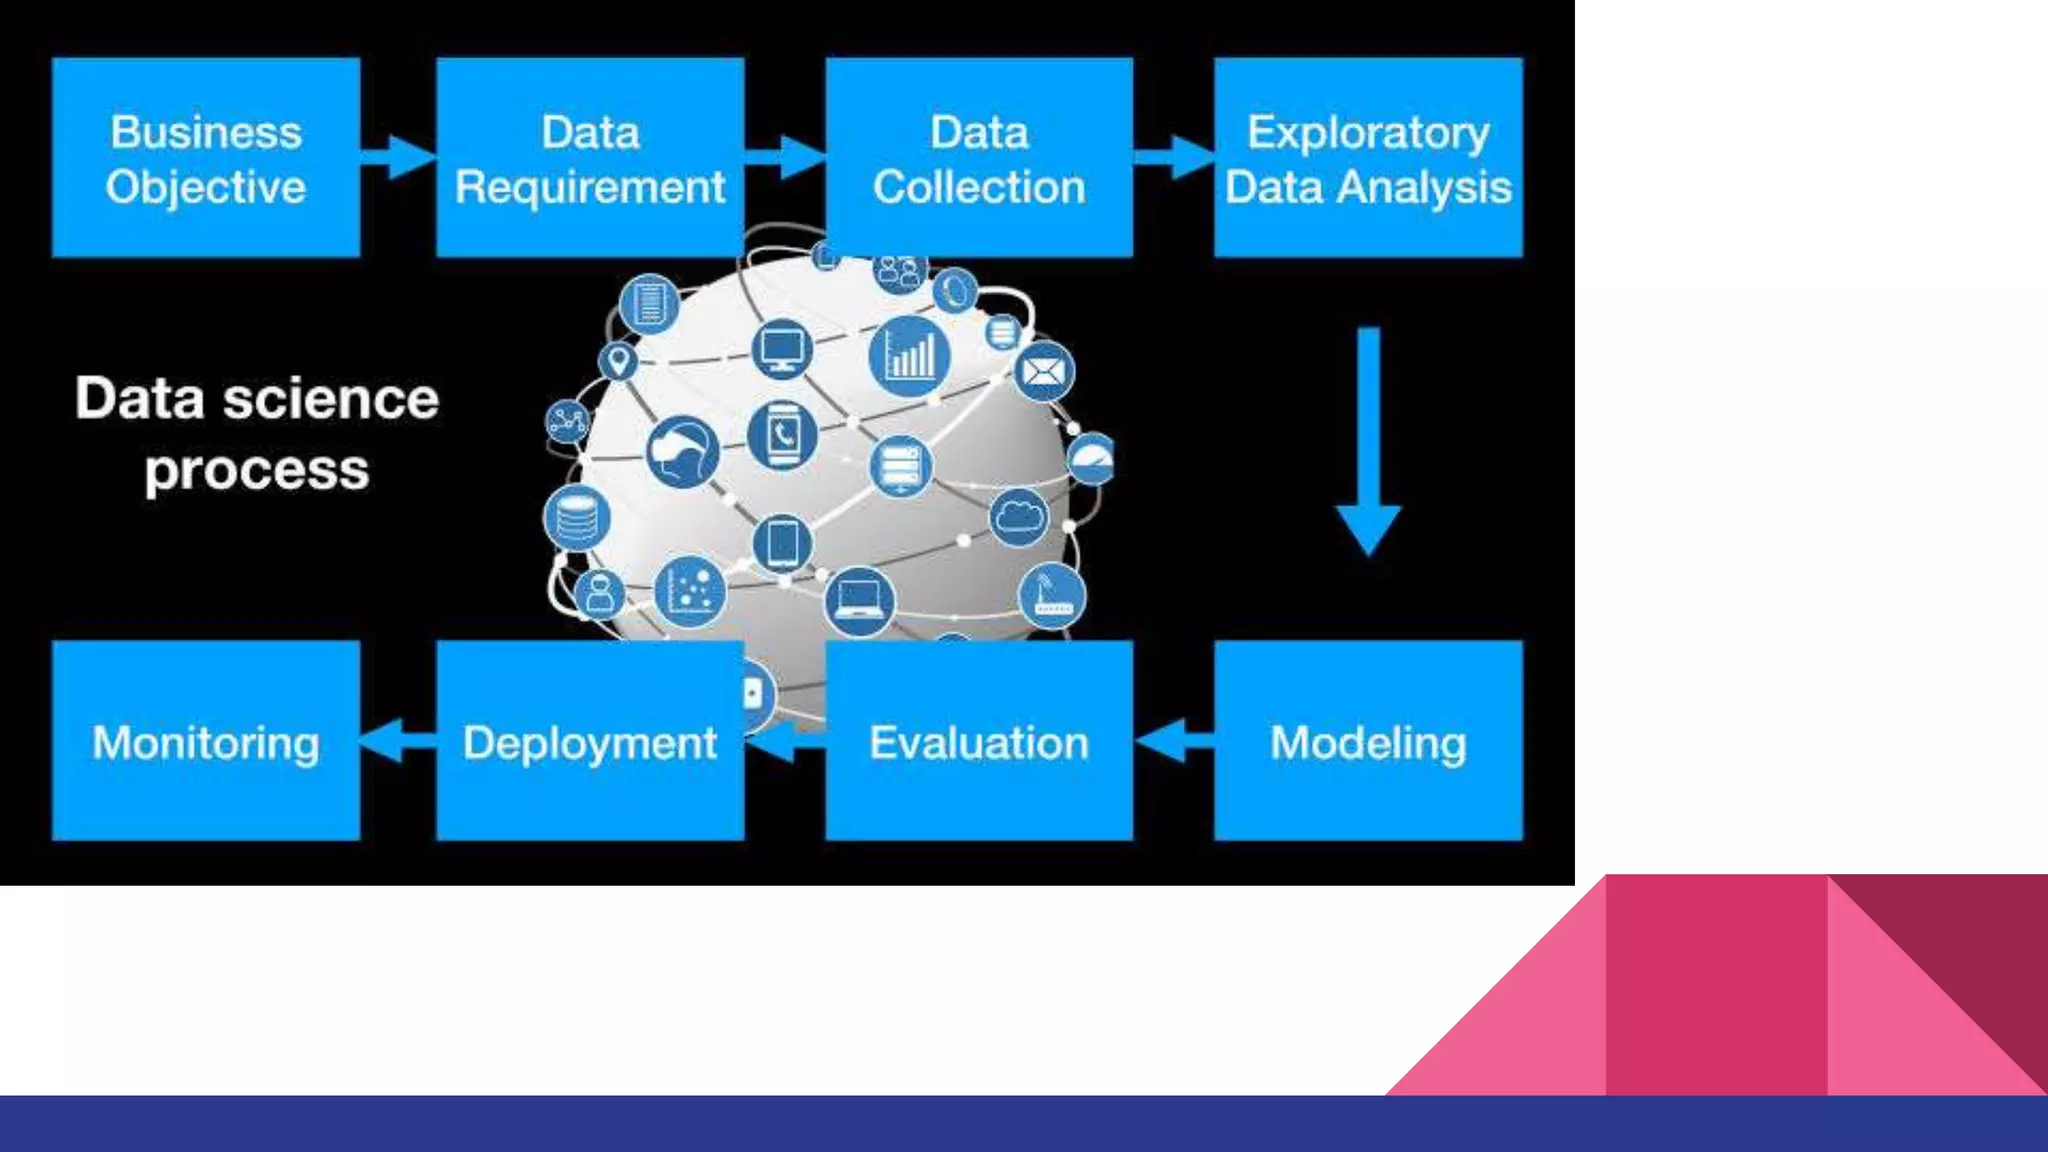
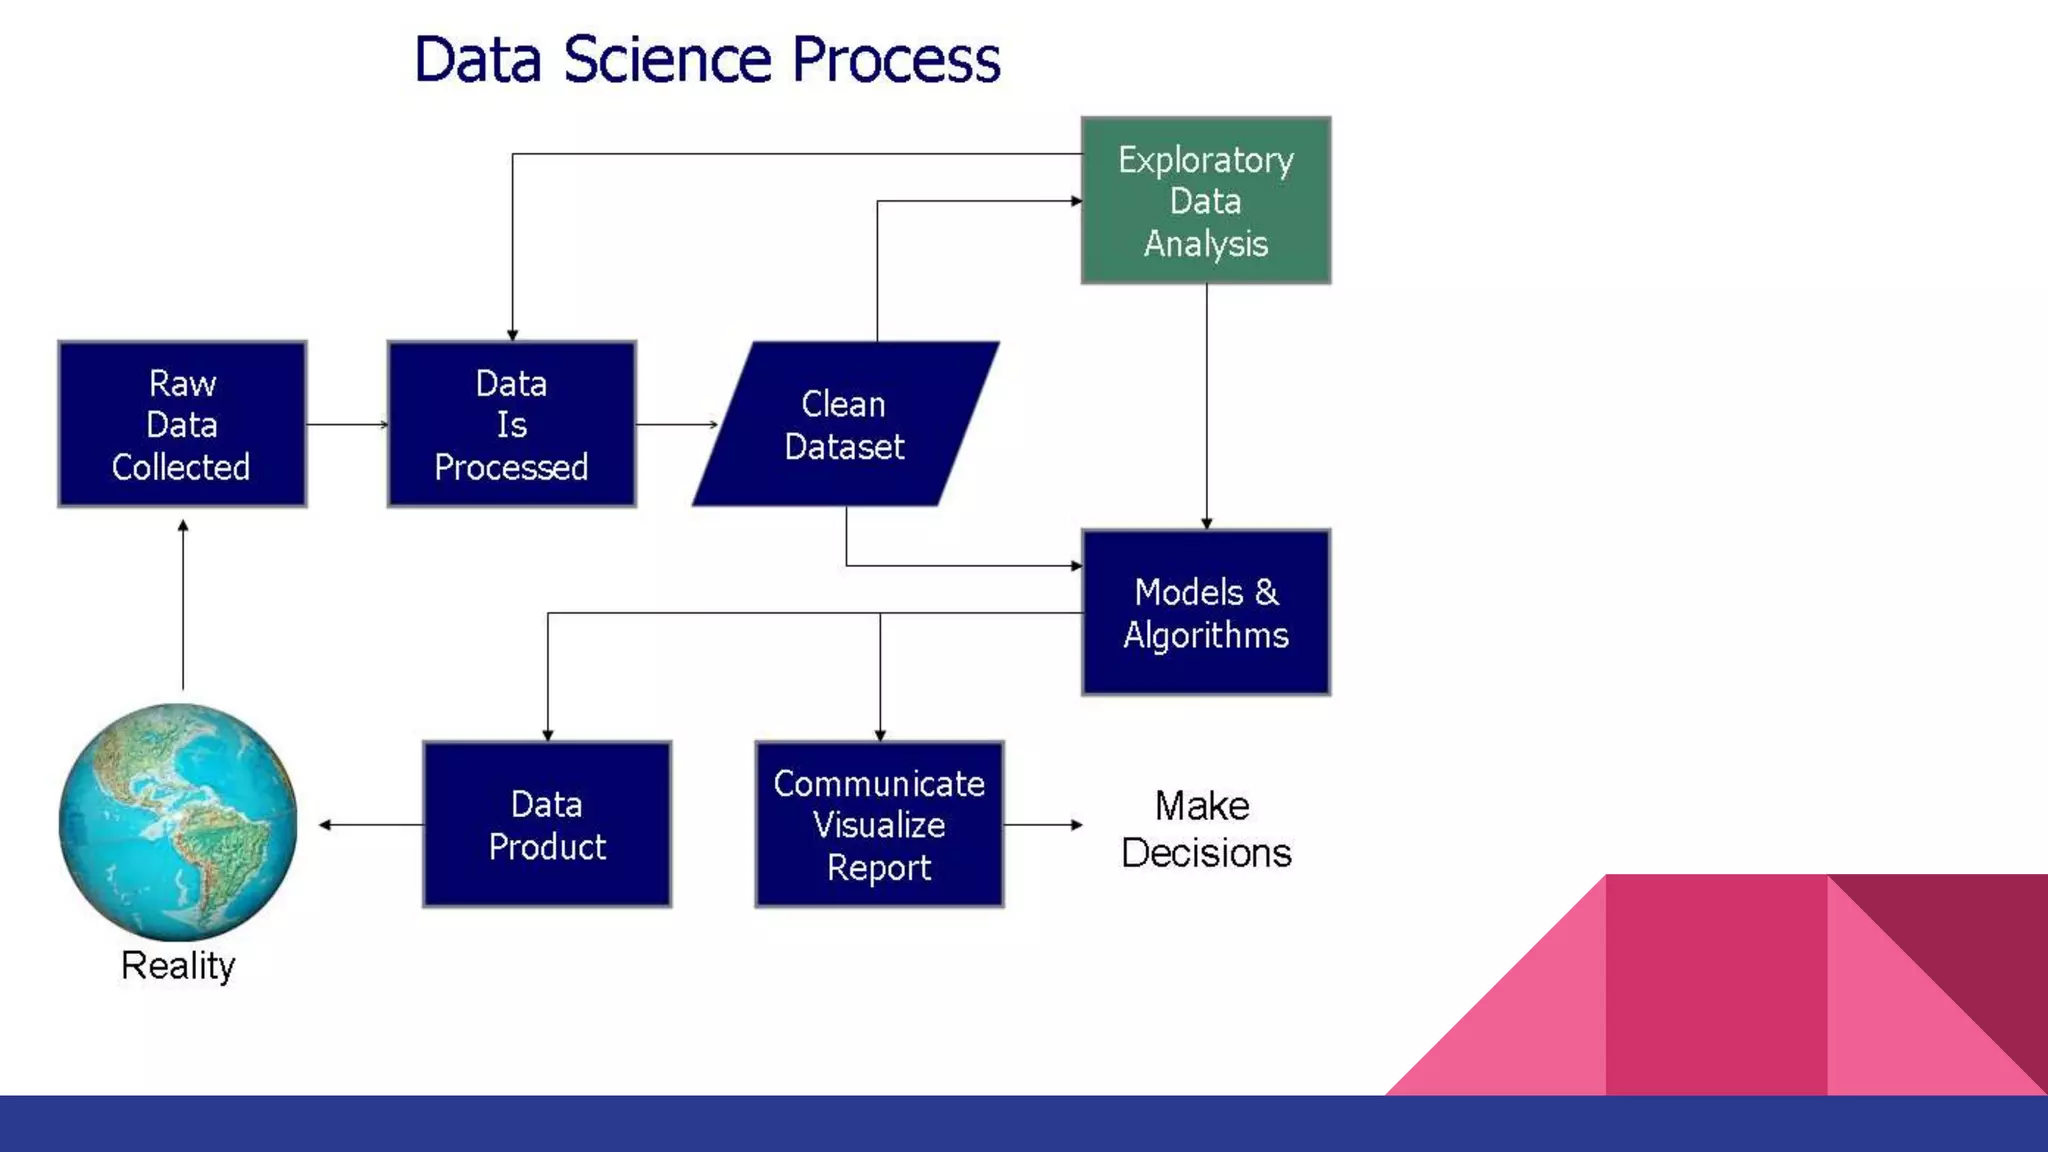
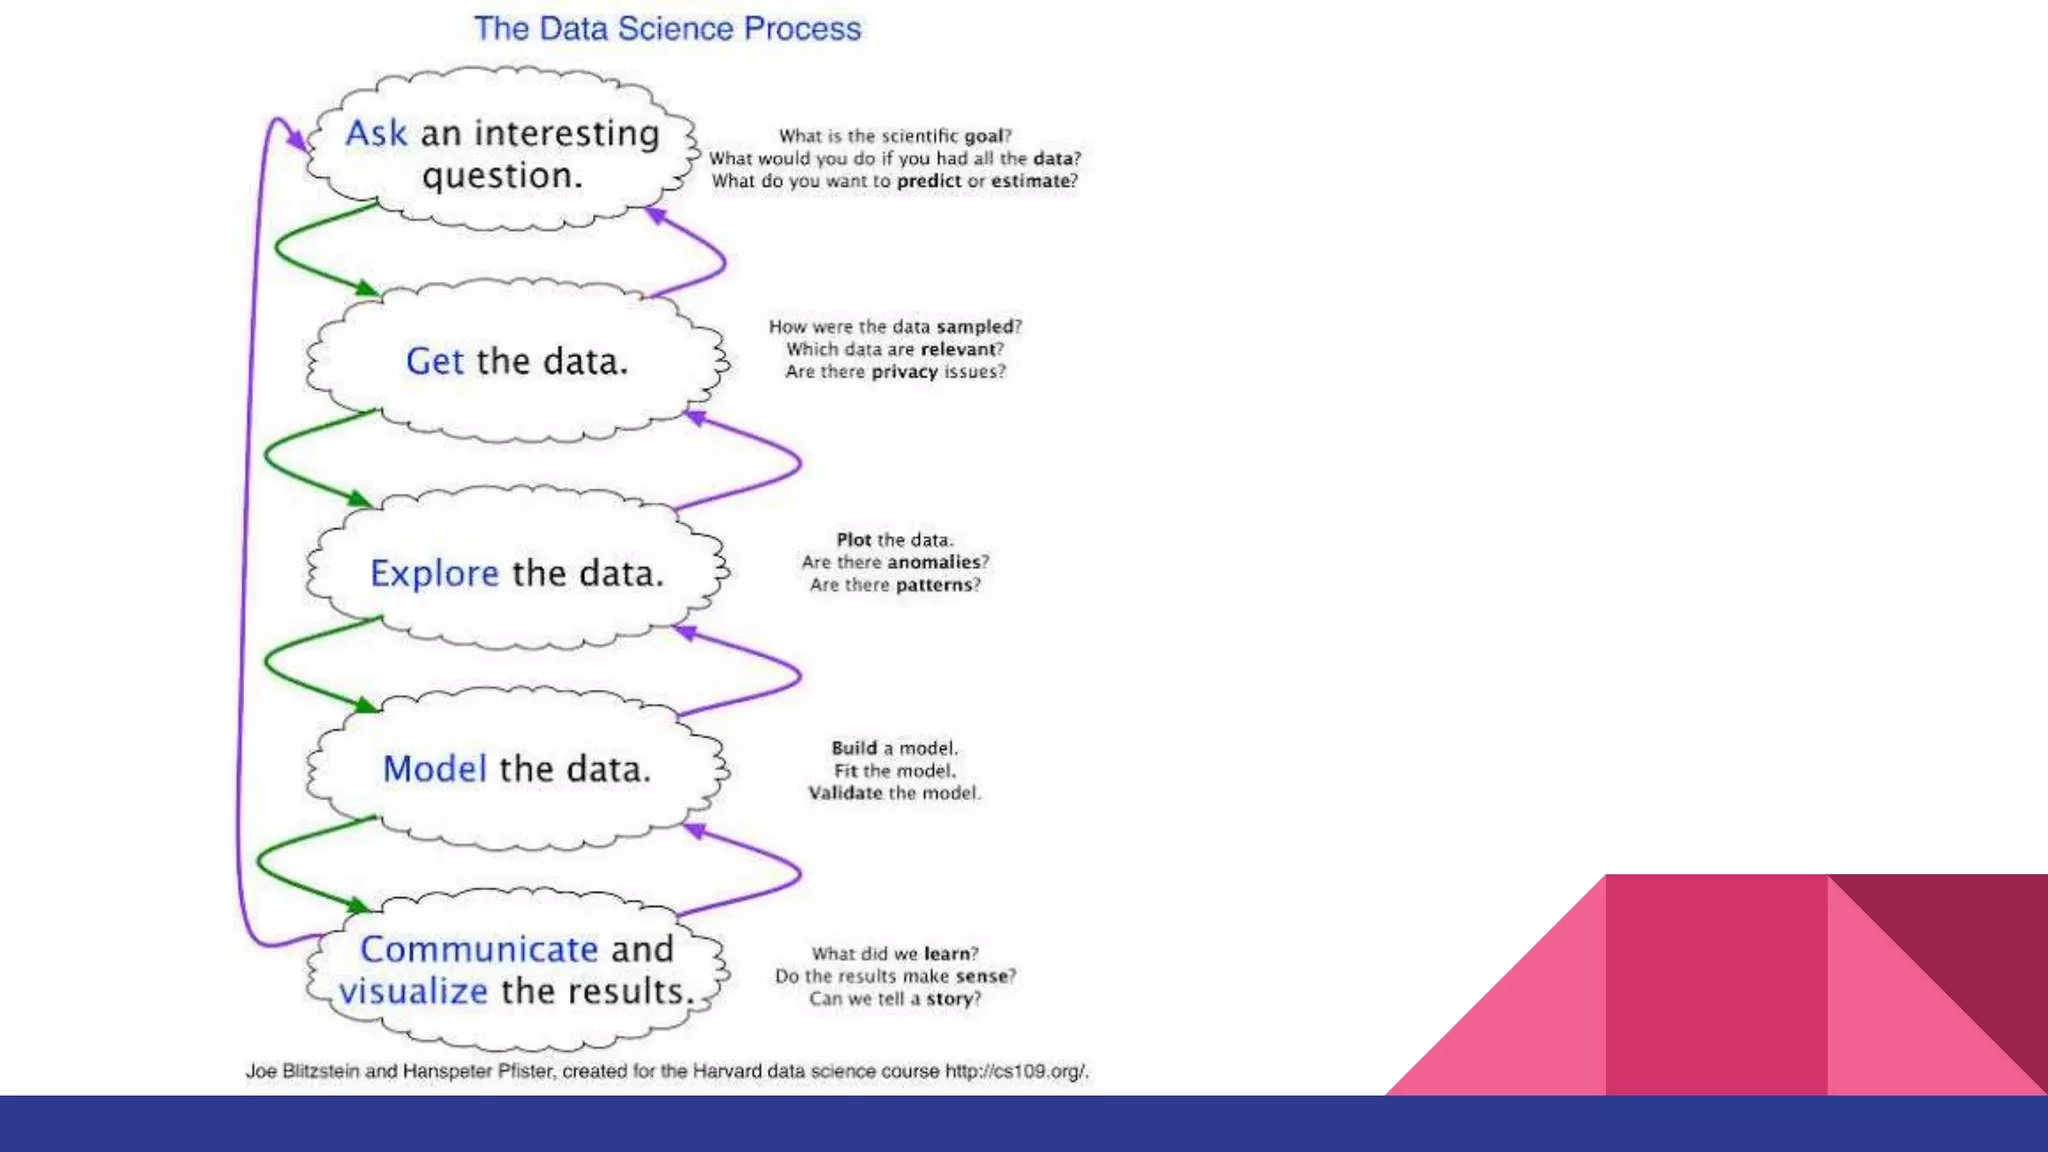
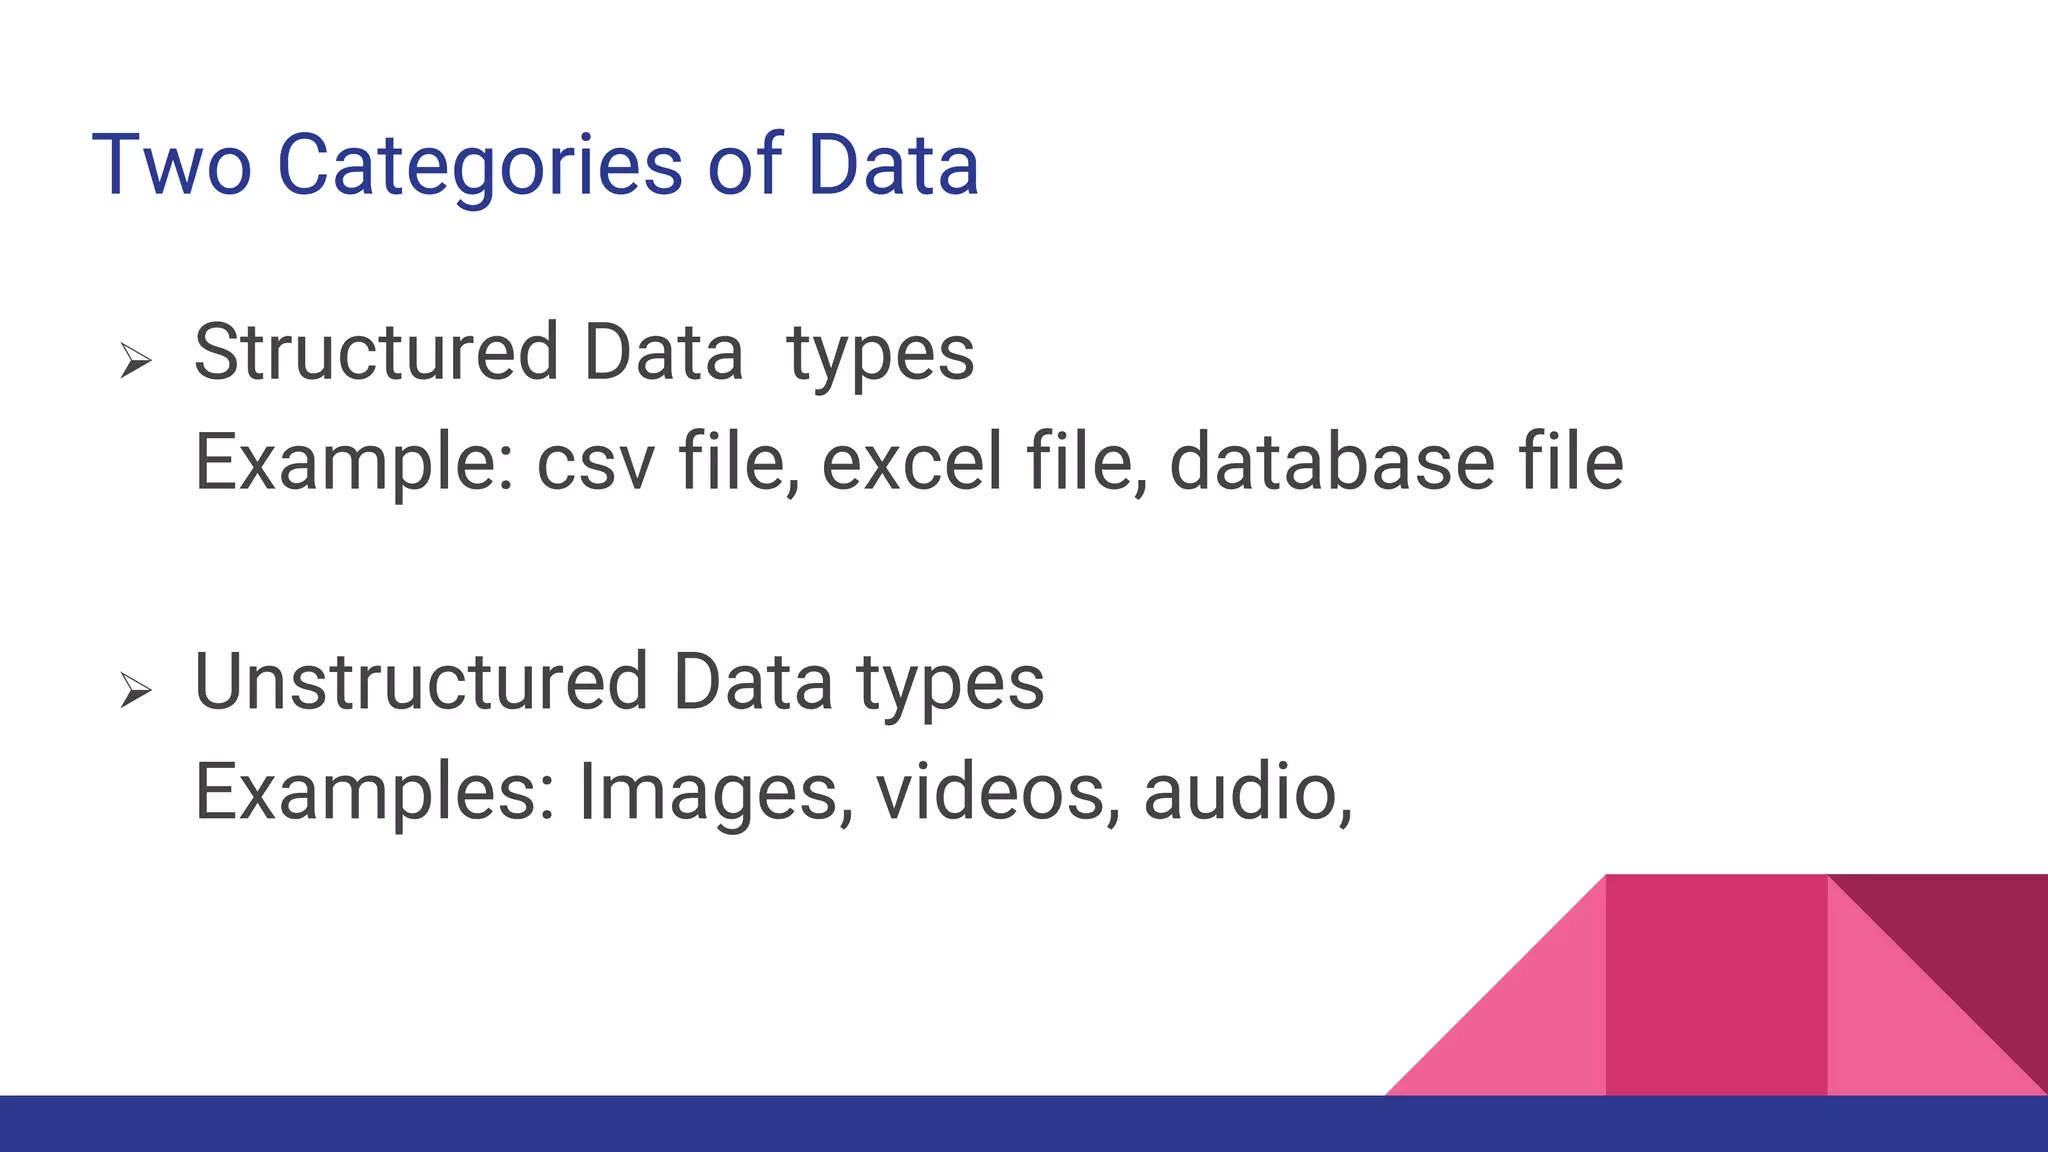
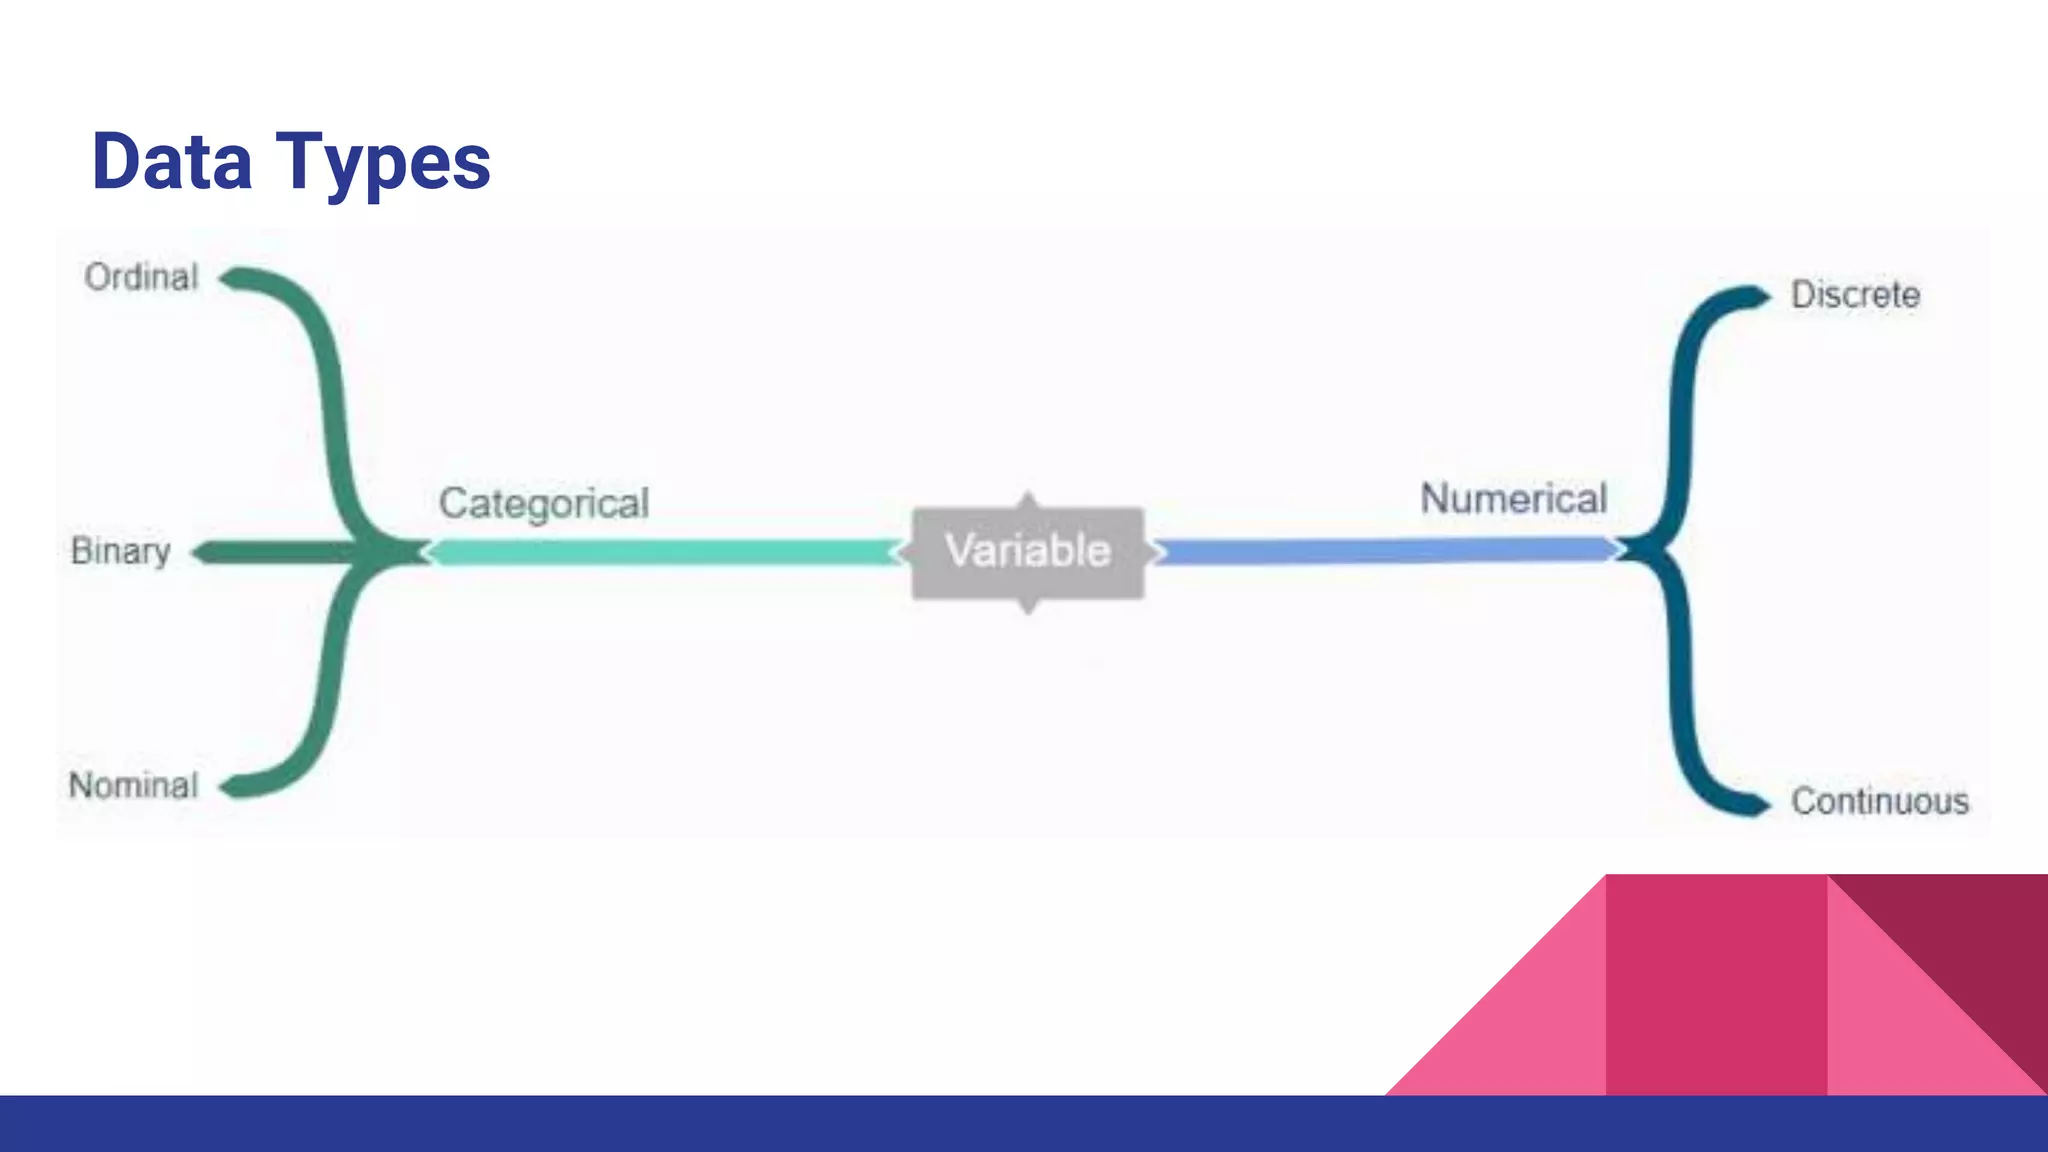
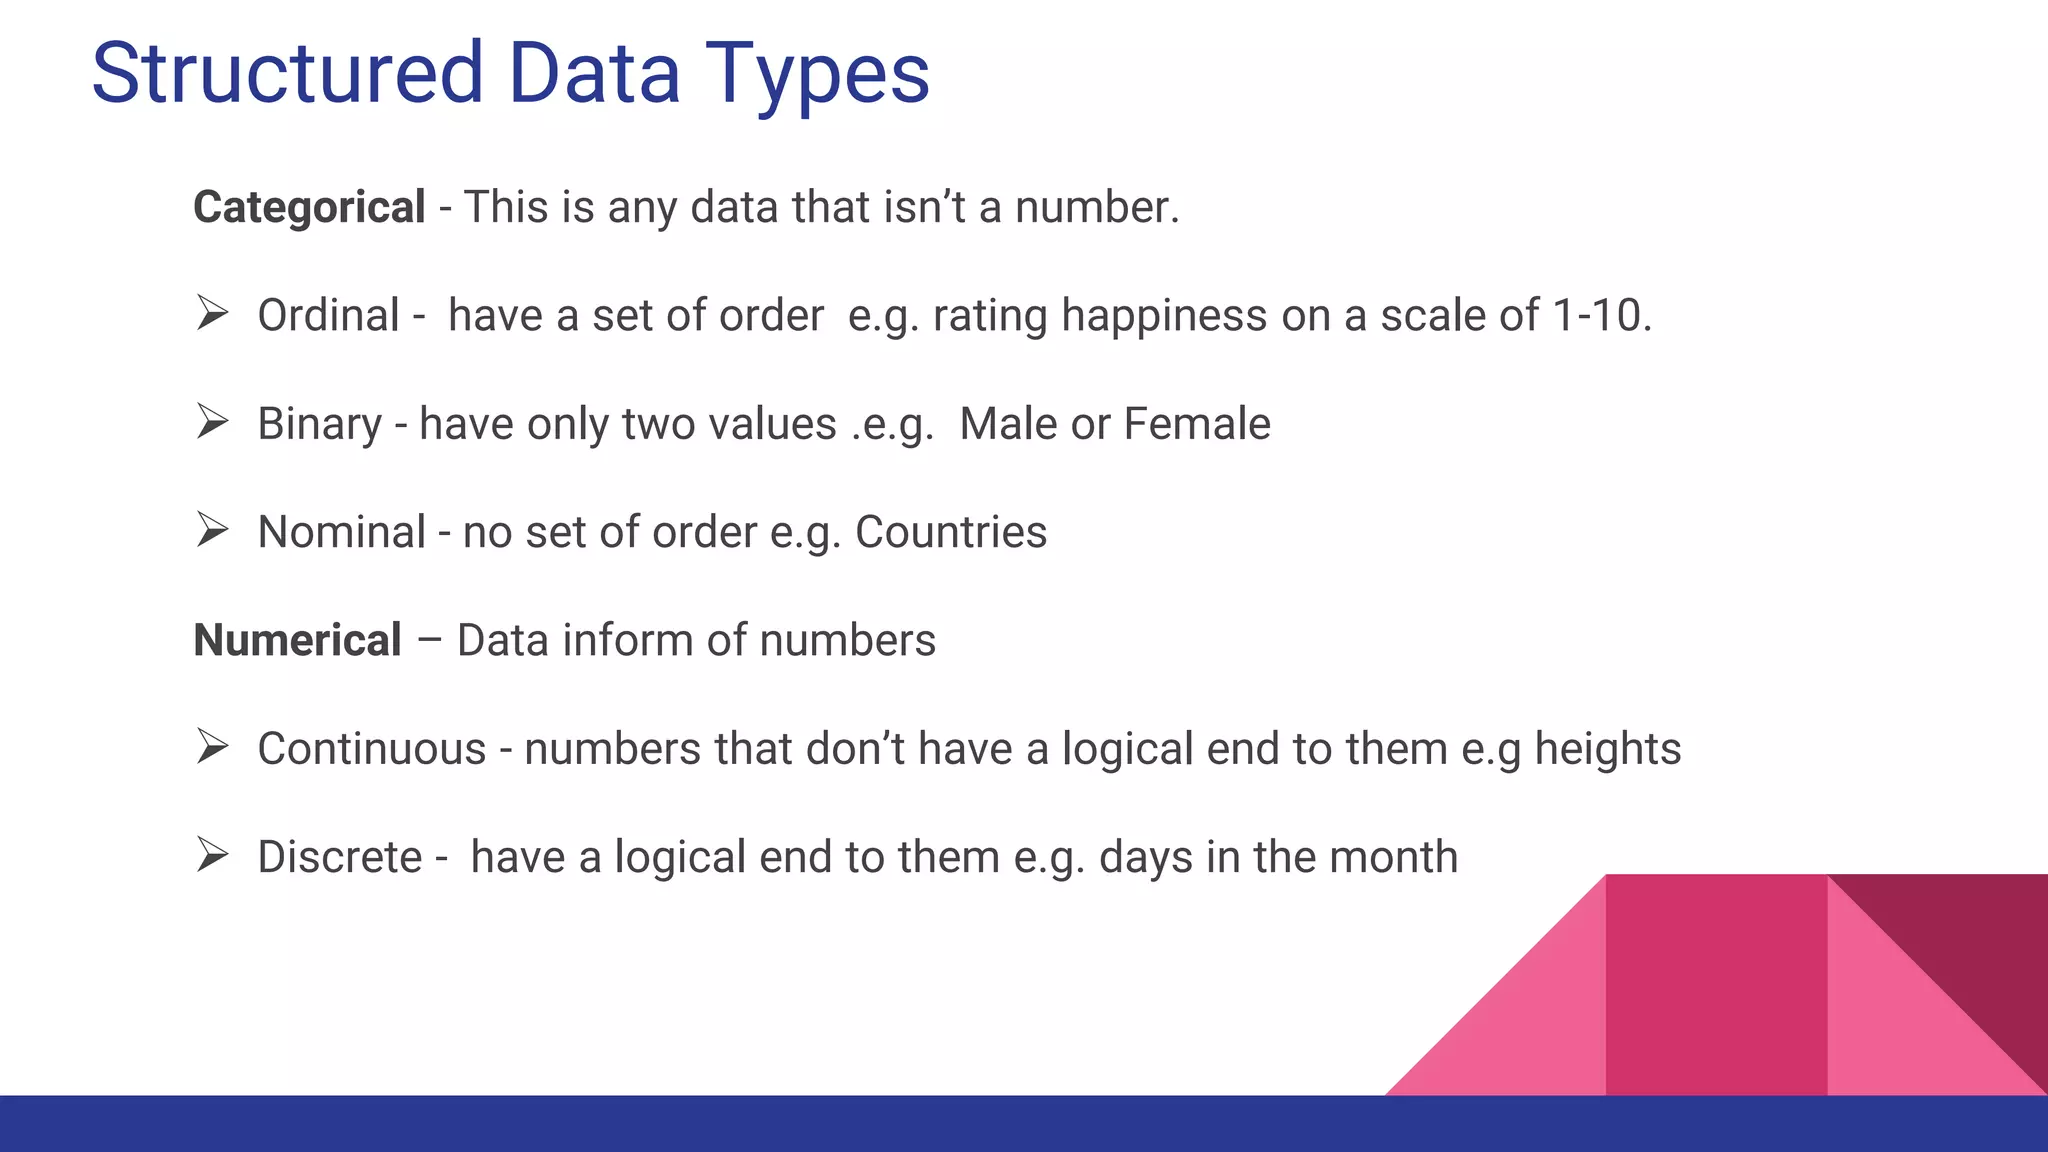
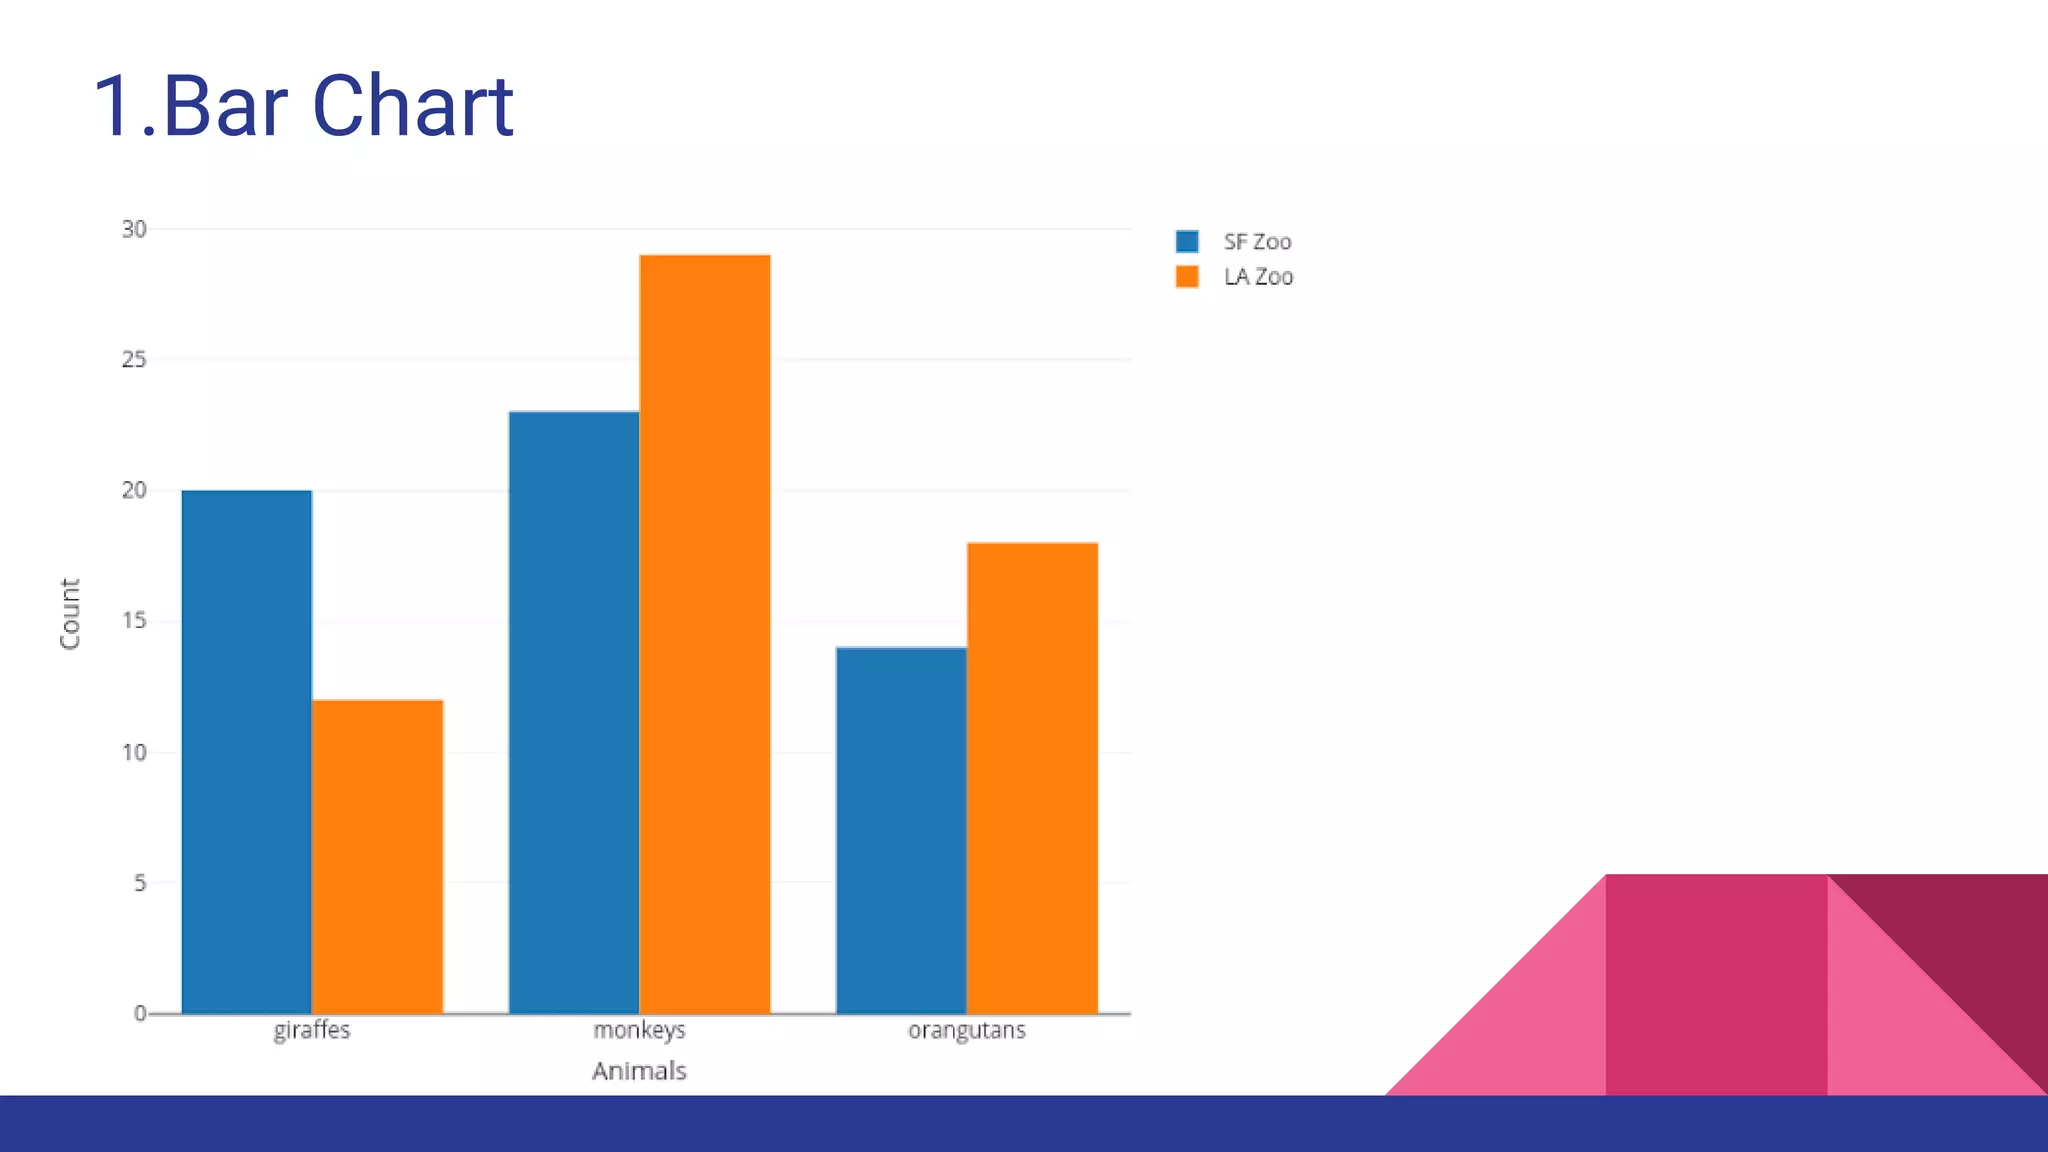
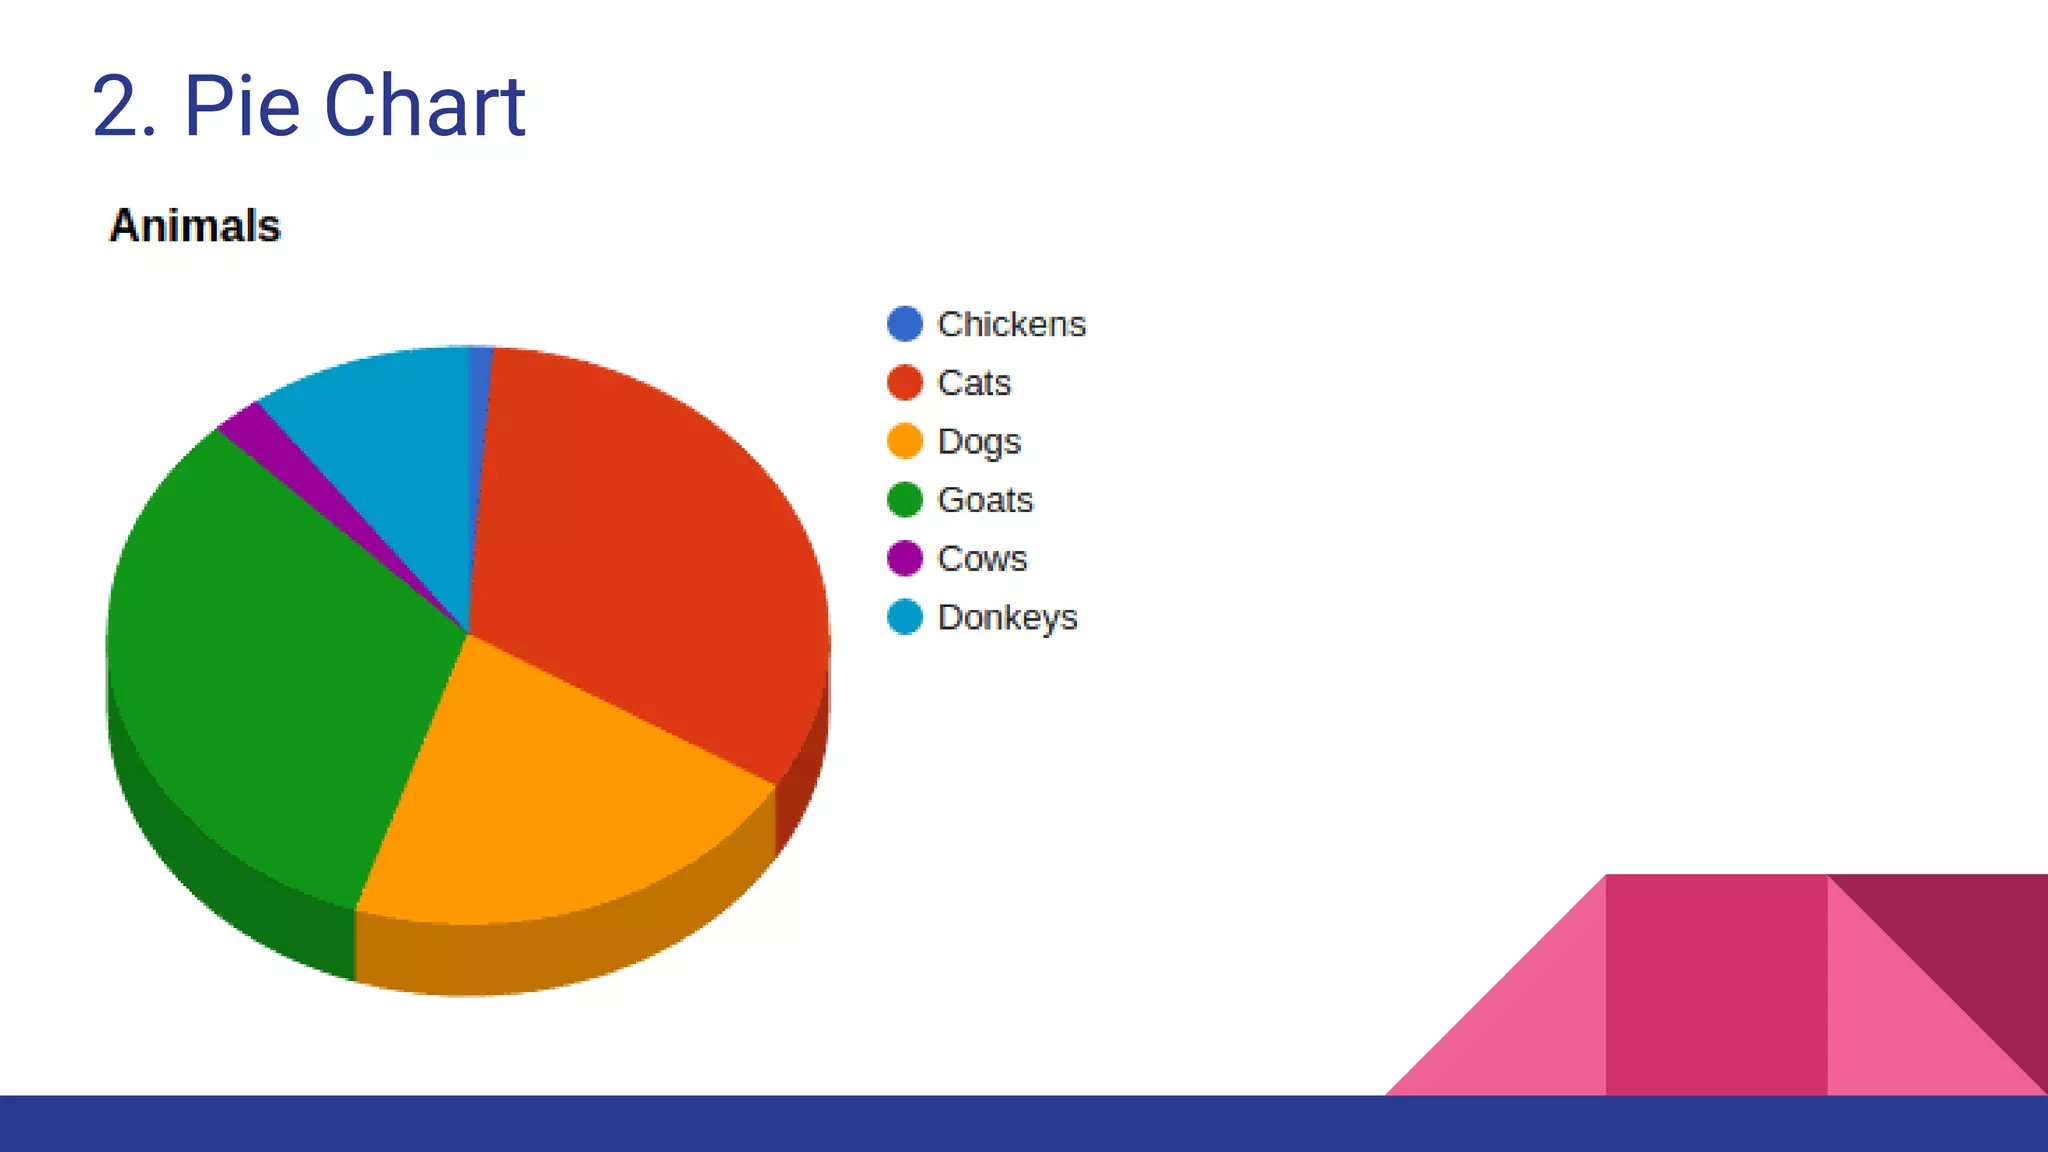
EXPLOLATORY DATA ANALYSIS
Davis David
Data Scientist at ParrotAI
CONTENT:
1. Introduction to EDA
2. Importance of EDA
3. Data Types
4. Python Packages for EDA
5. List of Graphs
6. Practical EDA
1.INTRODUCTION TO EDA
 Exploratory Data Analysis refers to the critical process of performing
initial investigations on data so as to discover patterns, to spot
anomalies, to test hypothesis and to check assumptions with the help
of summary statistics and graphical representations.
It is a good practice to understand the data first and try to gather as
many insights from it.
2. IMPORTANCE OF EDA
Identifying the most important variables/features in your dataset.
Testing a hypothesis or checking assumptions related to the dataset.
To check the quality of data for further processing and cleaning.
Deliver data-driven insights to business stakeholders.
Verify expected relationships actually exist in the data.
To find unexpected structure or insights in the data.
Two Categories of Data
 Structured Data types
Example: csv file, excel file, database file
 Unstructured Data types
Examples: Images, videos, audio,
Data Types
Structured Data Types
Categorical - This is any data that isn’t a number.
 Ordinal - have a set of order e.g. rating happiness on a scale of 1-10.
 Binary - have only two values .e.g. Male or Female
 Nominal - no set of order e.g. Countries
Numerical – Data inform of numbers
 Continuous - numbers that don’t have a logical end to them e.g heights
 Discrete - have a logical end to them e.g. days in the month
Python Packages for EDA
1.Bar Chart
2. Pie Chart
3.Histogram
4.Scatter Plot
5. Heatmap
6. Box Plot
7. Line Plot
8. Violin Plot
9.Bubble Plot
10. 3D Scatter Plot
Exploratory data analysis with Python

Exploratory data analysis with Python

  • 1.
    EXPLOLATORY DATA ANALYSIS DavisDavid Data Scientist at ParrotAI
  • 2.
    CONTENT: 1. Introduction toEDA 2. Importance of EDA 3. Data Types 4. Python Packages for EDA 5. List of Graphs 6. Practical EDA
  • 3.
    1.INTRODUCTION TO EDA Exploratory Data Analysis refers to the critical process of performing initial investigations on data so as to discover patterns, to spot anomalies, to test hypothesis and to check assumptions with the help of summary statistics and graphical representations. It is a good practice to understand the data first and try to gather as many insights from it.
  • 4.
    2. IMPORTANCE OFEDA Identifying the most important variables/features in your dataset. Testing a hypothesis or checking assumptions related to the dataset. To check the quality of data for further processing and cleaning. Deliver data-driven insights to business stakeholders. Verify expected relationships actually exist in the data. To find unexpected structure or insights in the data.
  • 8.
    Two Categories ofData  Structured Data types Example: csv file, excel file, database file  Unstructured Data types Examples: Images, videos, audio,
  • 9.
  • 10.
    Structured Data Types Categorical- This is any data that isn’t a number.  Ordinal - have a set of order e.g. rating happiness on a scale of 1-10.  Binary - have only two values .e.g. Male or Female  Nominal - no set of order e.g. Countries Numerical – Data inform of numbers  Continuous - numbers that don’t have a logical end to them e.g heights  Discrete - have a logical end to them e.g. days in the month
  • 11.
  • 12.
  • 13.
  • 14.
  • 15.
  • 16.
  • 17.
  • 18.
  • 19.
  • 20.
  • 21.