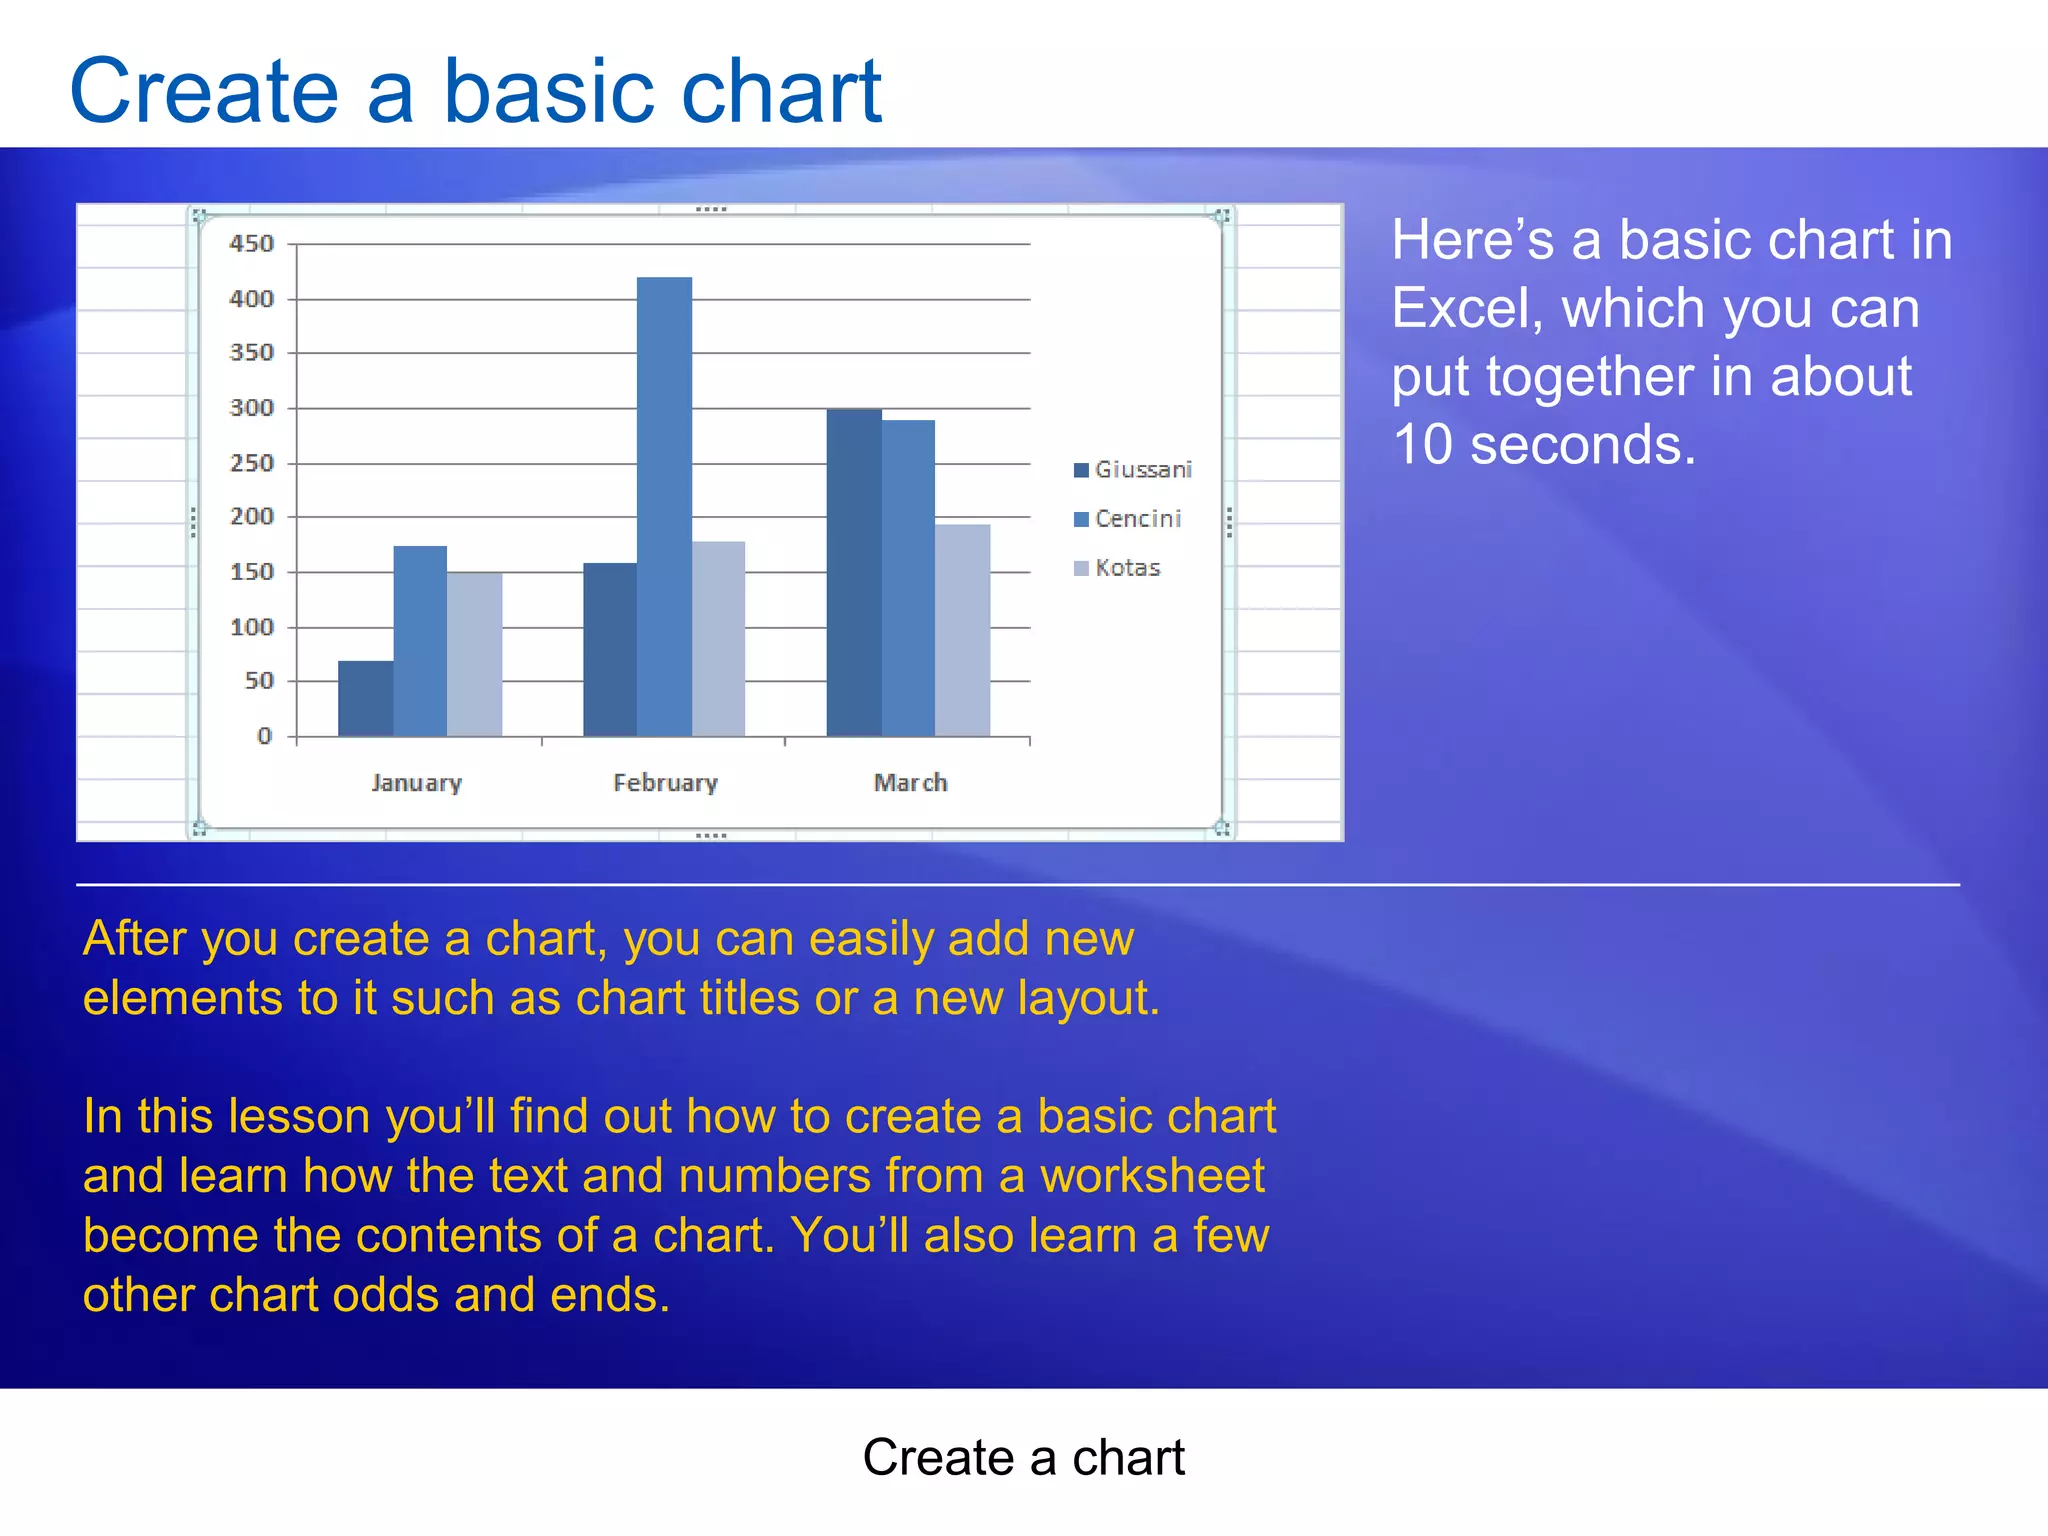
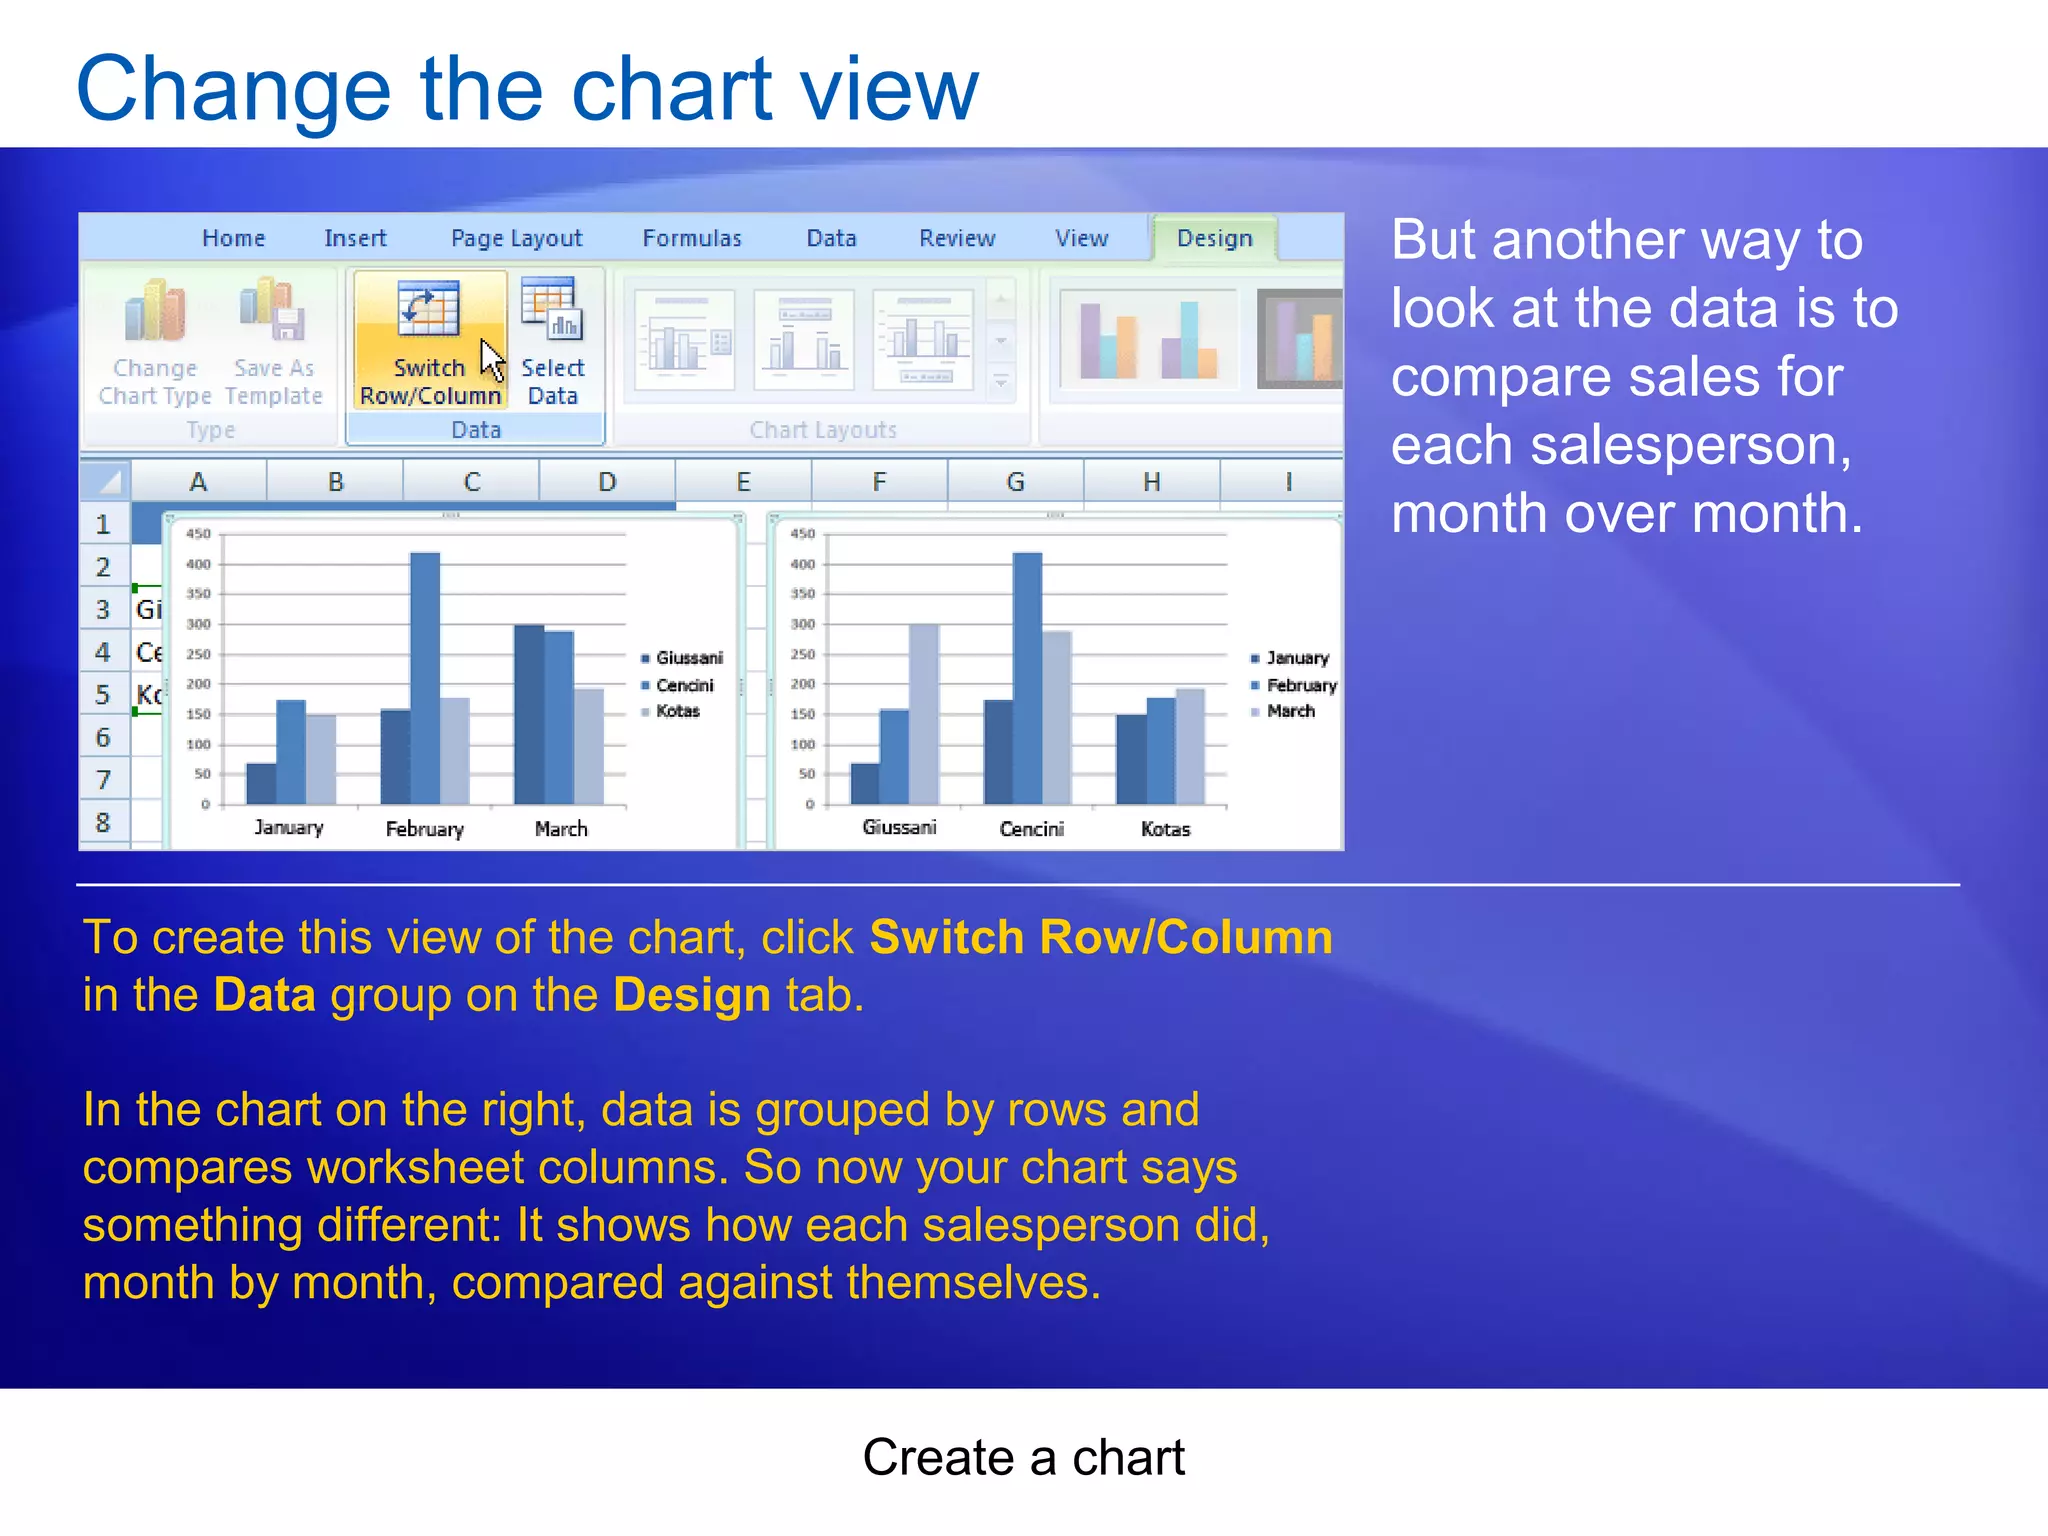
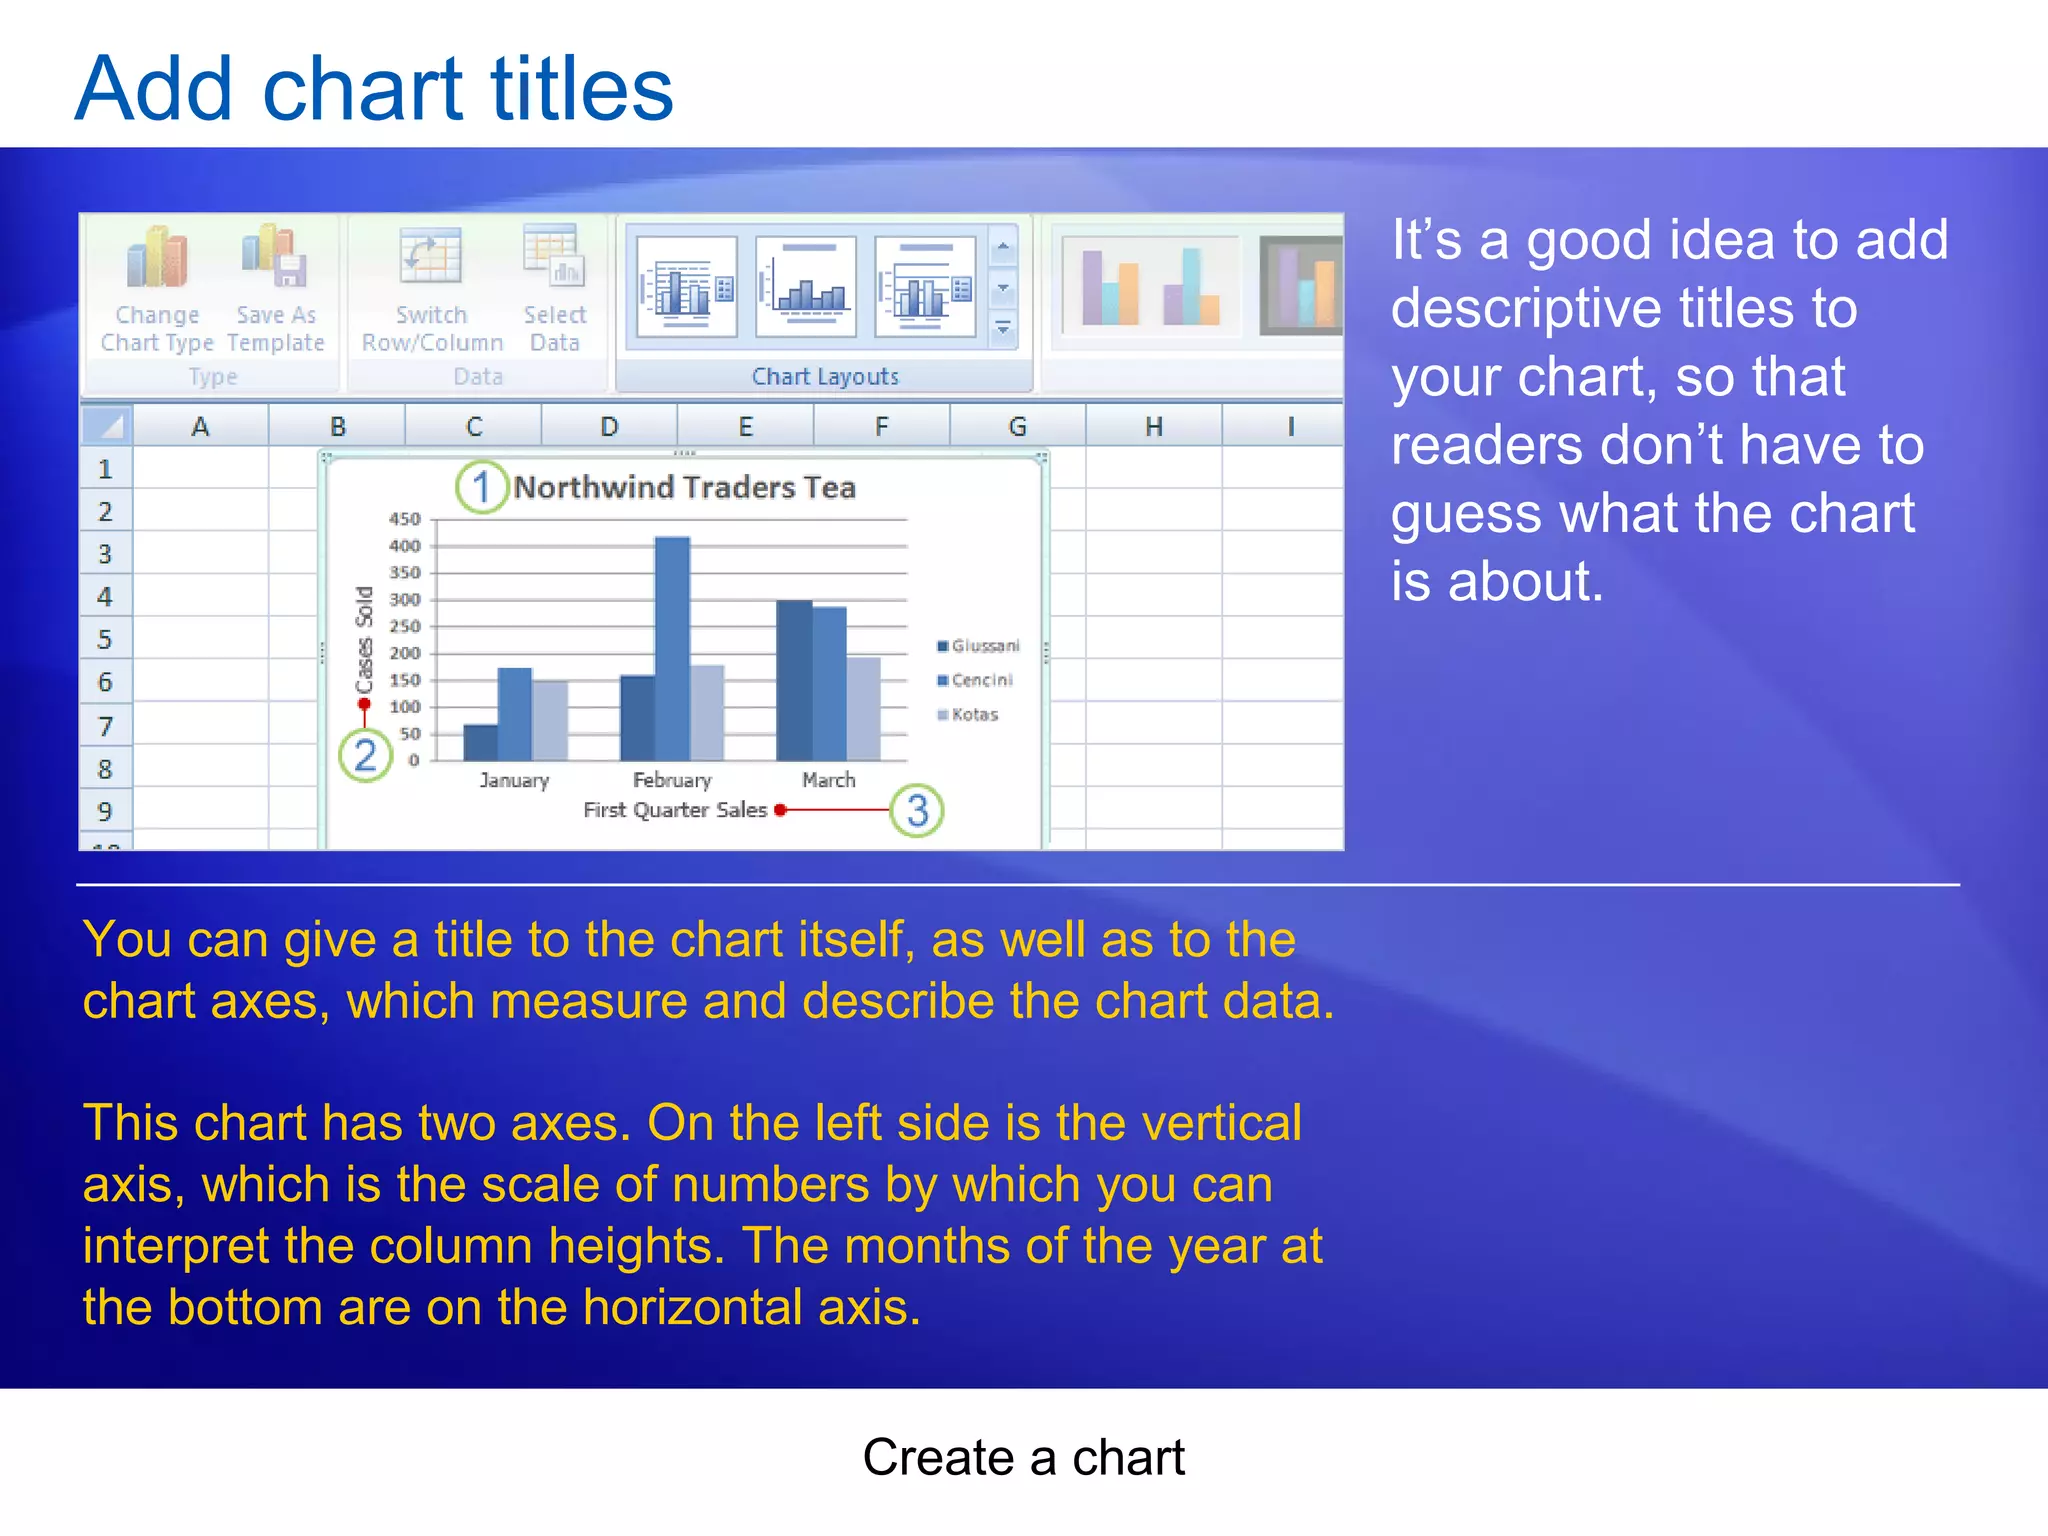
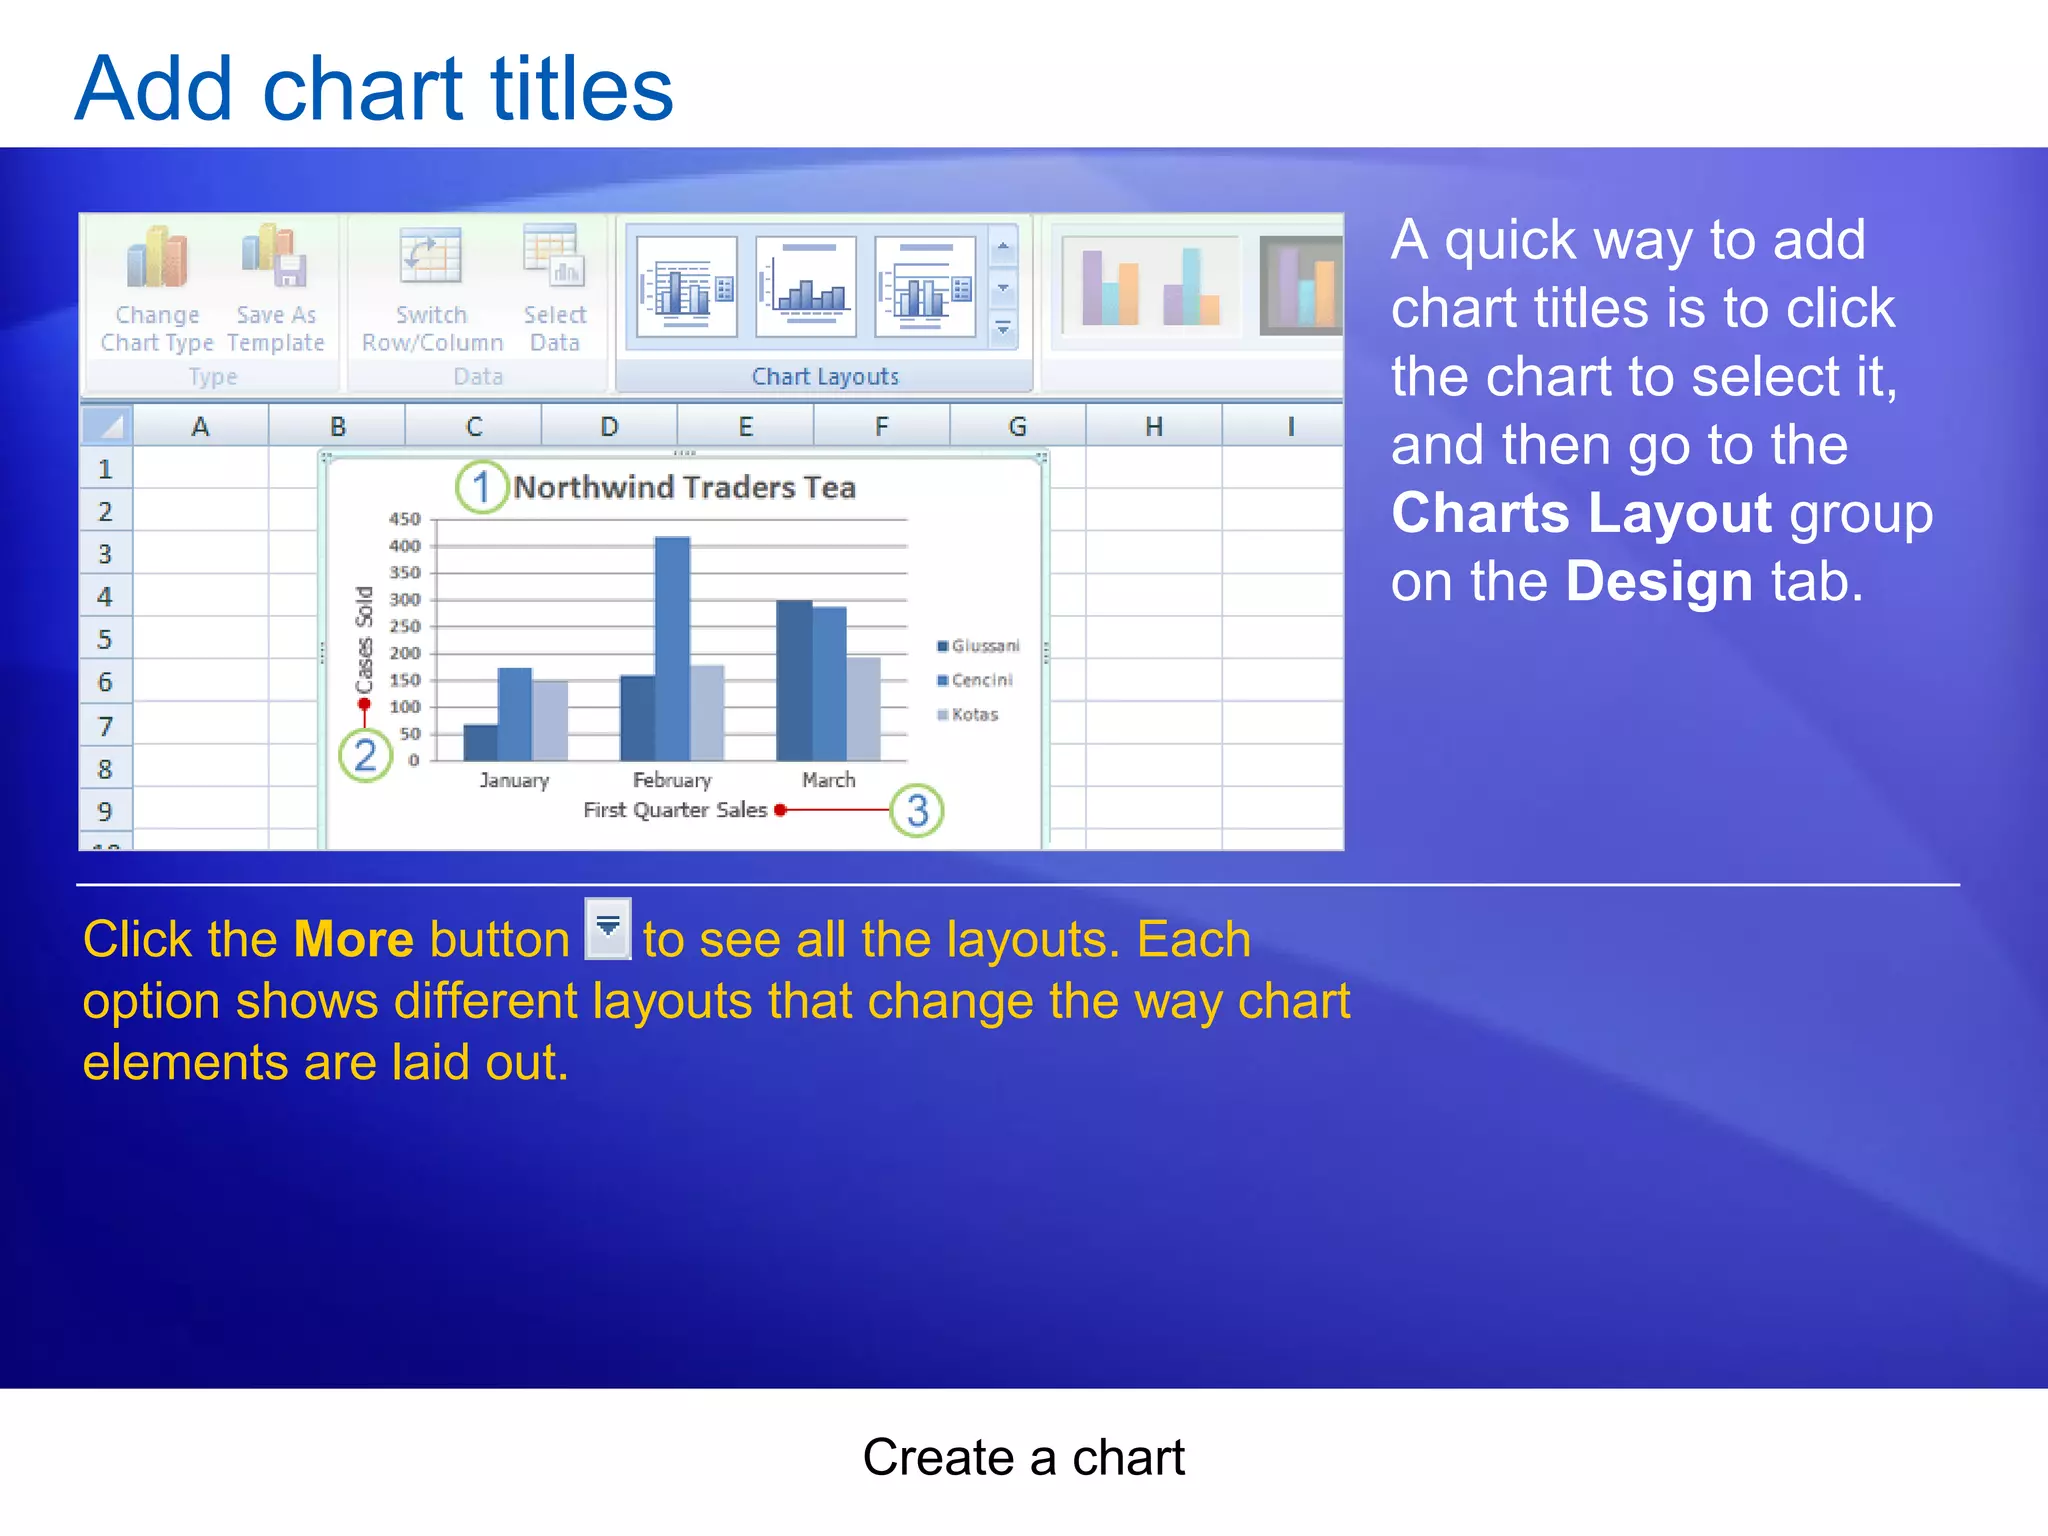
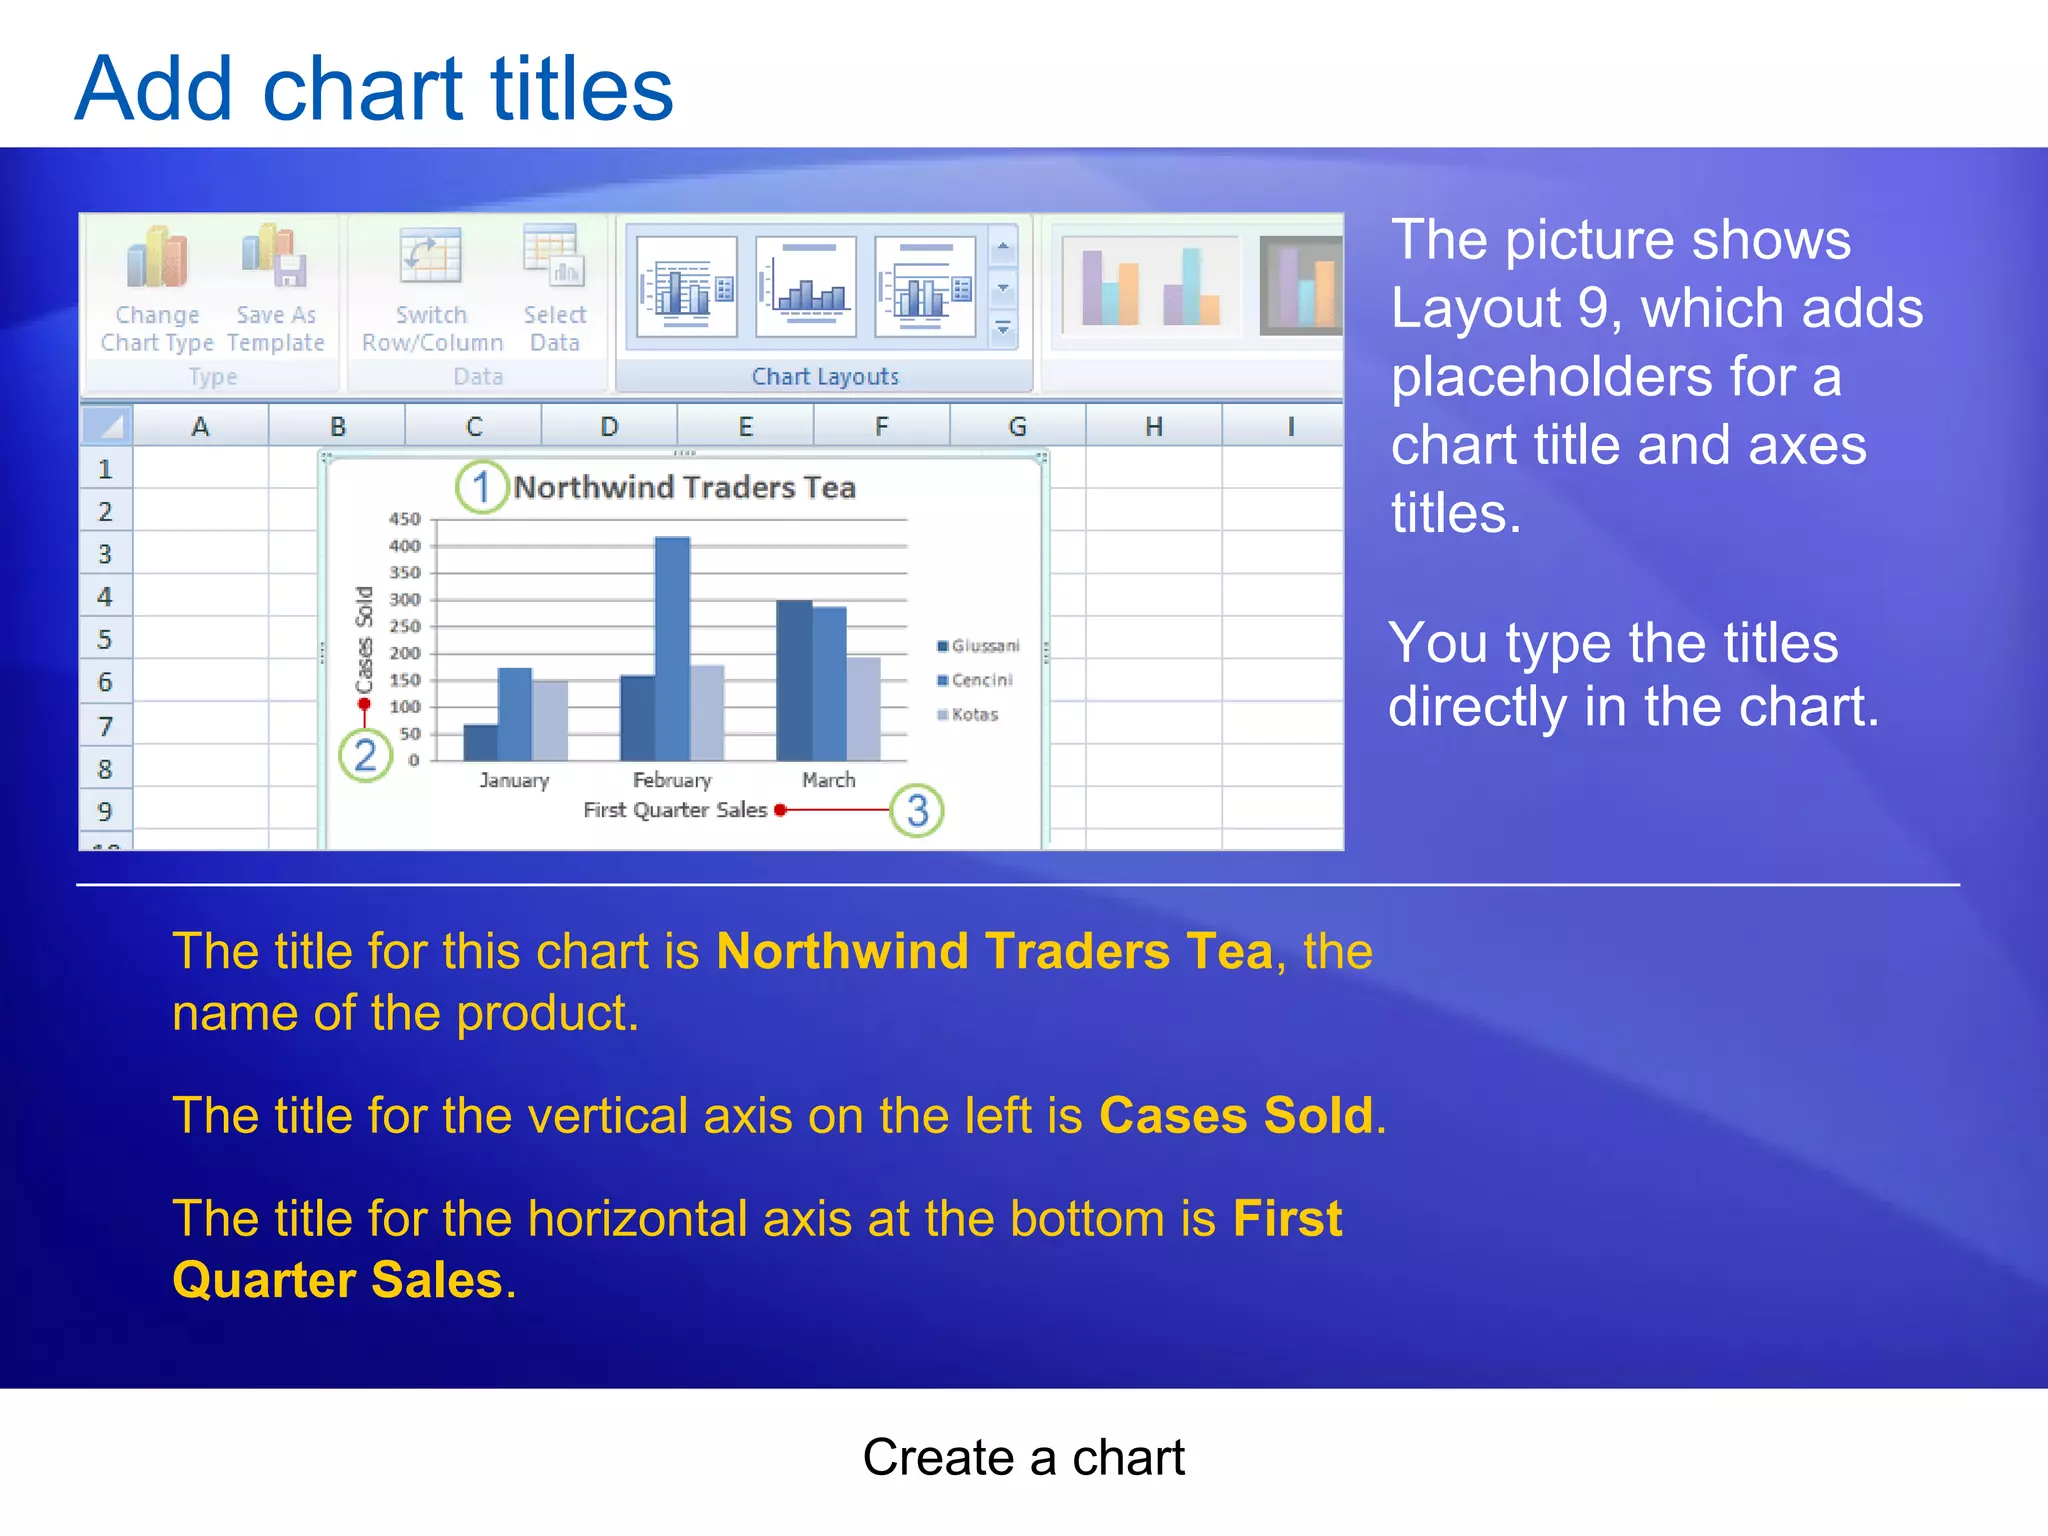
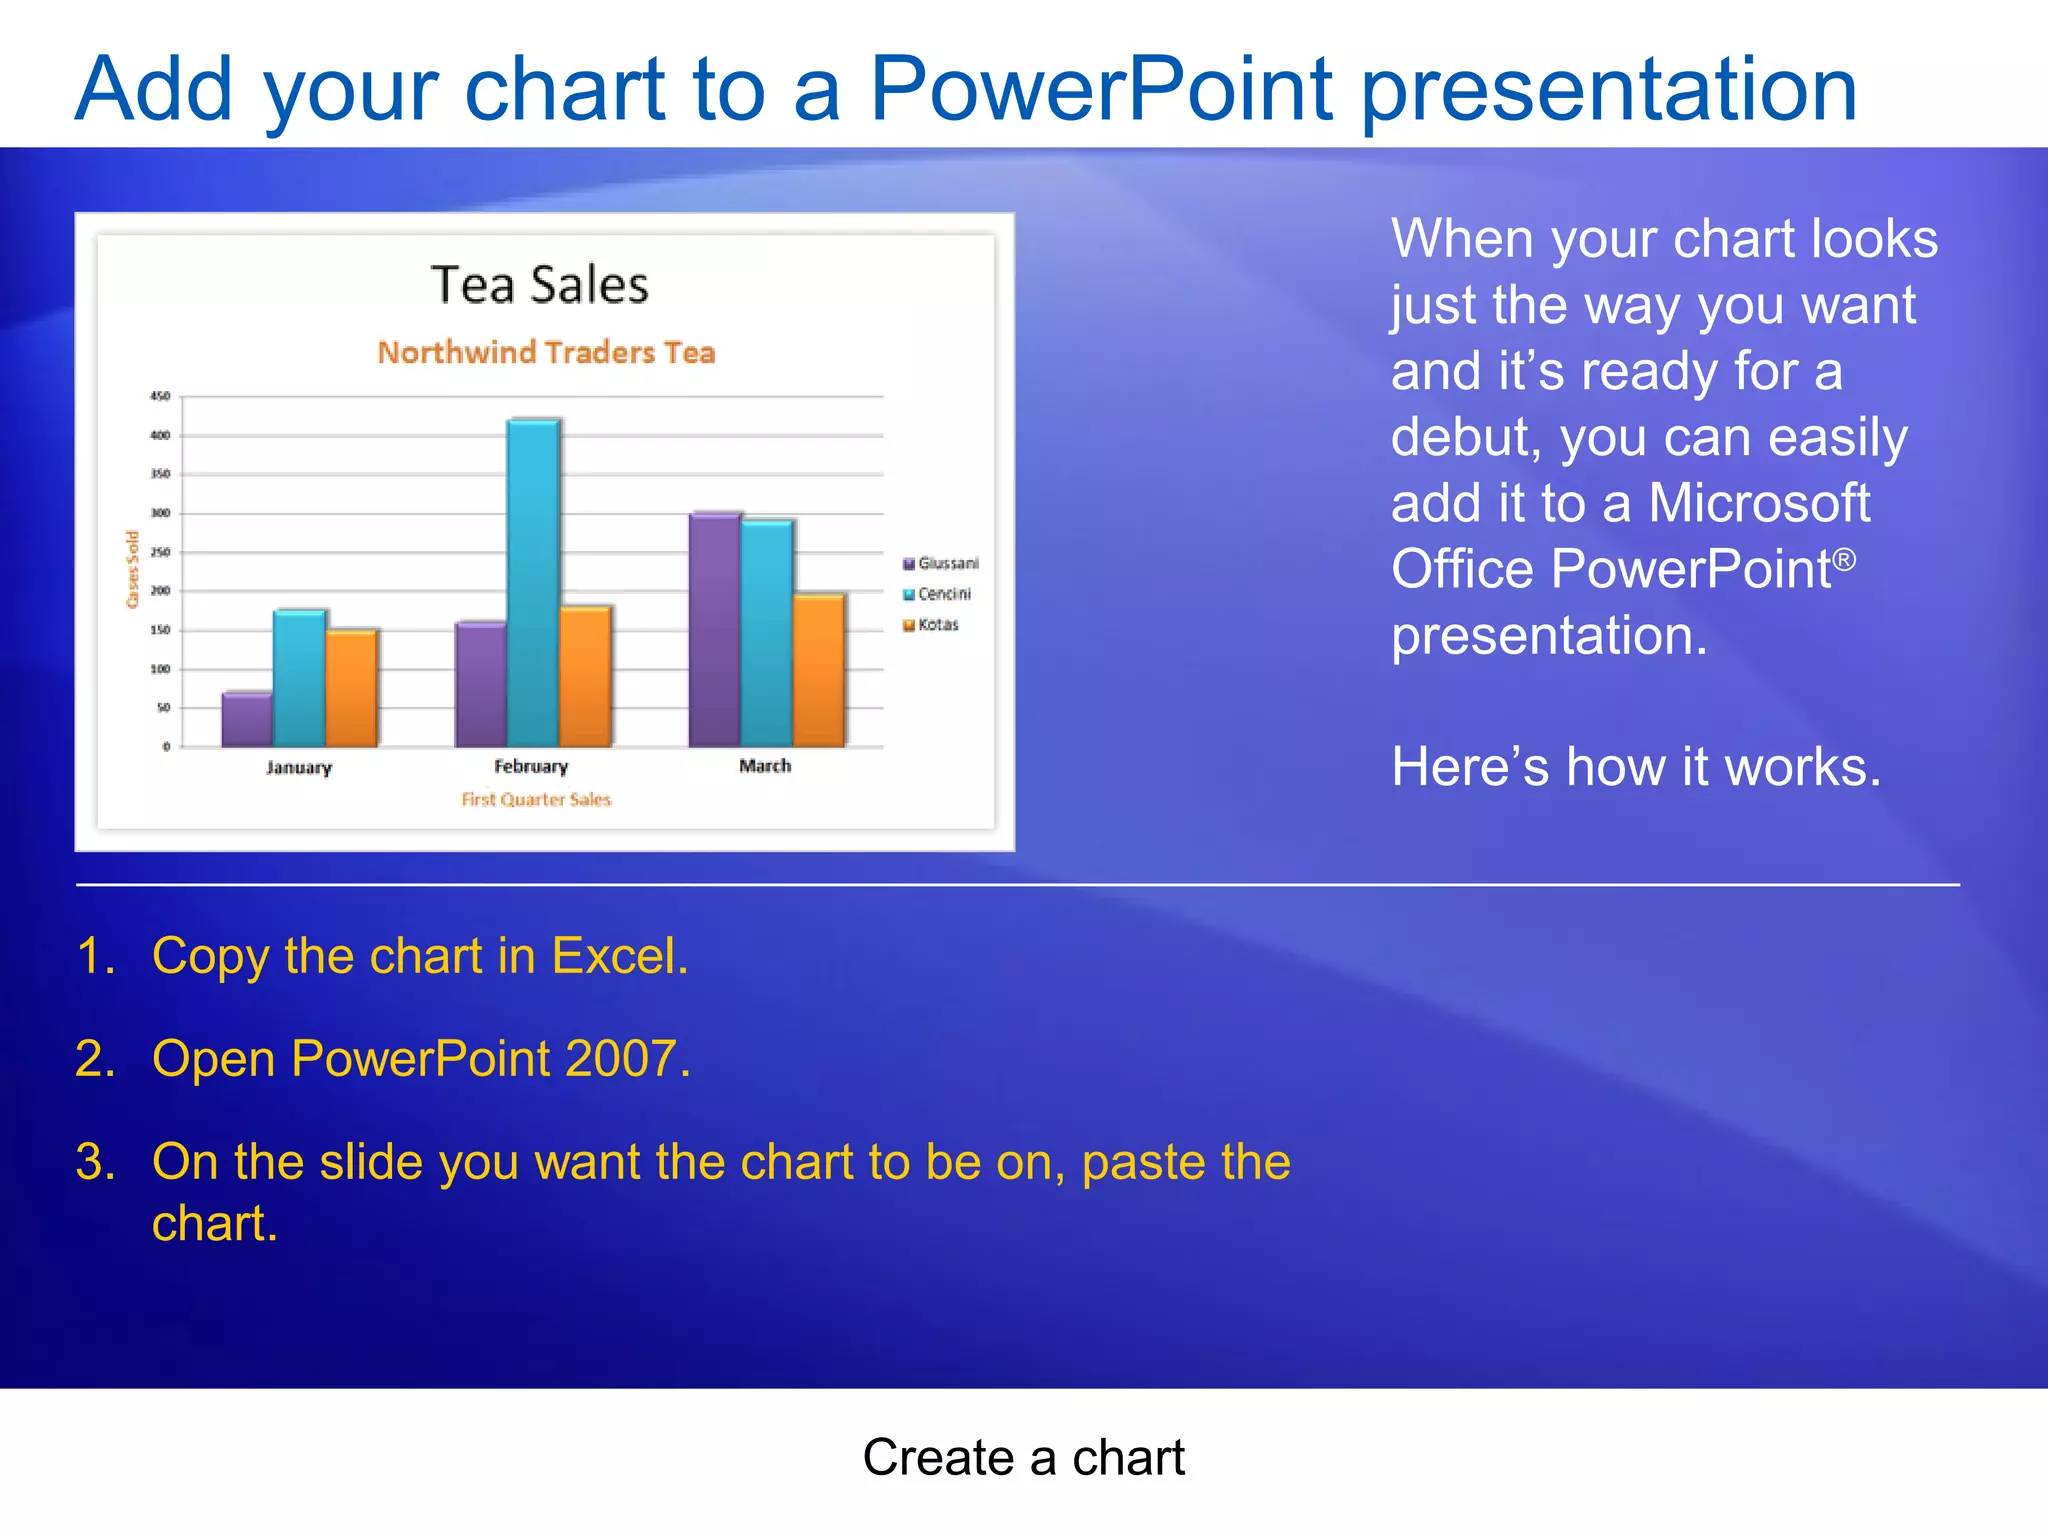
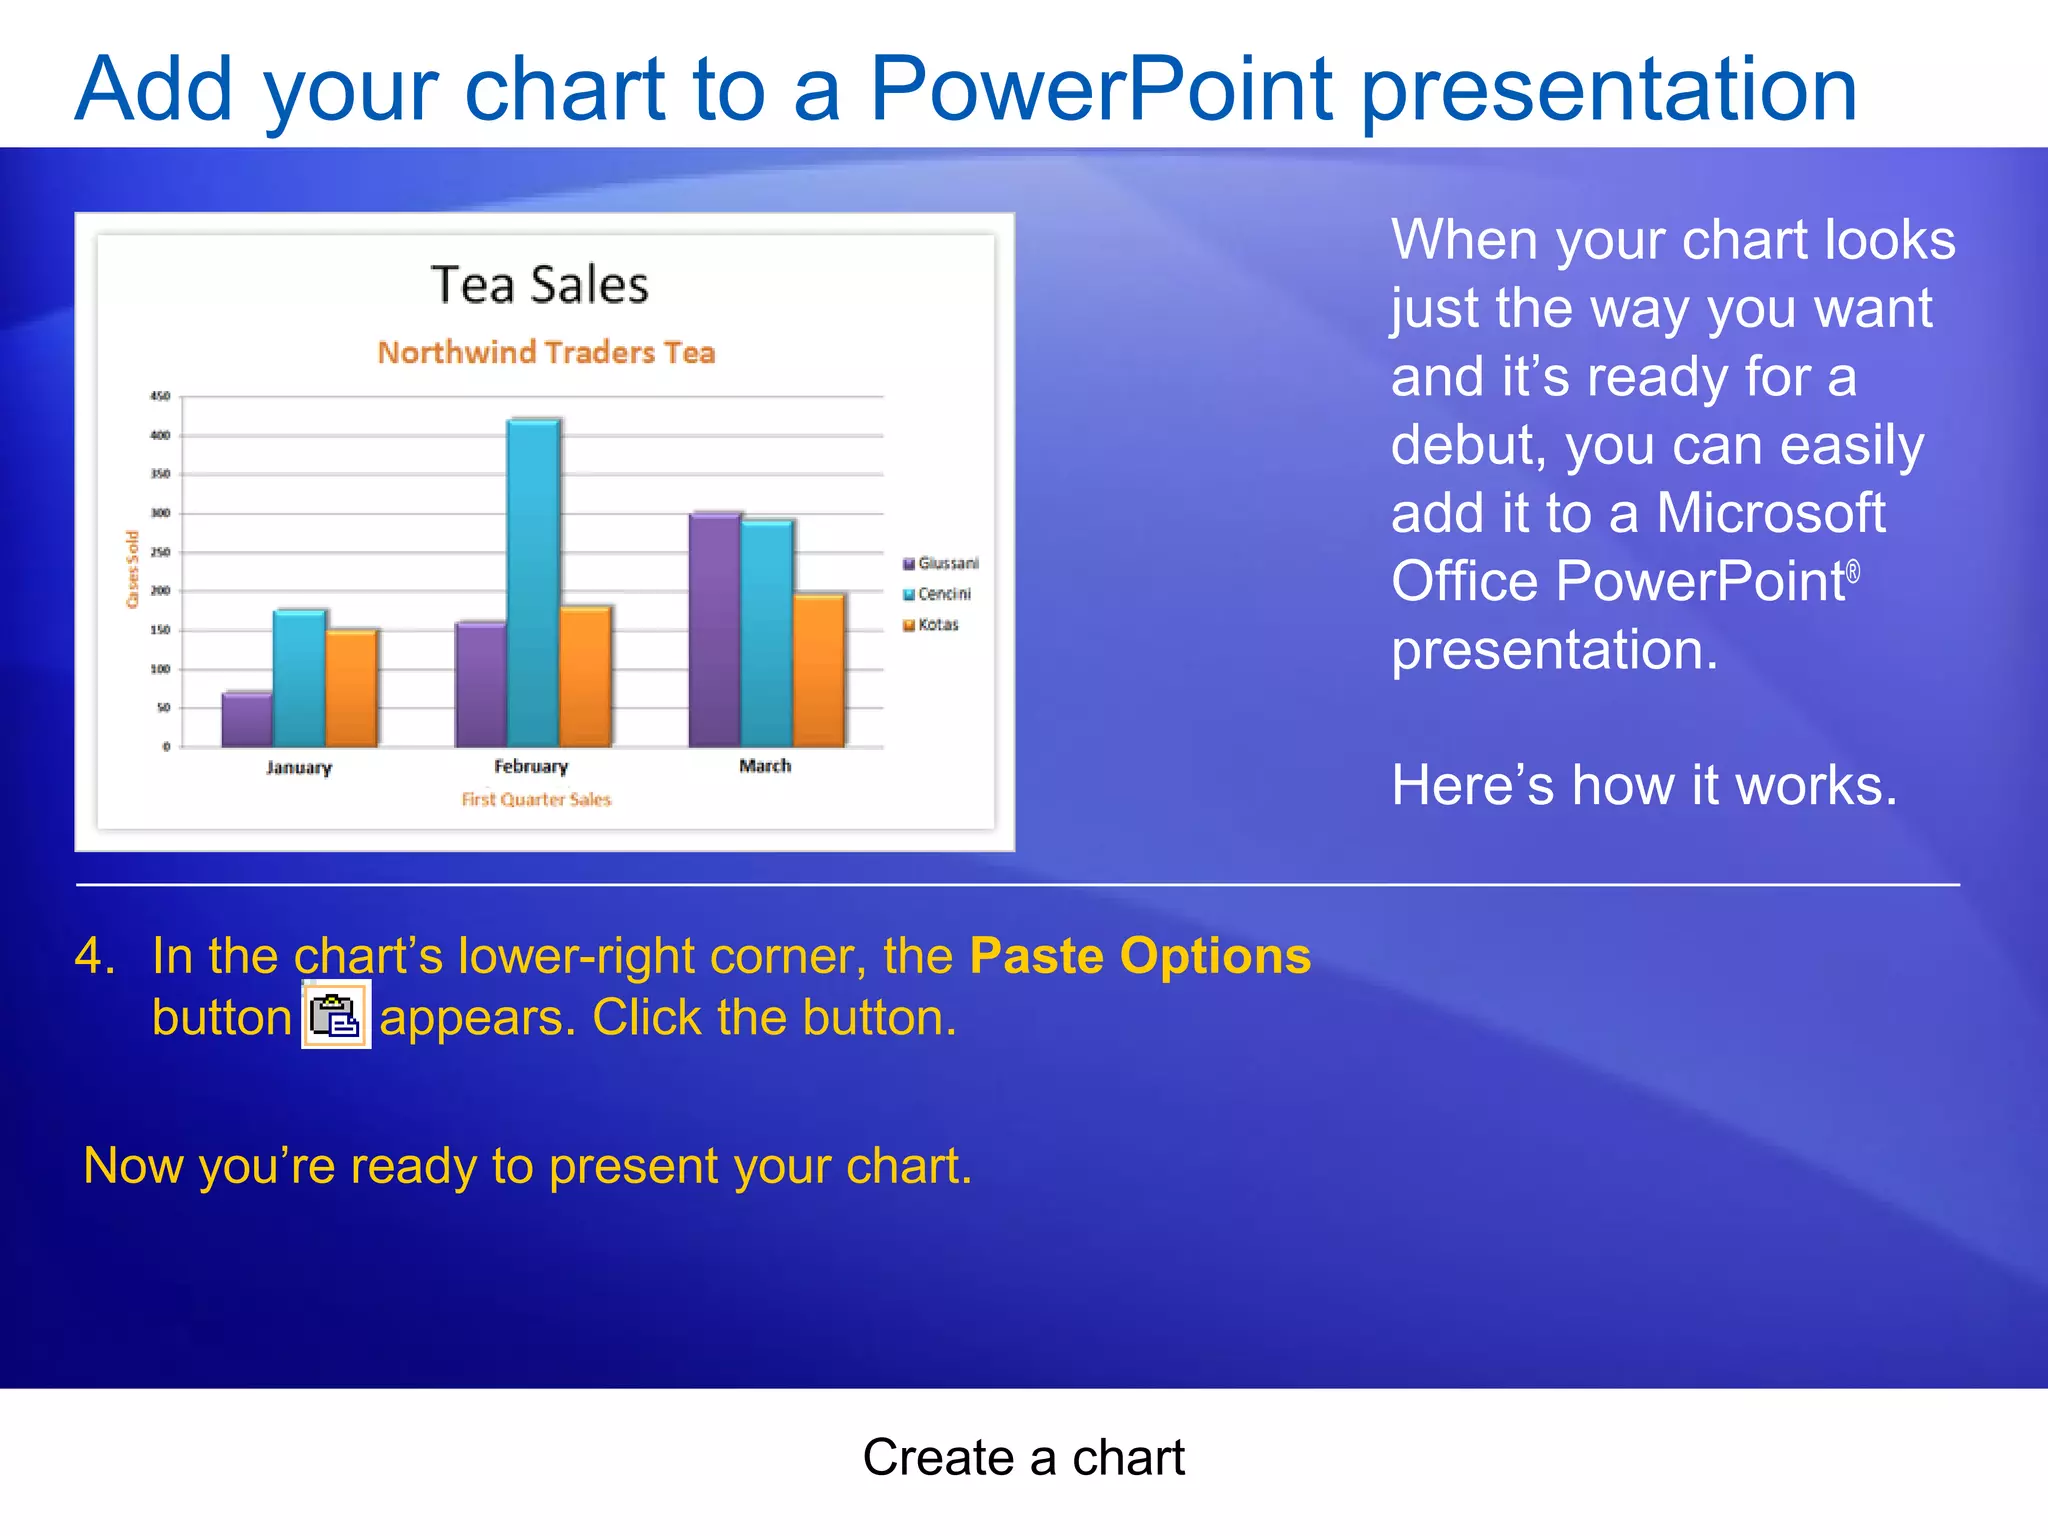
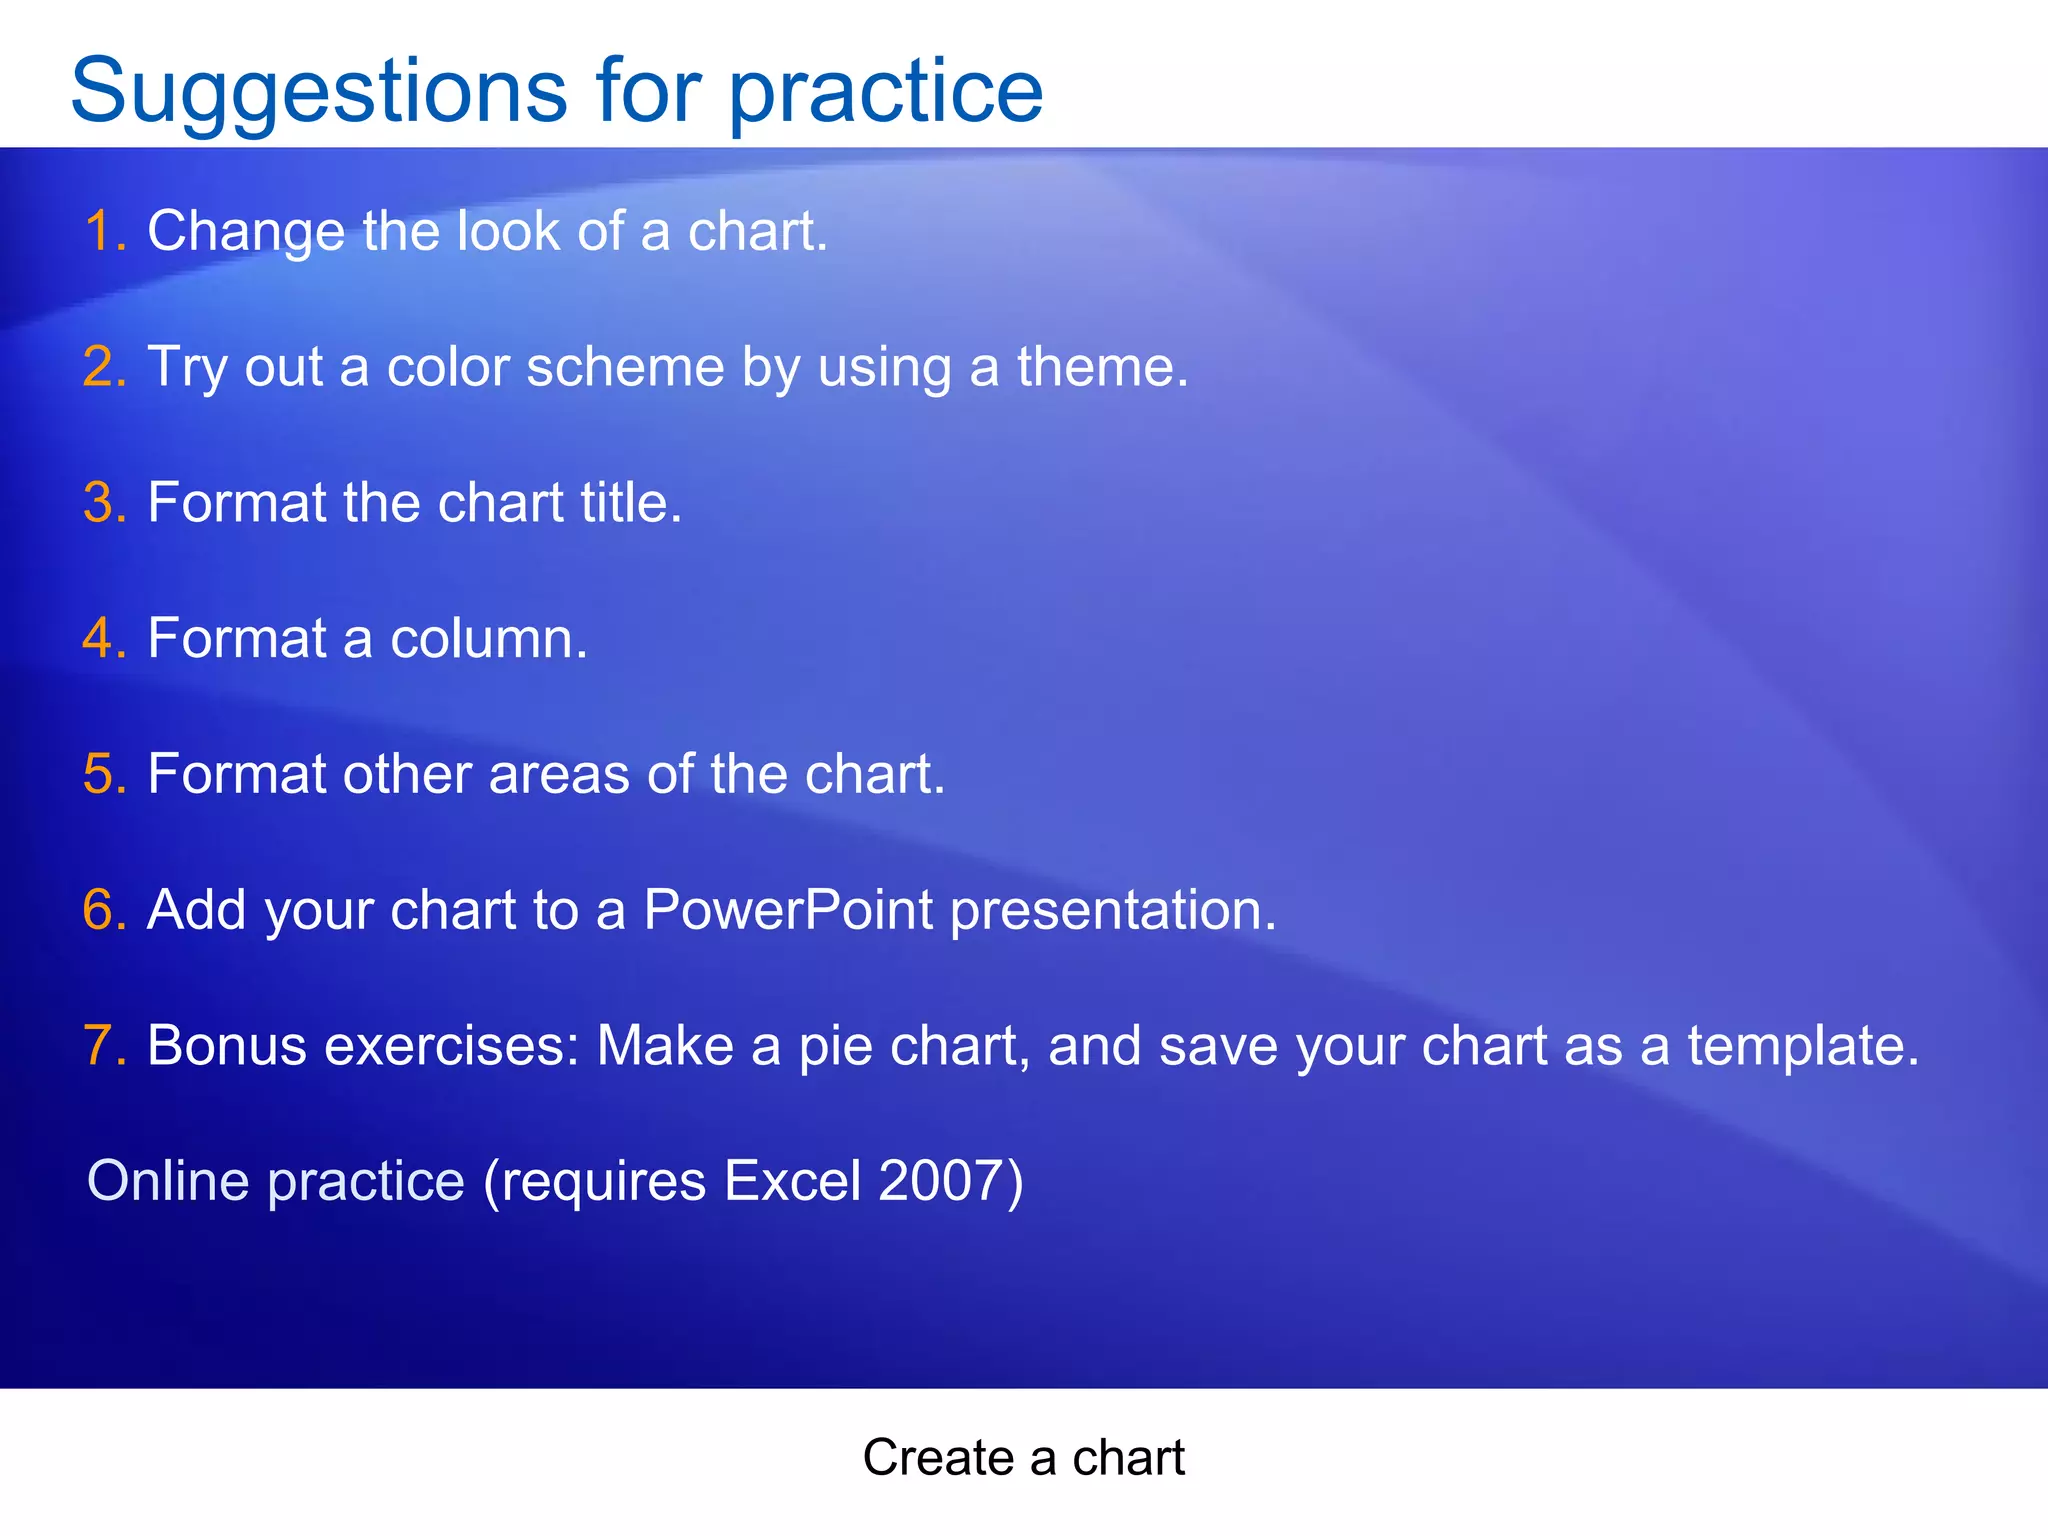
This document provides a summary of a training course on creating charts in Microsoft Excel 2007. The course contains two lessons: creating a basic chart and customizing charts. The first lesson explains how to select data and insert a chart, change the chart type and view, and add titles. The second lesson covers customizing charts by changing styles and colors, formatting titles, formatting individual data series, and adding charts to PowerPoint presentations. The document includes examples and suggestions for practice.