Download as PDF, PPTX


![Start ElasticSearch
[root@elk-stack ~]# systemctl daemon-reload
[root@elk-stack ~]# systemctl start elasticsearch
[root@elk-stack ~]# systemctl enable elasticsearch
[root@elk-stack ~]# curl -XGET ‘http://localhost:9200/_cat/indices?v’
health status index uuid pri rep docs.count docs.deleted store.size pri.store.size
yellow open stat-20180603 byH89tWFQSS_R9kS_QPGPw 5 1 54822544 0 6.9gb 6.9gb
yellow open stat-20180616 qZYSua4CQDa18GGMc8uiHQ 5 1 51830338 0 6.6gb 6.6gb
yellow open stat-20180604 PYdGUxX7SZ2aaFRV-ng4NQ 5 1 57828976 0 7.3gb 7.3gb
yellow open stat-20180630 FwrBuf6FQ-6SlyZhknATLQ 5 1 50014372 0 6.4gb 6.4gb
yellow open stat-20180618 _Nloca3jROCQ2vChWmDoGw 5 1 54976264 0 7gb 7gb
yellow open stat-20180526 ObGvcFbfTDuuk_MtZNlCQA 5 1 51836183 0 6.6gb 6.6gb
yellow open stat-20180615 t_CxQoauRUiVRTaJRPz2eQ 5 1 55490519 0 7gb 7gb
To check what are the indexes available in the ElasticSearch:](https://image.slidesharecdn.com/clee-180724052729/75/DIY-Netflow-Data-Analytic-with-ELK-Stack-by-CL-Lee-19-2048.jpg)
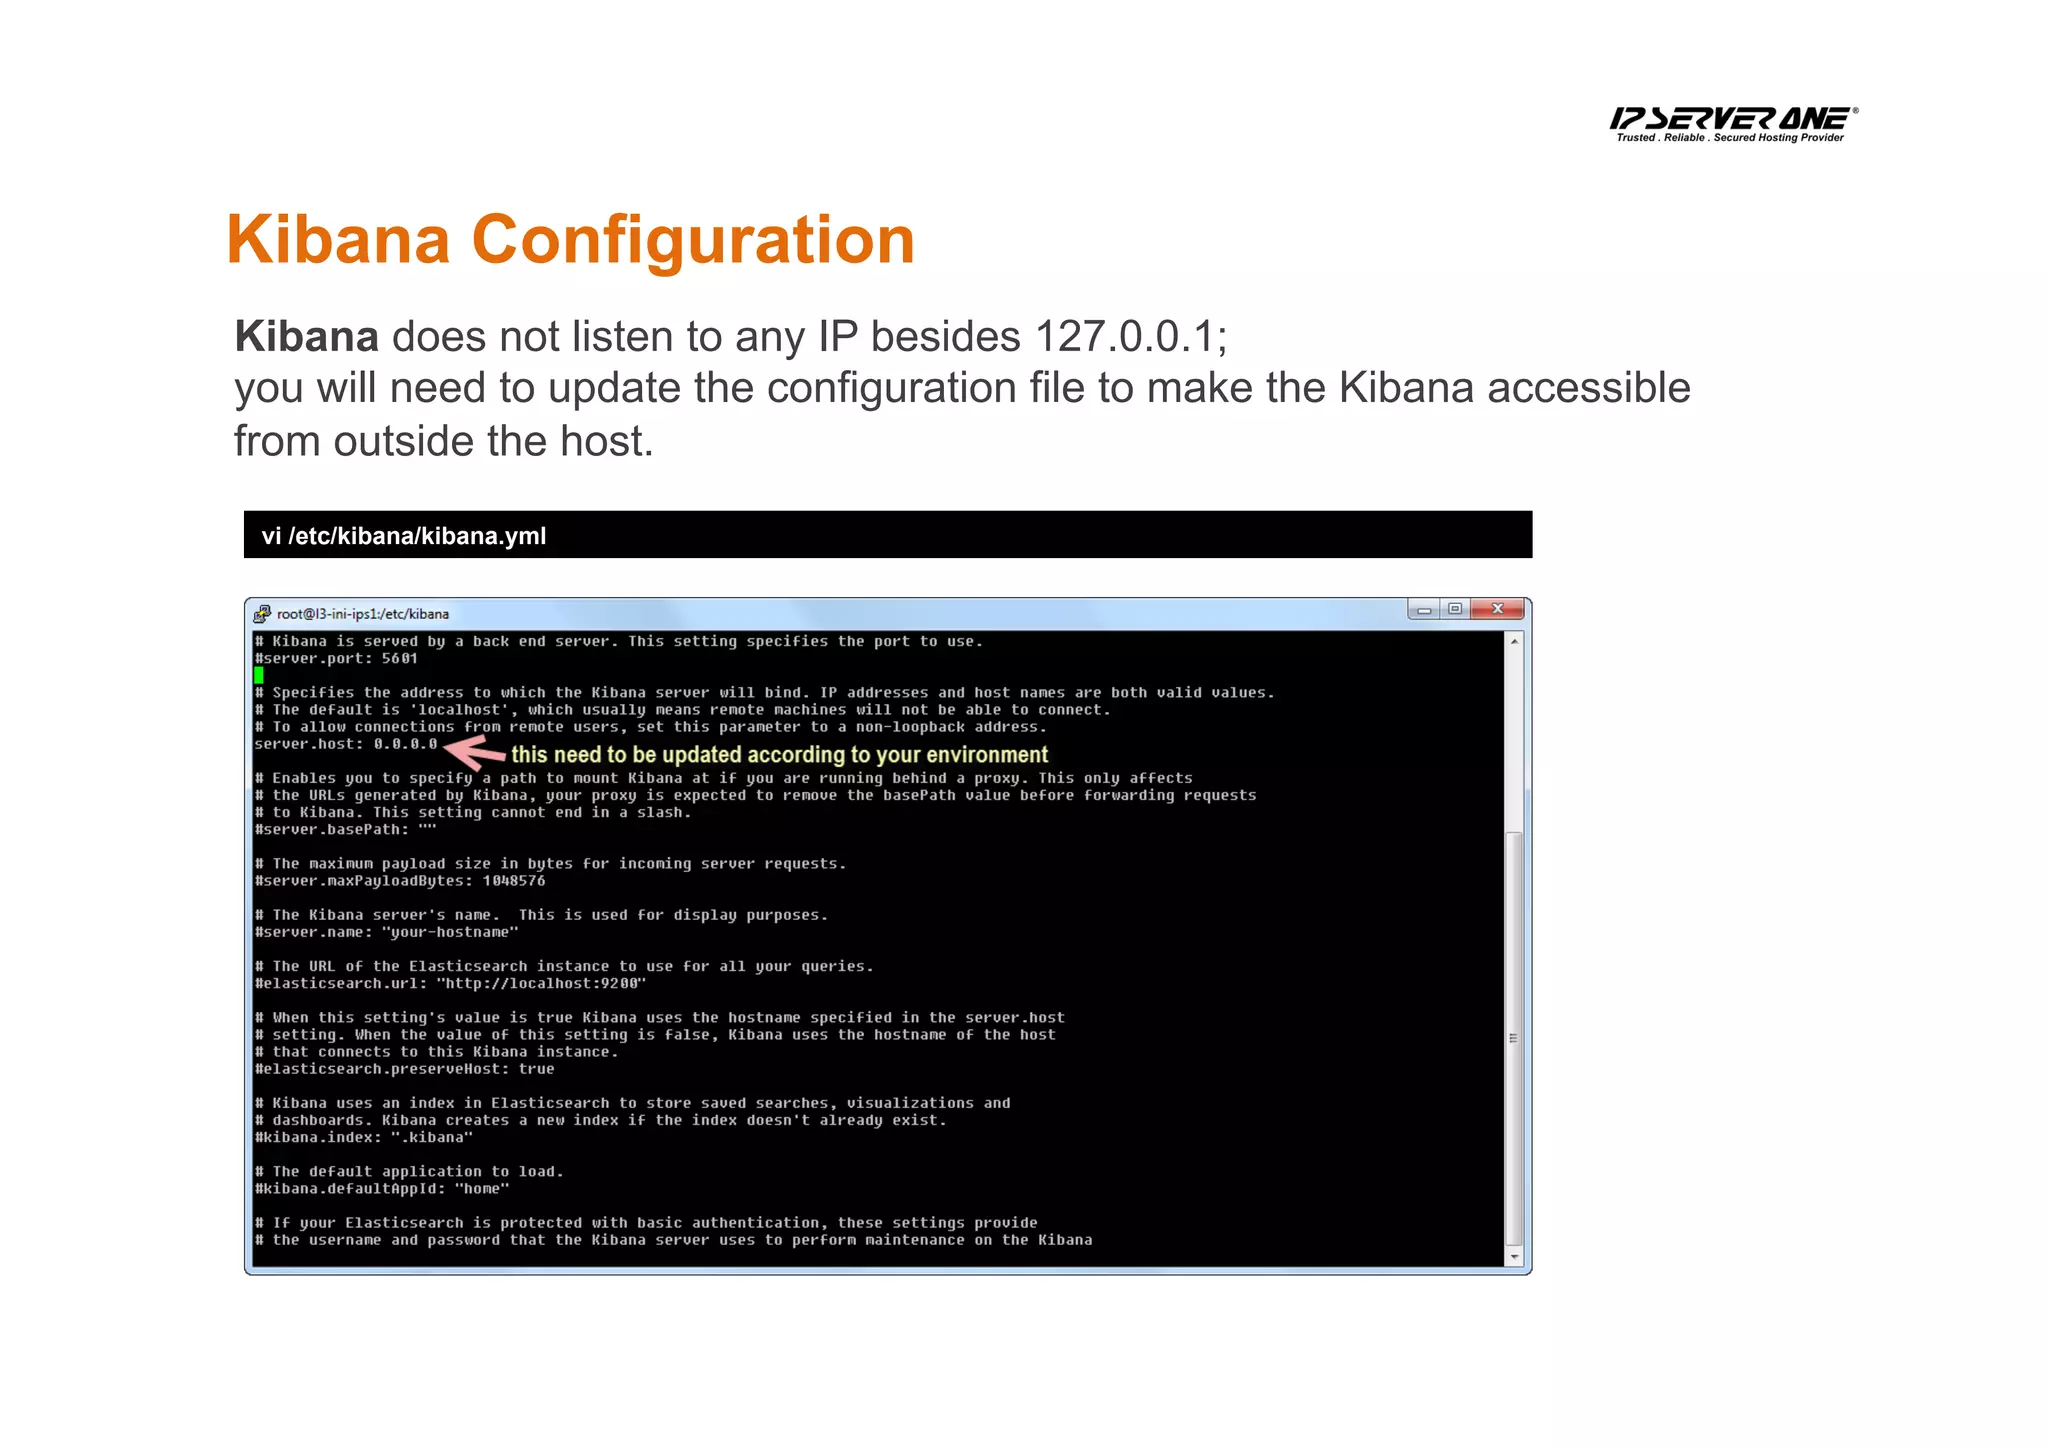
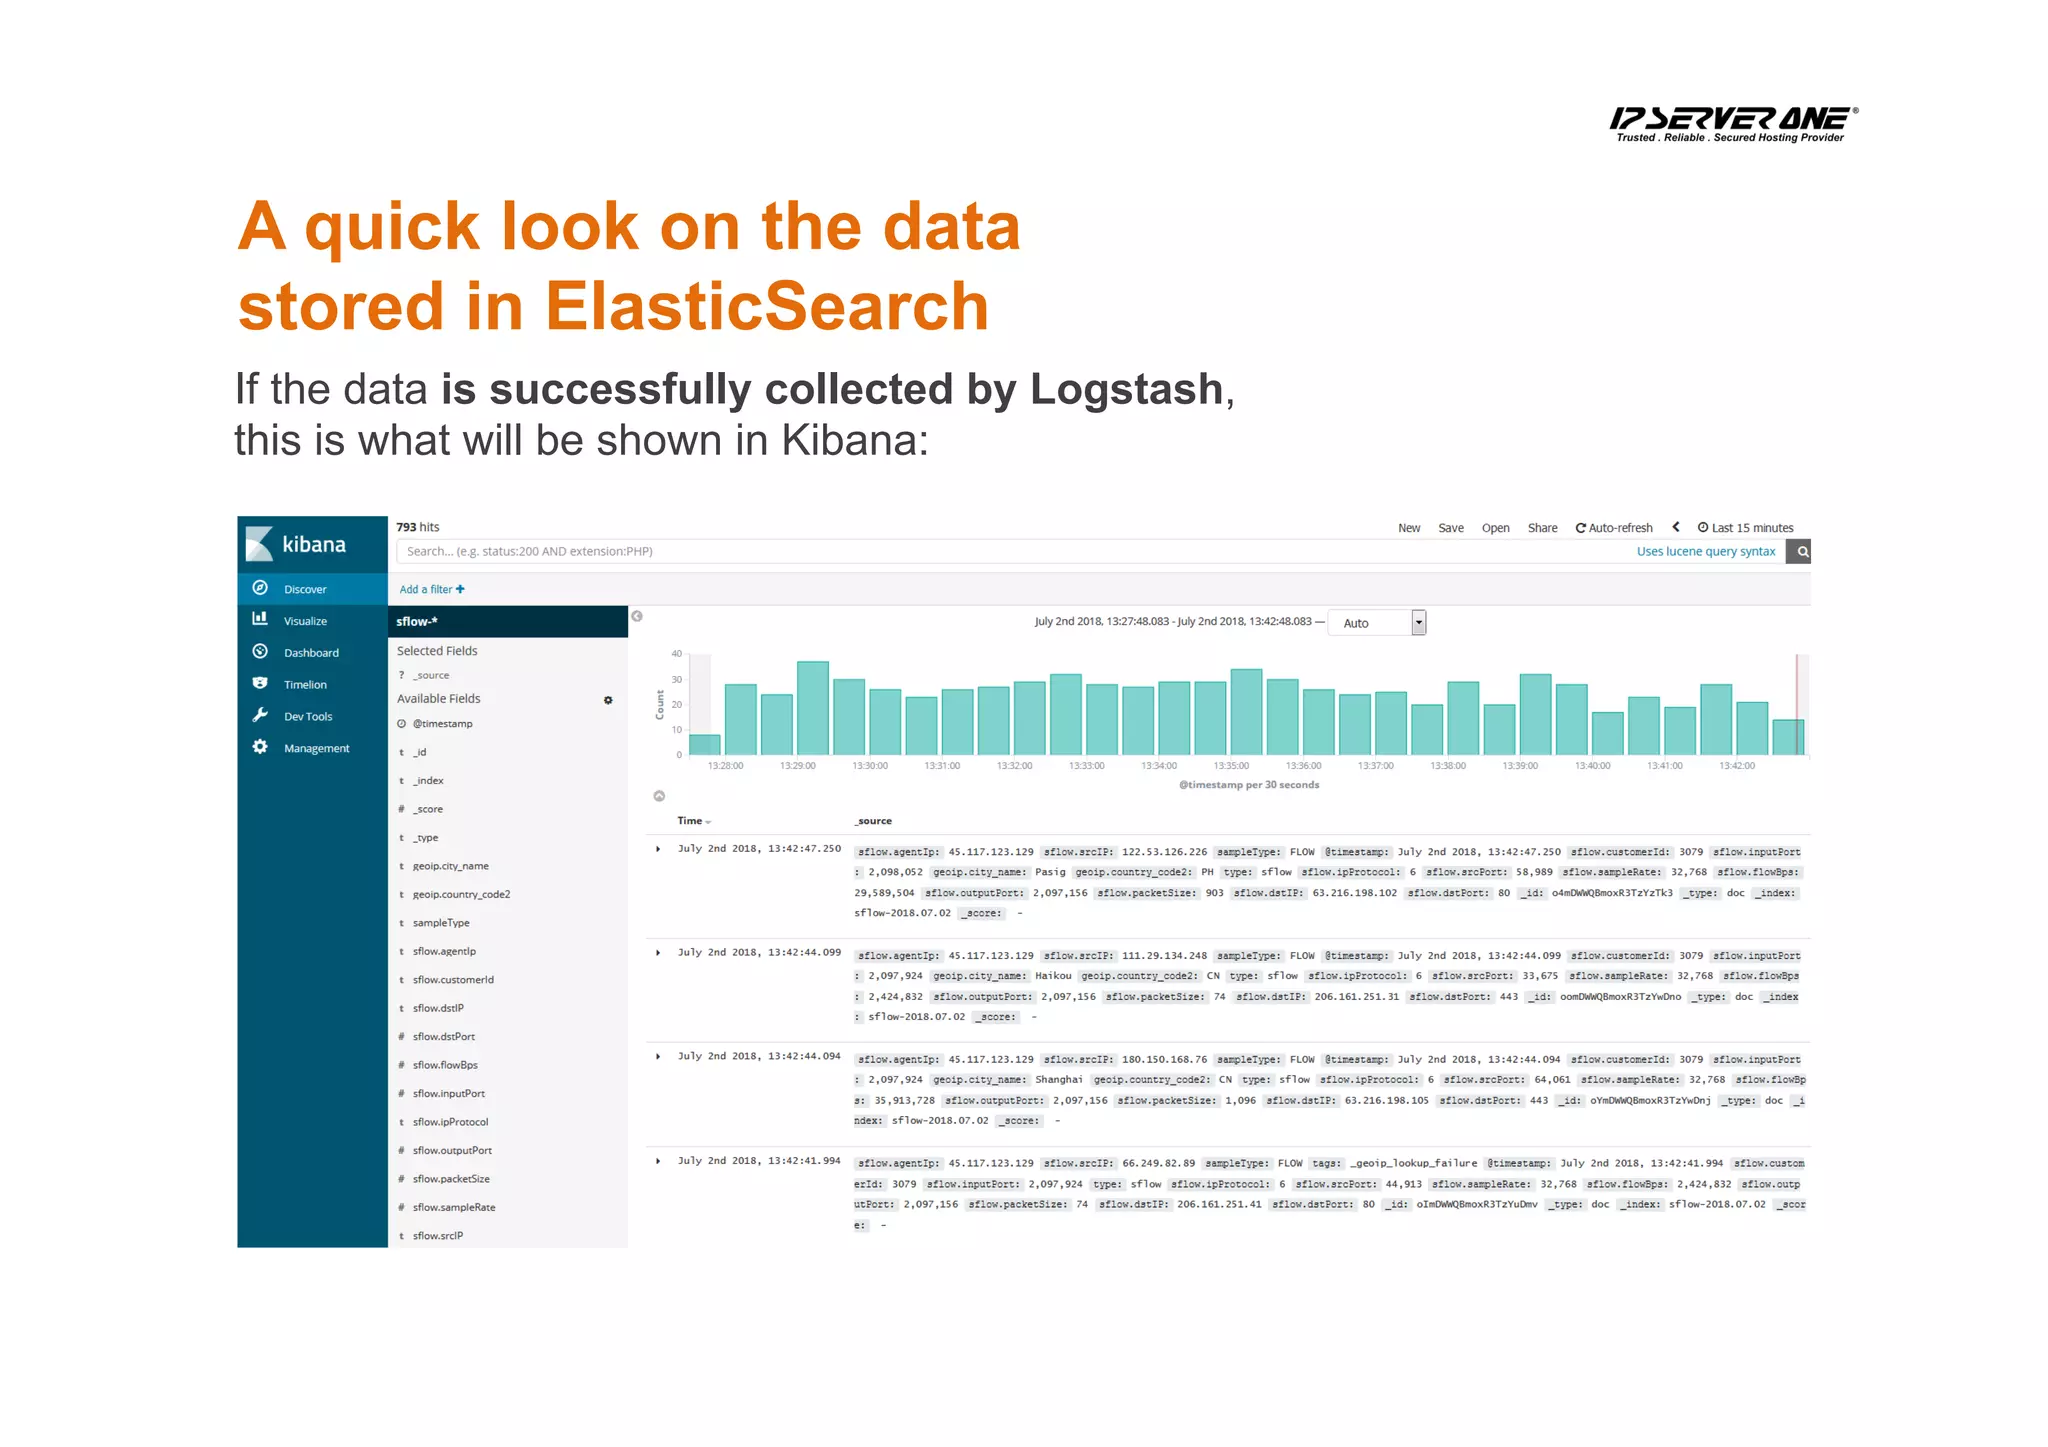


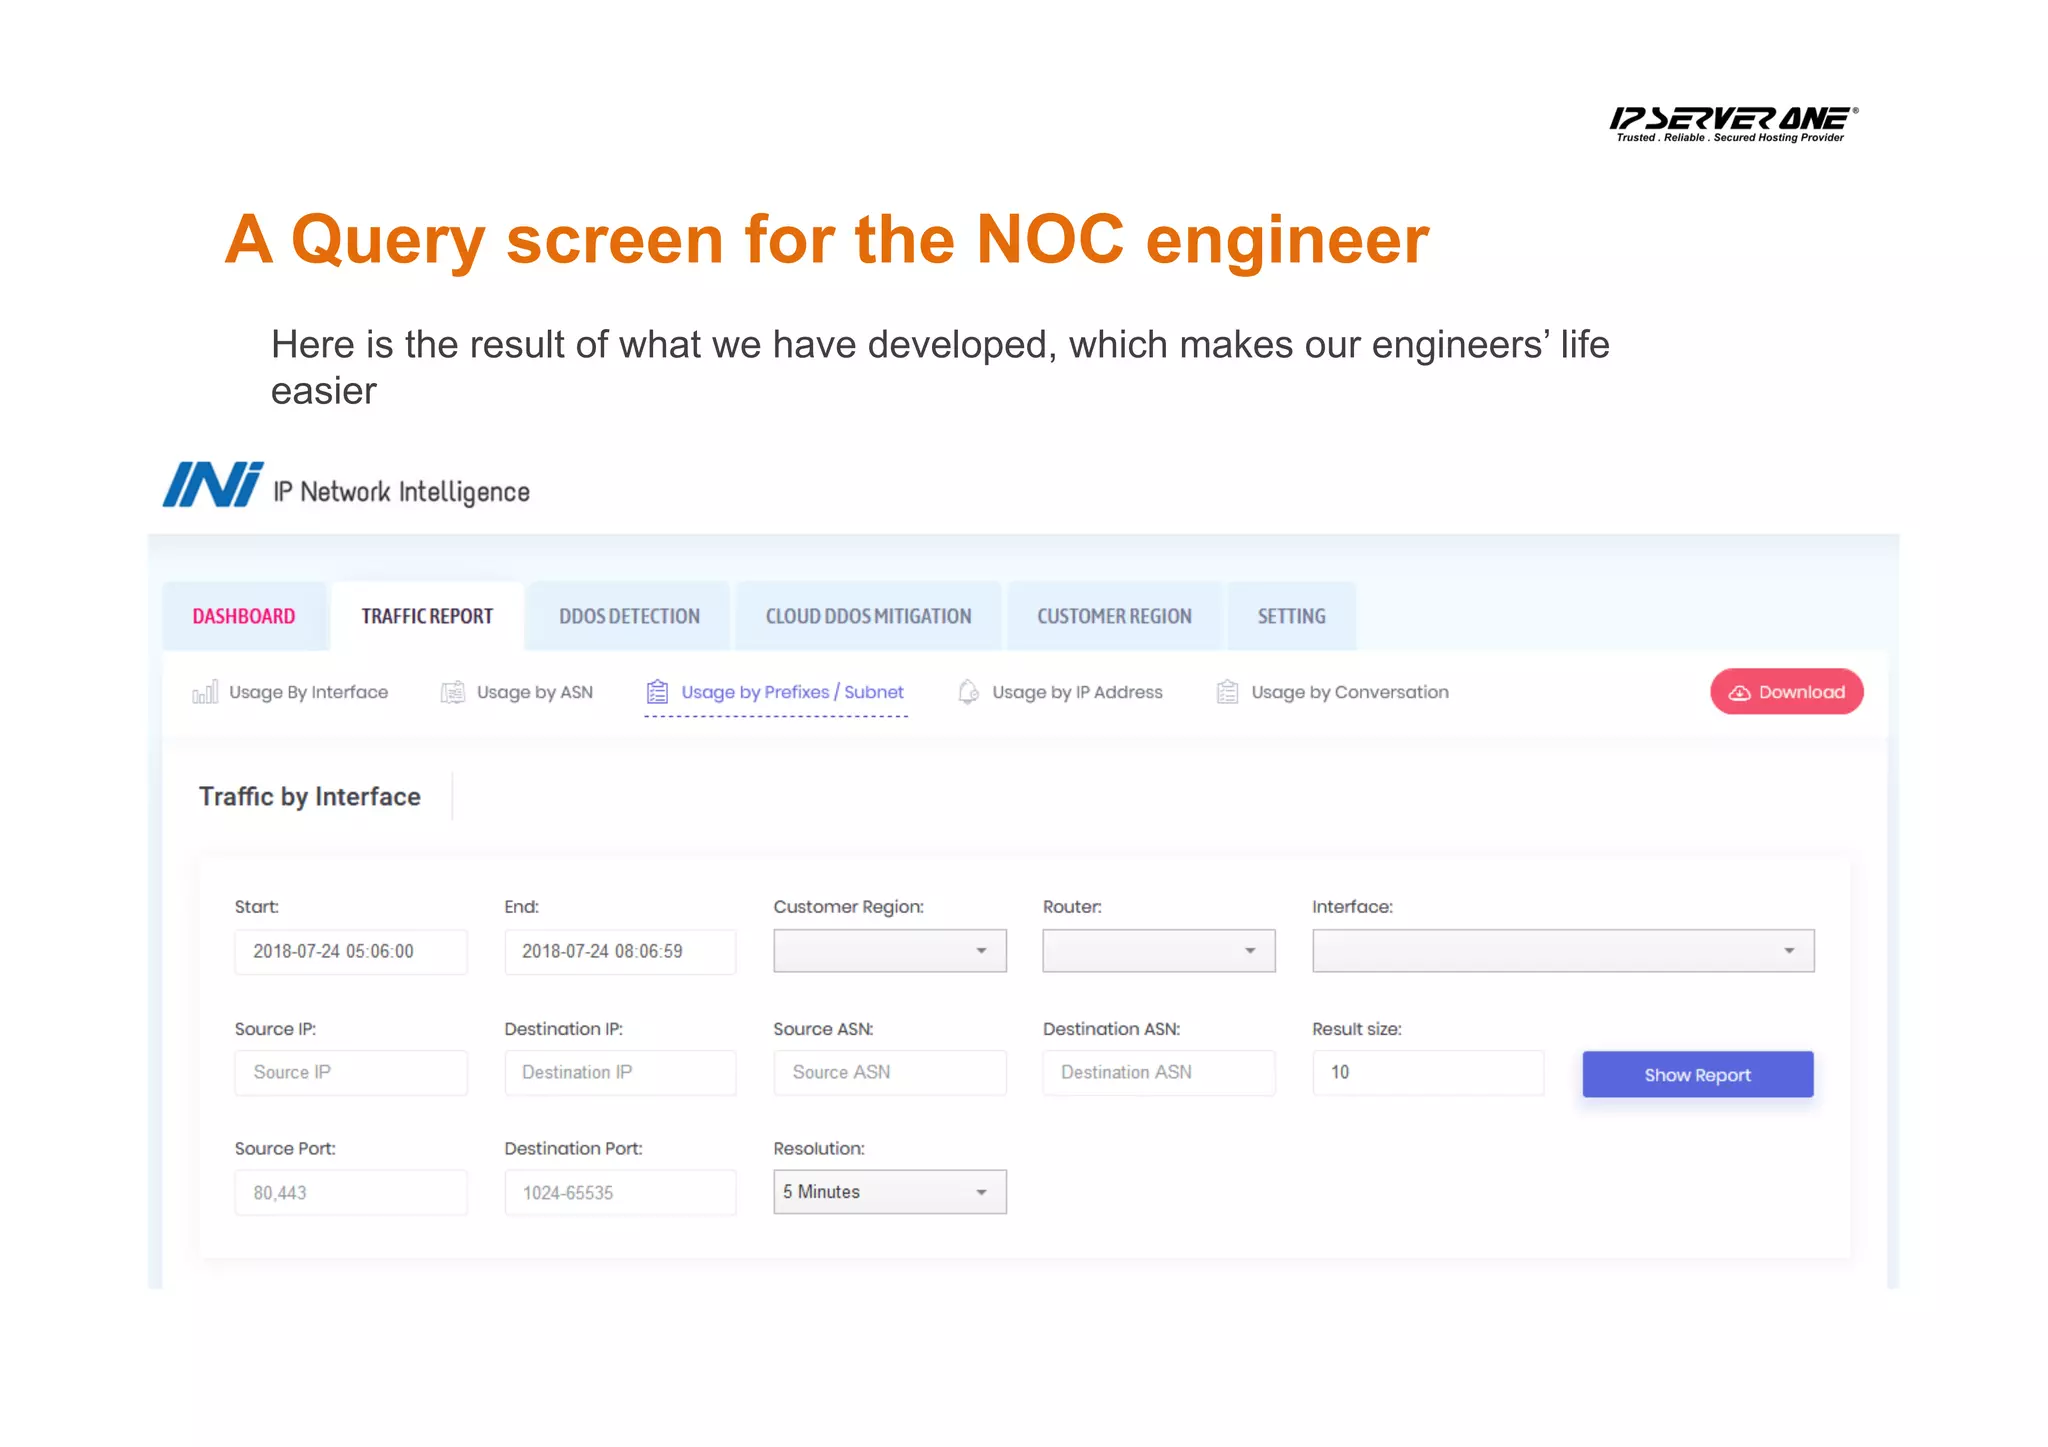

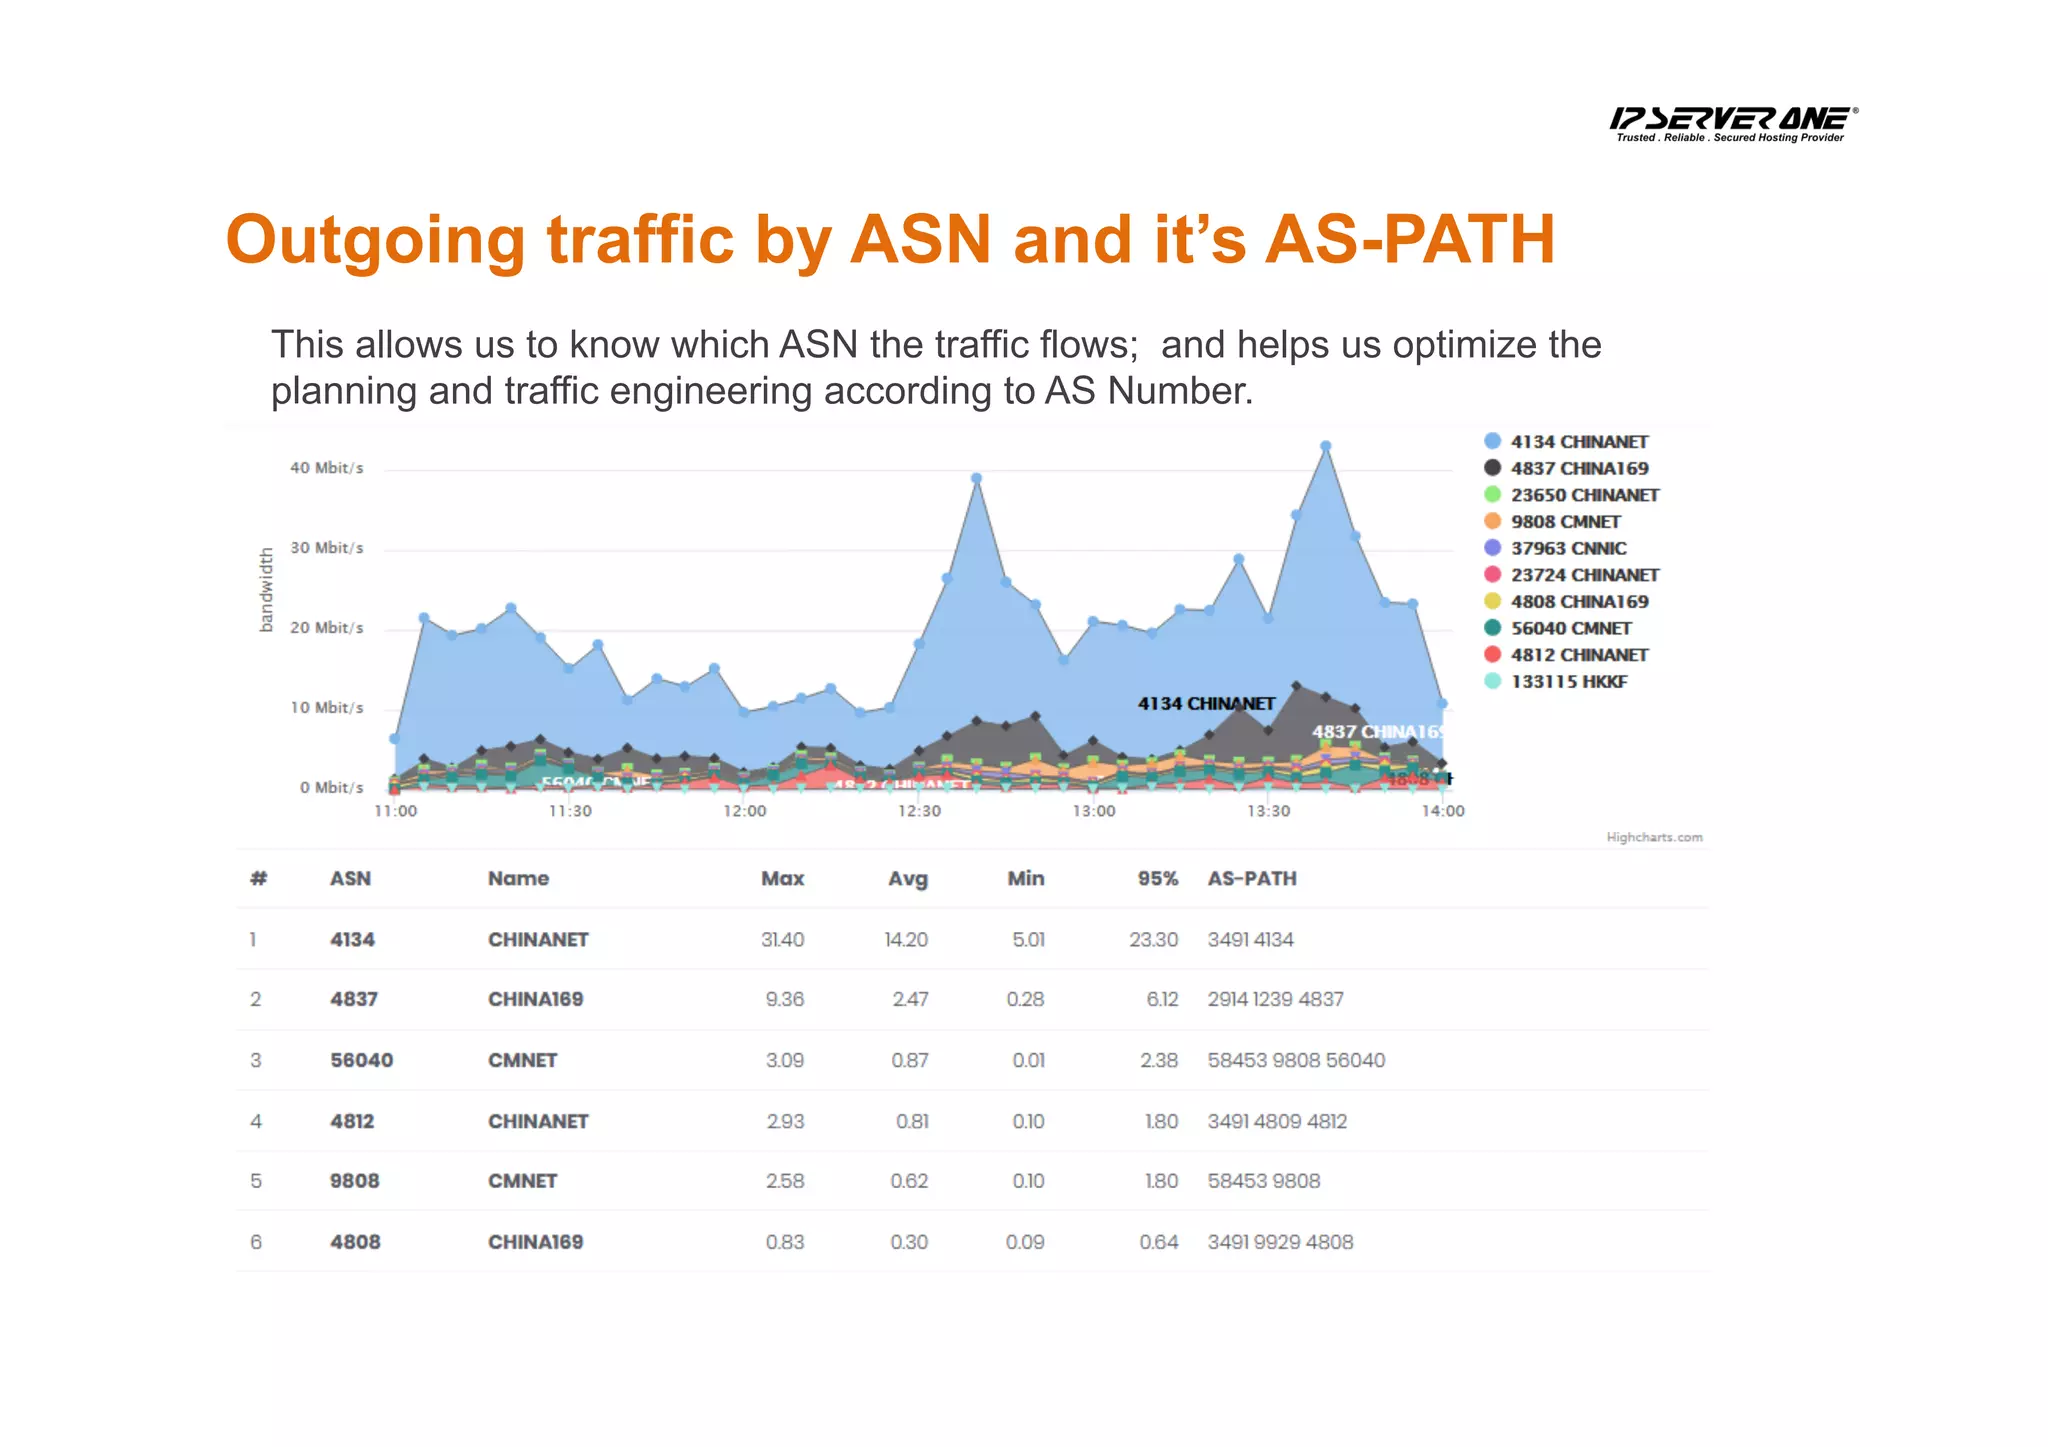
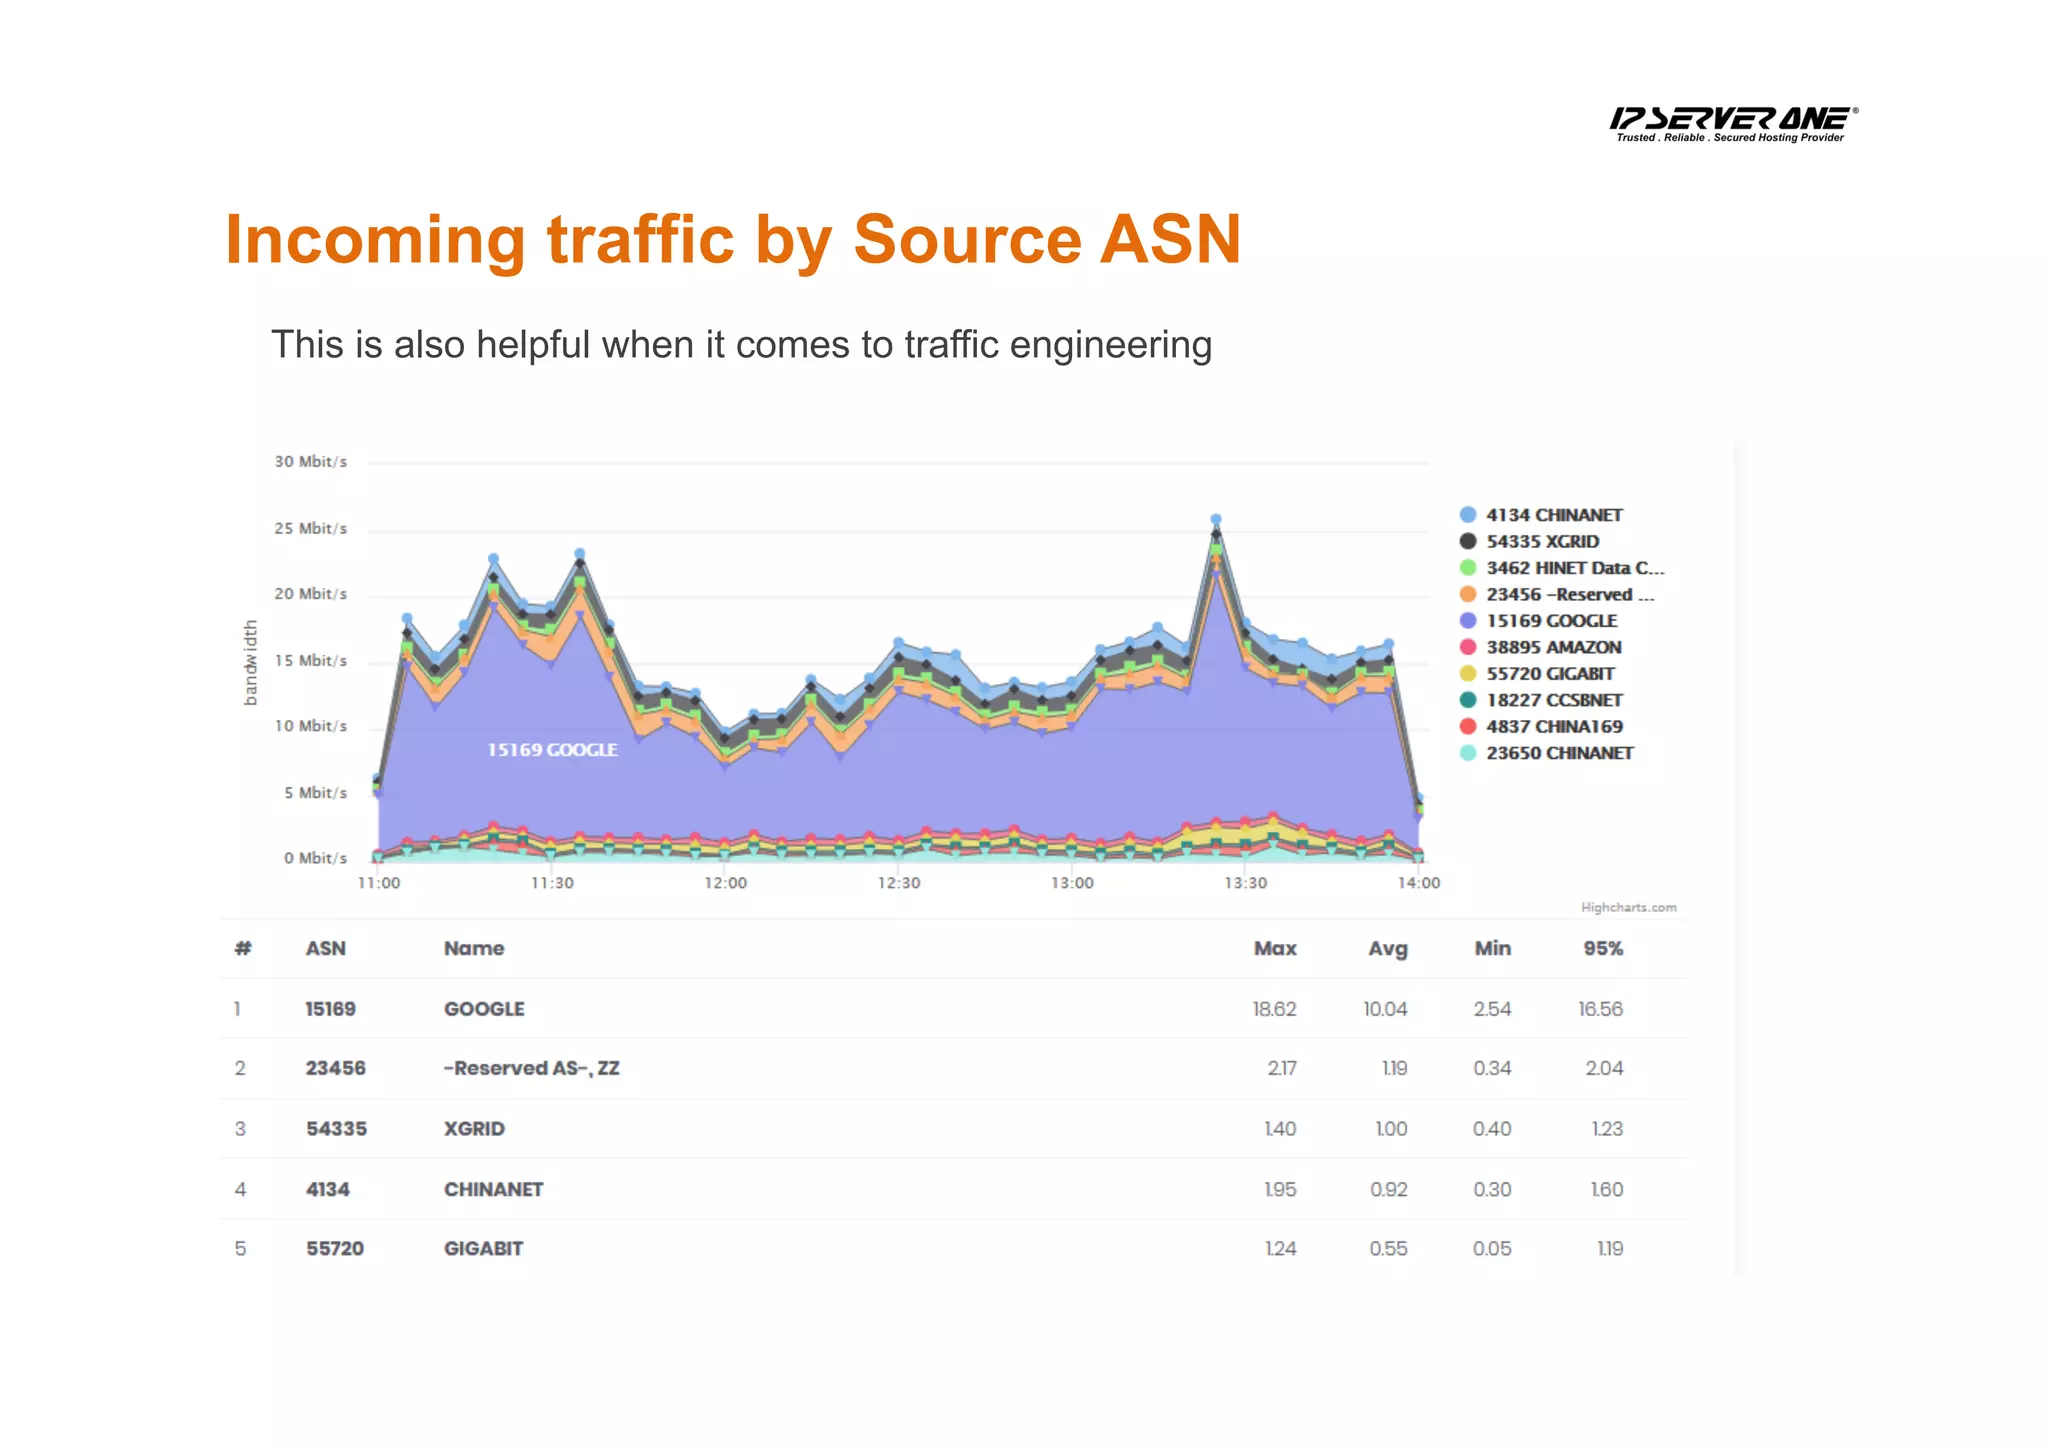
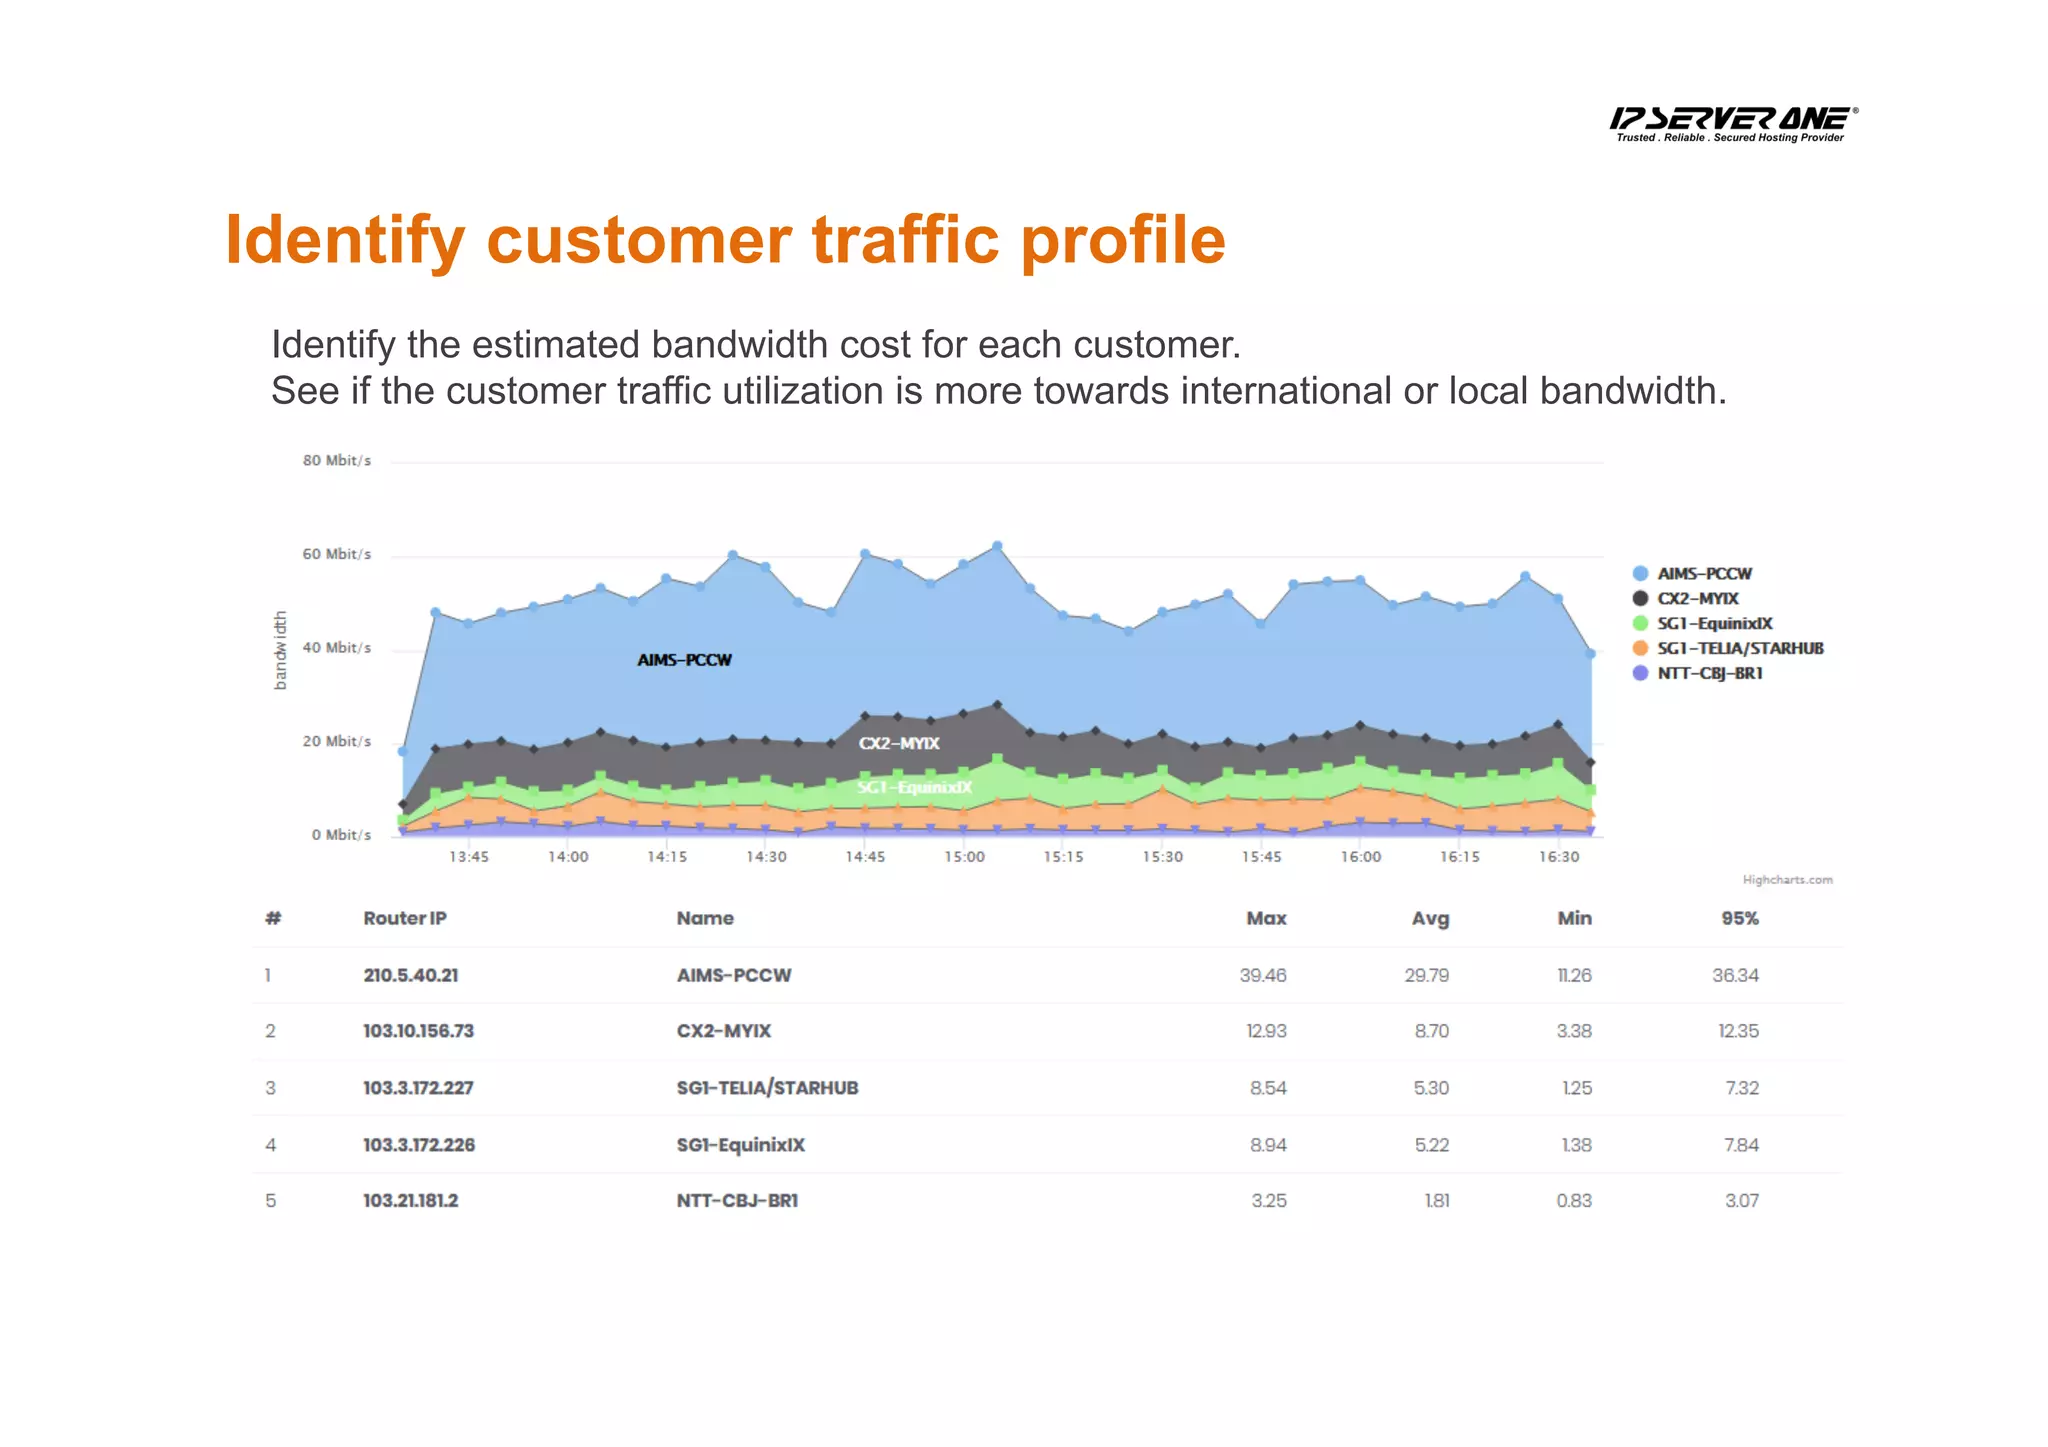
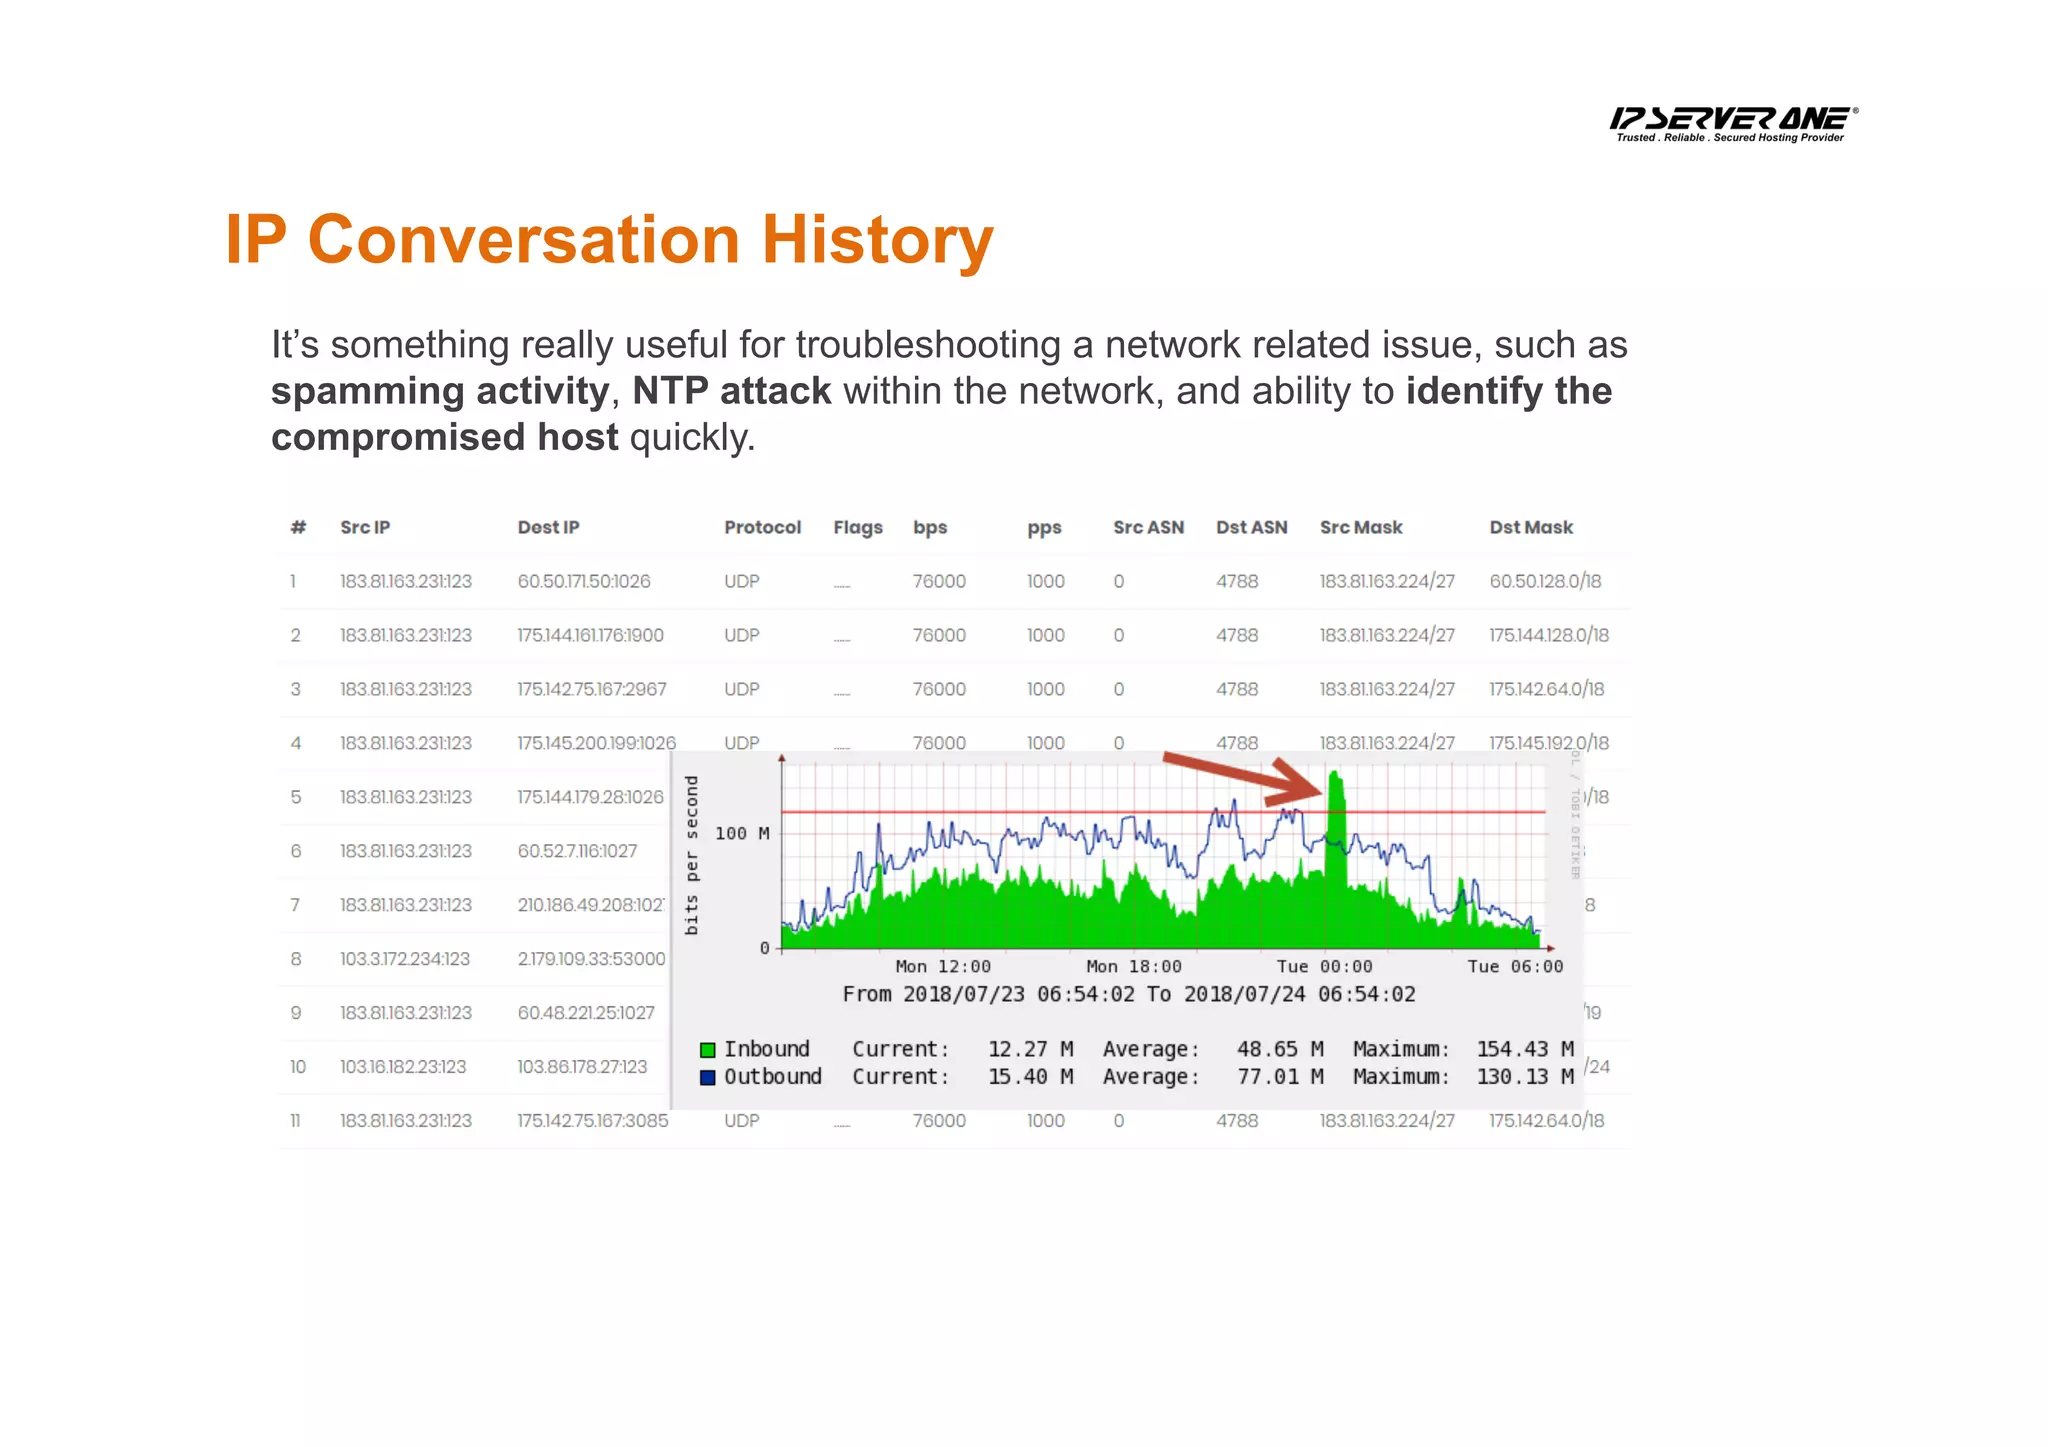


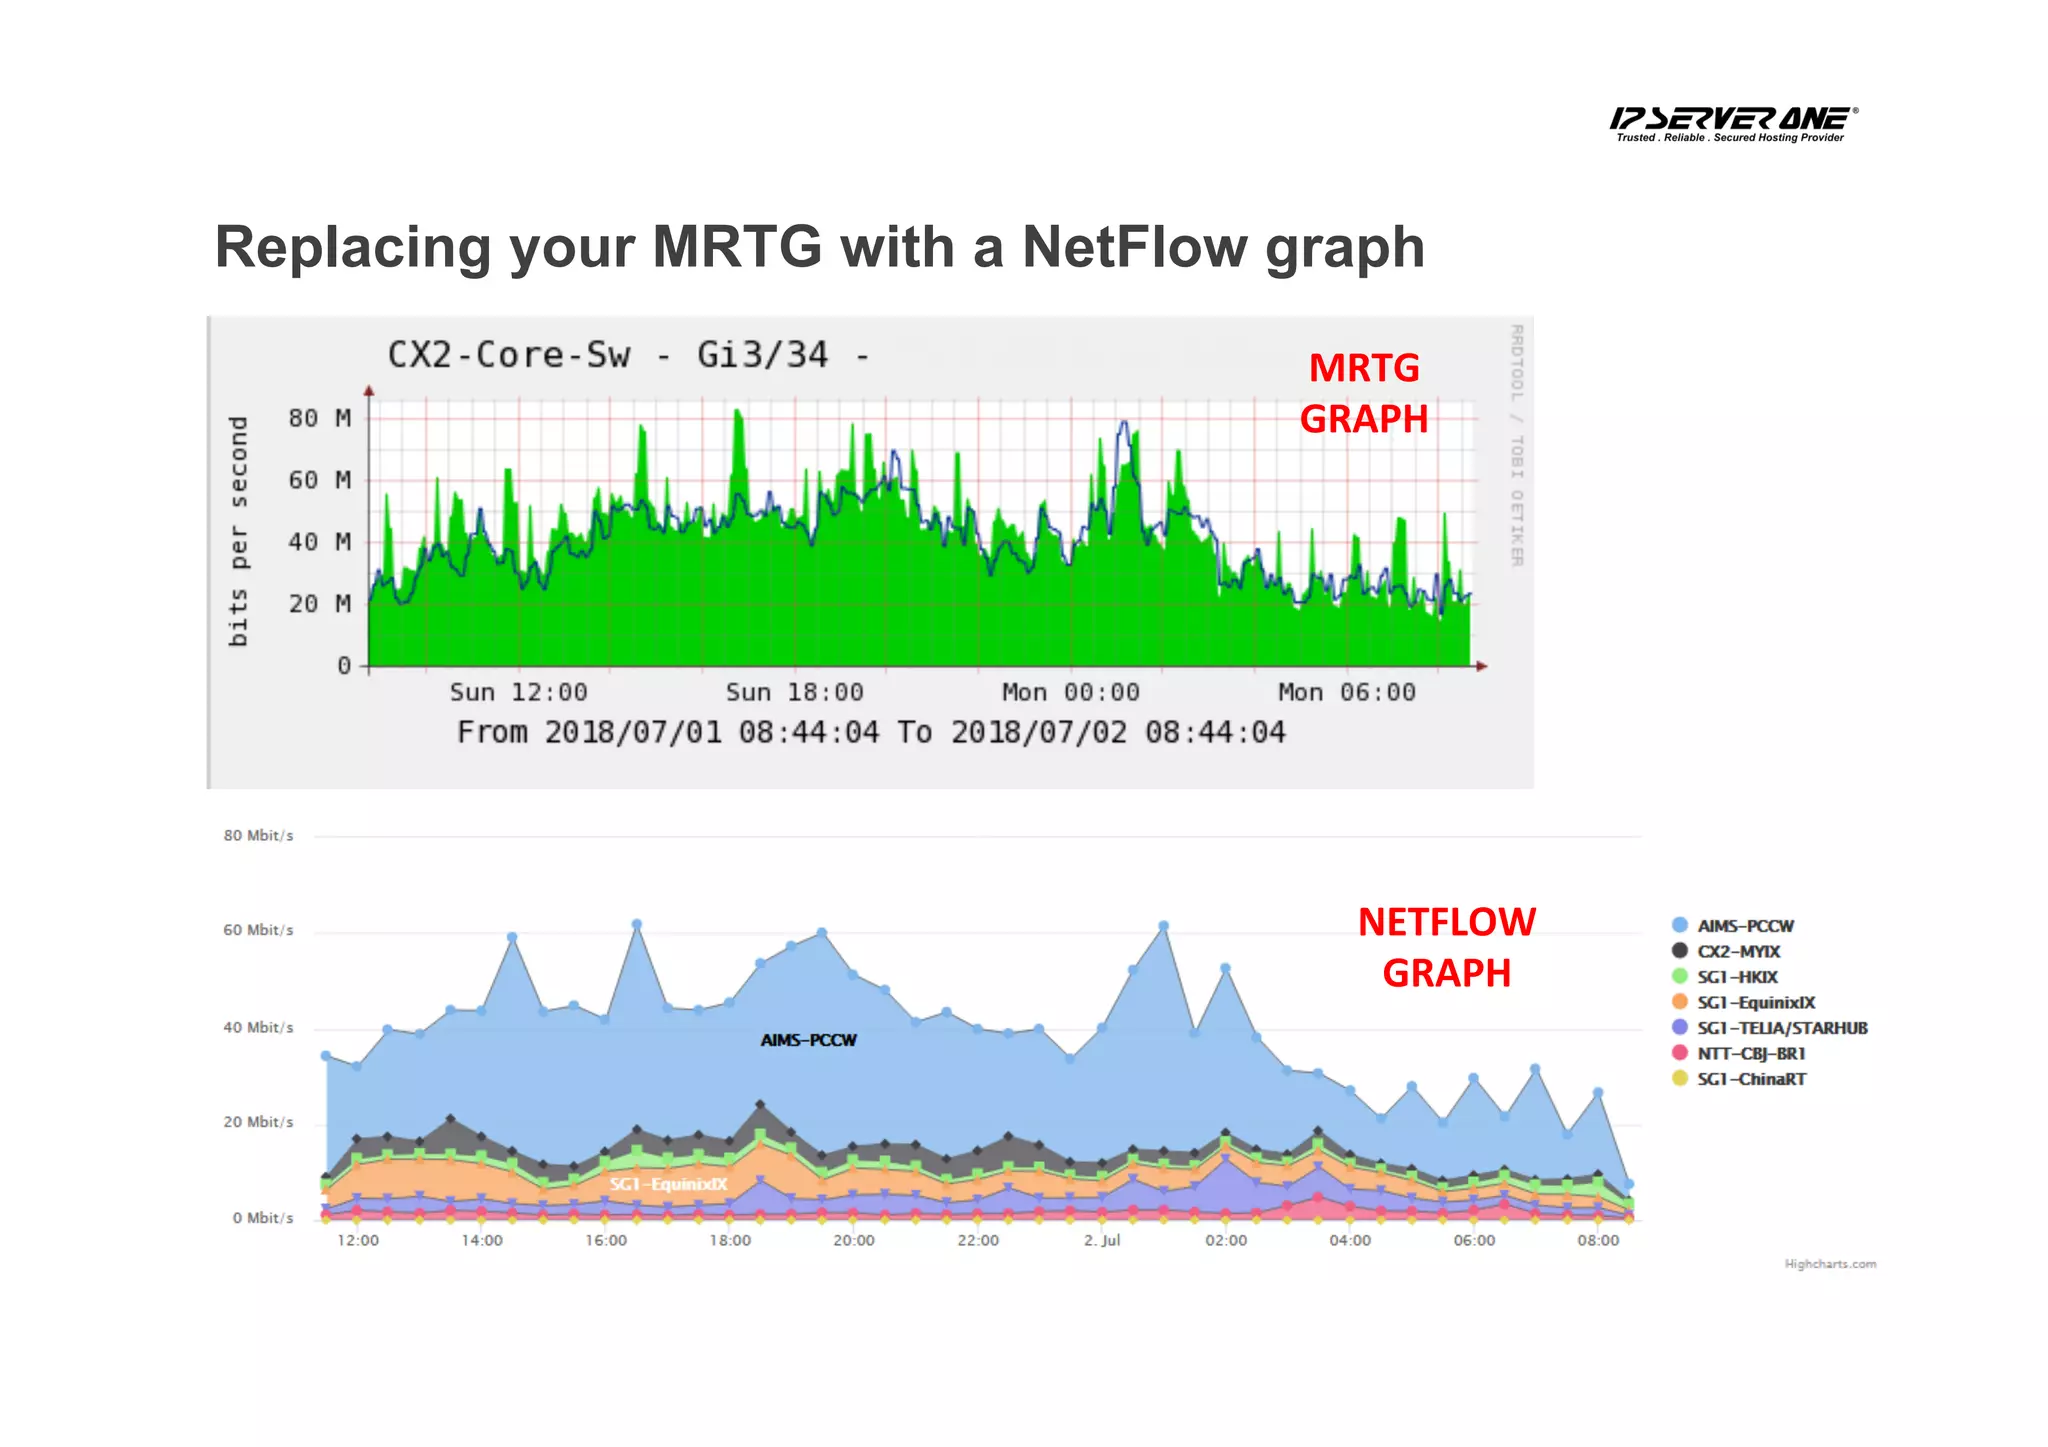
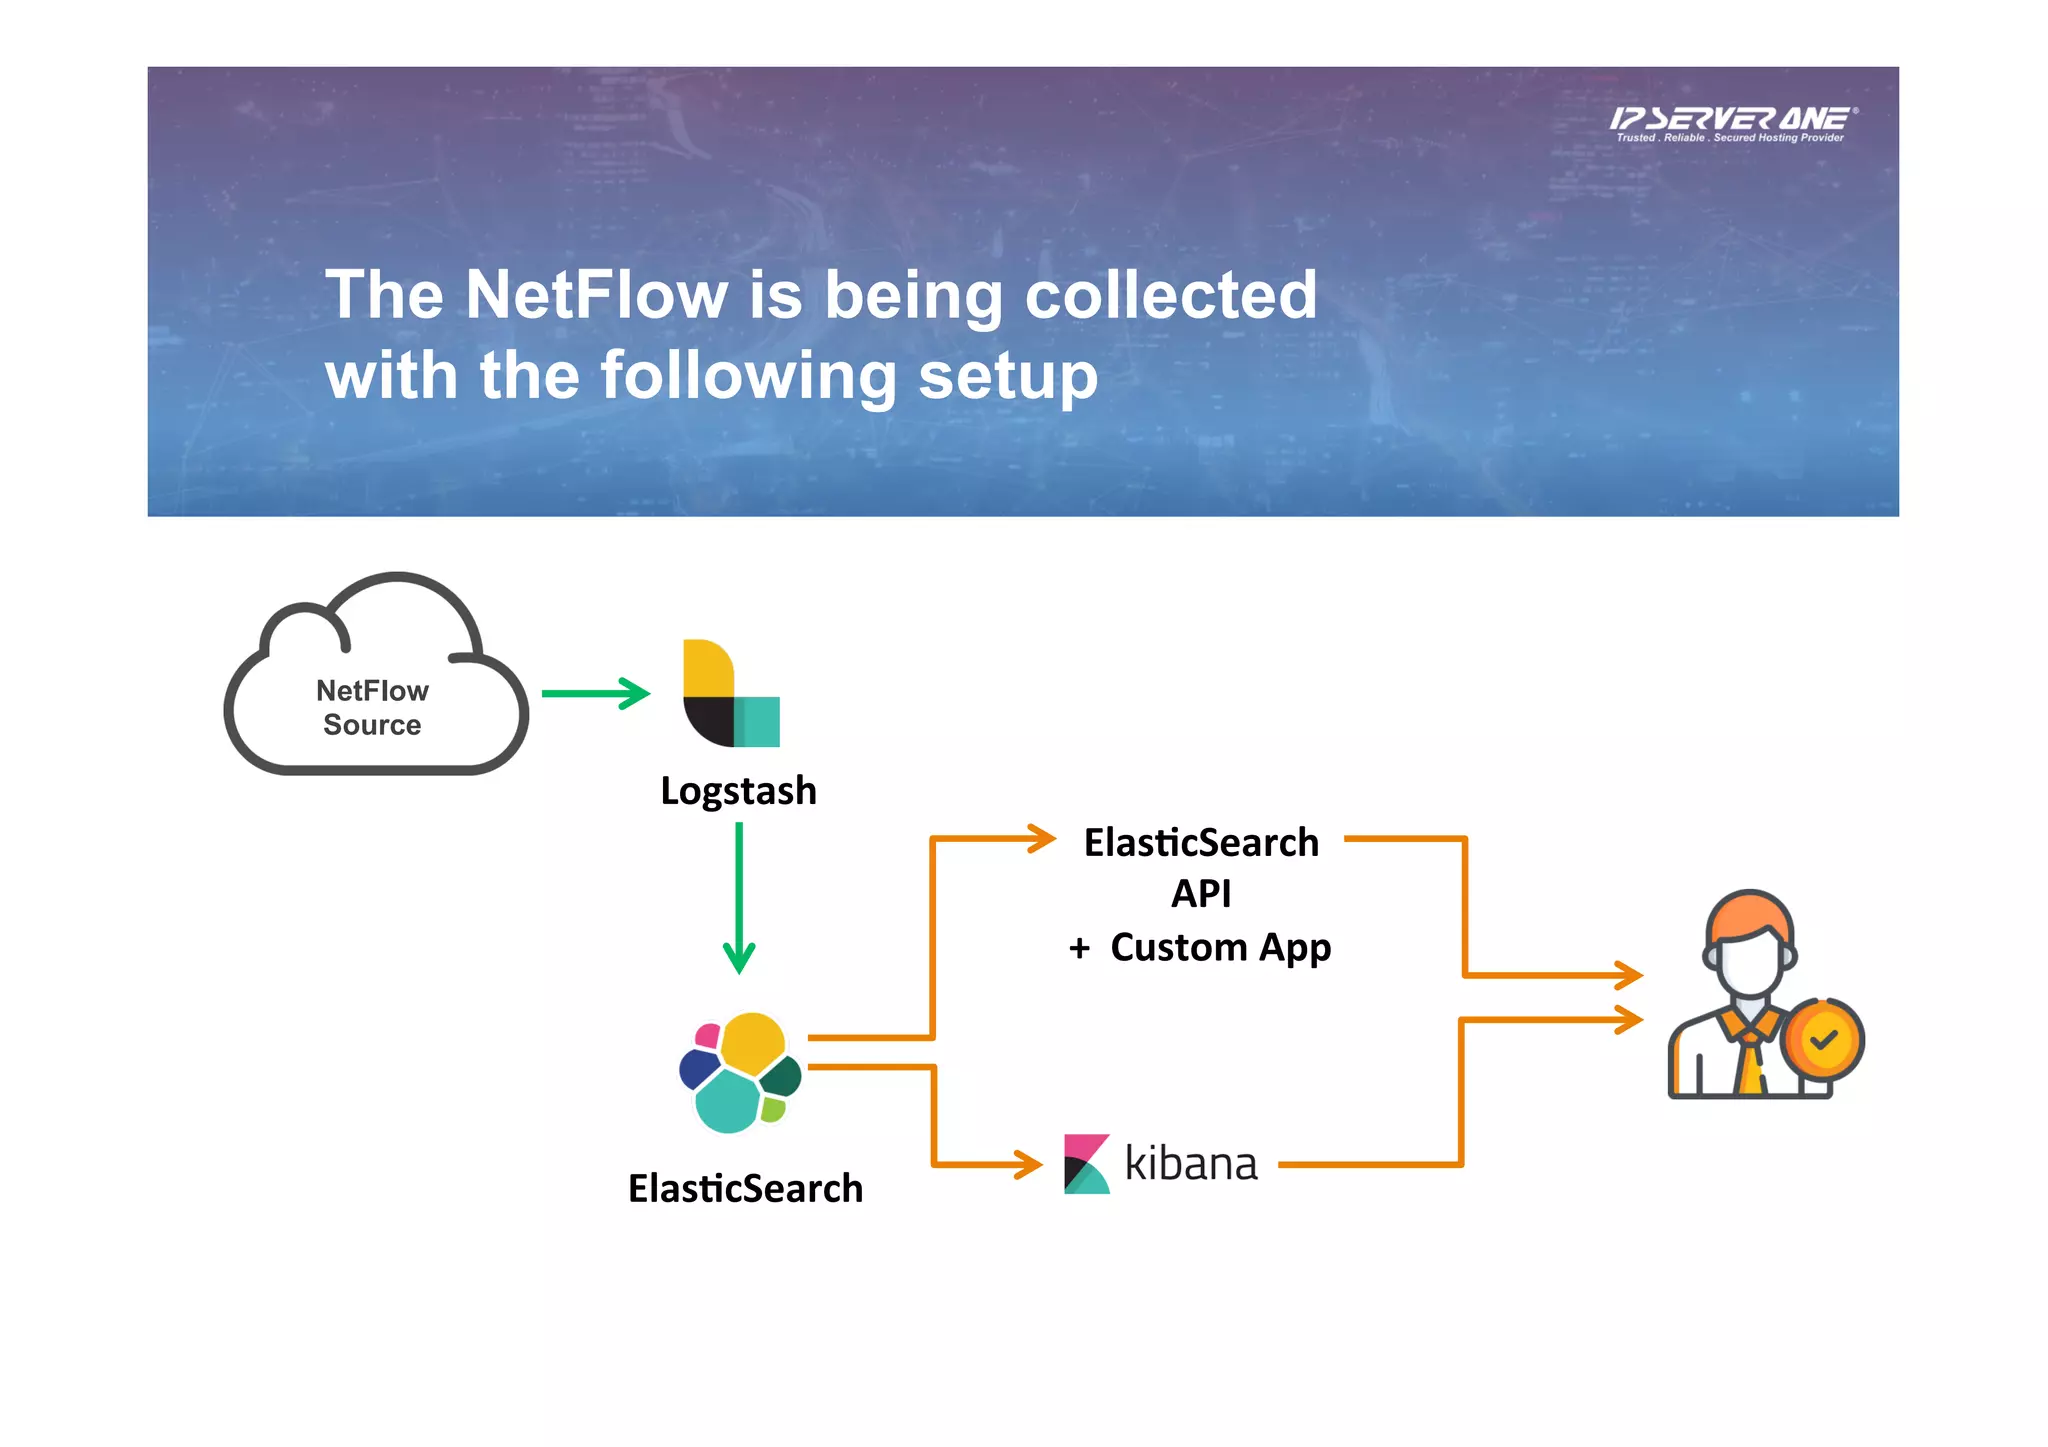
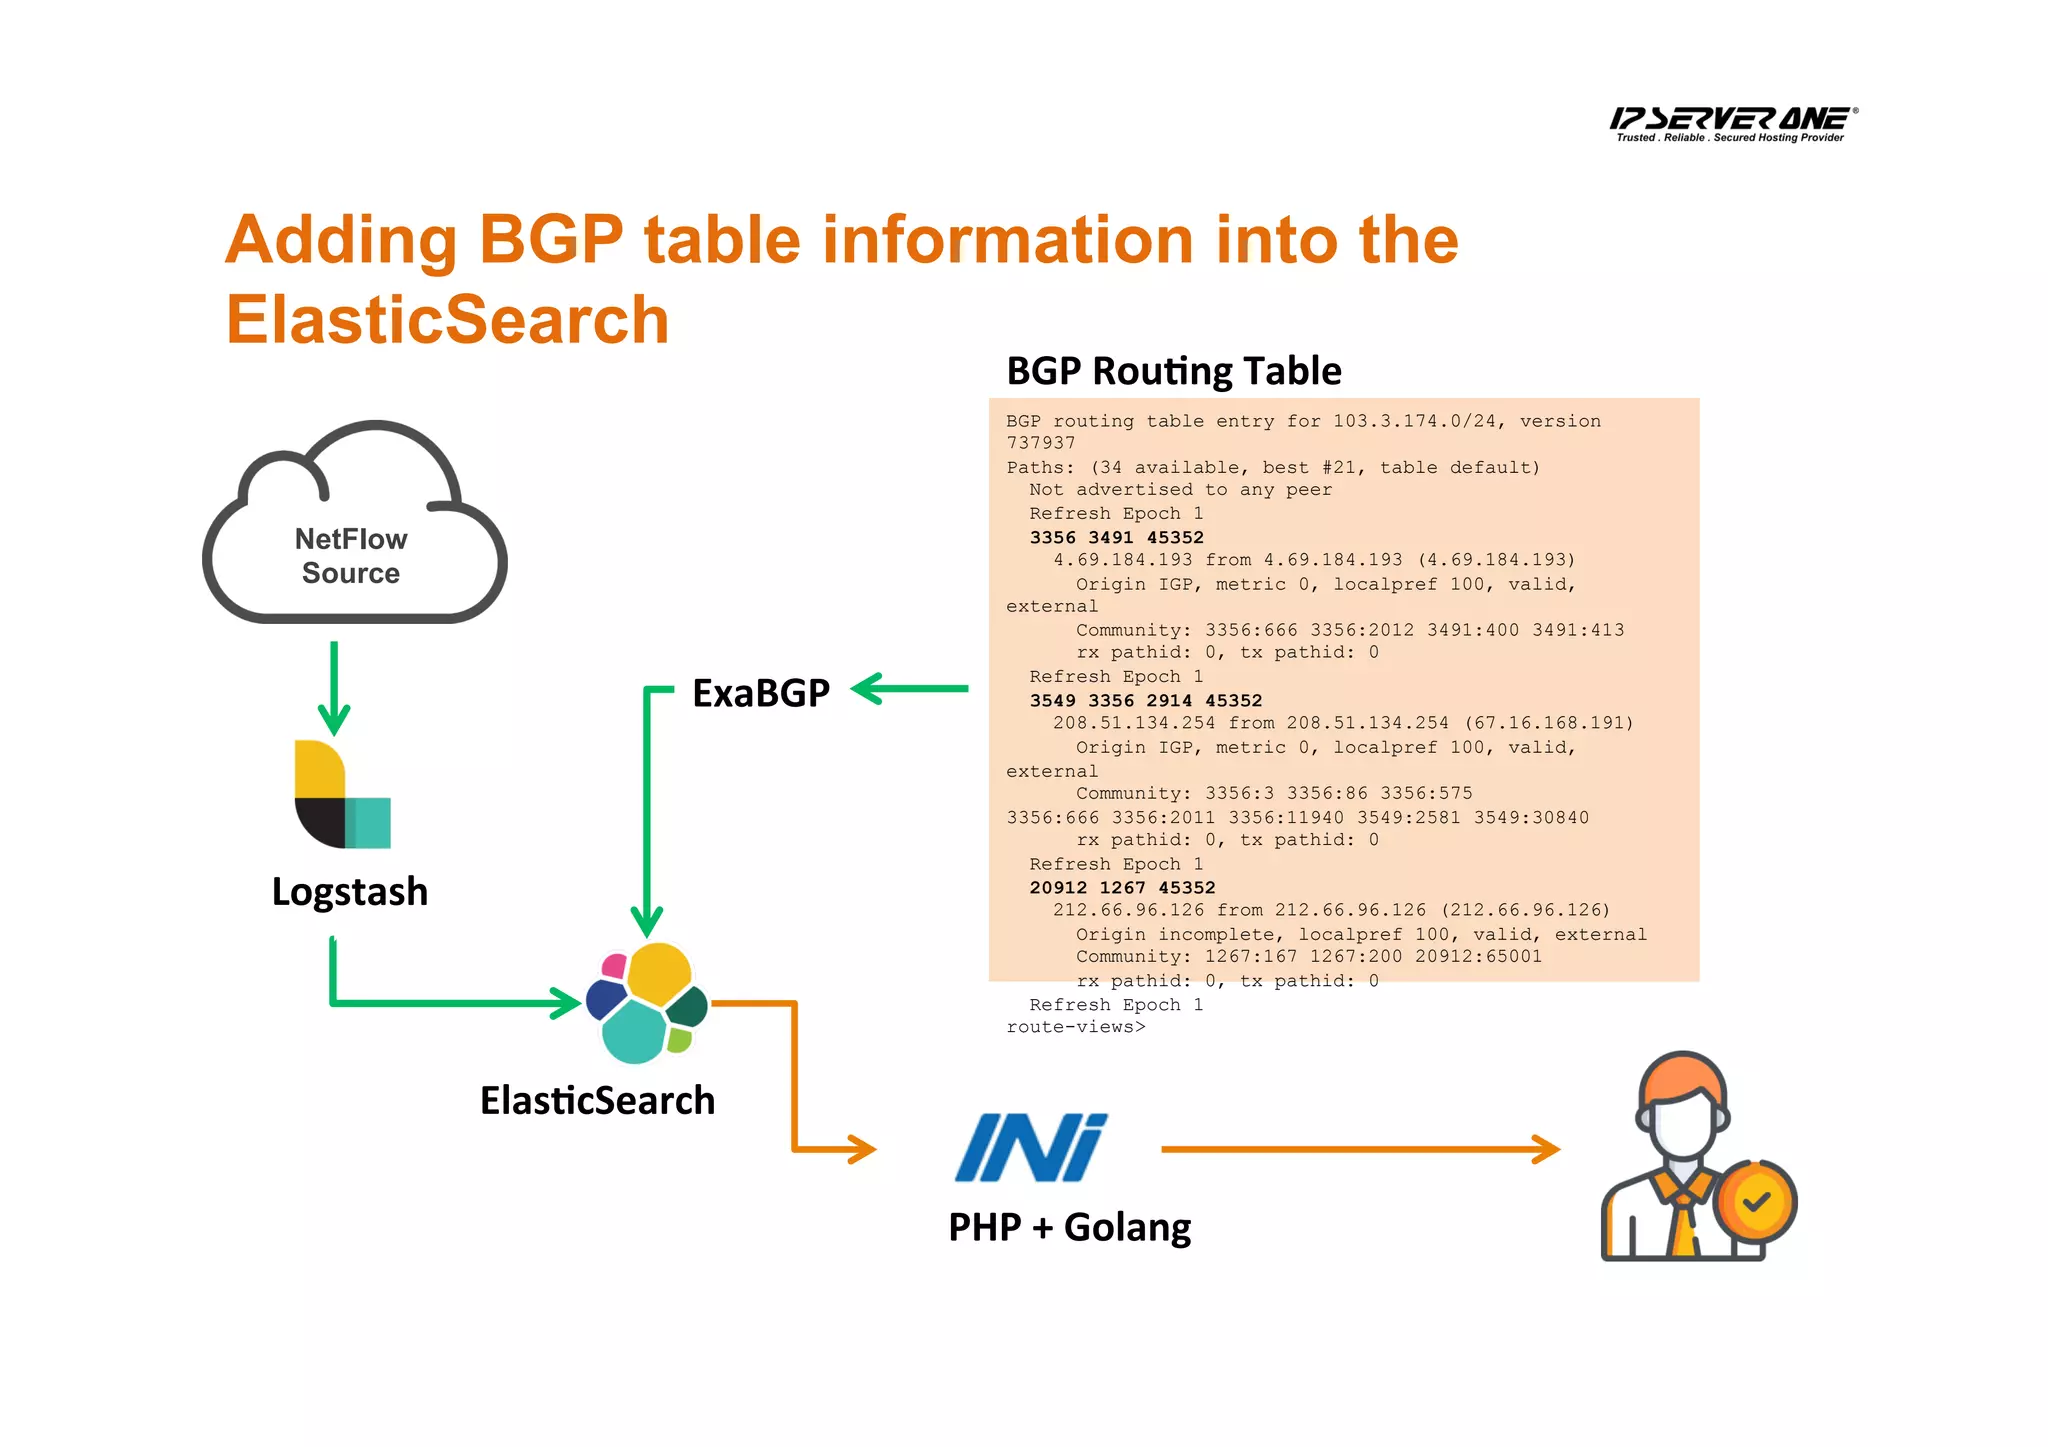
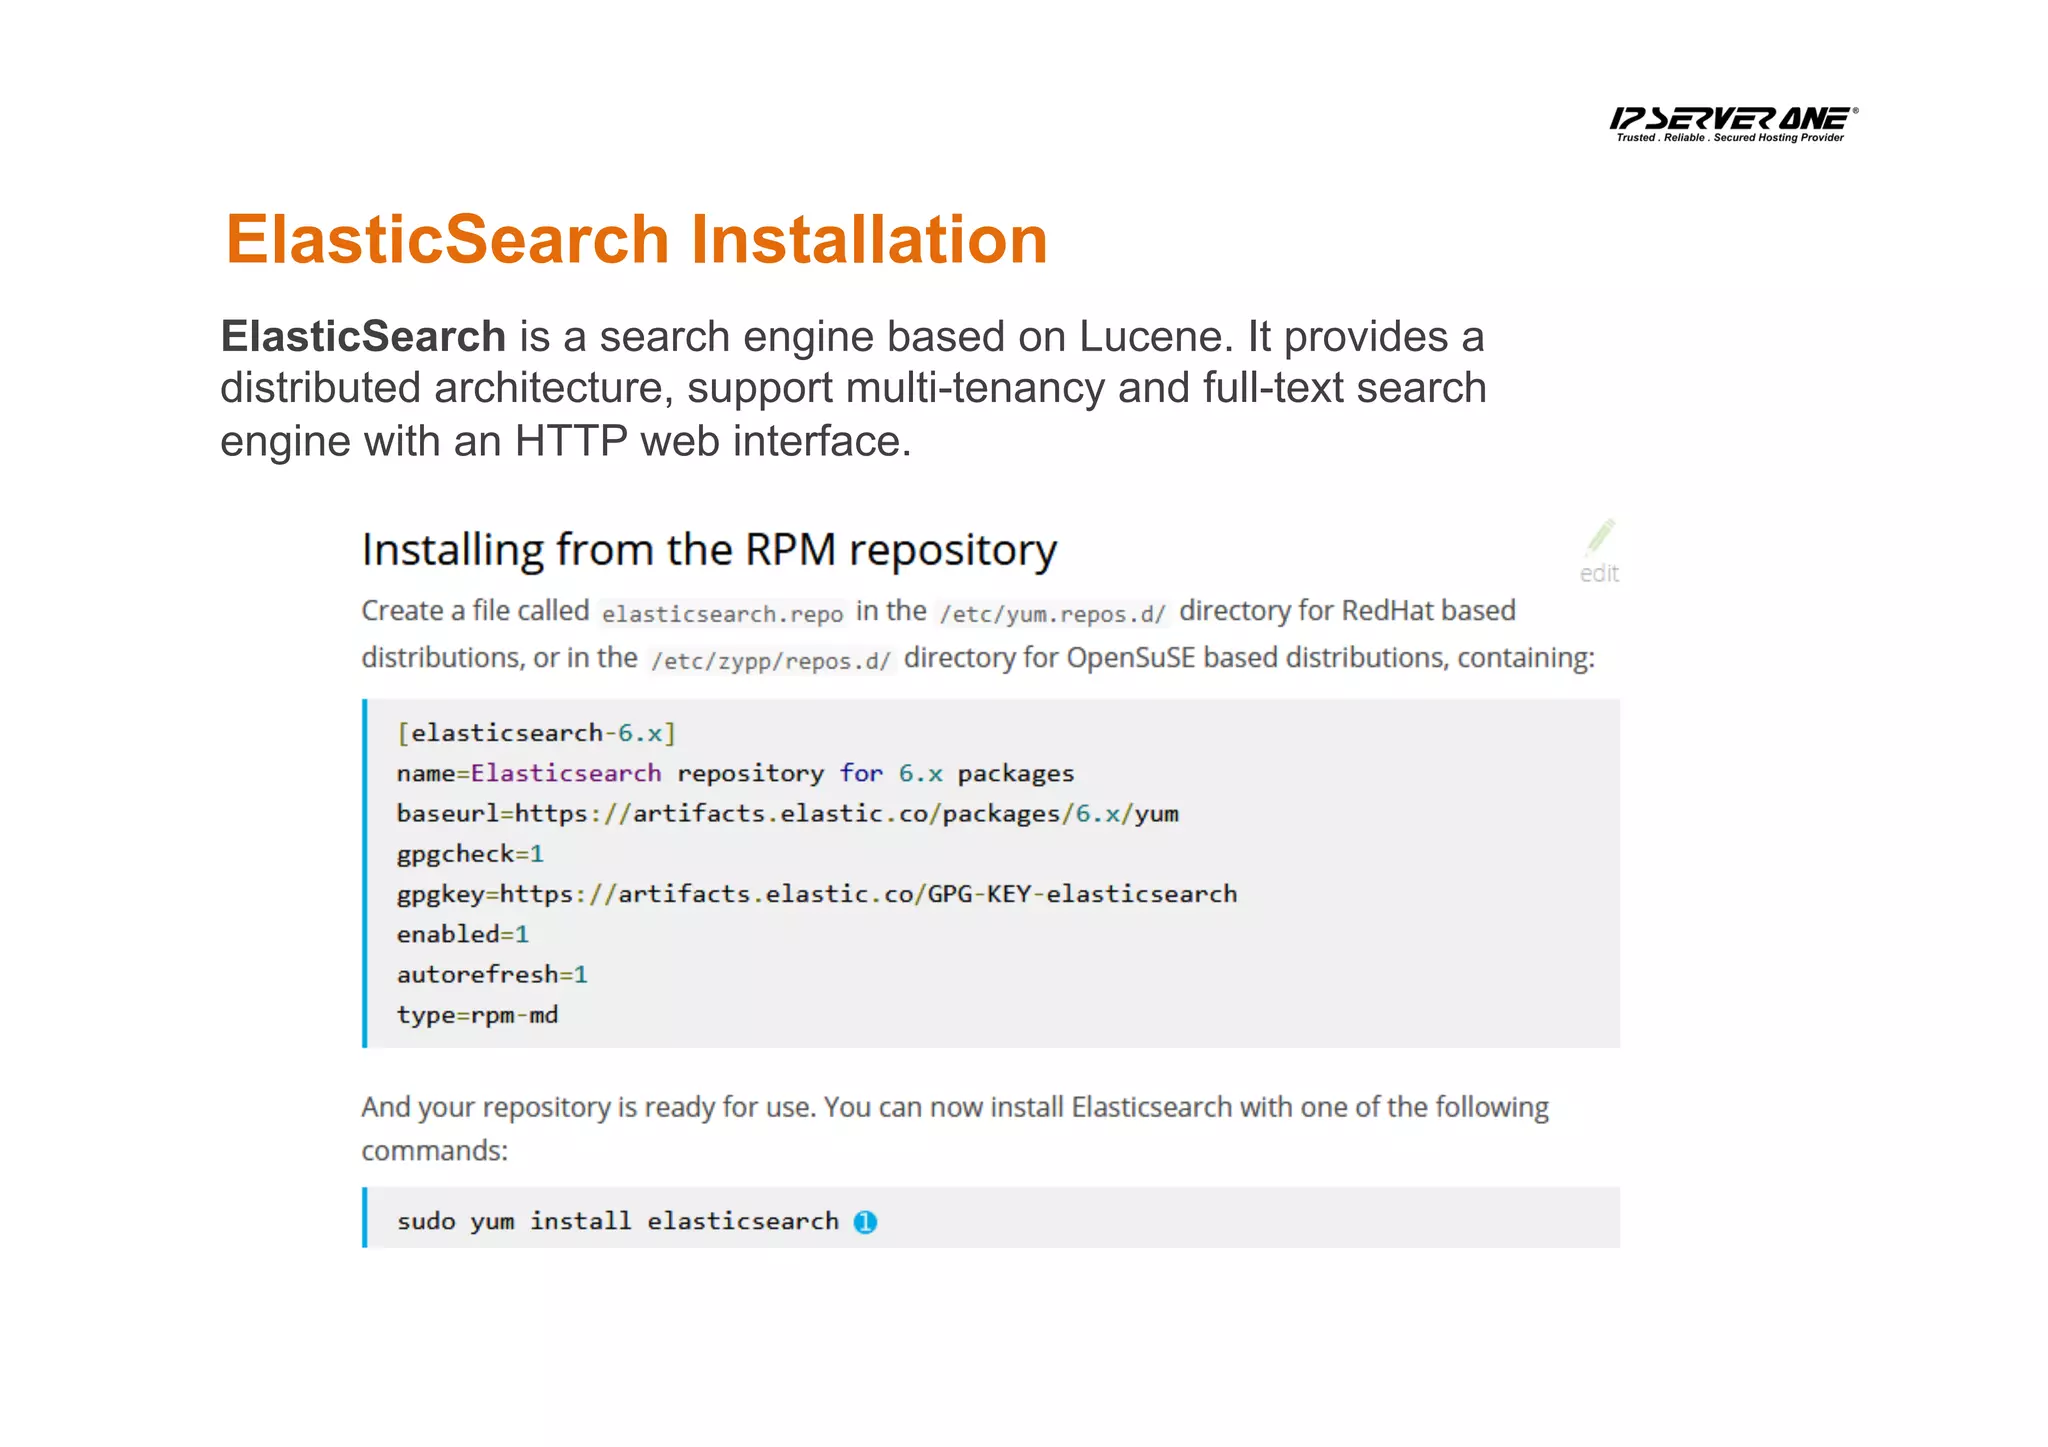
This document discusses using the ELK stack (Elasticsearch, Logstash, Kibana) to analyze netflow data. It describes IP ServerOne's infrastructure managing over 5000 servers across multiple data centers. Netflow data is collected and sent to Logstash for processing, then stored in Elasticsearch for querying and visualization in Kibana. Examples are given of how the data can be used, such as identifying top talkers, traffic profiling by ASN, and troubleshooting with IP conversation history. The ELK stack is concluded to be a powerful yet not difficult tool for analyzing netflow traffic.


![[131] packetbeat과 elasticsearch](https://cdn.slidesharecdn.com/ss_thumbnails/113packetbeatelasticsearch-150914020054-lva1-app6891-thumbnail.jpg?width=640&height=640&fit=bounds)