Downloaded 93 times
![CPU Profiling: Sampling
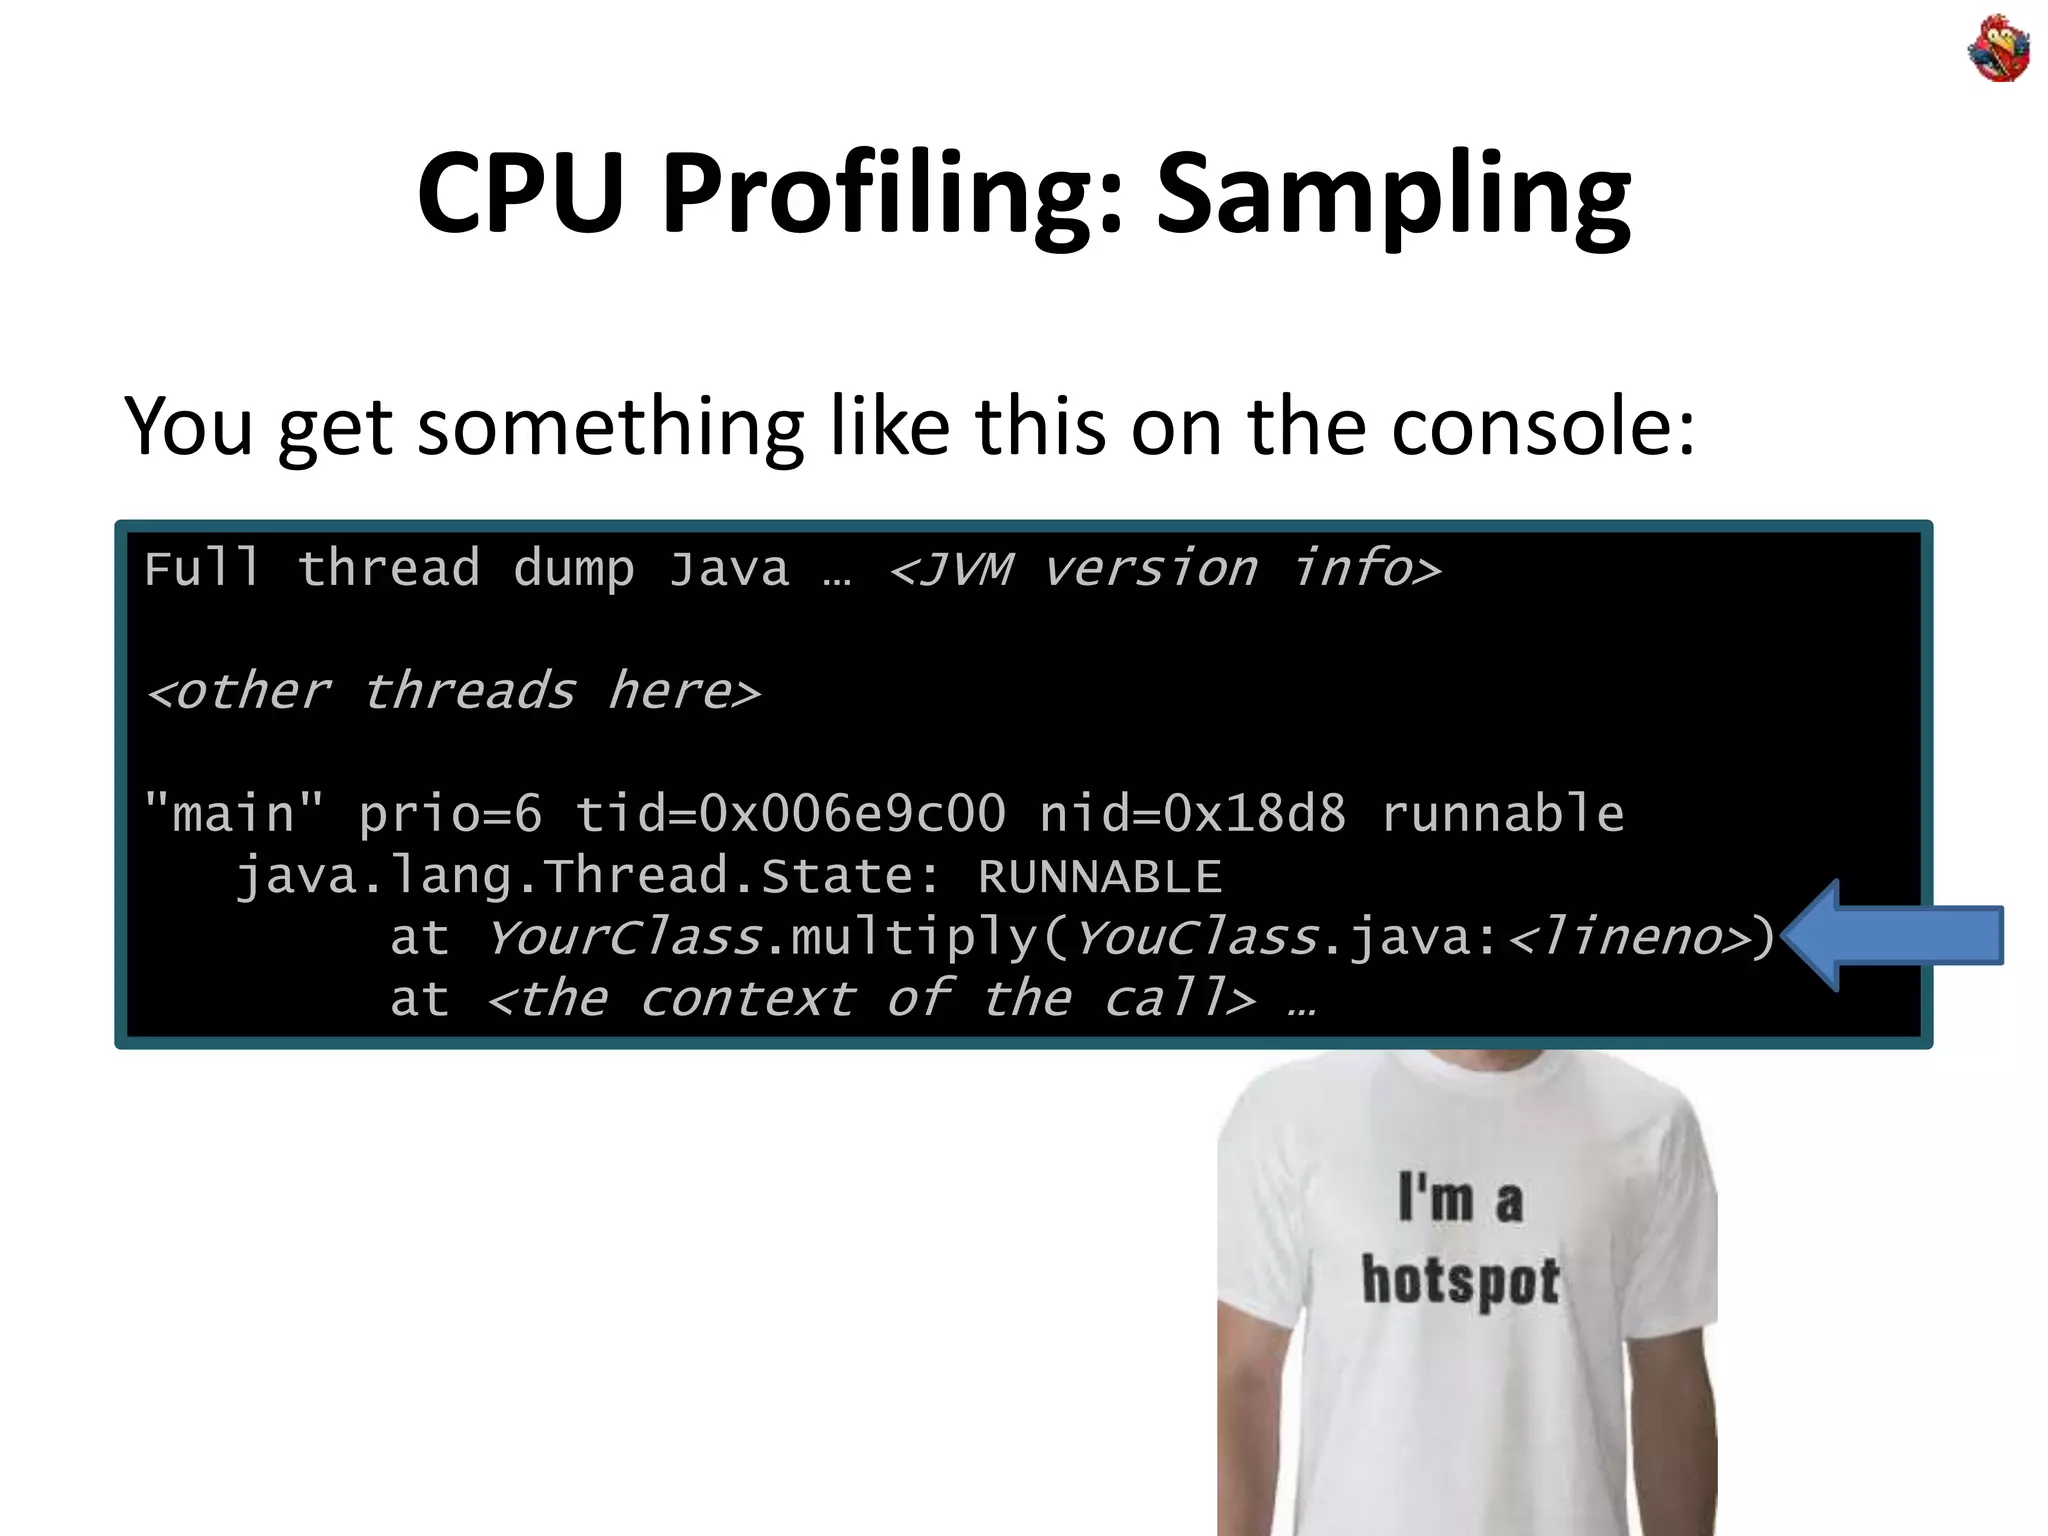
JVM has ability to produce “thread dump”
• Press Ctrl+Break in Windows console
• “kill -3 <pid>” on Linux/Solaris
If program spends most of its time on one line:
double[][] multiply(double[][] a, double [][] b) {
int n = a.length, r = a[0].length, m = b[0].length;
double[][] c = new double[n][m];
for (int i = 0; i < n; i++)
for (int j = 0; j < m; j++)
for (int k = 0; k < r; k++)
c[i][j] += a[i][k] * b[k][j];
return c;
}
Hotspot](https://image.slidesharecdn.com/diyjavaprofilingadd2011-140329164606-phpapp02/75/DIY-Java-Profiling-13-2048.jpg)
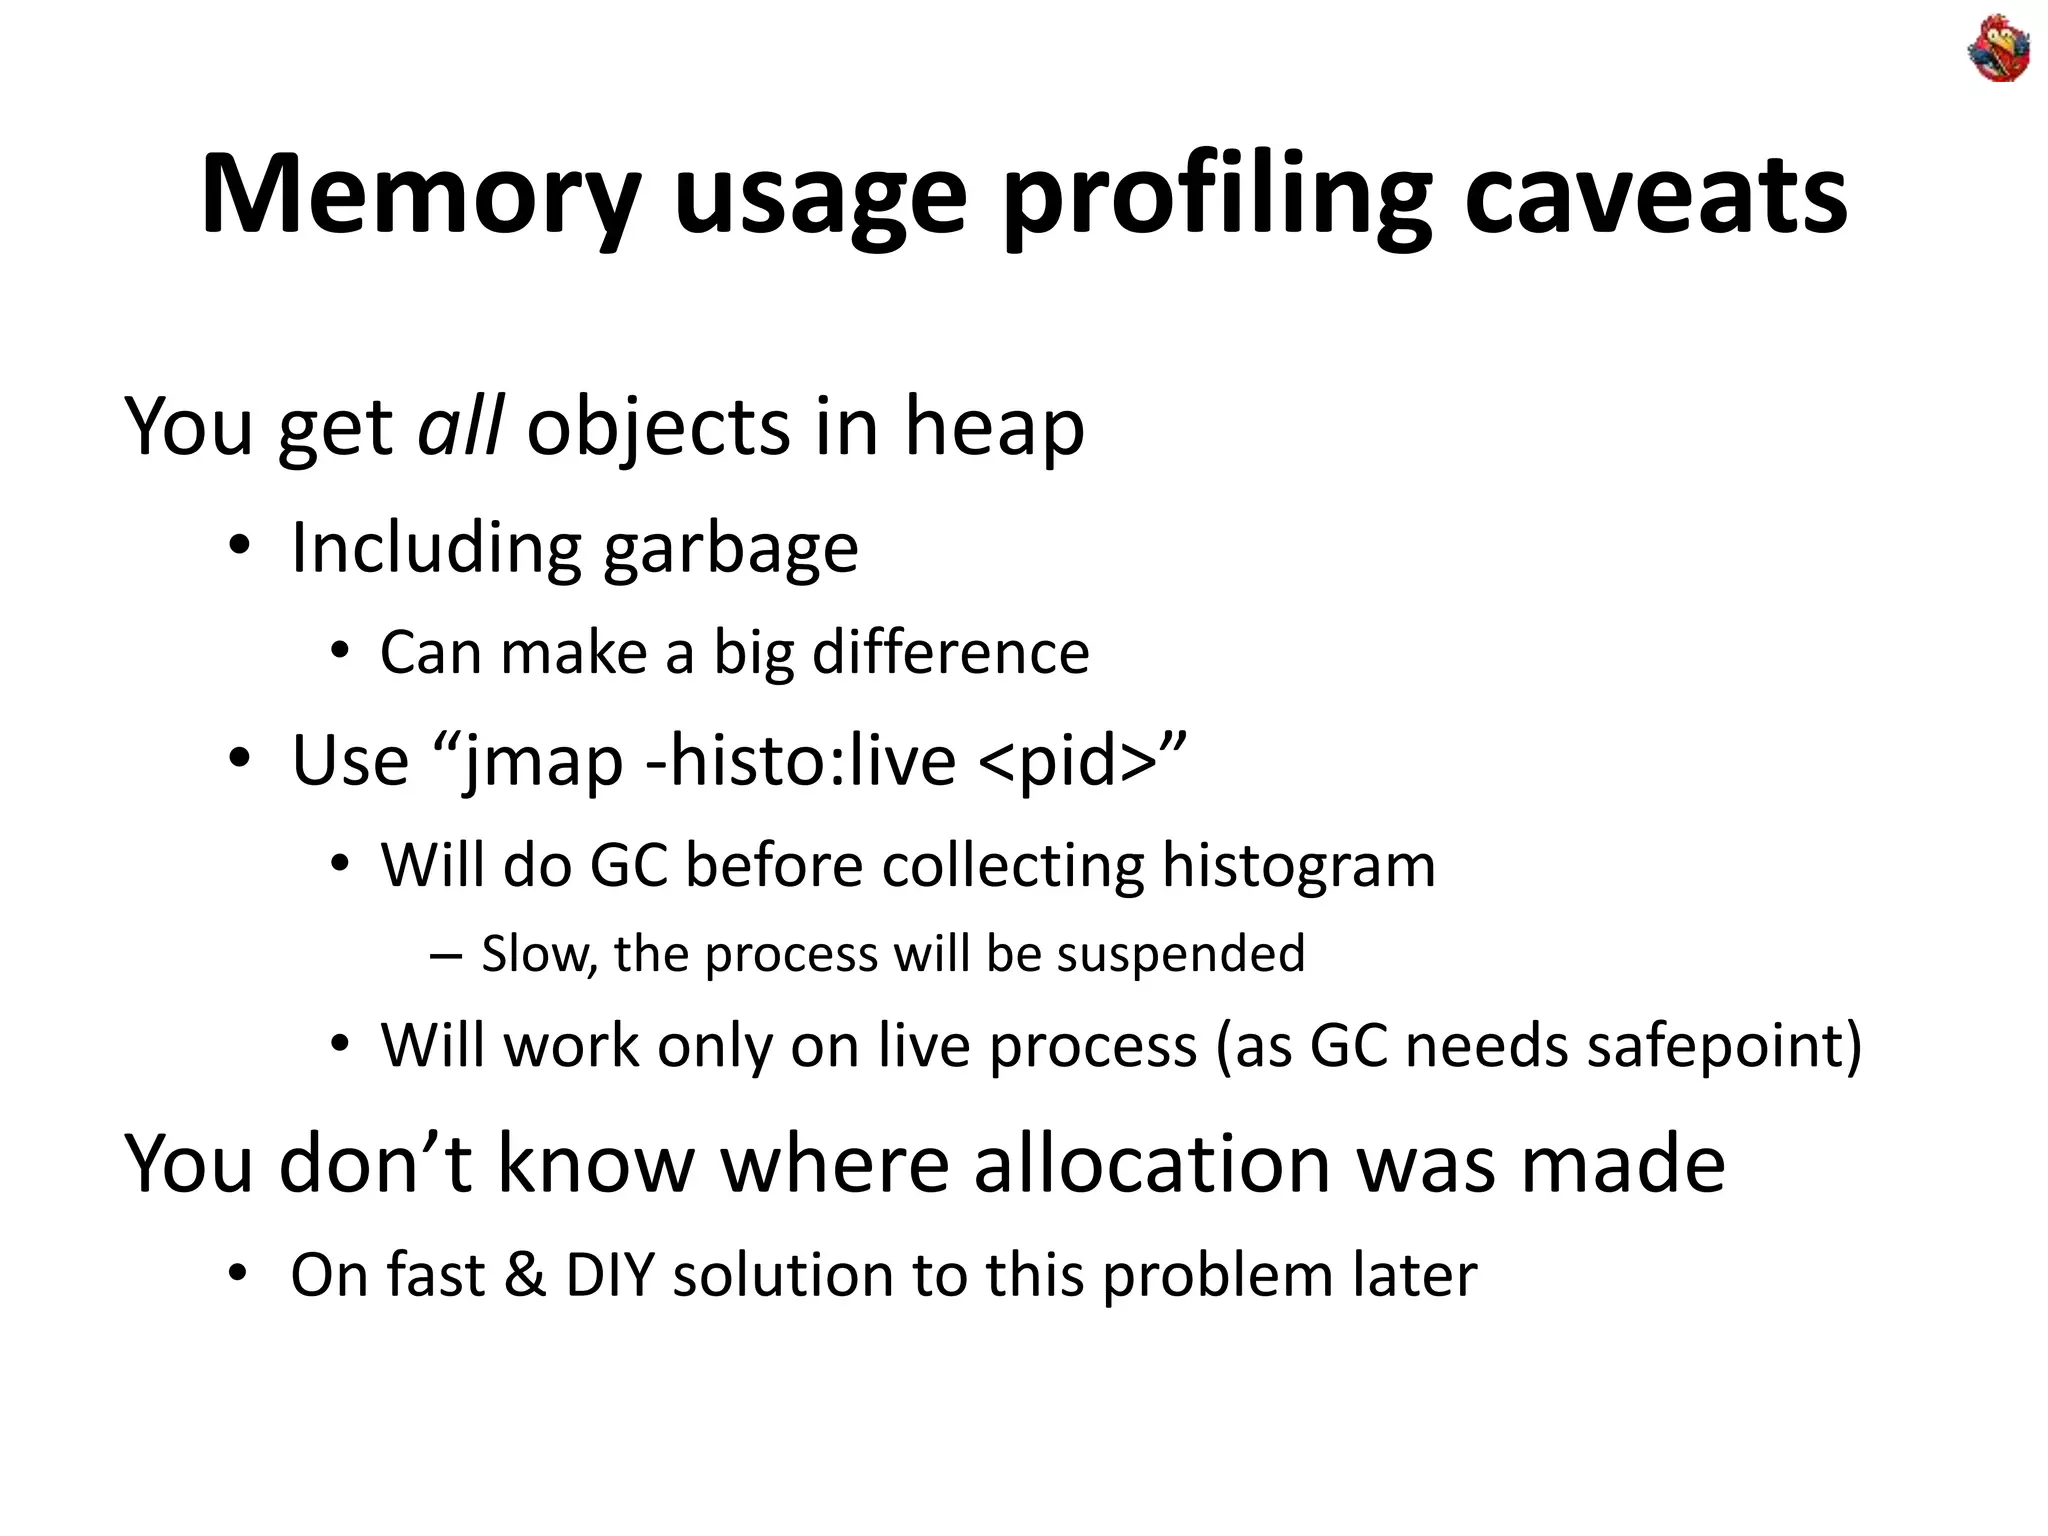
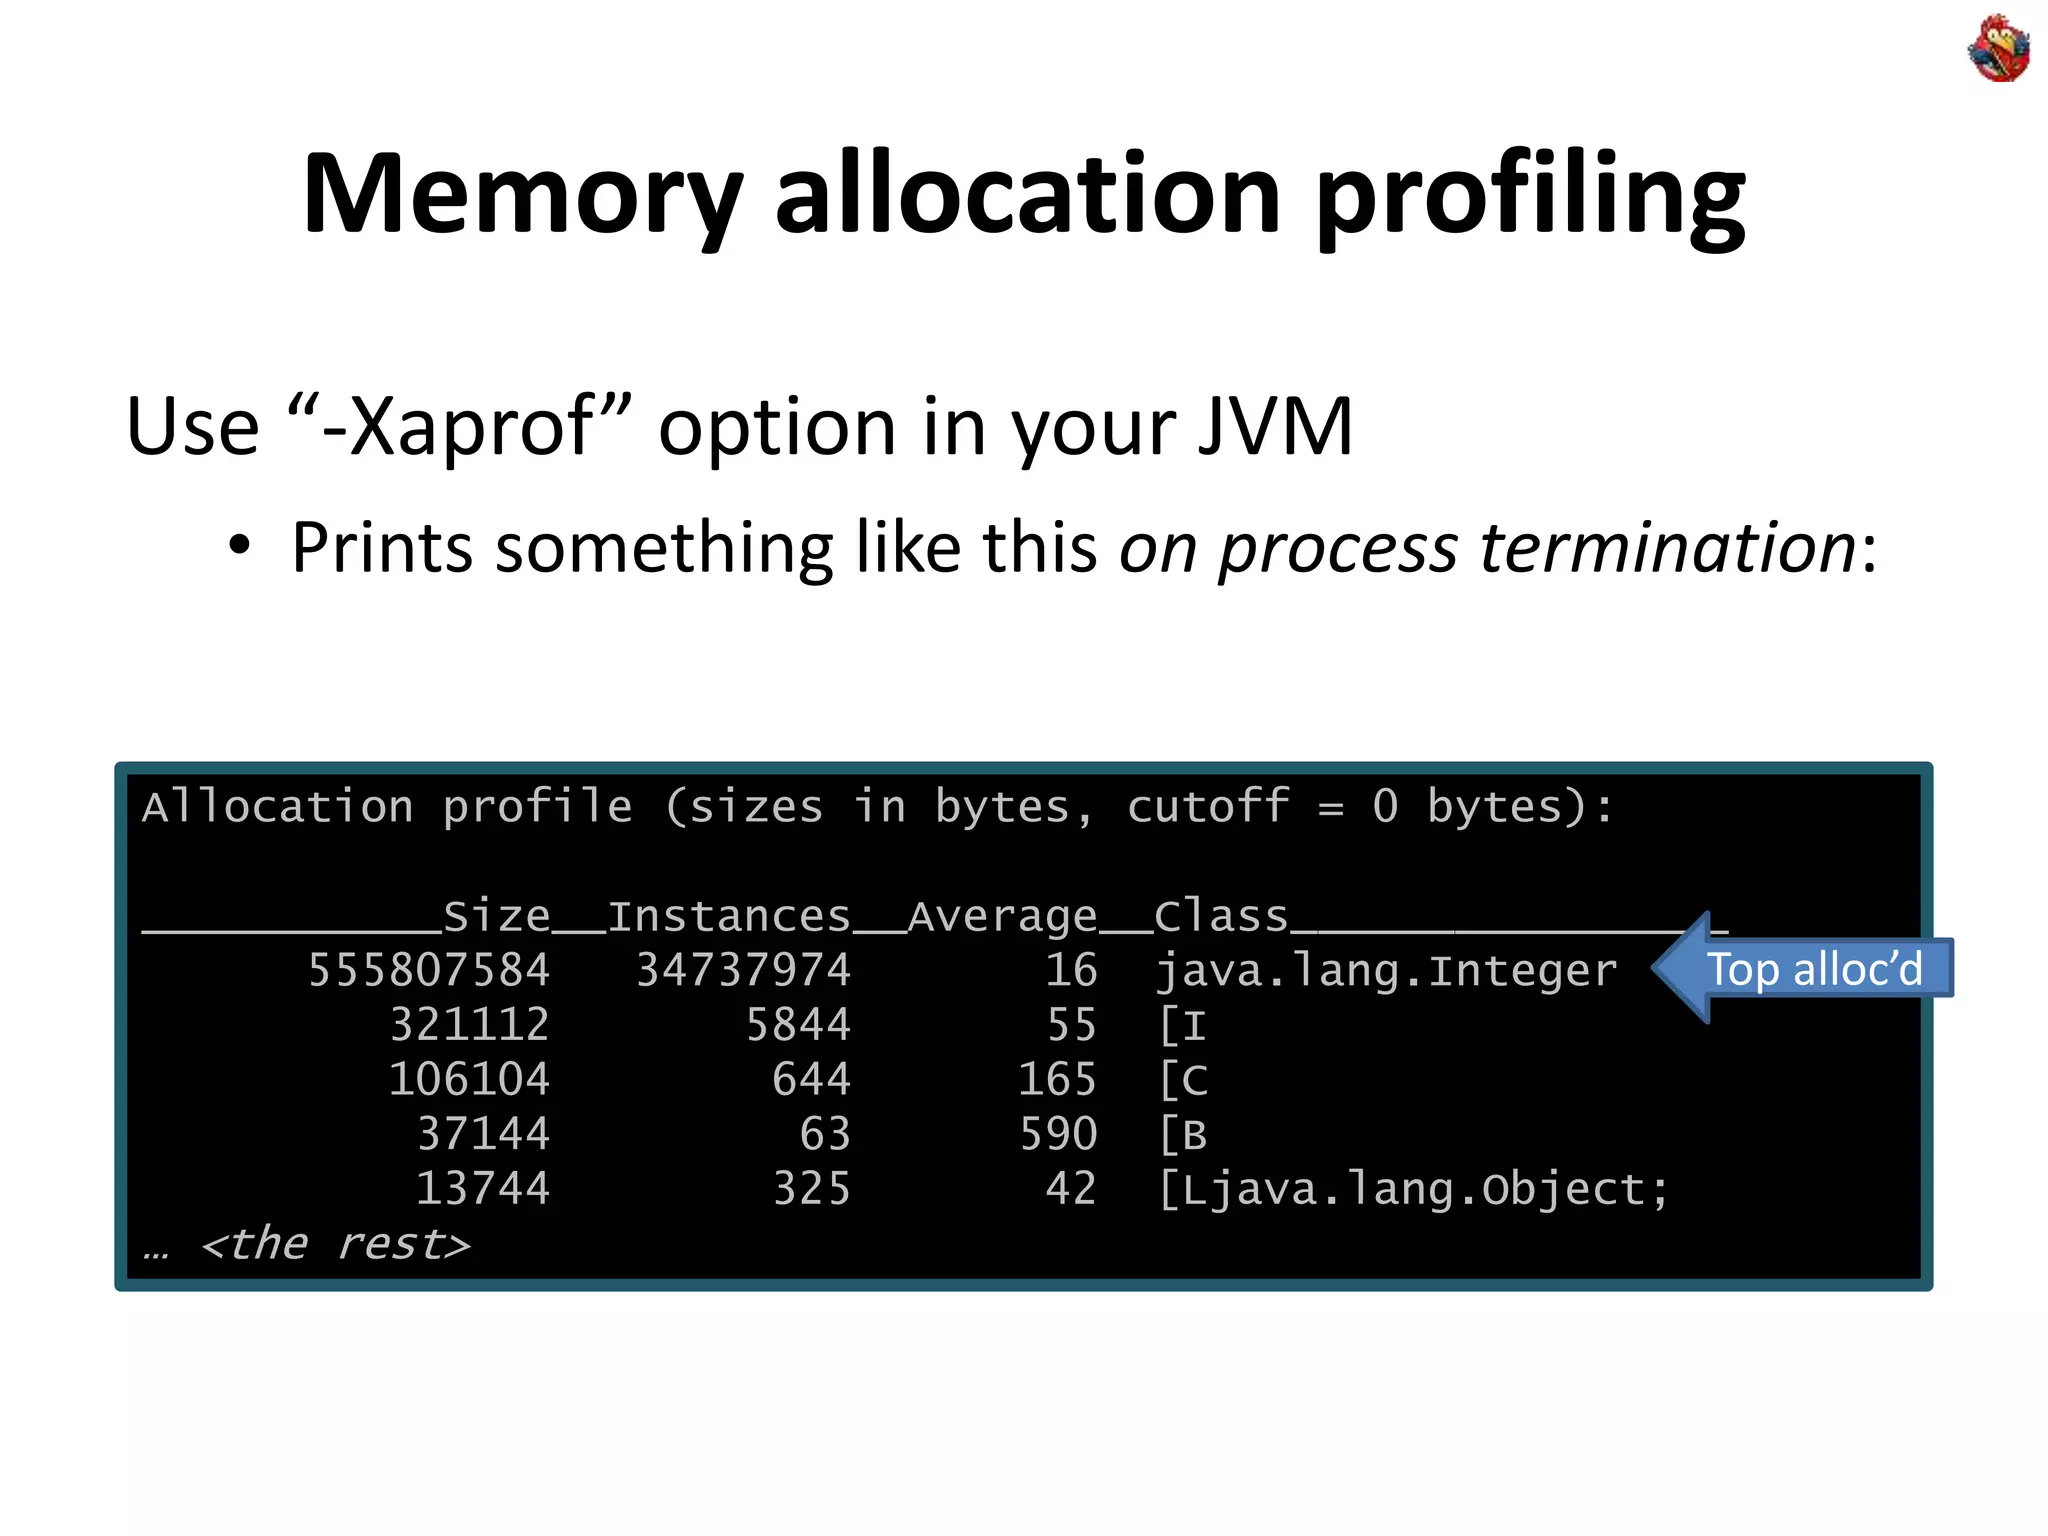
![Memory usage profiling
Use “jmap –histo <pid>”
• Use “jps” to find pids of your java processes
• You get something like this:
num #instances #bytes class name
----------------------------------------------
1: 772 115768 [C
2: 8 72664 [I
3: 77 39576 [B
4: 575 13800 java.lang.String
… <etc>
char[], top consumer
Total number of bytes consumed](https://image.slidesharecdn.com/diyjavaprofilingadd2011-140329164606-phpapp02/75/DIY-Java-Profiling-19-2048.jpg)
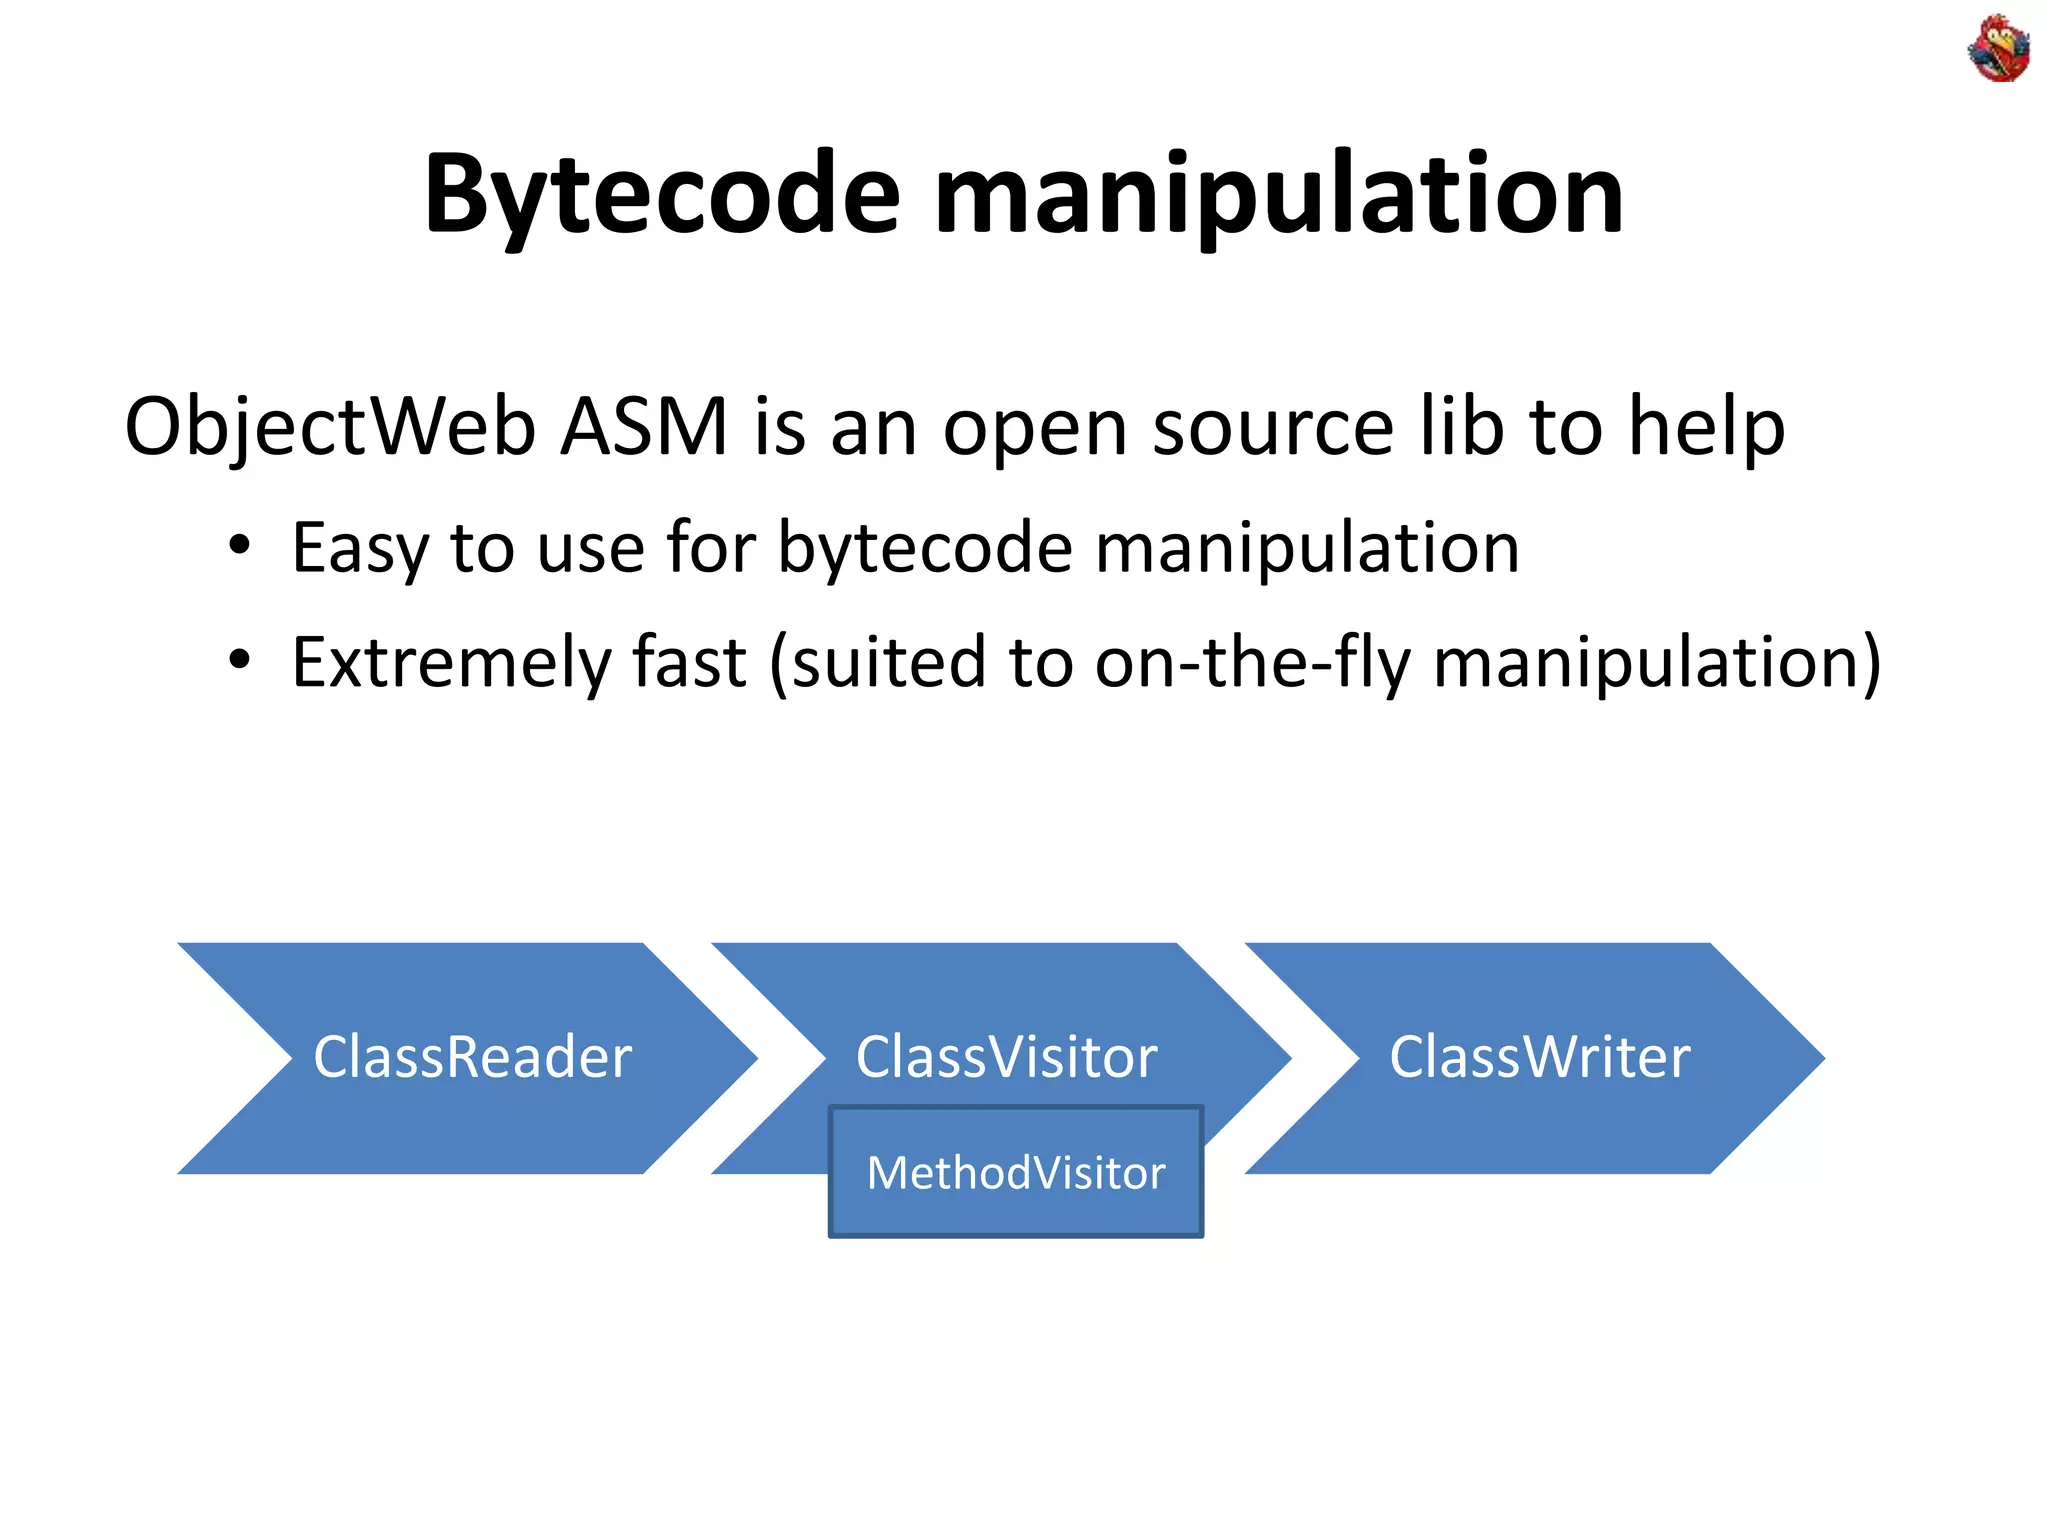
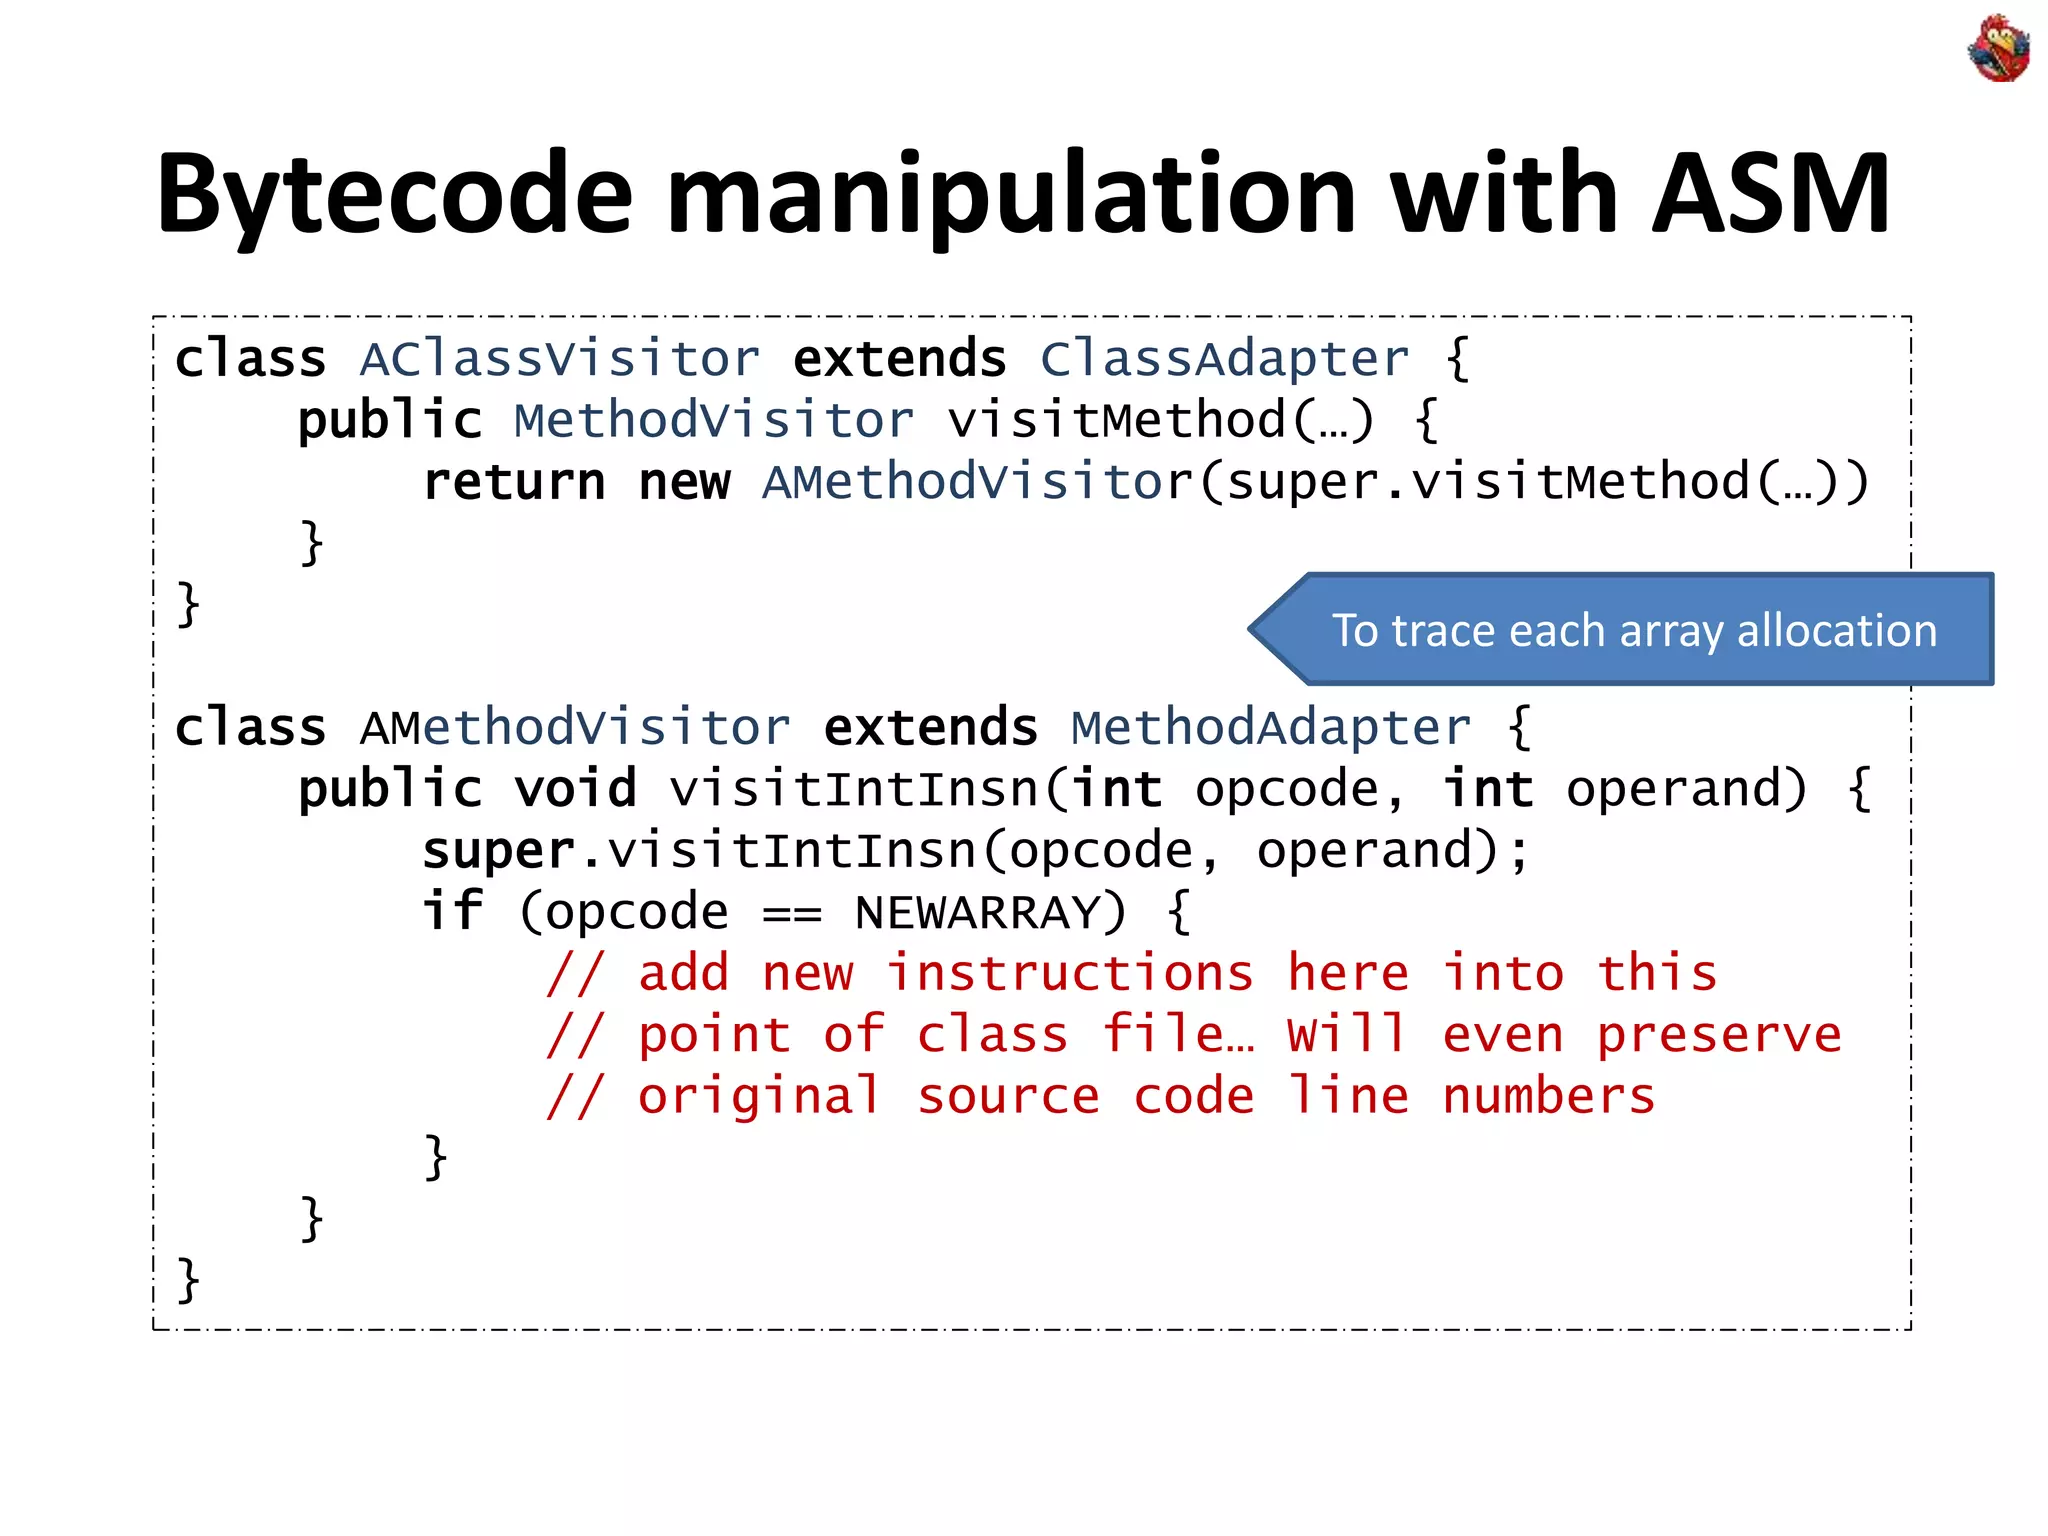
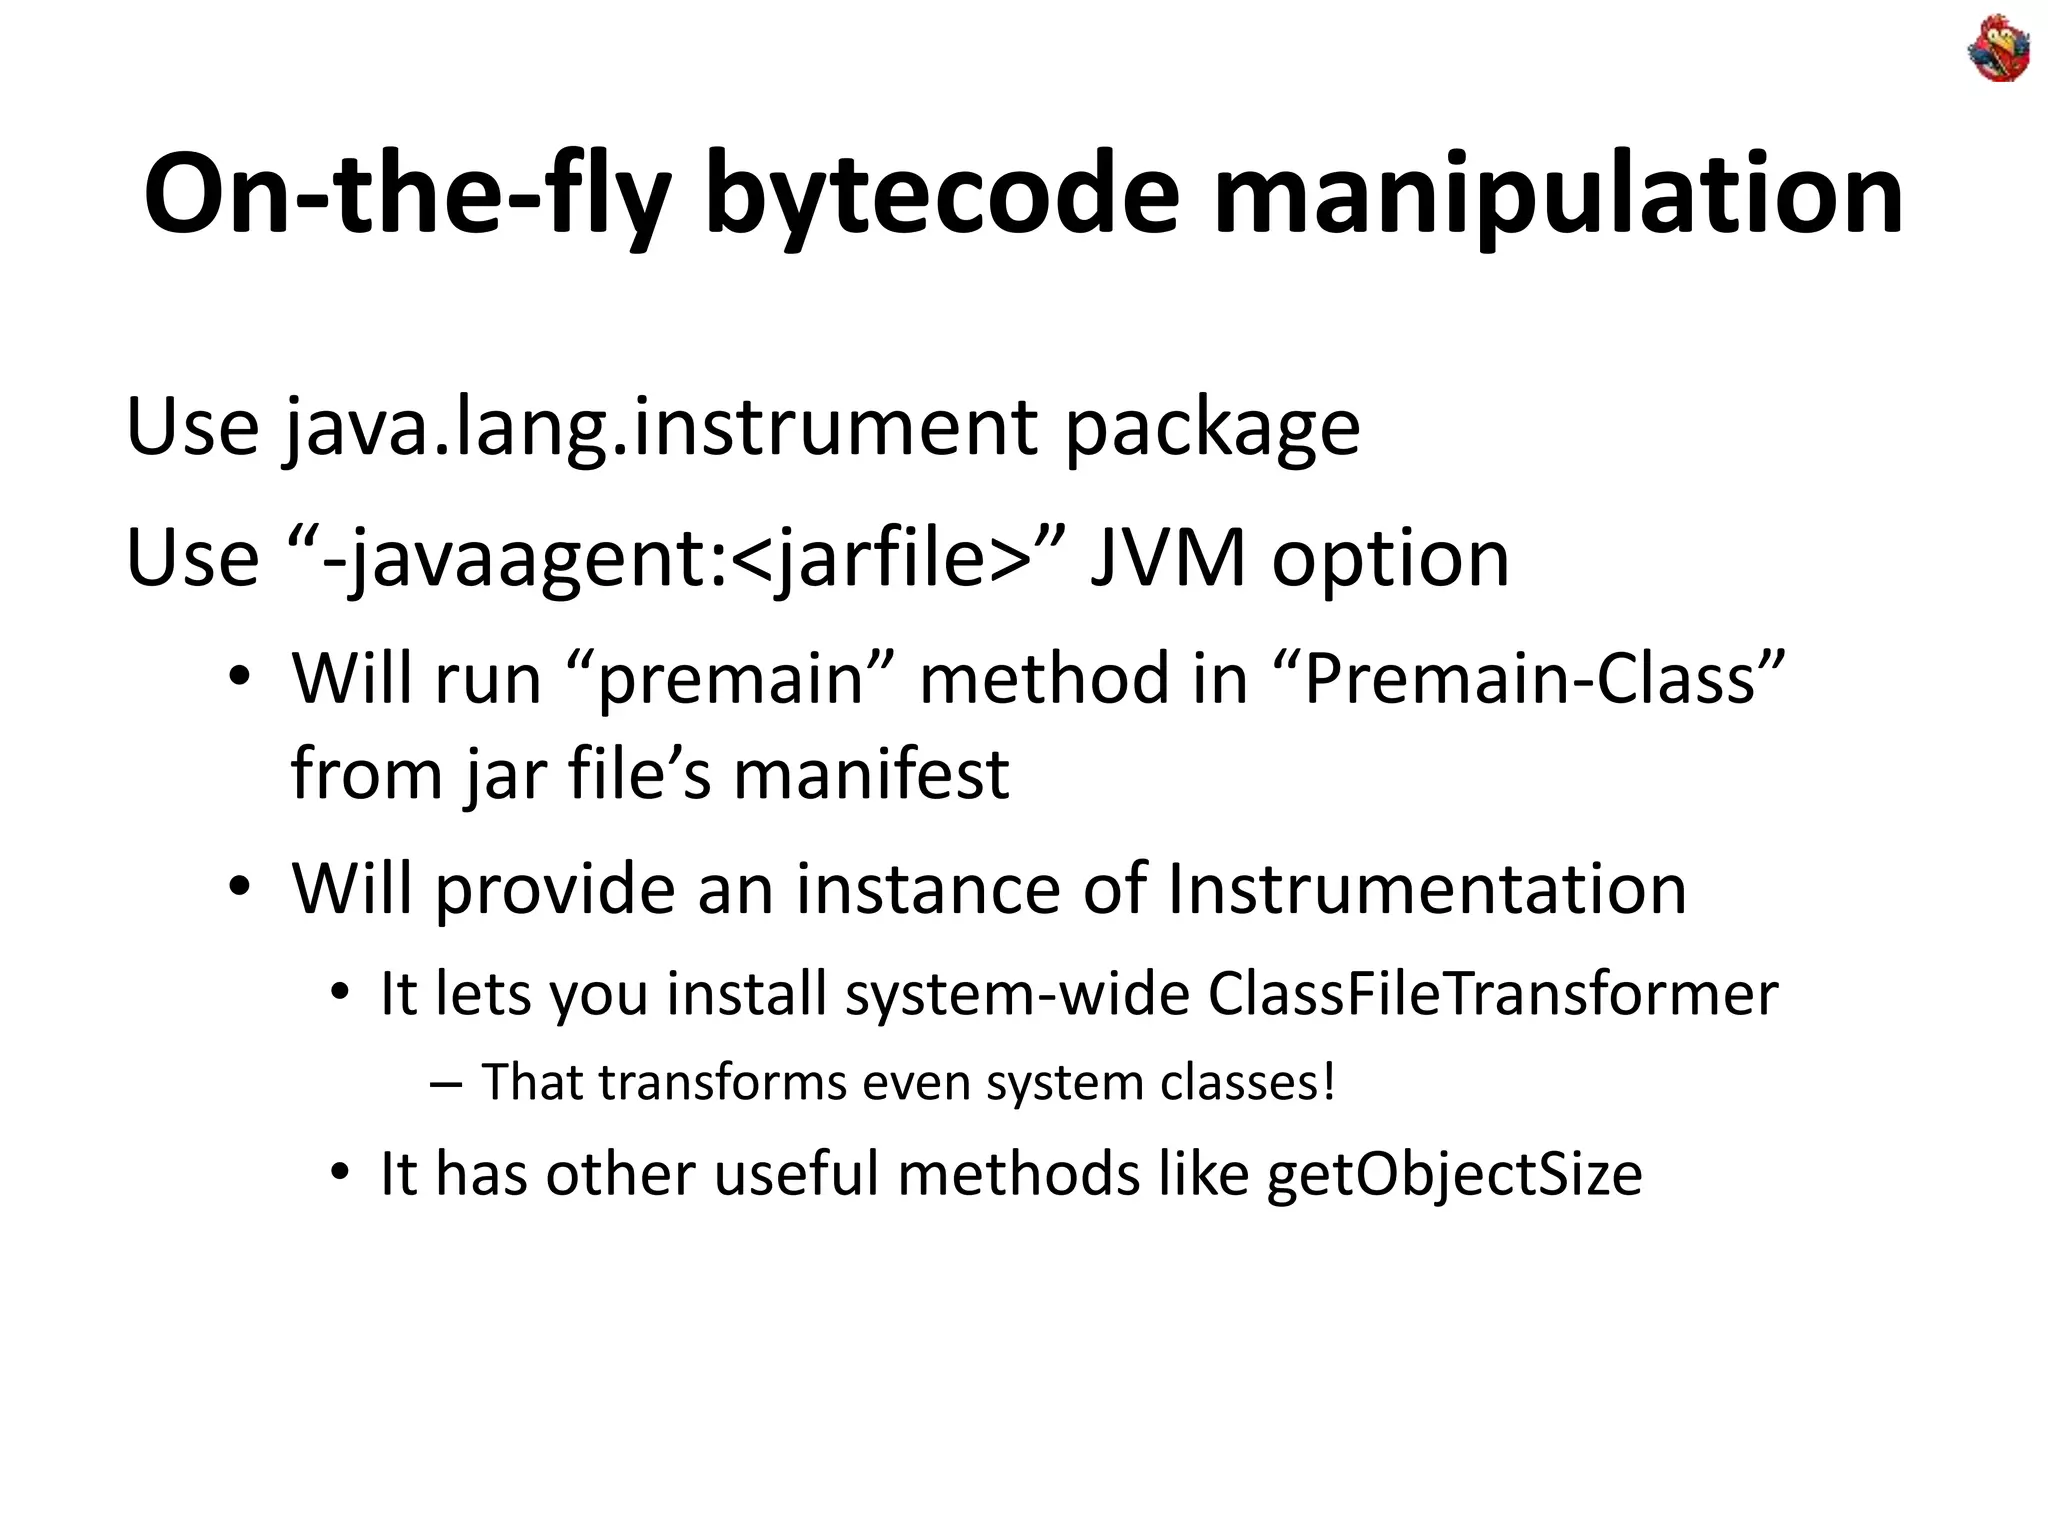
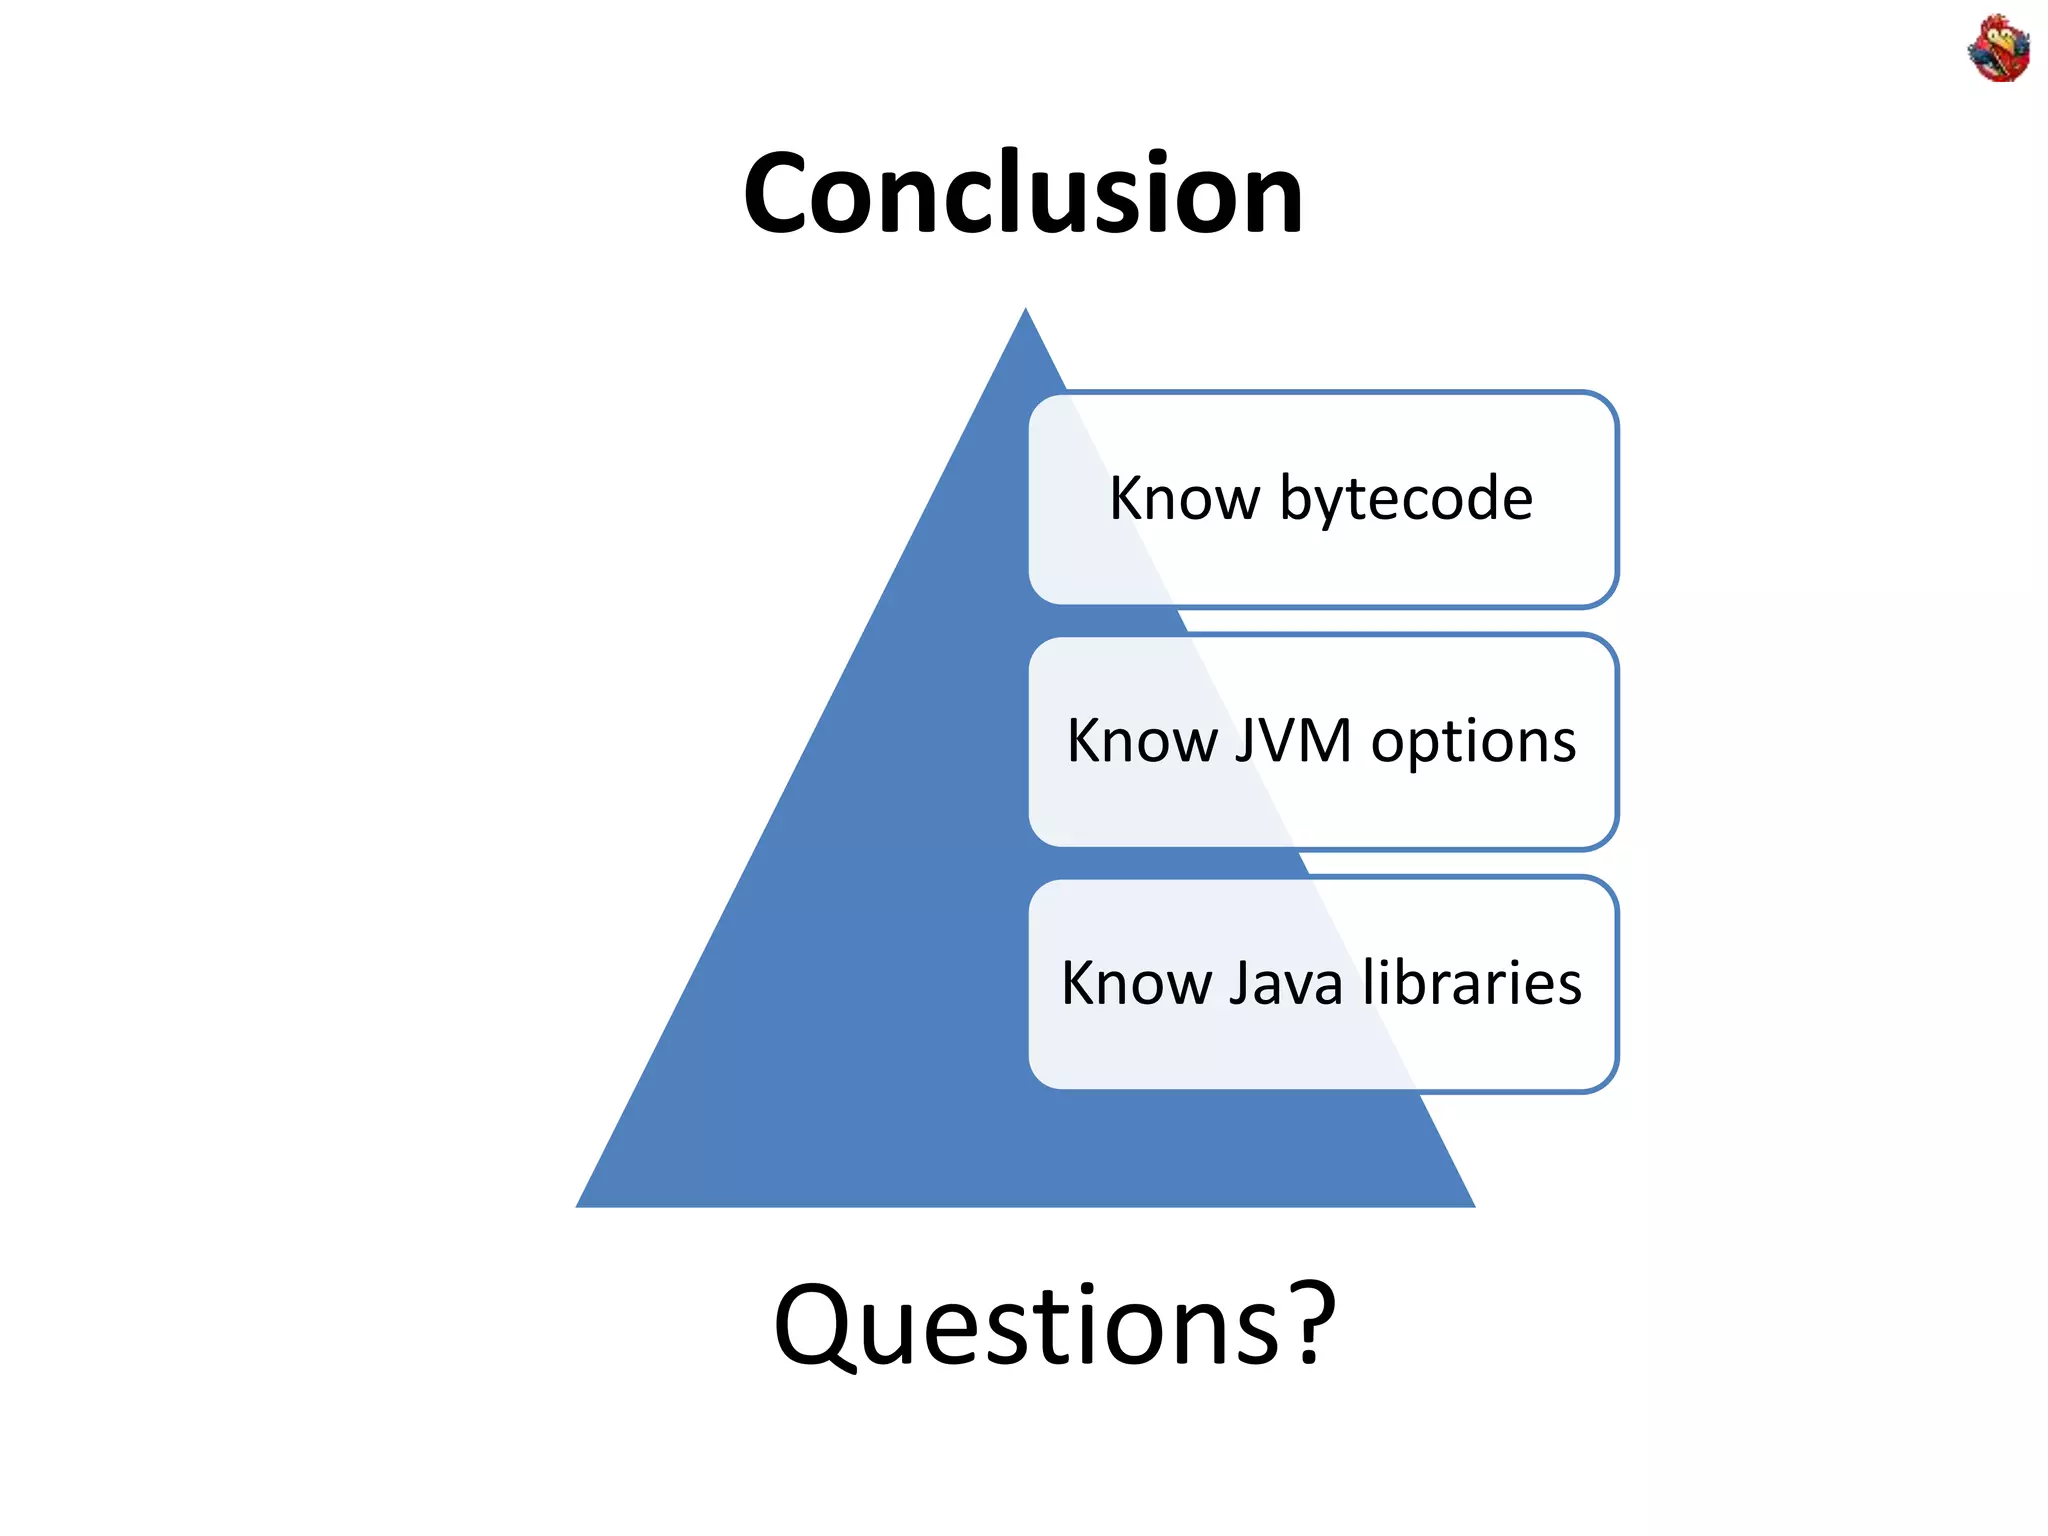

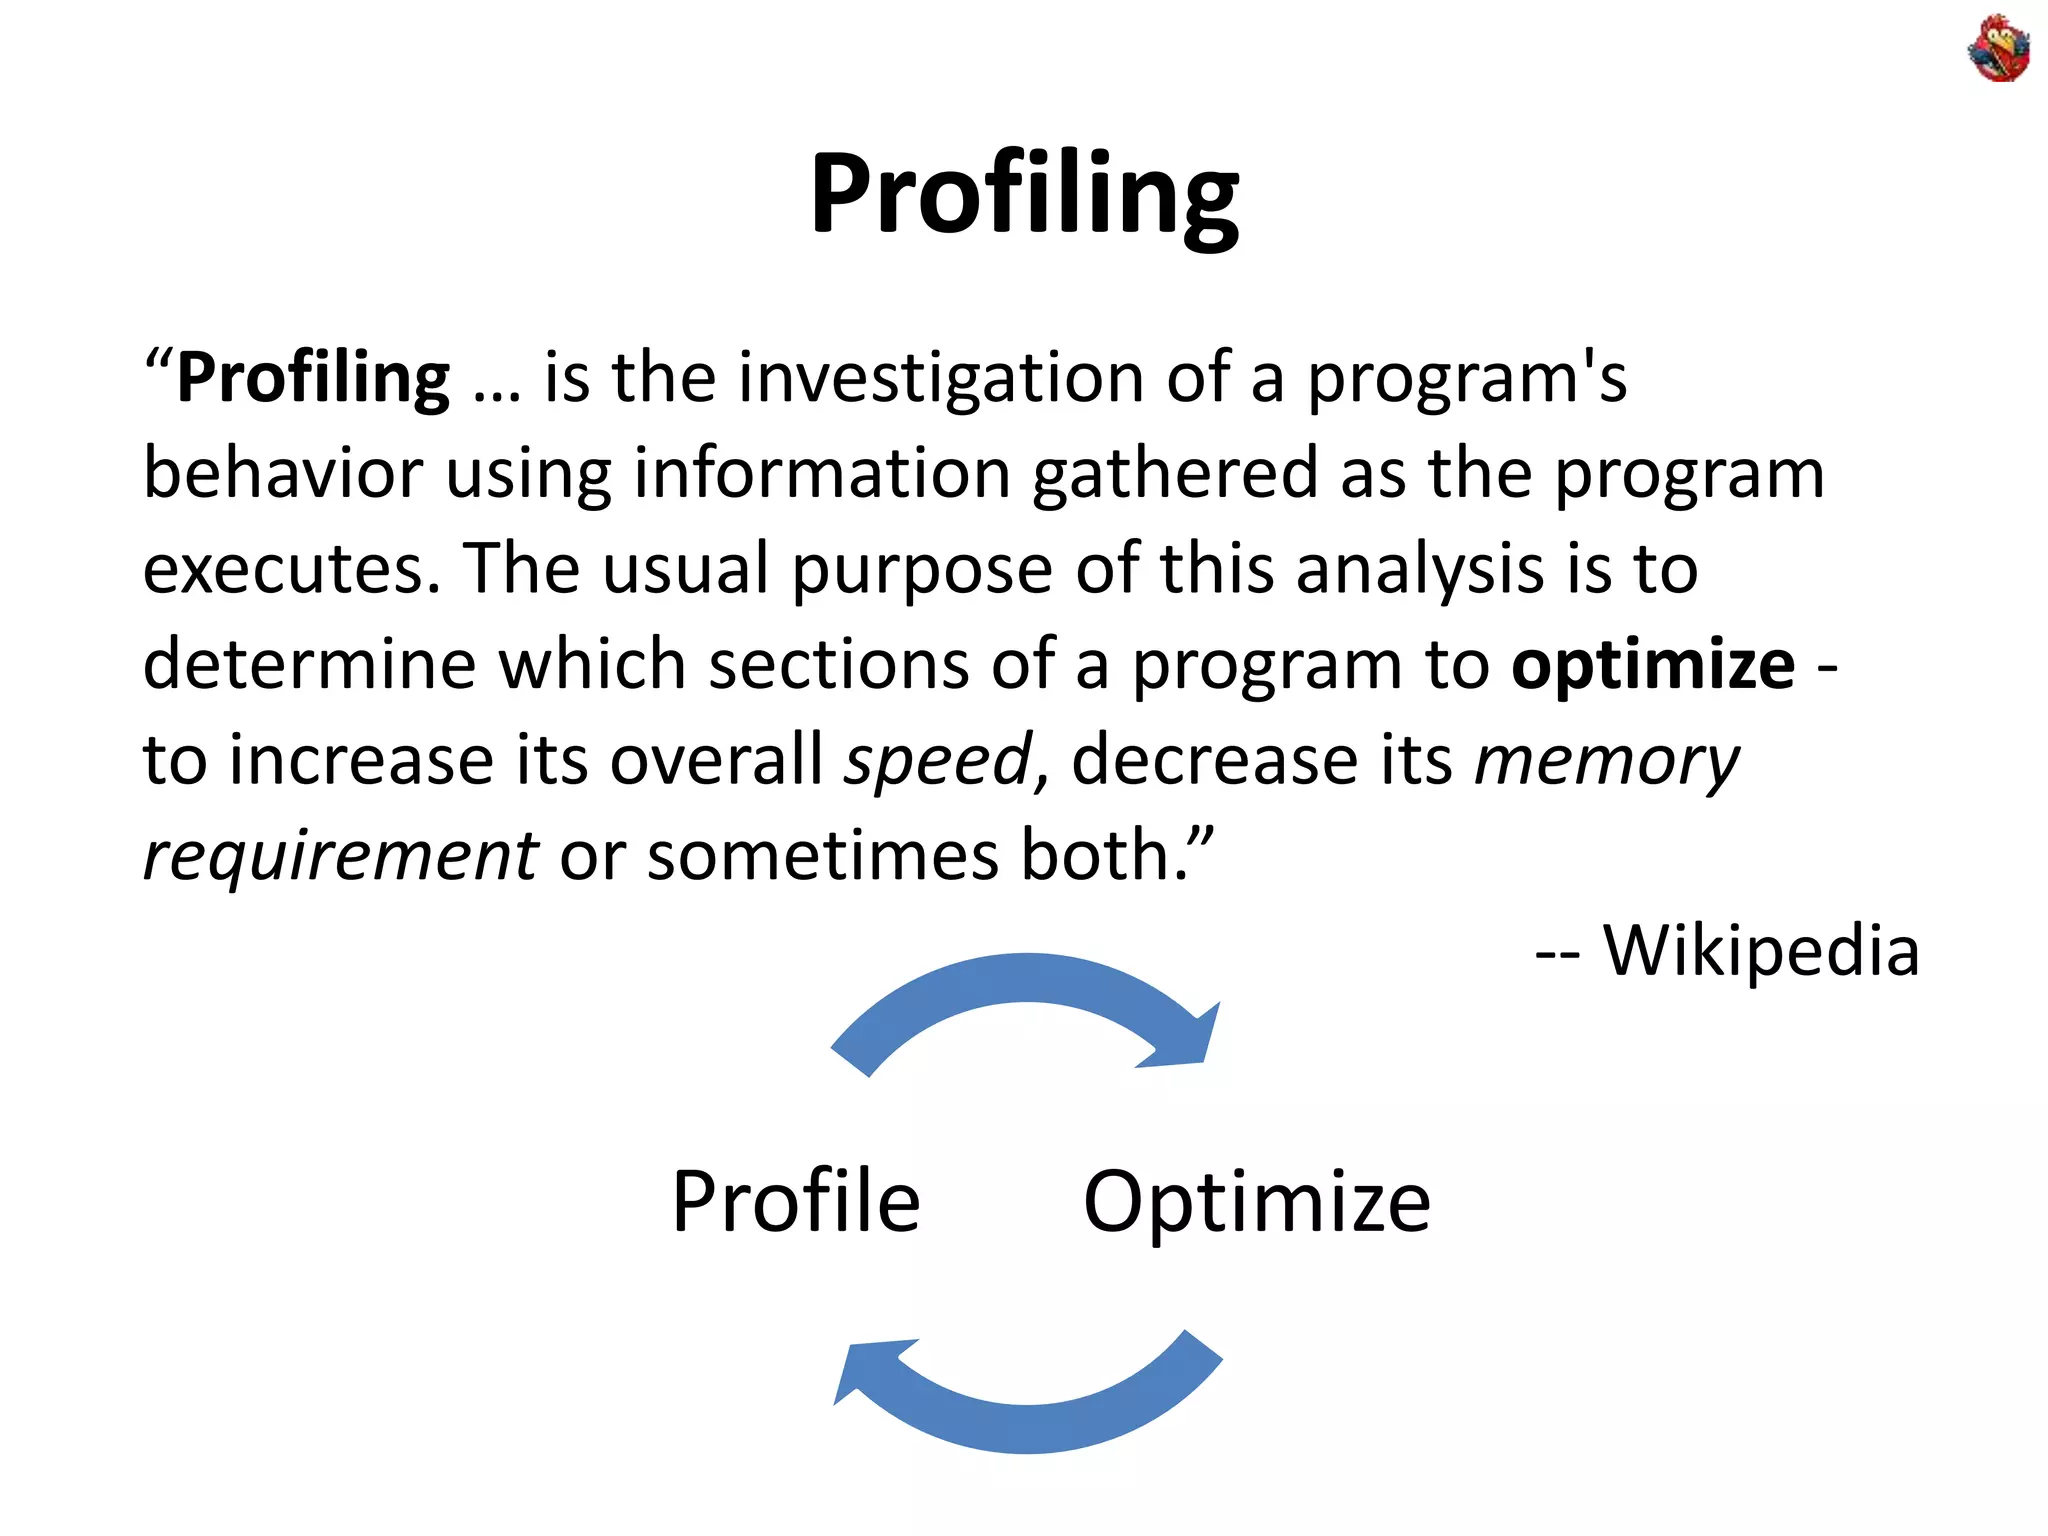
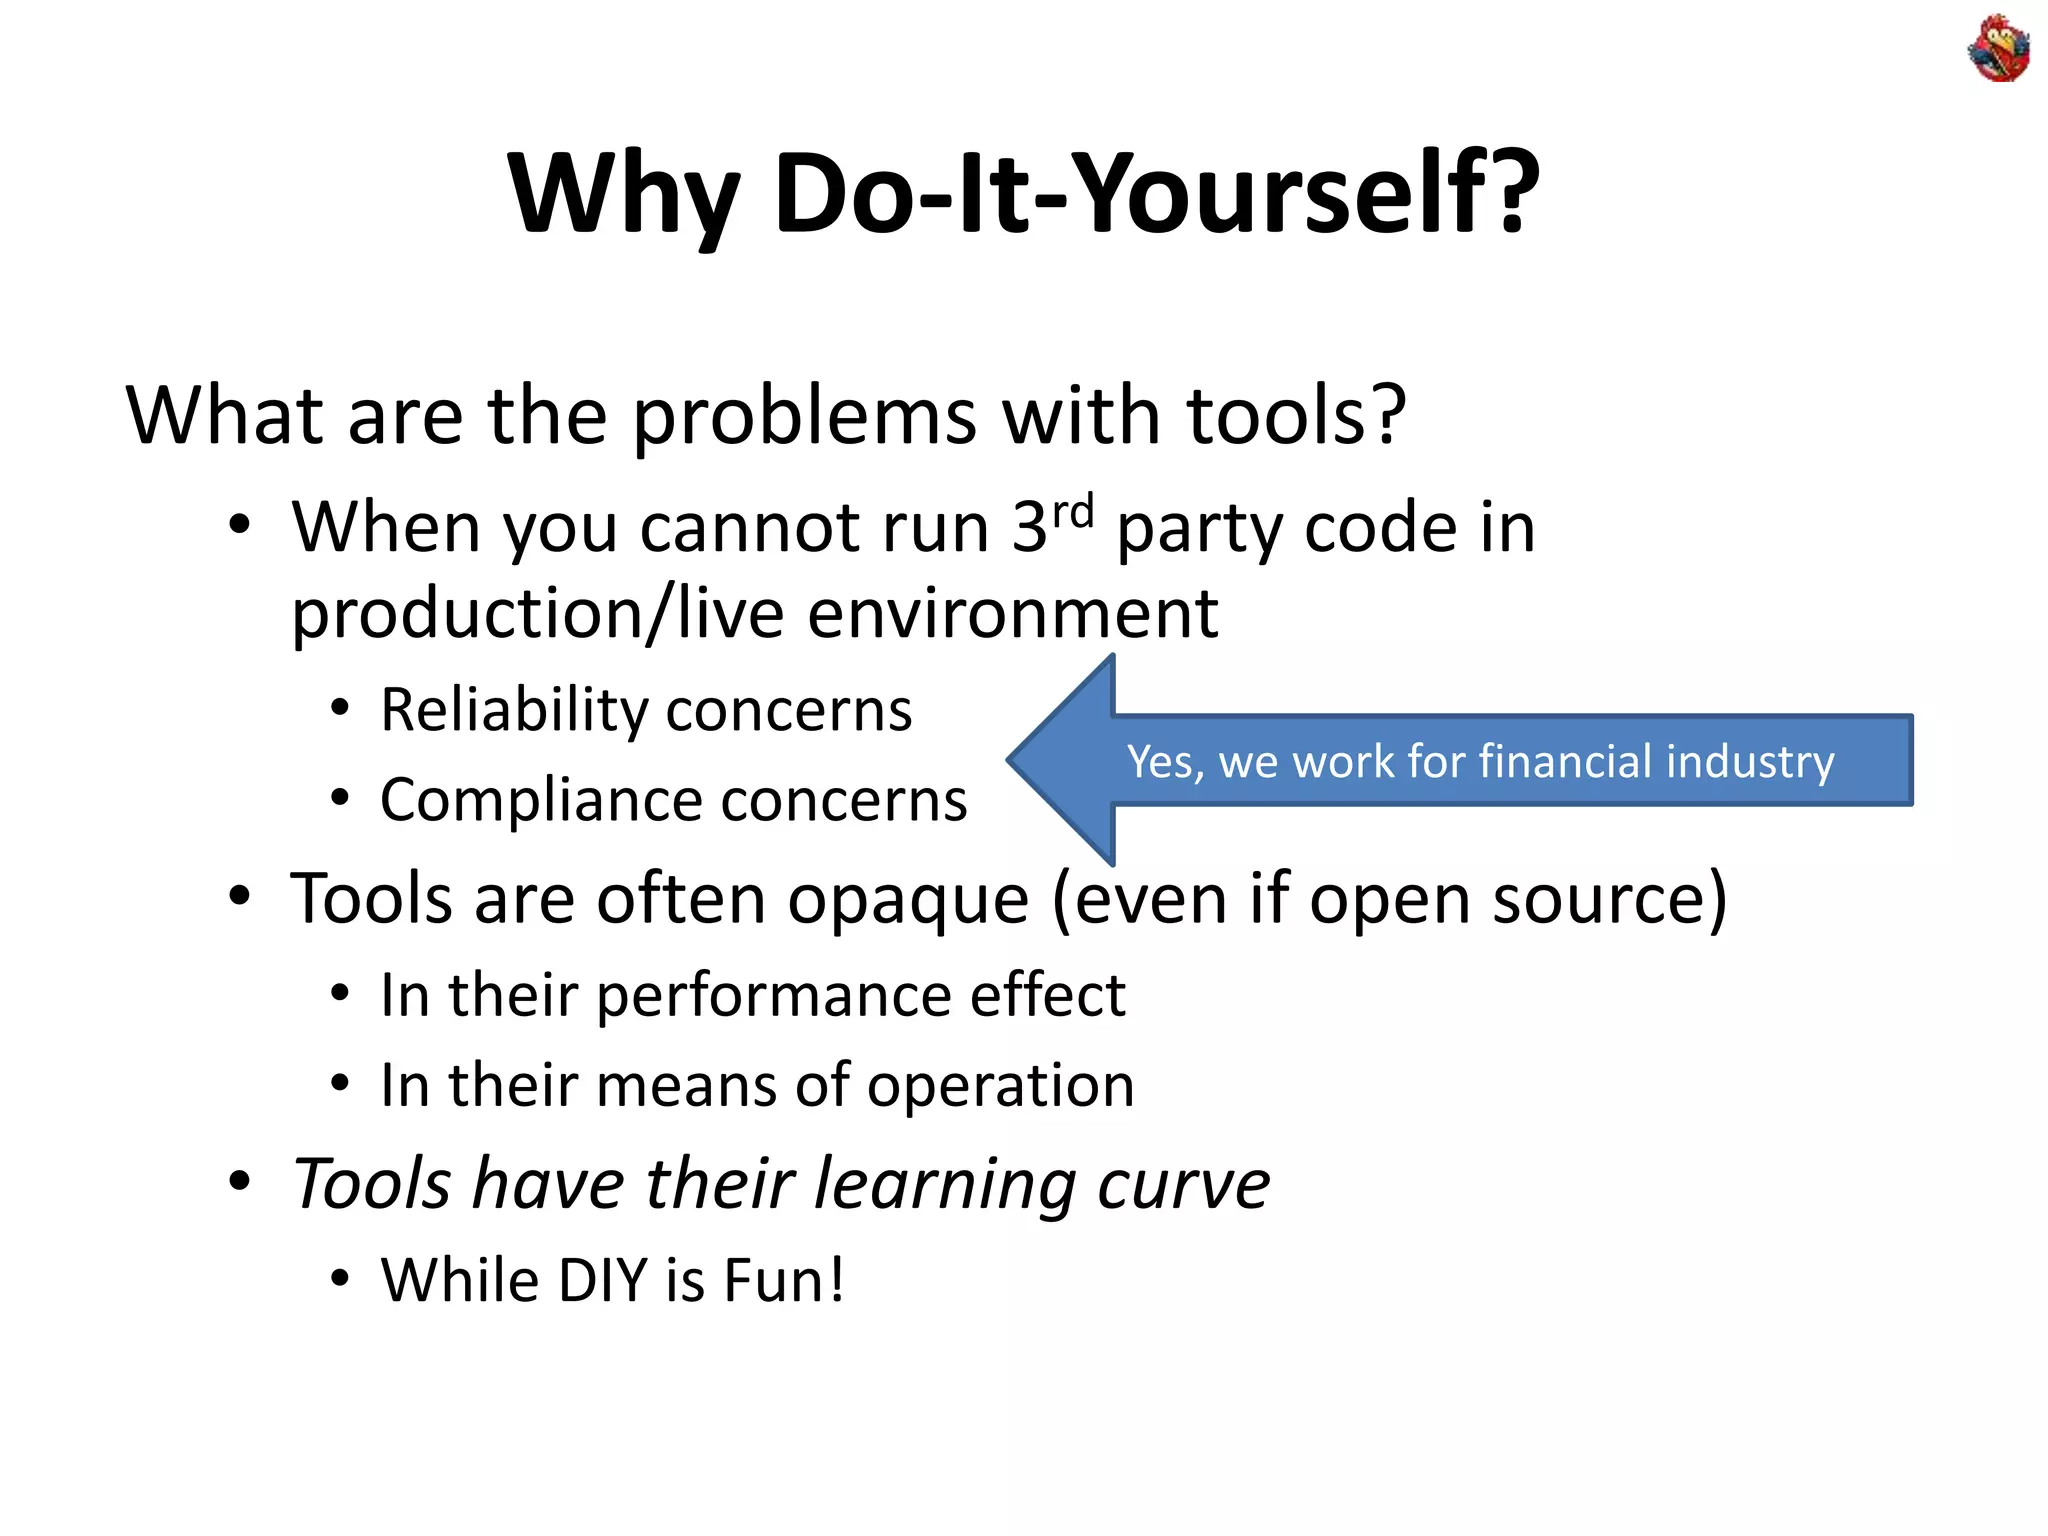
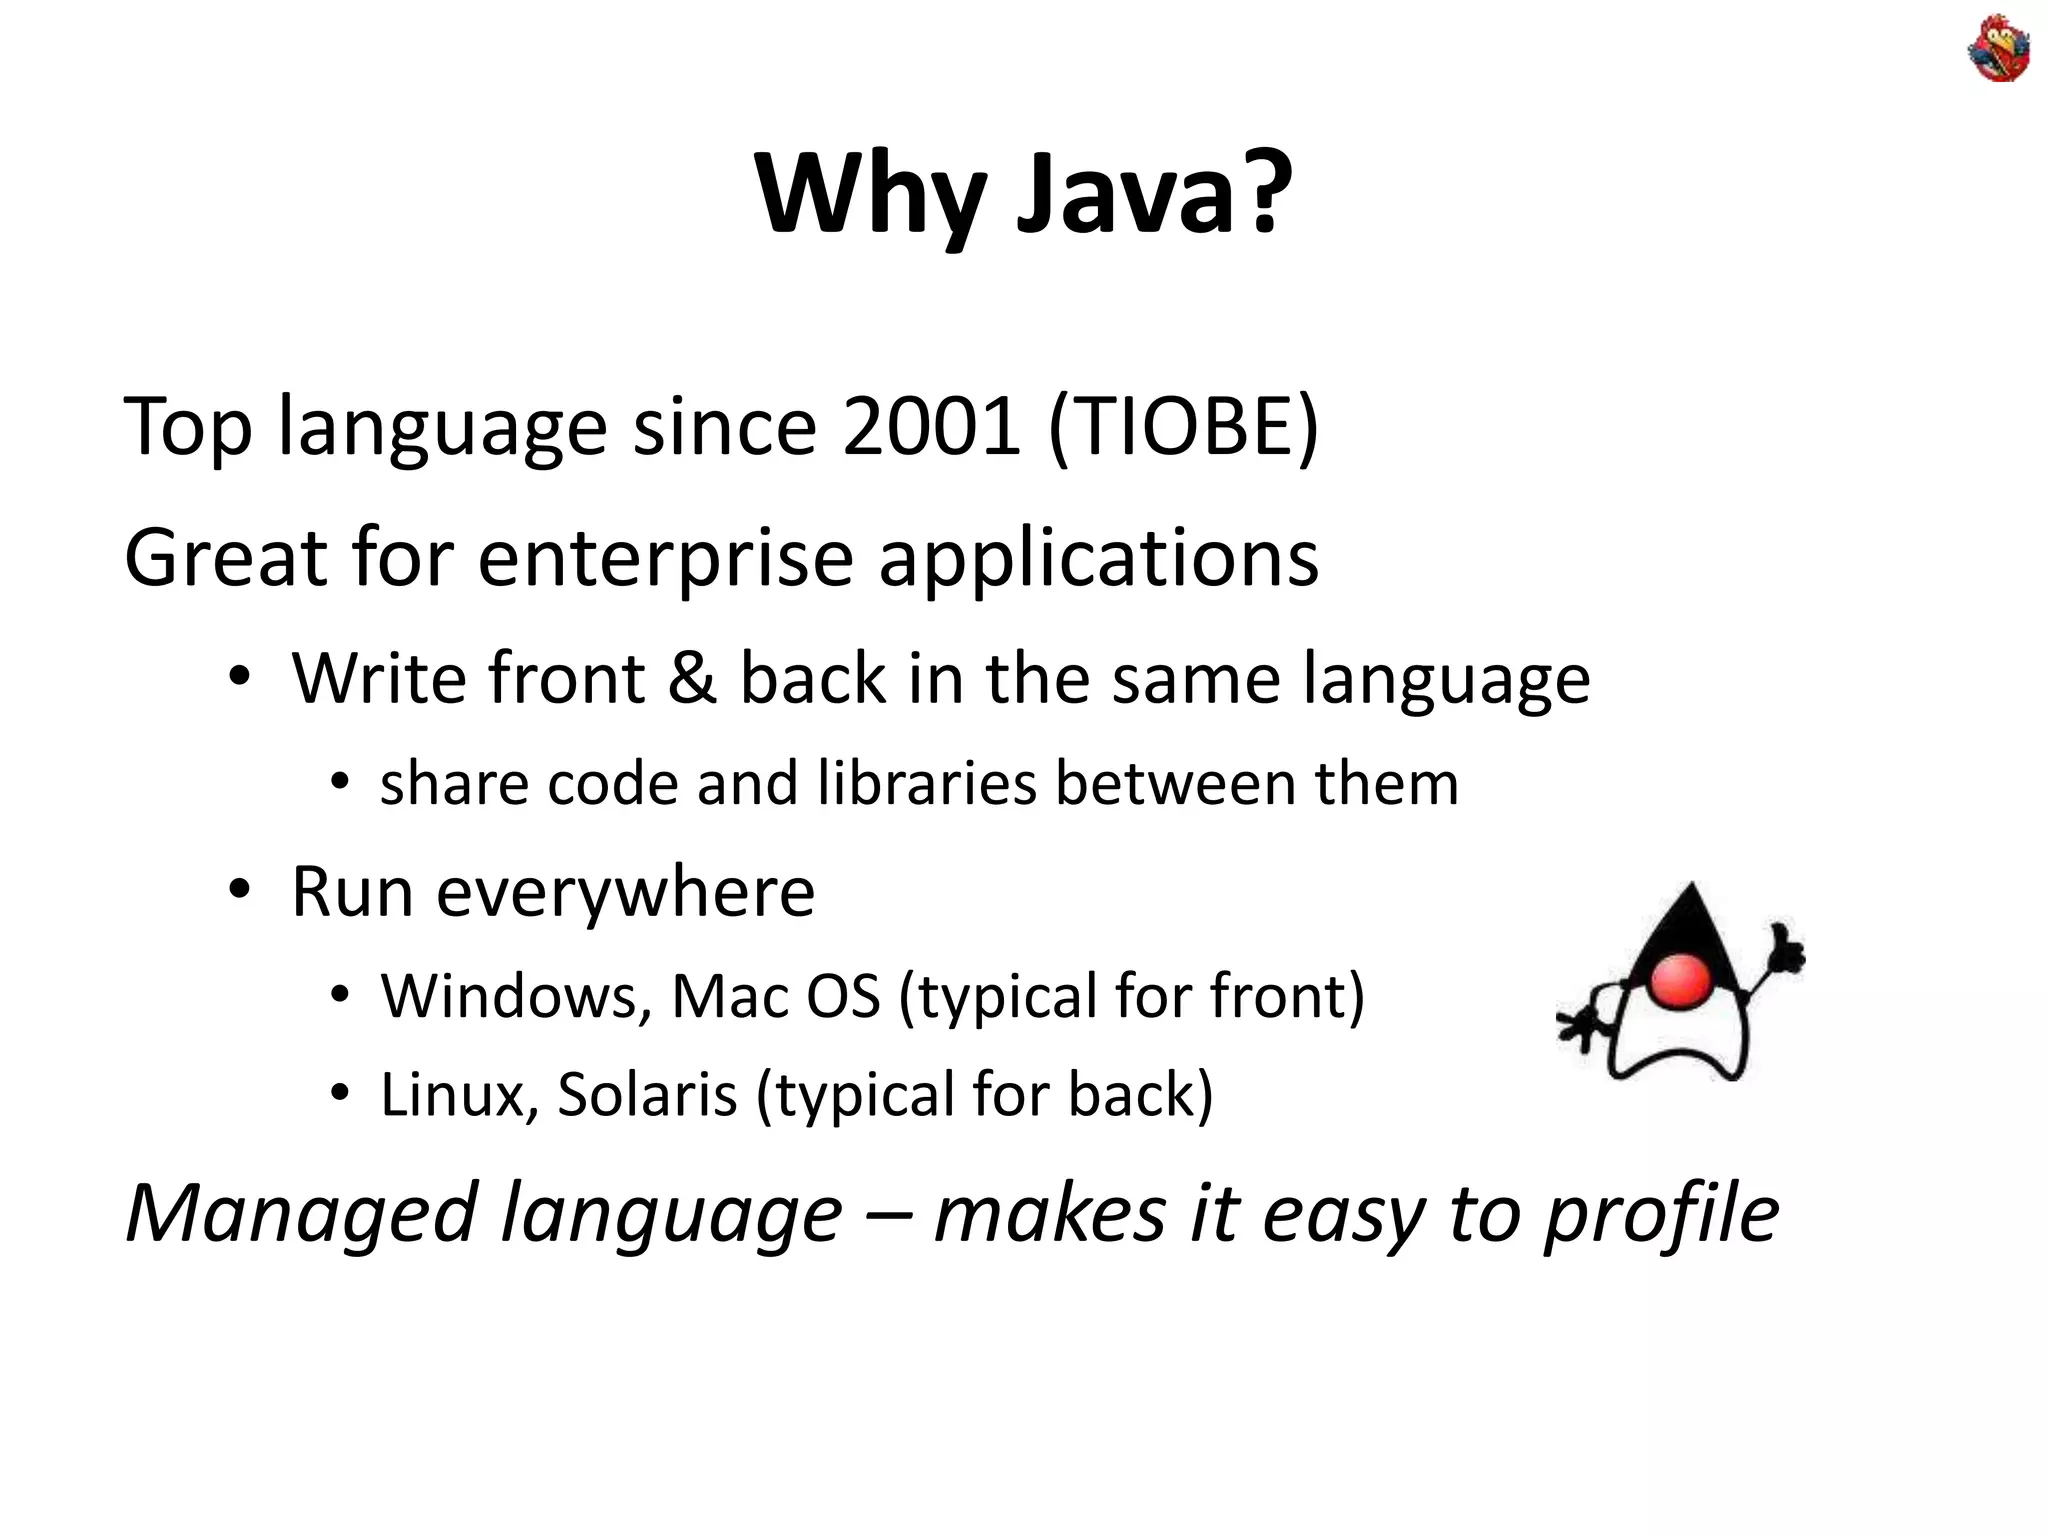
This document discusses different approaches for profiling Java applications without using third-party tools. It begins by explaining the benefits of a do-it-yourself approach such as avoiding reliability and compliance concerns with tools. Various profiling types are then covered, including CPU profiling using wall clock time and calls, sampling, and memory profiling using JVM options. Bytecode manipulation is also presented as a method using ASM to add profiling code without changing sources. The document emphasizes learning the Java Virtual Machine and using its built-in capabilities for profiling purposes.


![Multithreading and Parallelism on iOS [MobOS 2013]](https://cdn.slidesharecdn.com/ss_thumbnails/mobos2013-131122085438-phpapp02-thumbnail.jpg?width=640&height=640&fit=bounds)