Debugging Machine Code Using GDB(GNU Debugger) .pptx
Debugging Machine Code Using GDB
Introduction of GDB (GNU Debugger)
How GDB Works
Benefits of Using GDB
Assembly Program(with program steps)
Steps are using GDB in code
Conclusions
Debugging Machine Code
UsingGDB
GROUP 7
Mr. Saifullah
Mr. Abubaker
M. Mubashir
Rooma Maryam
Mr. Sohail Khursheed
Mr. Arslan
3.
Debugging Machine CodeUsing GDB
Introduction of GDB (GNU Debugger)
How GDB Works
Benefits of Using GDB
Assembly Program(with program steps)
Steps are using GDB in code
Conclusions
GDB (GNU Debugger):
GDB is a powerful debugging tool that helps developers identify and fix errors in their programs. It
supports multiple programming languages, including Assembly, C, C++, and more. By providing a detailed look into the program’s
execution,GDB allows developers to analyze both the program logic and runtime behavior.
Breakpoint Management:
allow to pause program execution at specific lines .
You can set, disable, enable, or remove breakpoints dynamically during debugging.
Introduction of GDB (GNU Debugger)
Key Features
6.
Stepping:
execute yourprogram line by line or instruction by instruction.
This helps the program flows and how variables change.
useful for detecting logic errors or unexpected behavior.
Register Inspection:
You can also modify registers to test how the program reacts to different conditions.
Register inspection helps in understanding how the CPU processes instructions and manages data.
Memory Inspection:
You can examine memory contents at specific addresses using GDB commands.
Memory inspection helps you understand how variables, arrays, and pointers are stored.
Stack Analysis:
GDB allows you to view the call stack, which shows the sequence of function calls.
It is essential for understanding program execution flow and fixing runtime errors.
Compilation
Before debugging,compile your program with debugging information using
the -g flag (e.g., gcc -g program.c -program).
This information allows GDB to map machine instructions back to your source code.
Loading
Load your program into GDB using gdb program.
You can set breakpoints, watchpoints, or configure the environment before running the program.
How GDB Works
9.
Debugging
Use GDBcommands to inspect and manipulate program state during execution.
Check registers, memory contents, variable values, and the call stack to understand program behavior.
Debugging in GDB provides deep insight into program execution, helping locate and fix errors efficiently.
Analysis and Reporting
After debugging, analyze the results to understand the root causes of issues.
Generate reports or notes about bugs and how they were resolved for future reference.
Use GDB logs or output to validate that the program now behaves as expected.
Execution
Run the program under GDB’s control using the run command.
Execution can be paused at breakpoints, allowing you to inspect variables and program state at critical points.
You can also step through the code line by line (next) or instruction by instruction (stepi).
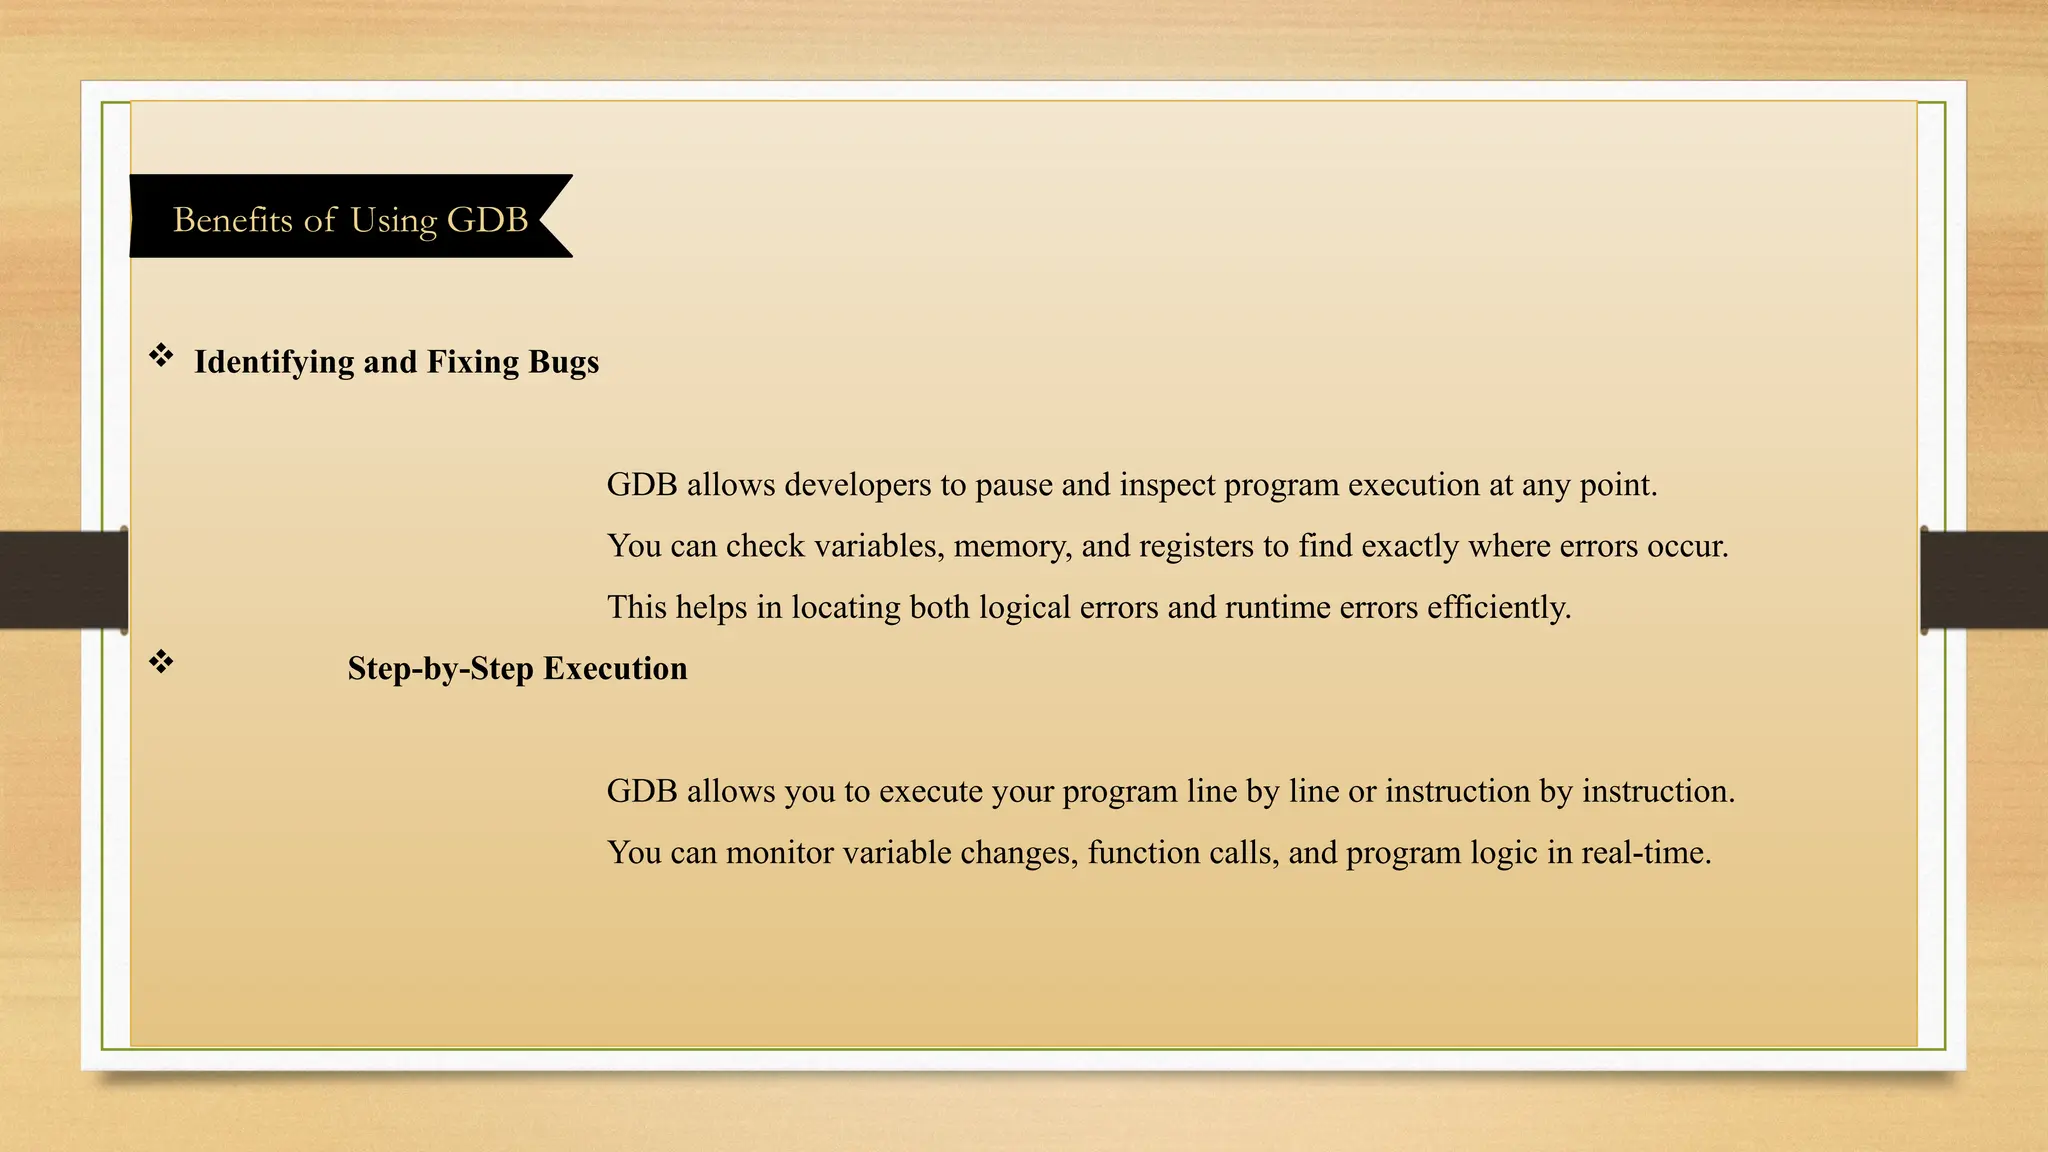
Identifying andFixing Bugs
GDB allows developers to pause and inspect program execution at any point.
You can check variables, memory, and registers to find exactly where errors occur.
This helps in locating both logical errors and runtime errors efficiently.
Step-by-Step Execution
GDB allows you to execute your program line by line or instruction by instruction.
You can monitor variable changes, function calls, and program logic in real-time.
Benefits of Using GDB
12.
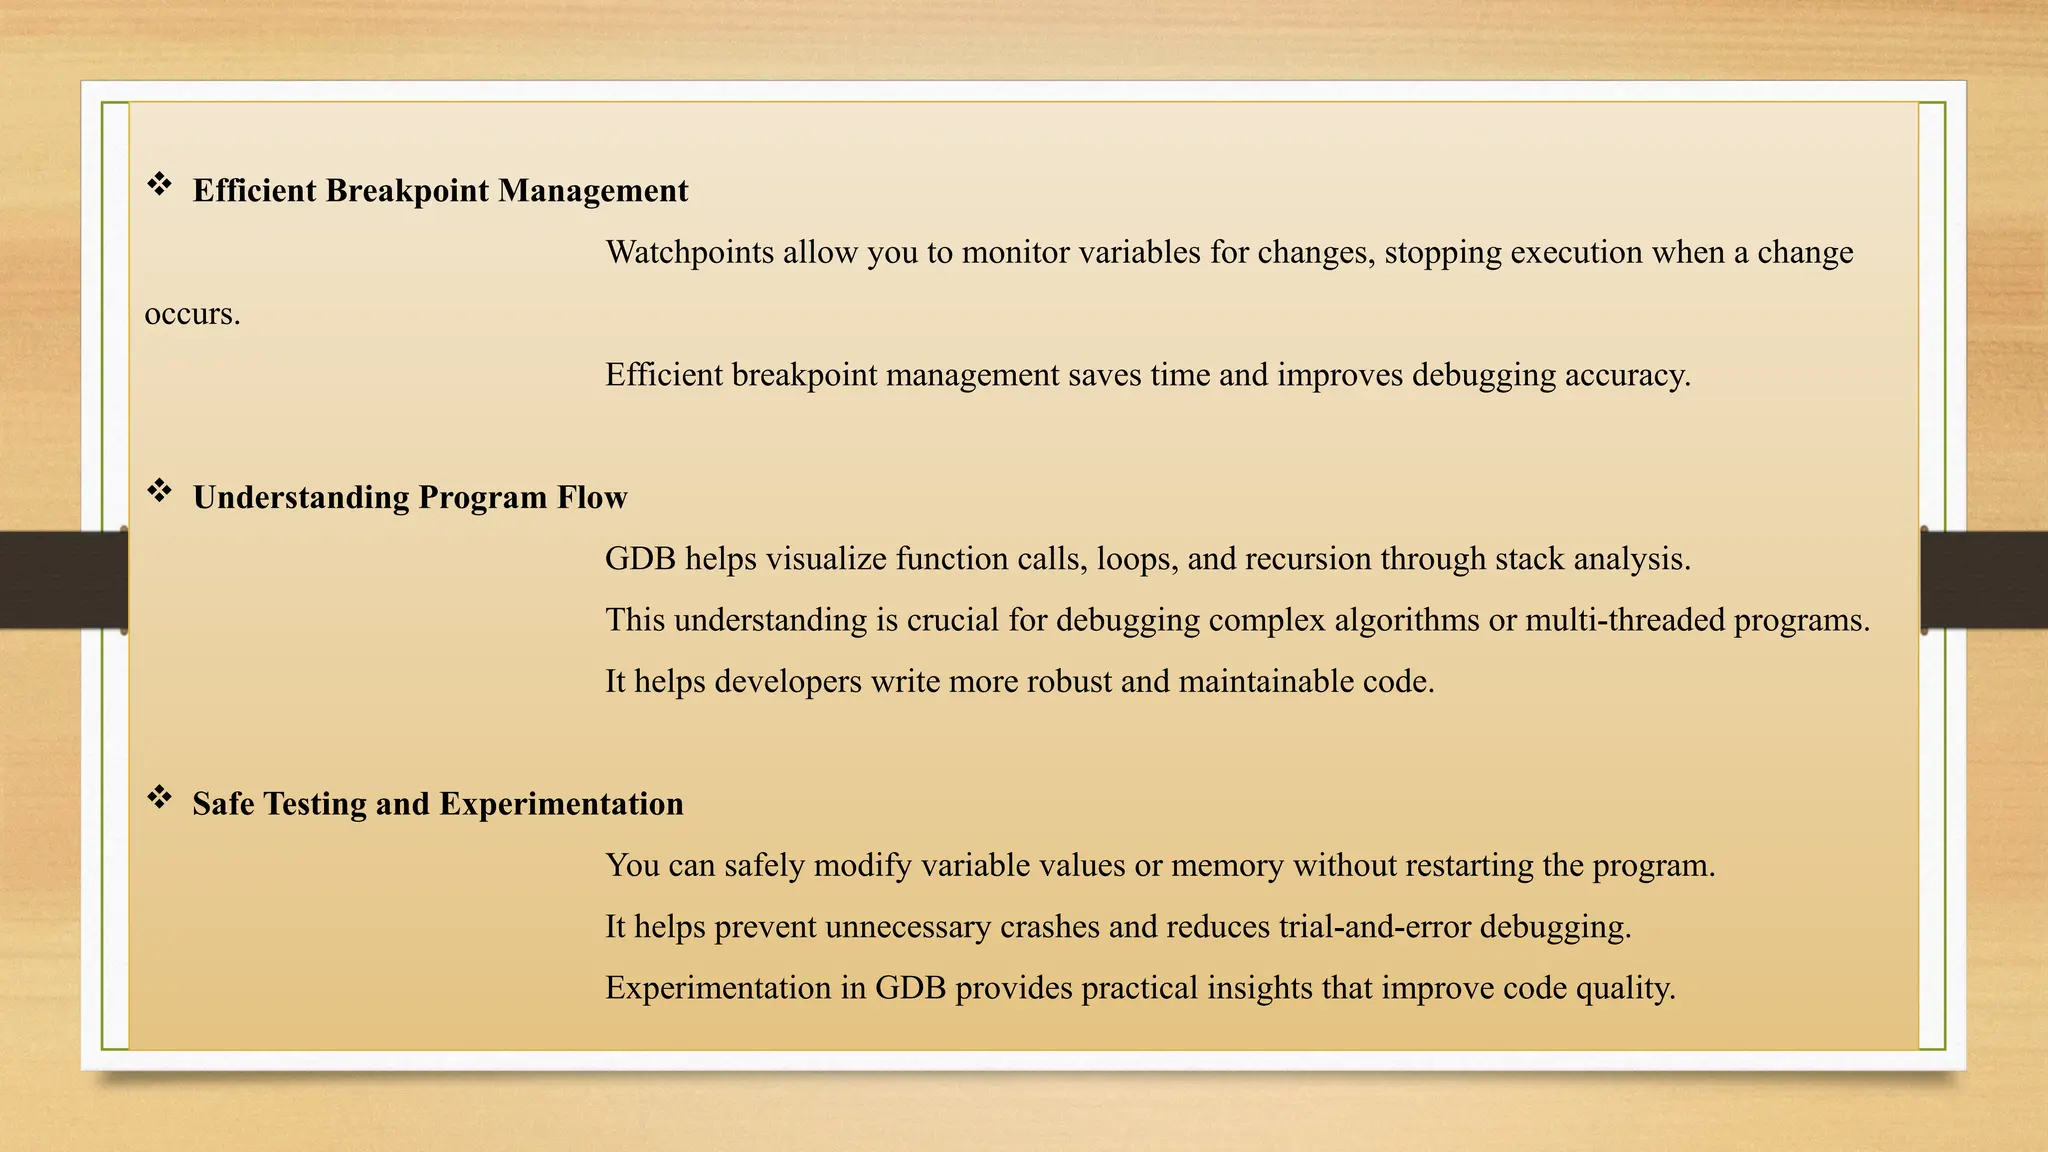
Efficient BreakpointManagement
Watchpoints allow you to monitor variables for changes, stopping execution when a change
occurs.
Efficient breakpoint management saves time and improves debugging accuracy.
Understanding Program Flow
GDB helps visualize function calls, loops, and recursion through stack analysis.
This understanding is crucial for debugging complex algorithms or multi-threaded programs.
It helps developers write more robust and maintainable code.
Safe Testing and Experimentation
You can safely modify variable values or memory without restarting the program.
It helps prevent unnecessary crashes and reduces trial-and-error debugging.
Experimentation in GDB provides practical insights that improve code quality.
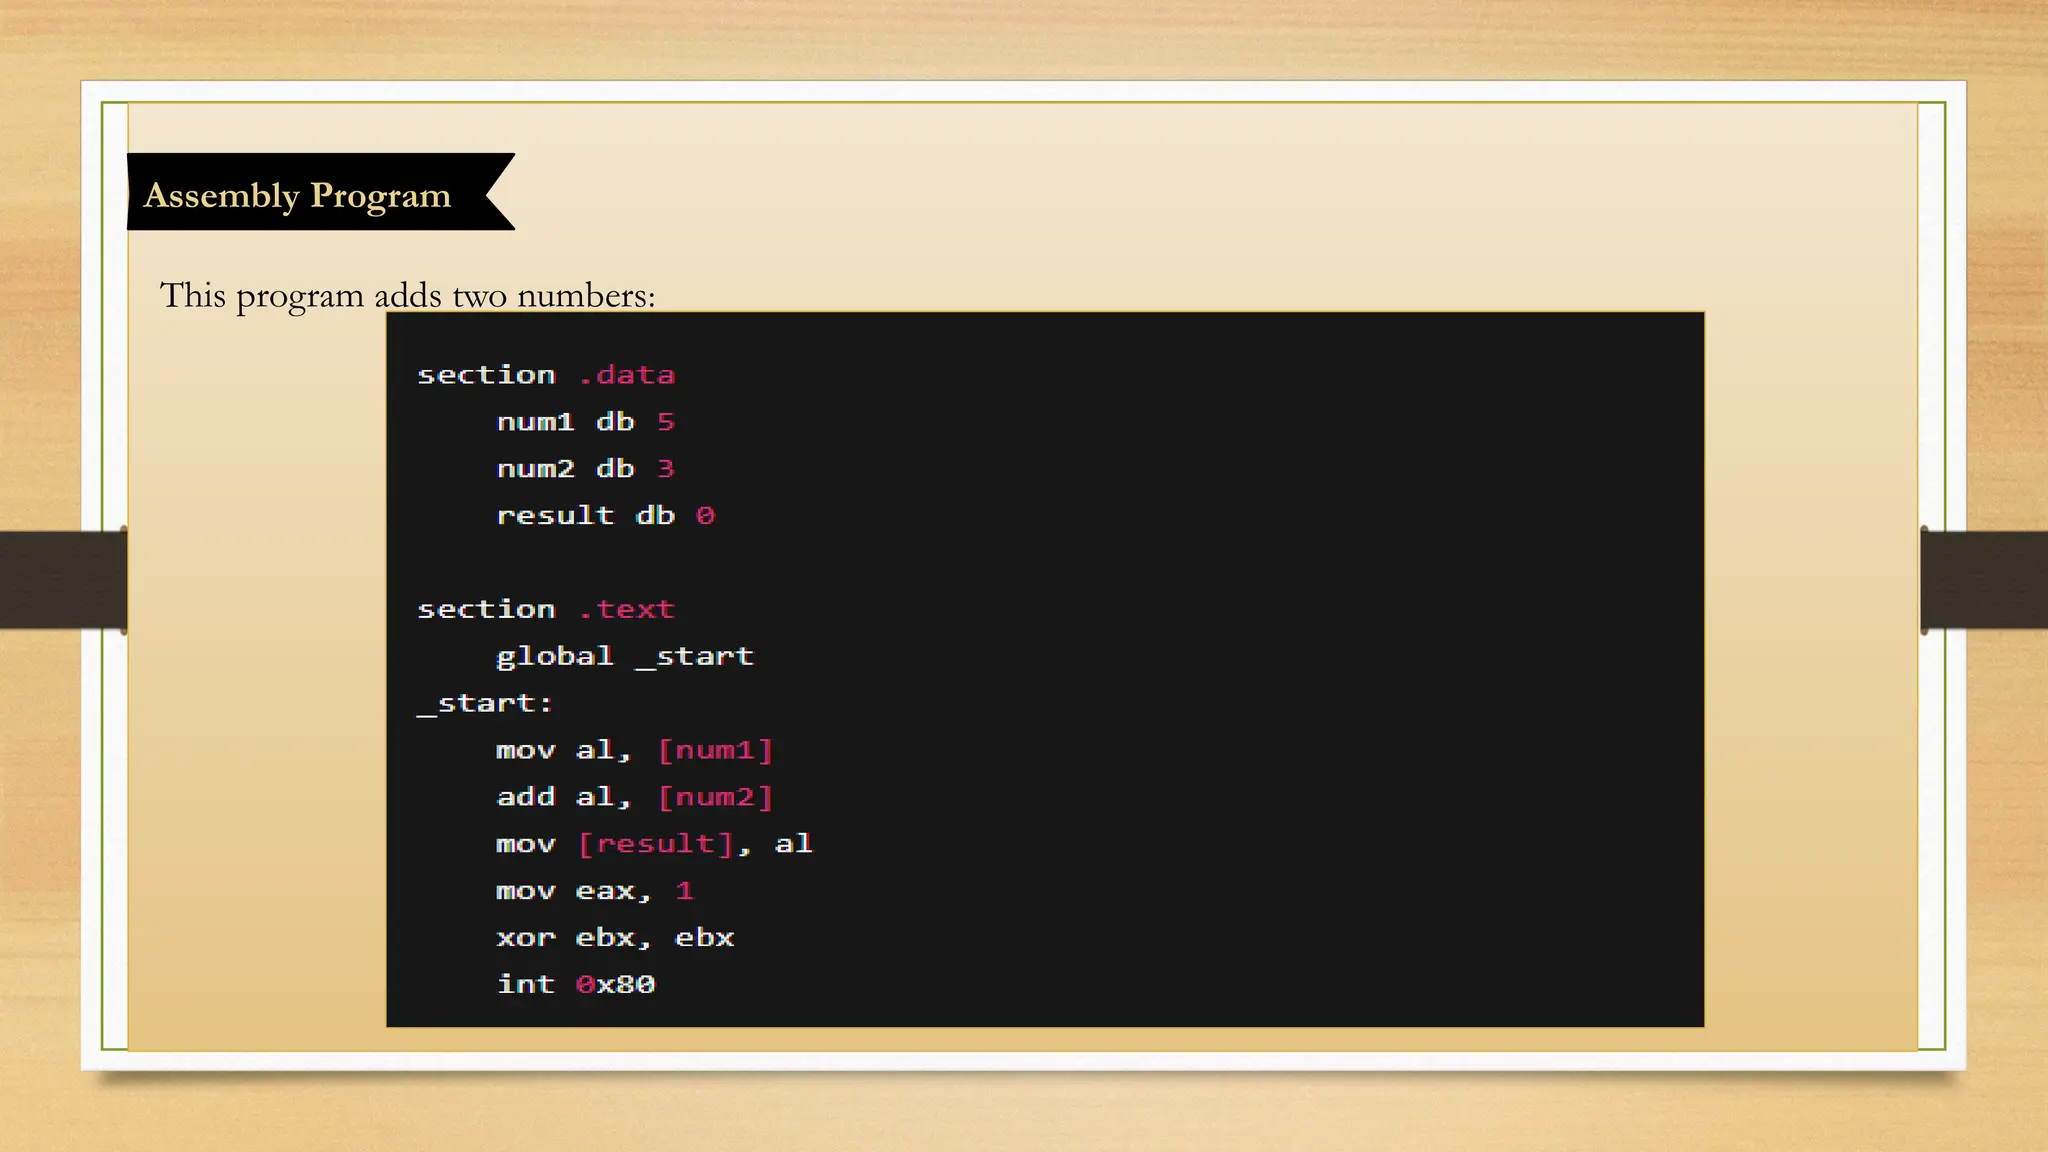
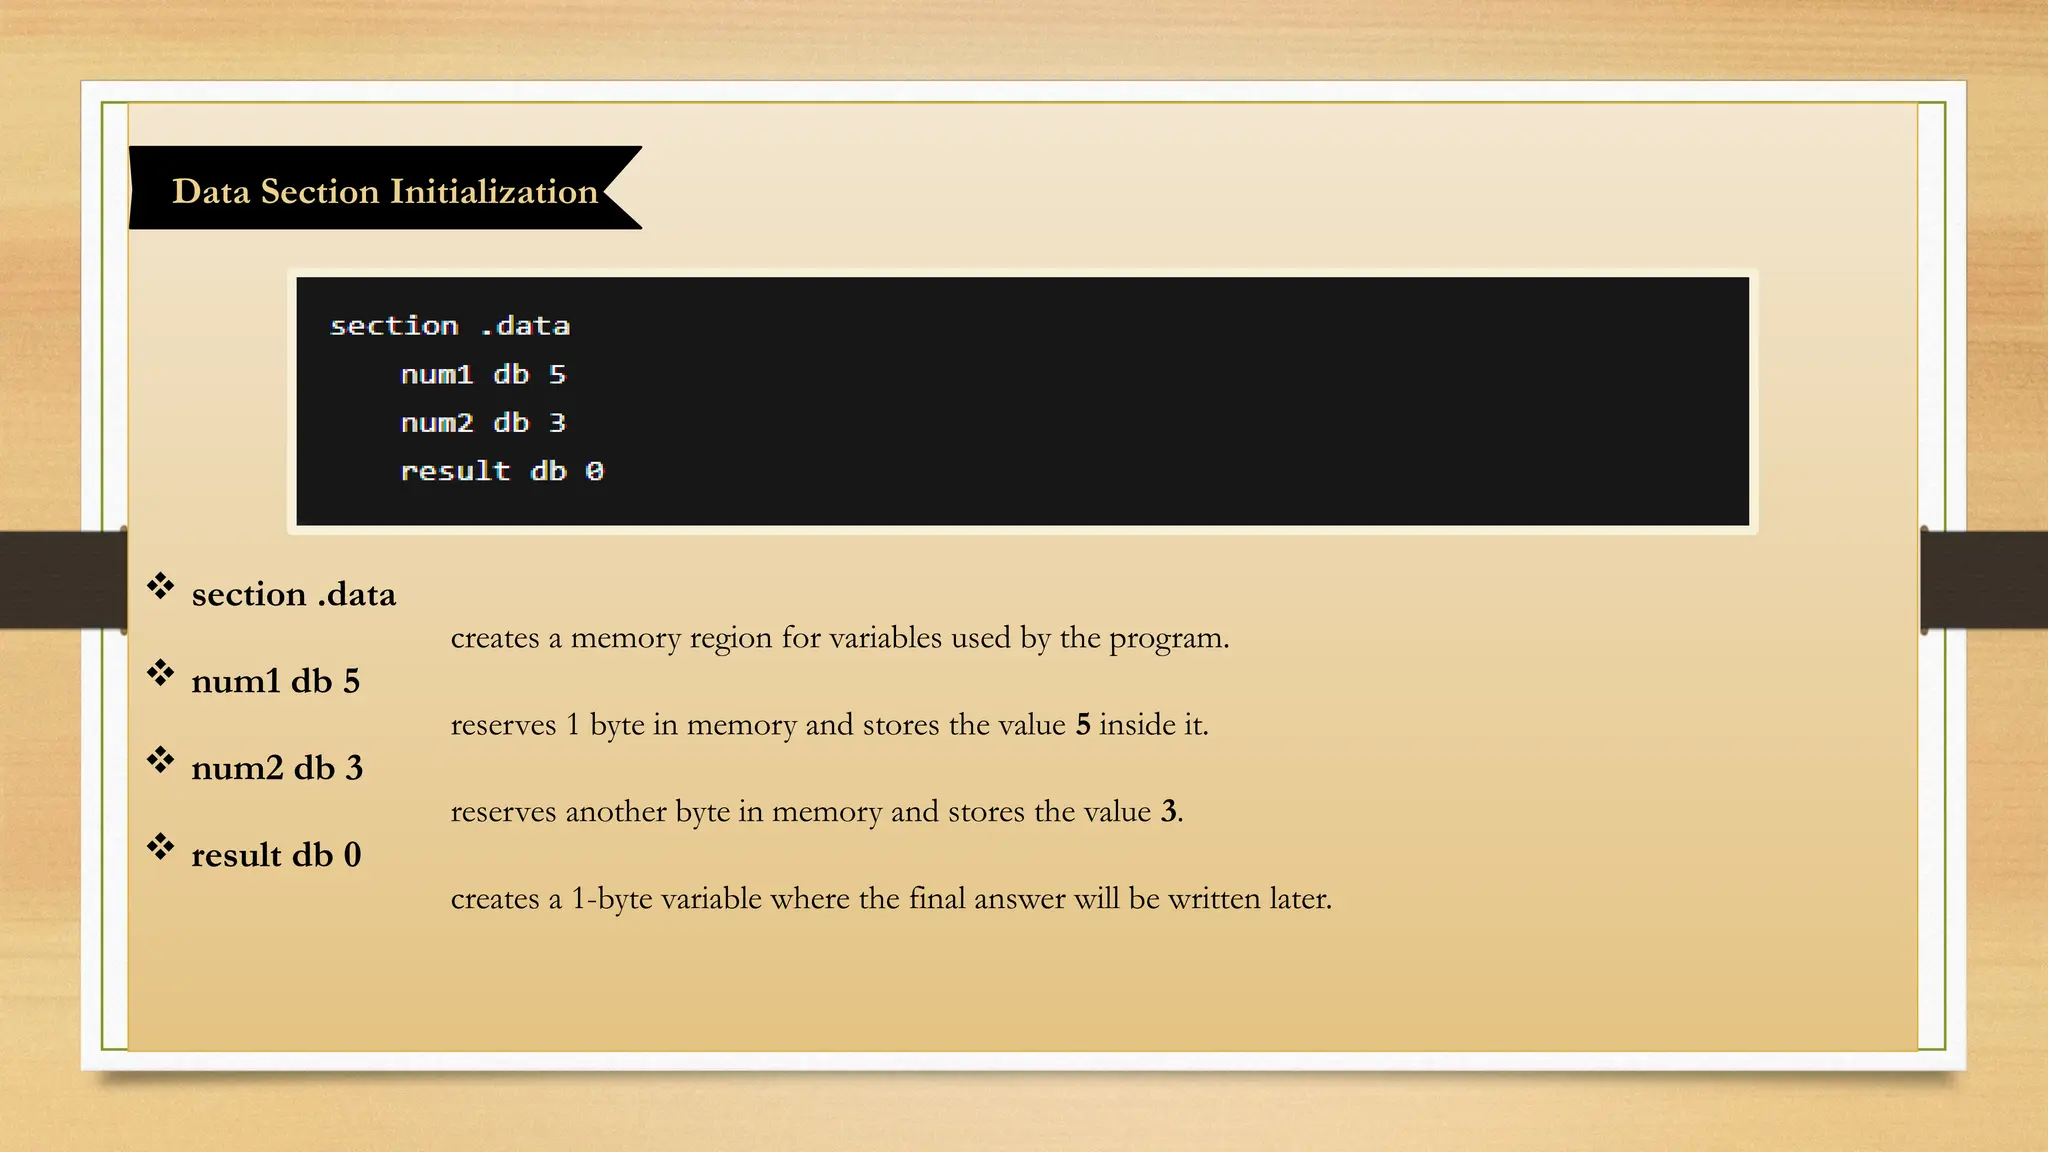
section .data
createsa memory region for variables used by the program.
num1 db 5
reserves 1 byte in memory and stores the value 5 inside it.
num2 db 3
reserves another byte in memory and stores the value 3.
result db 0
creates a 1-byte variable where the final answer will be written later.
Data Section Initialization
16.
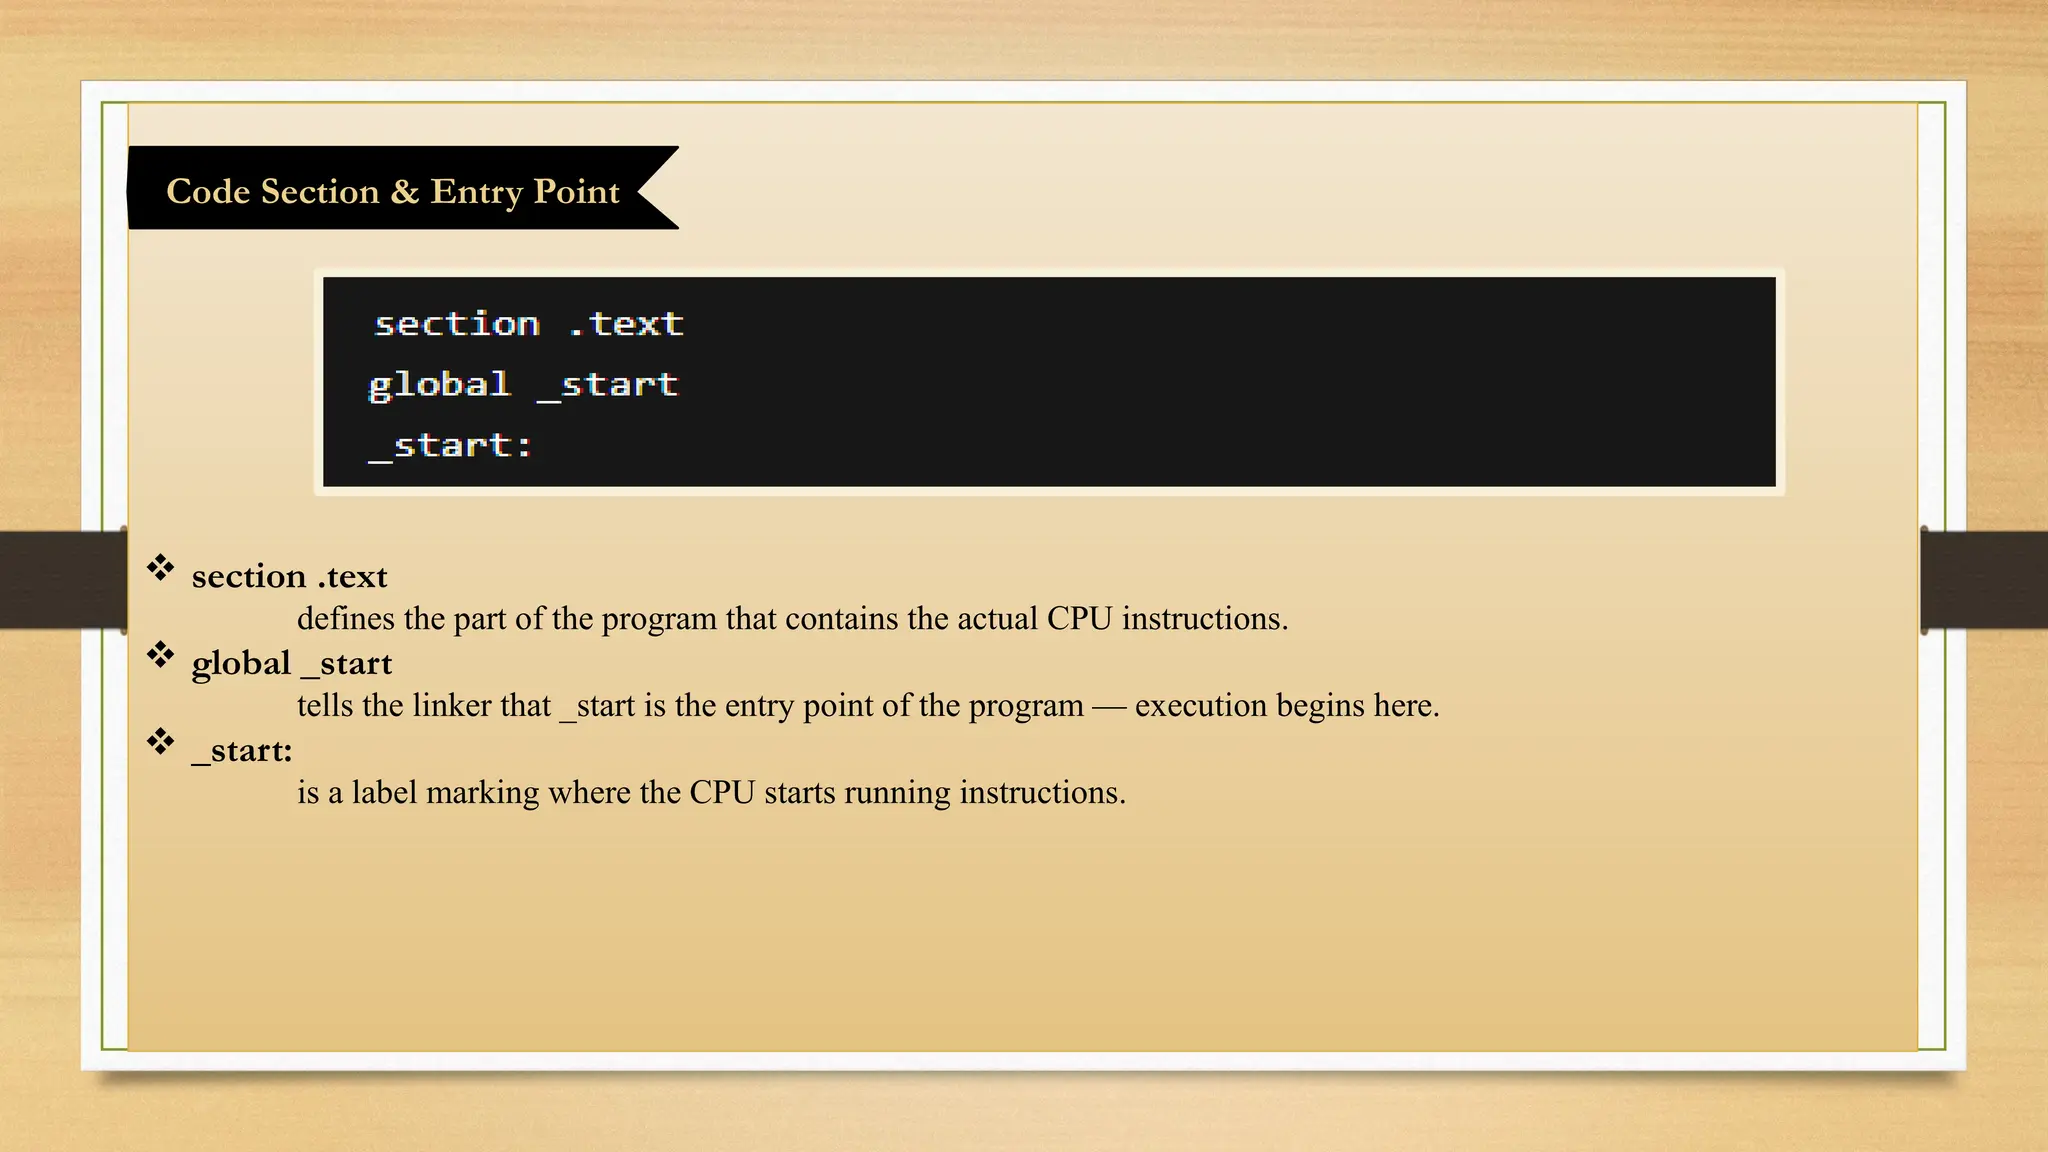
section .text
definesthe part of the program that contains the actual CPU instructions.
global _start
tells the linker that _start is the entry point of the program — execution begins here.
_start:
is a label marking where the CPU starts running instructions.
Code Section & Entry Point
17.
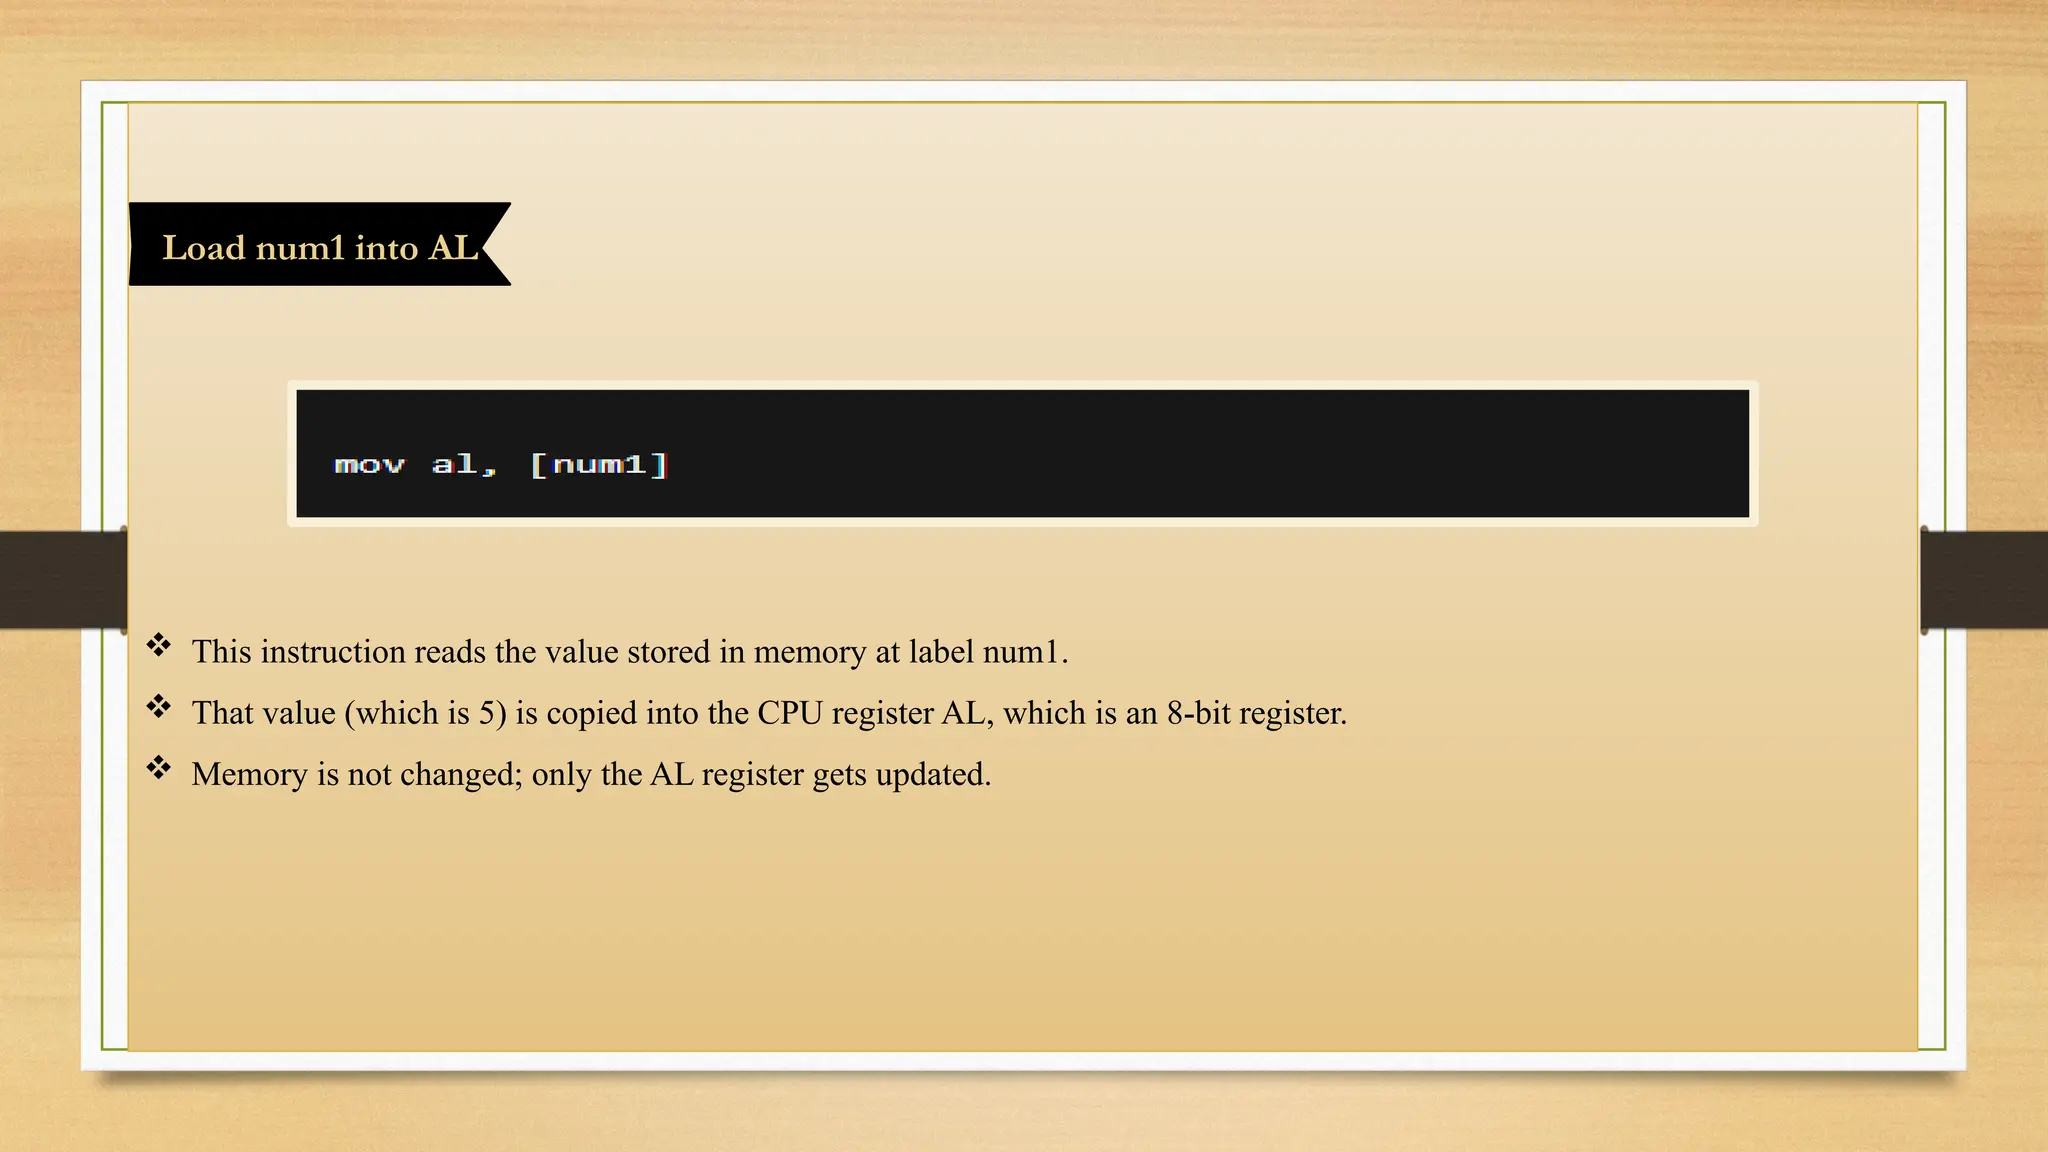
This instructionreads the value stored in memory at label num1.
That value (which is 5) is copied into the CPU register AL, which is an 8-bit register.
Memory is not changed; only the AL register gets updated.
Load num1 into AL
18.
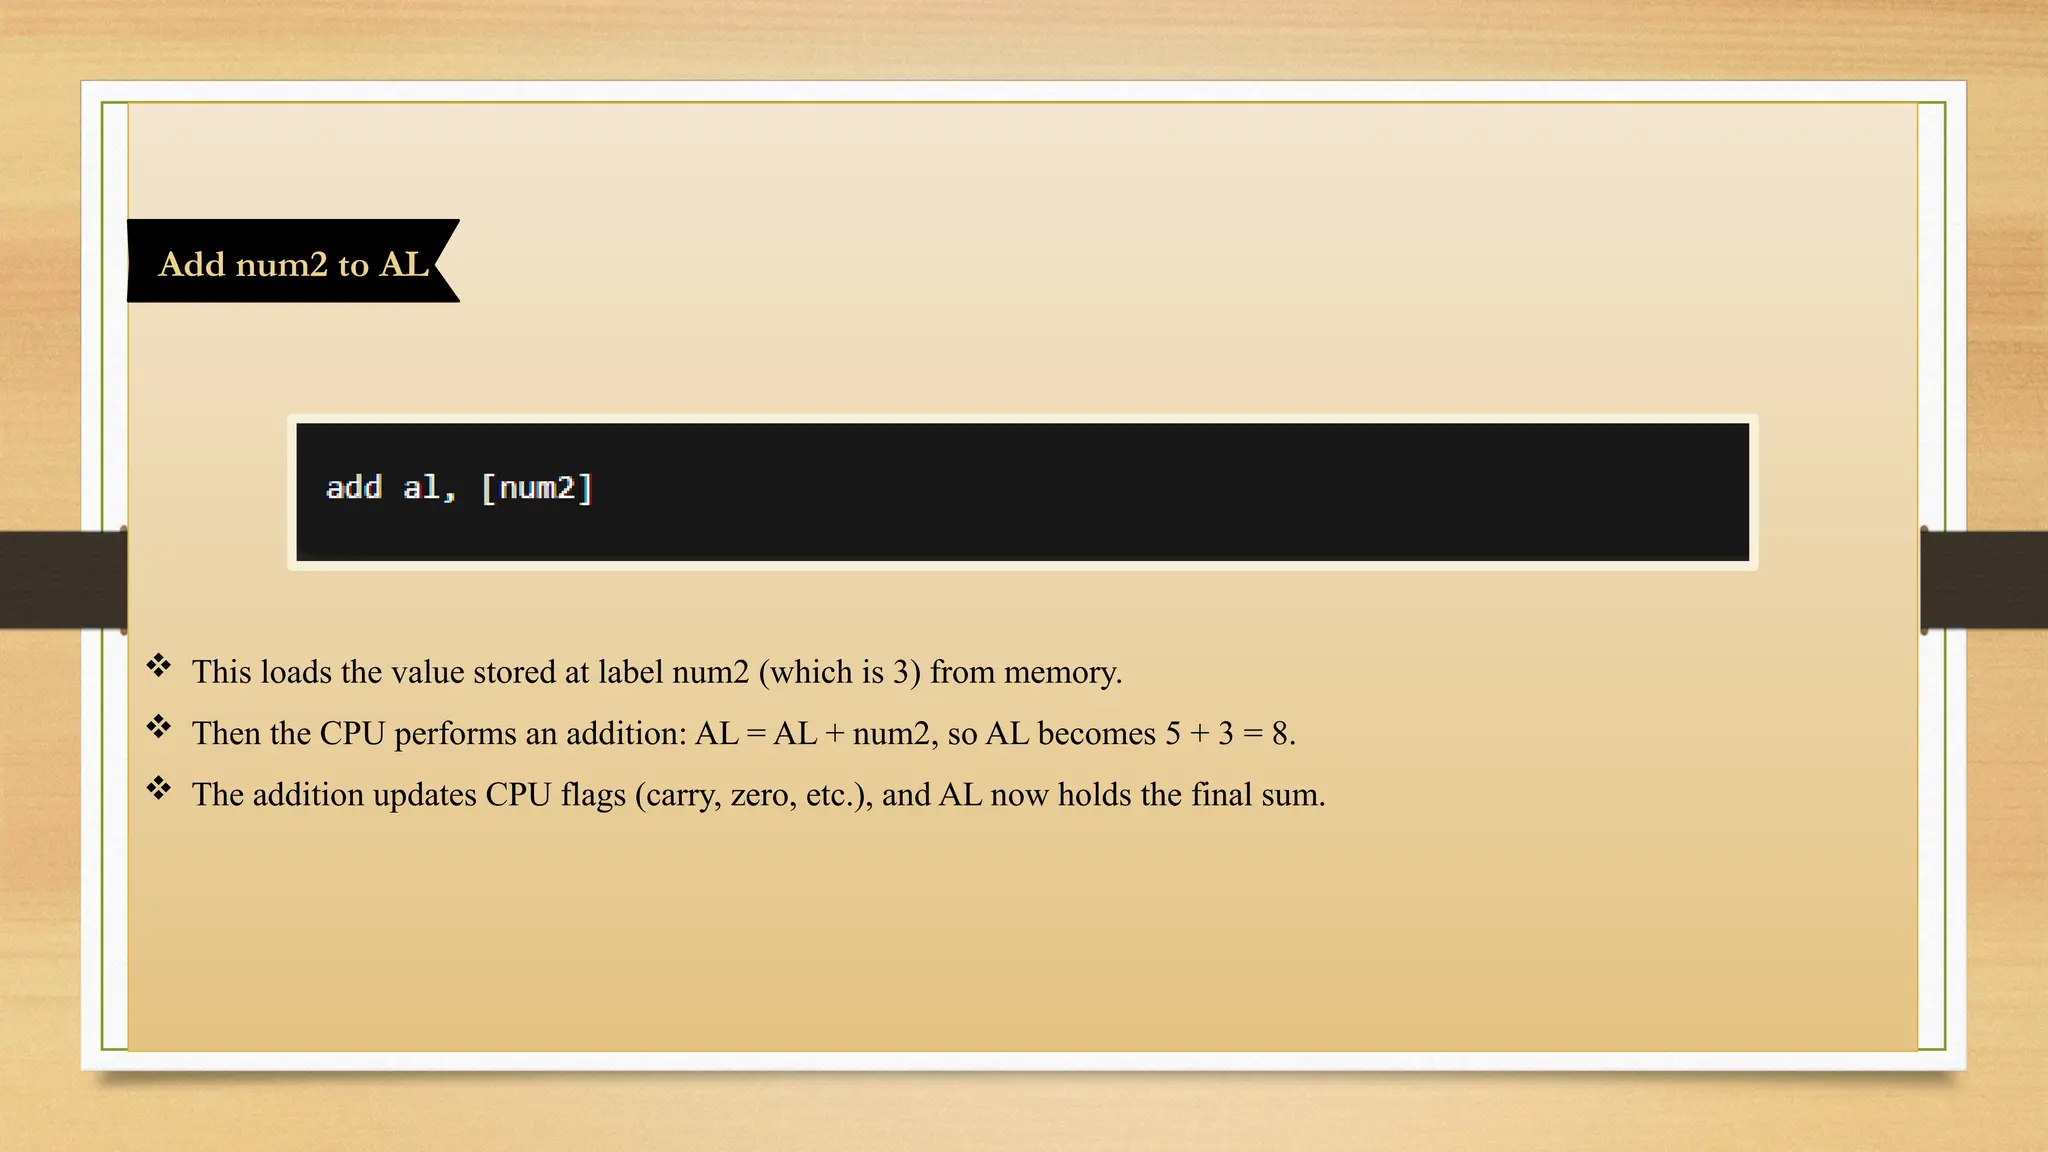
This loadsthe value stored at label num2 (which is 3) from memory.
Then the CPU performs an addition: AL = AL + num2, so AL becomes 5 + 3 = 8.
The addition updates CPU flags (carry, zero, etc.), and AL now holds the final sum.
Add num2 to AL
19.
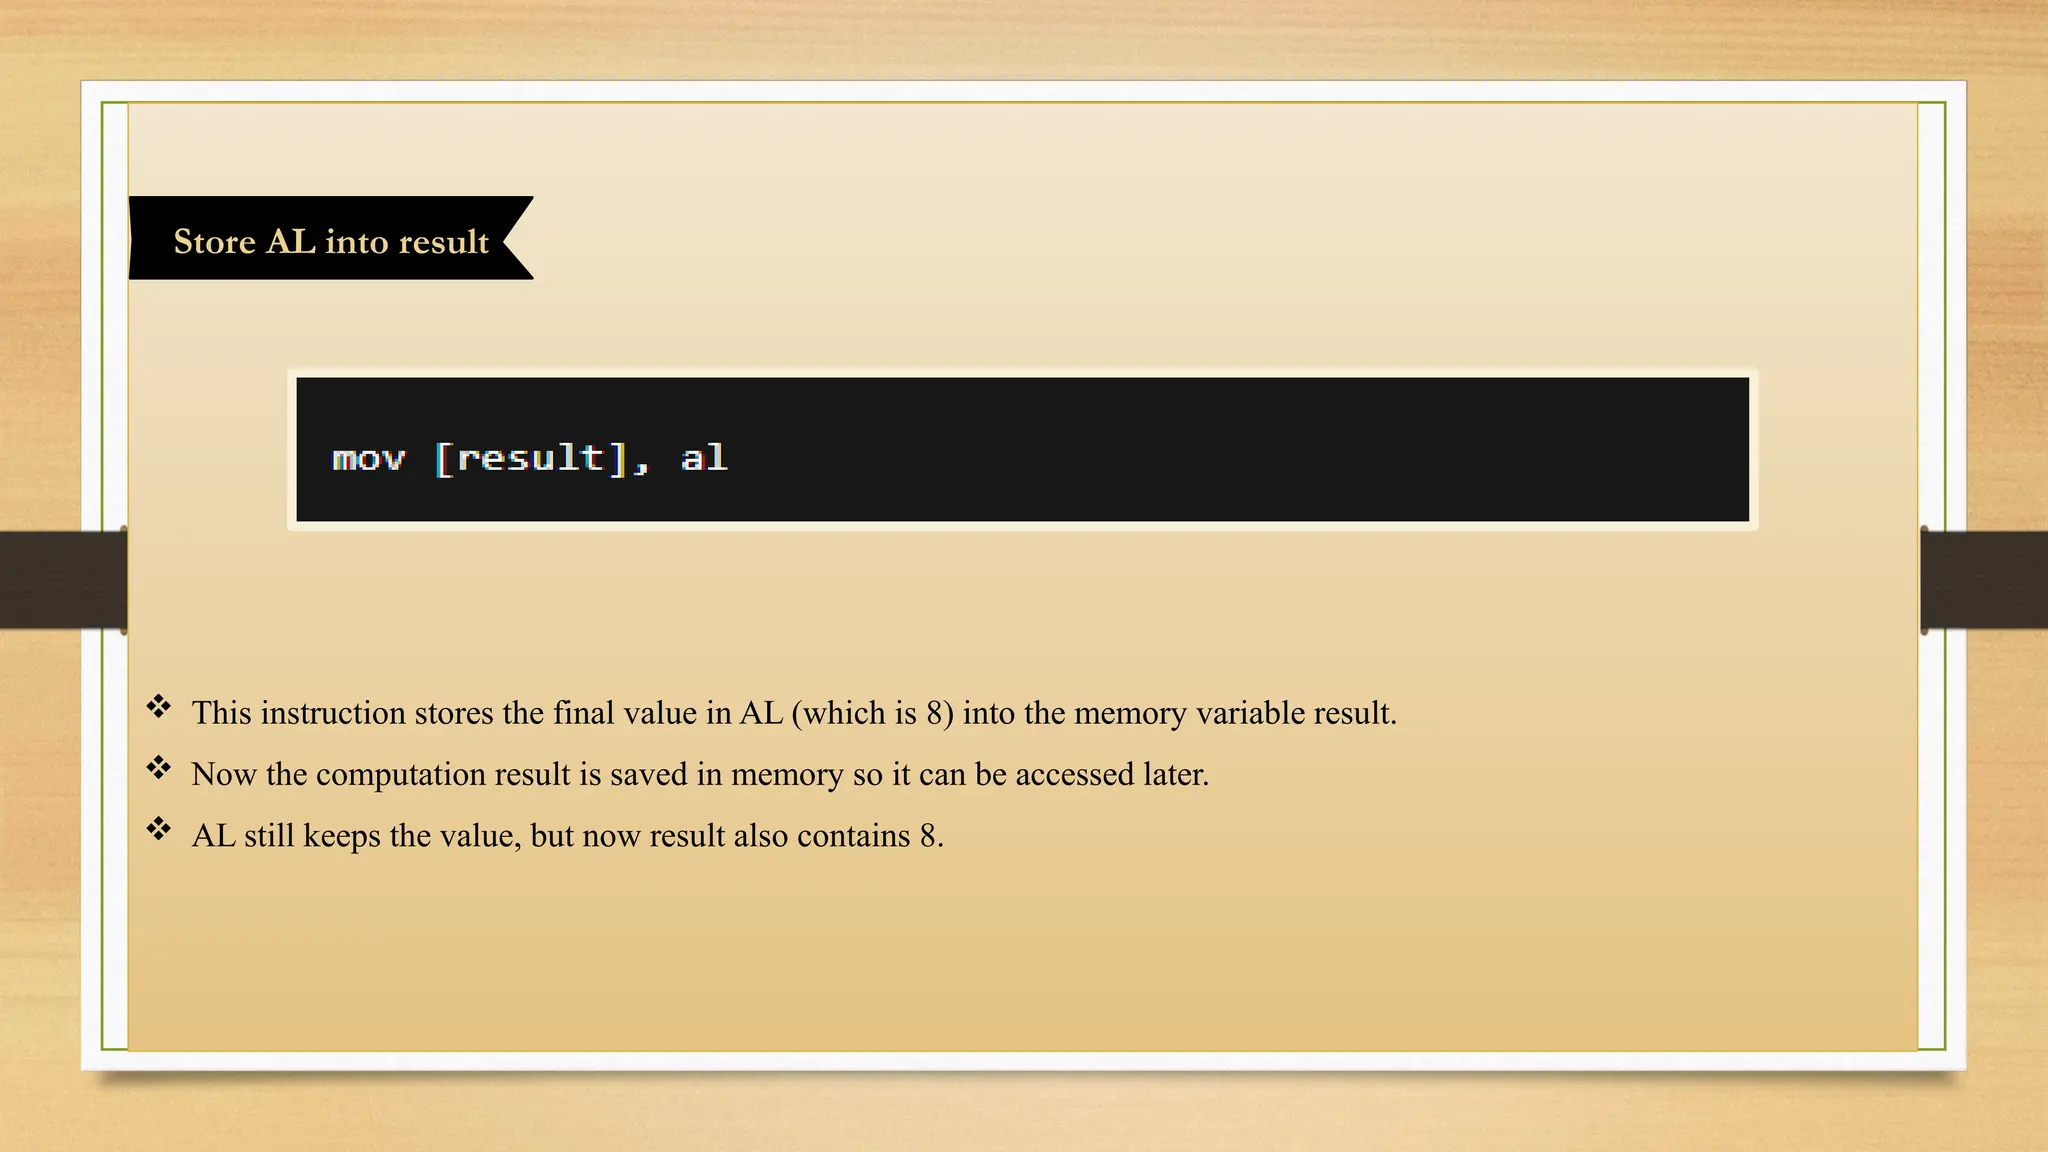
This instructionstores the final value in AL (which is 8) into the memory variable result.
Now the computation result is saved in memory so it can be accessed later.
AL still keeps the value, but now result also contains 8.
Store AL into result
20.
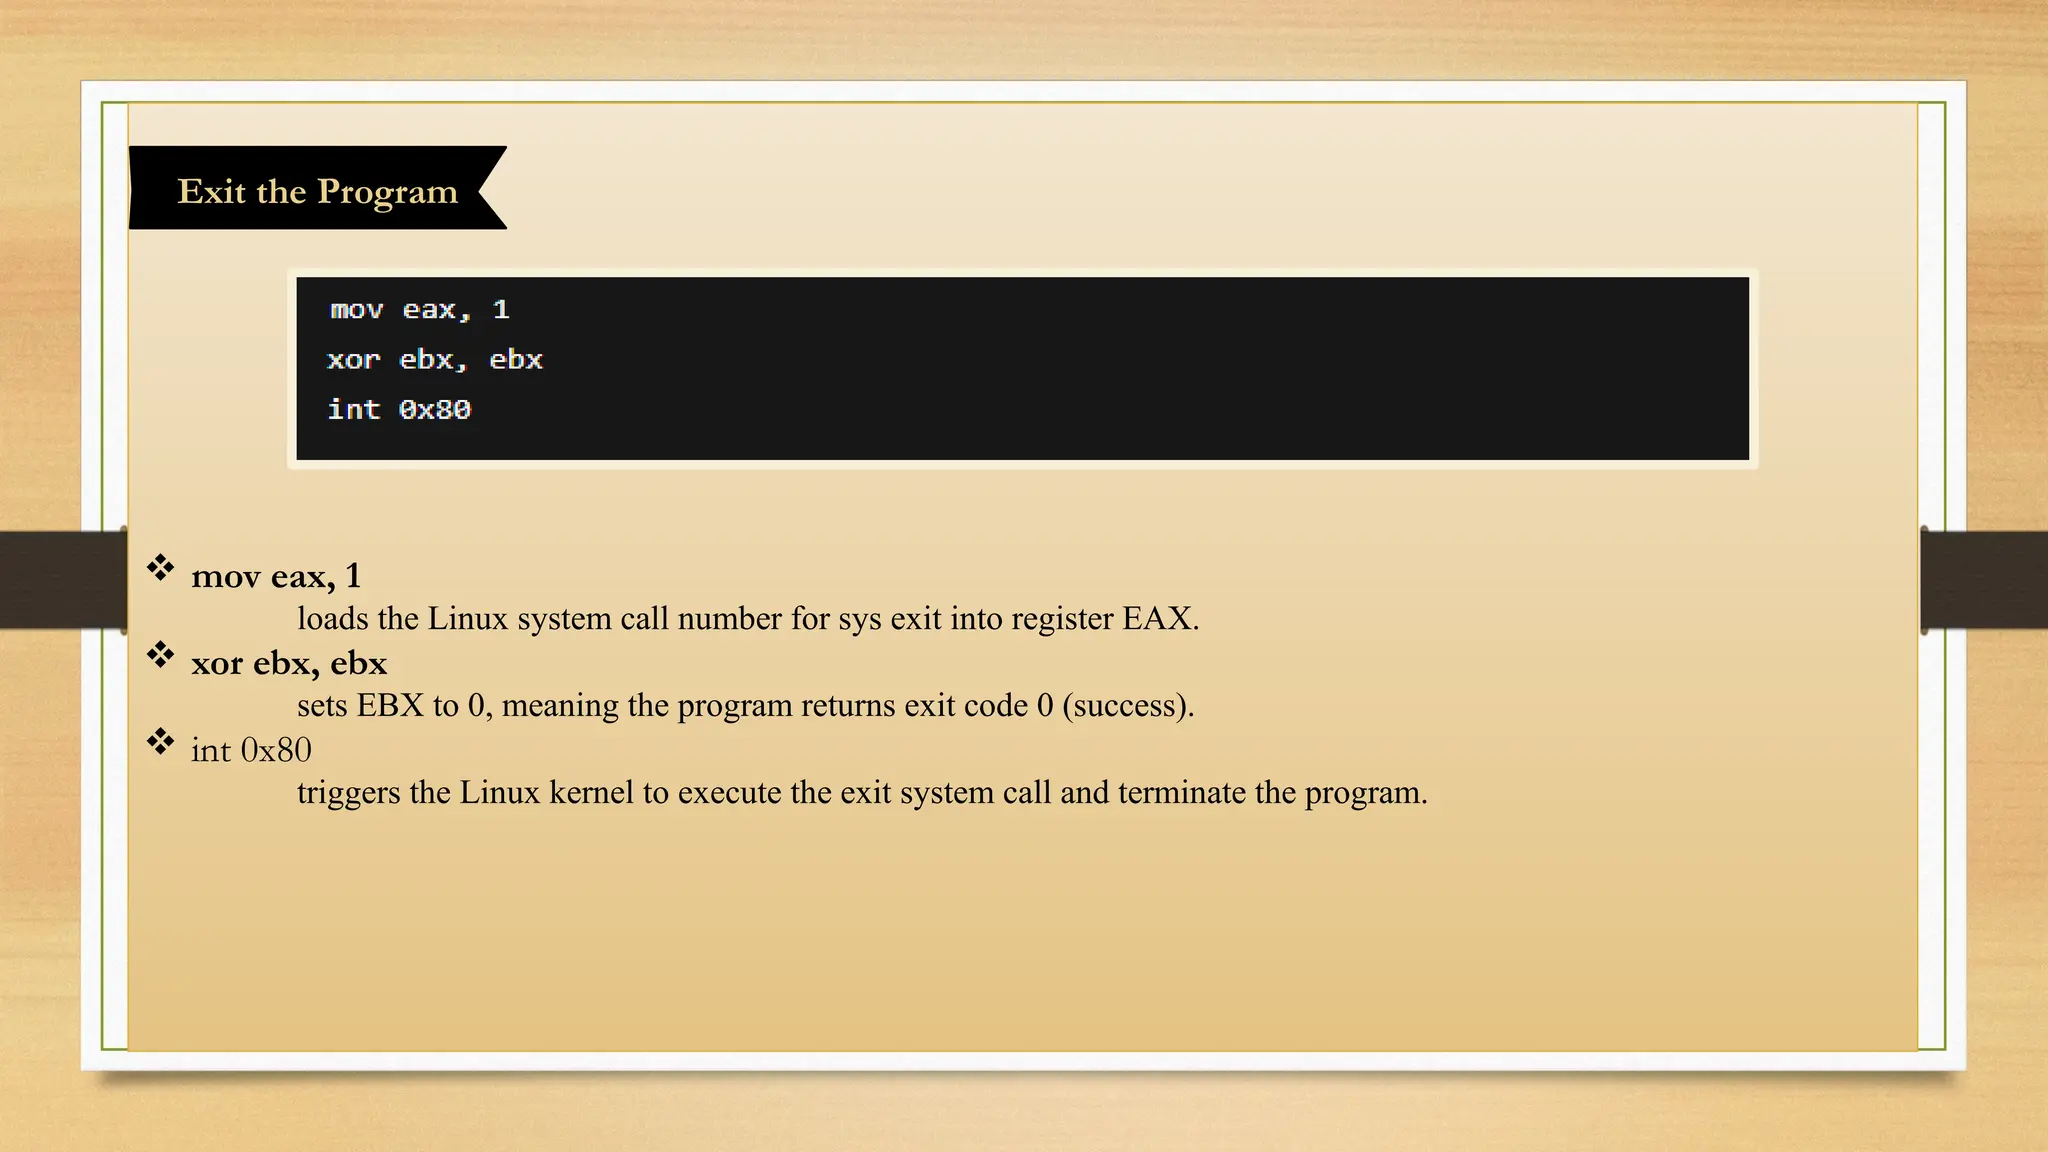
mov eax,1
loads the Linux system call number for sys exit into register EAX.
xor ebx, ebx
sets EBX to 0, meaning the program returns exit code 0 (success).
int 0x80
triggers the Linux kernel to execute the exit system call and terminate the program.
Exit the Program
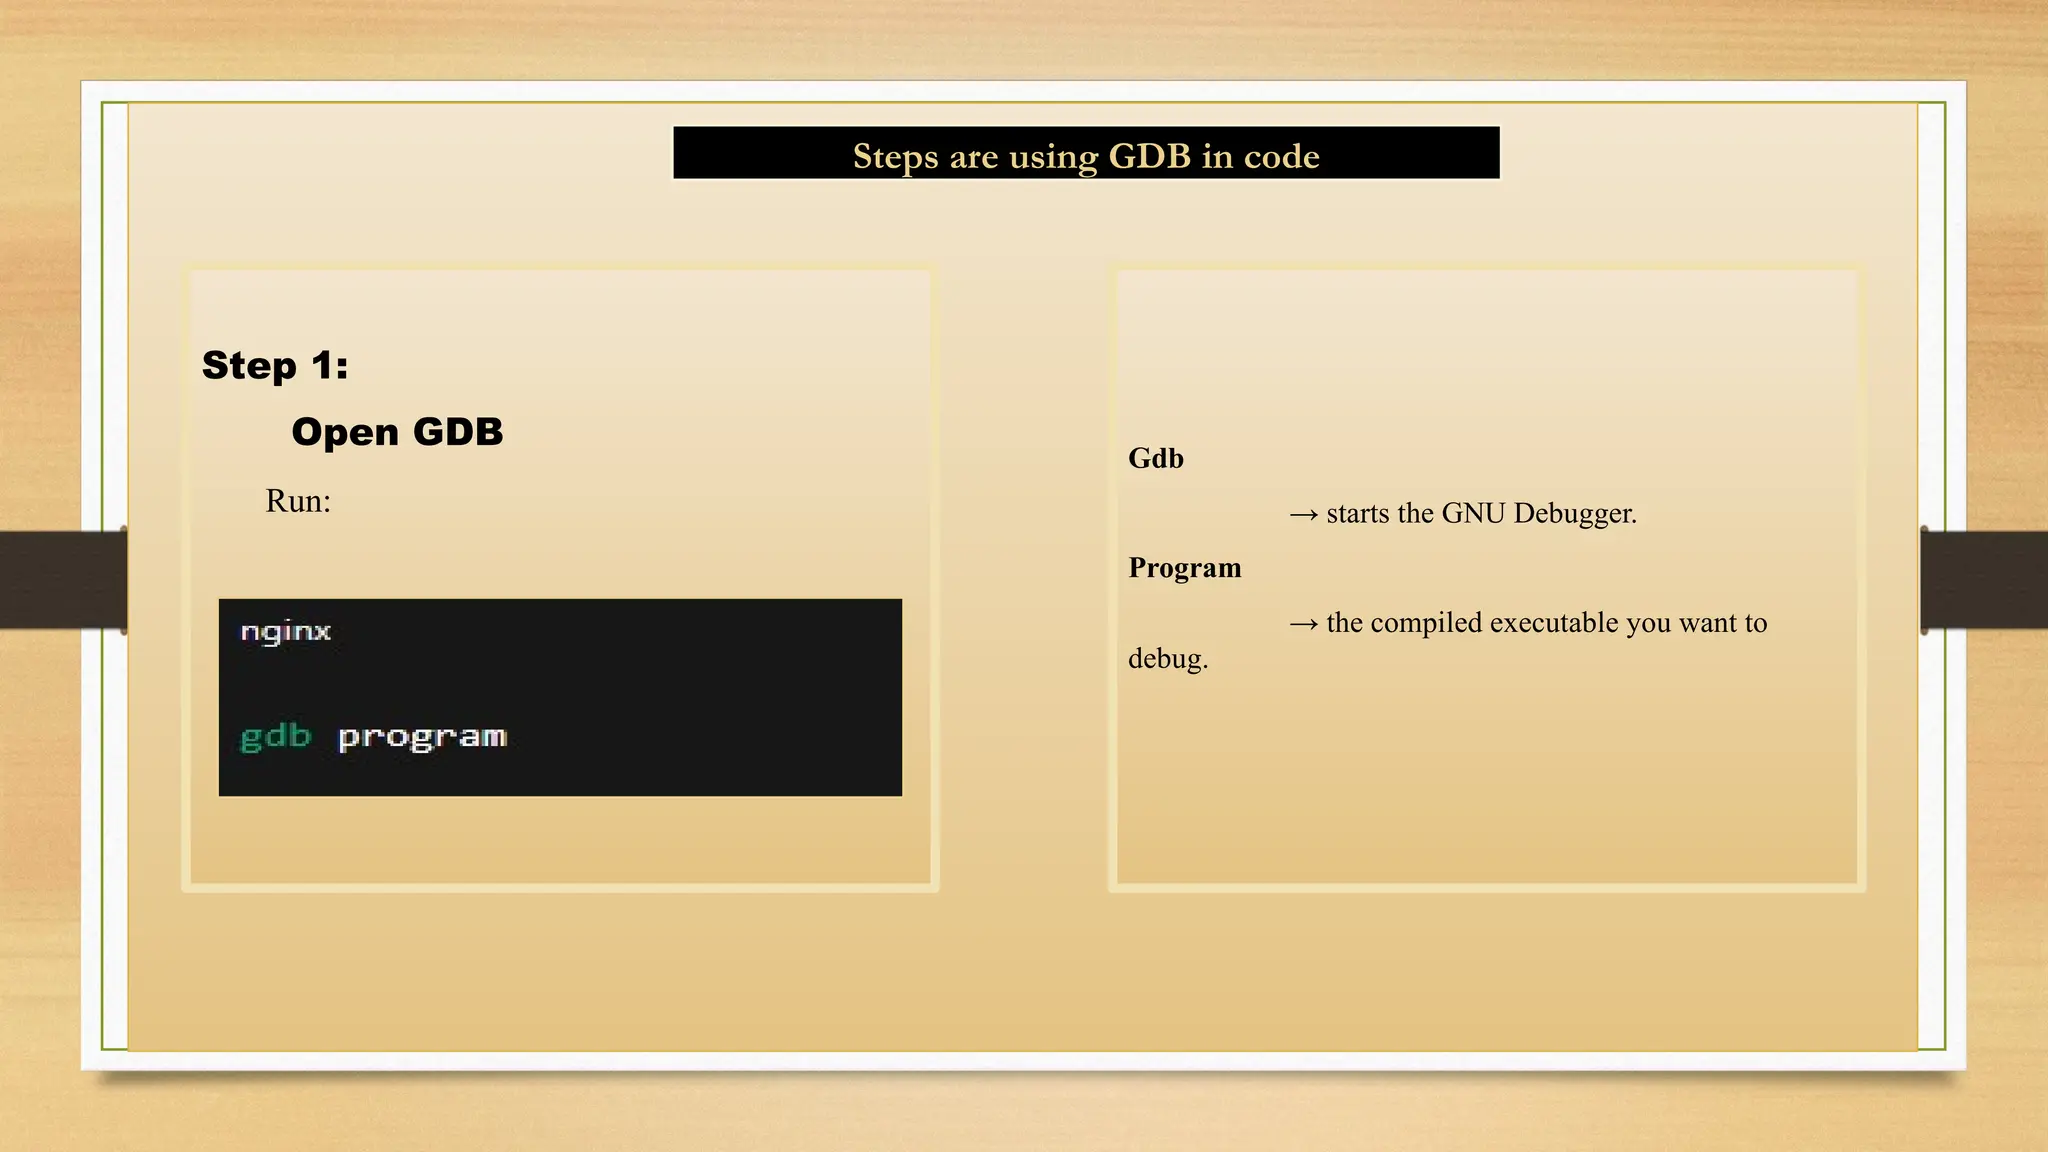
Step 1:
Open GDB
Run:
Gdb
→starts the GNU Debugger.
Program
→ the compiled executable you want to
debug.
Steps are using GDB in code
24.
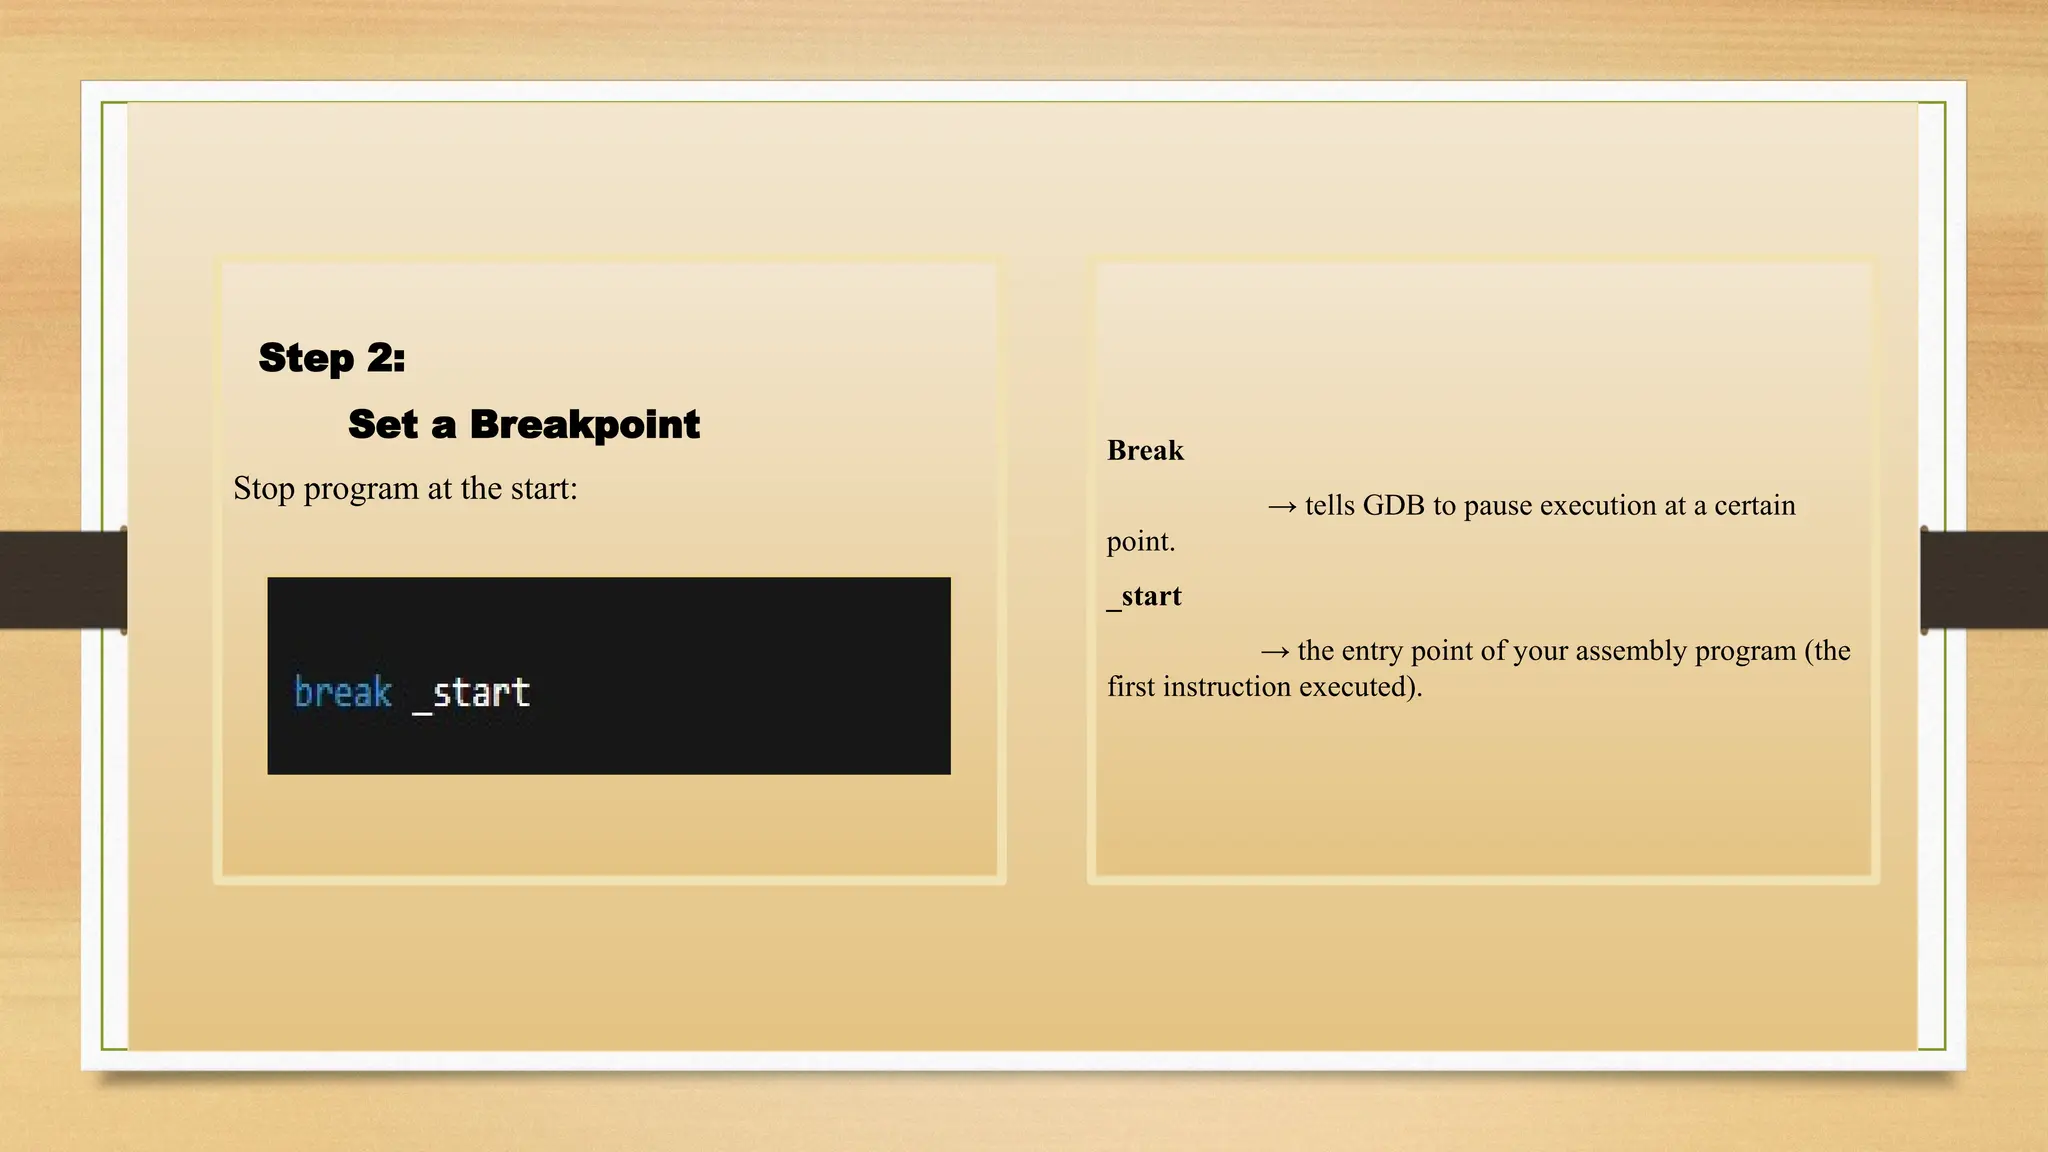
Step 2:
Set aBreakpoint
Stop program at the start:
Break
→ tells GDB to pause execution at a certain
point.
_start
→ the entry point of your assembly program (the
first instruction executed).
25.
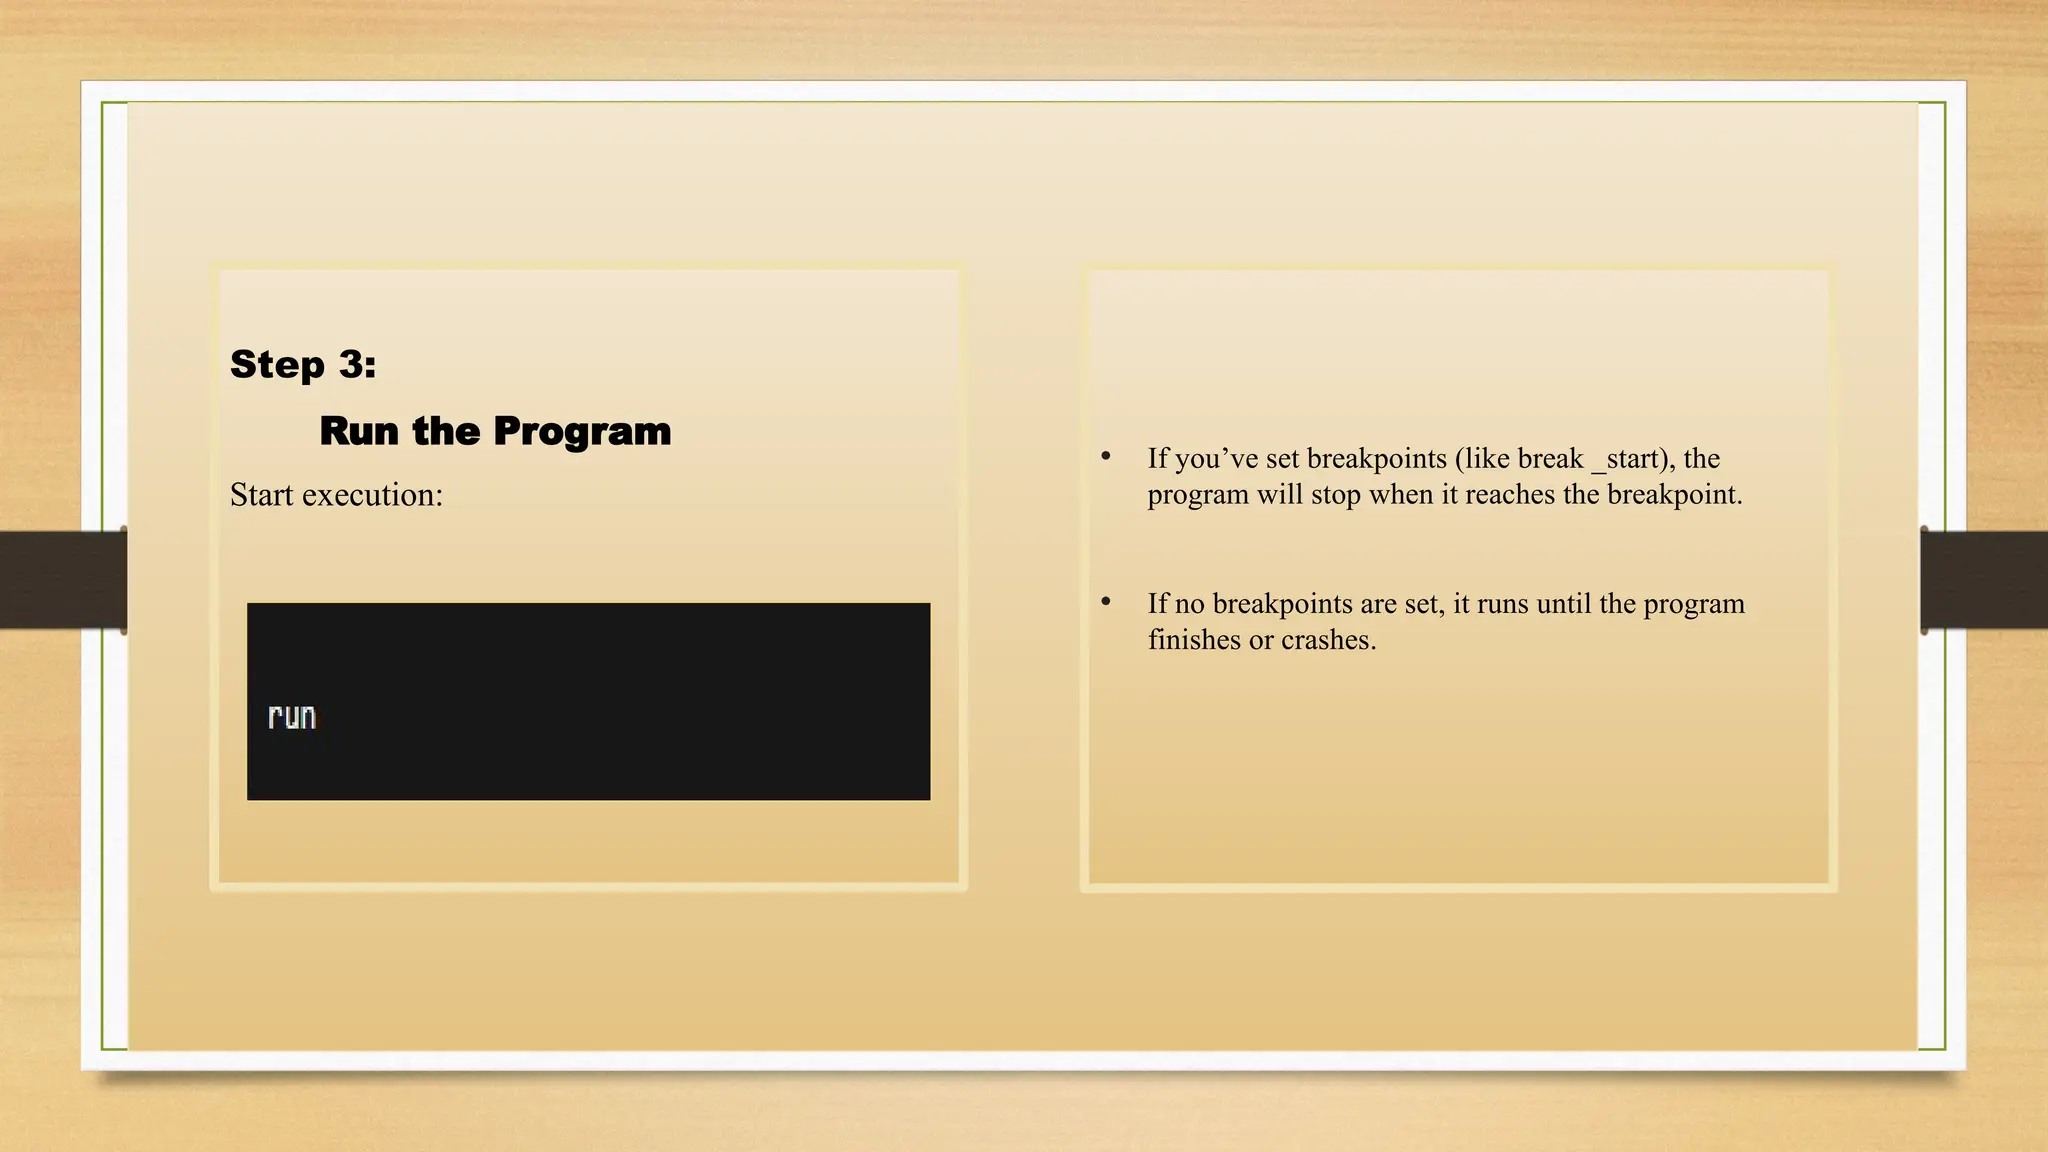
Step 3:
Run theProgram
Start execution:
• If you’ve set breakpoints (like break _start), the
program will stop when it reaches the breakpoint.
• If no breakpoints are set, it runs until the program
finishes or crashes.
26.
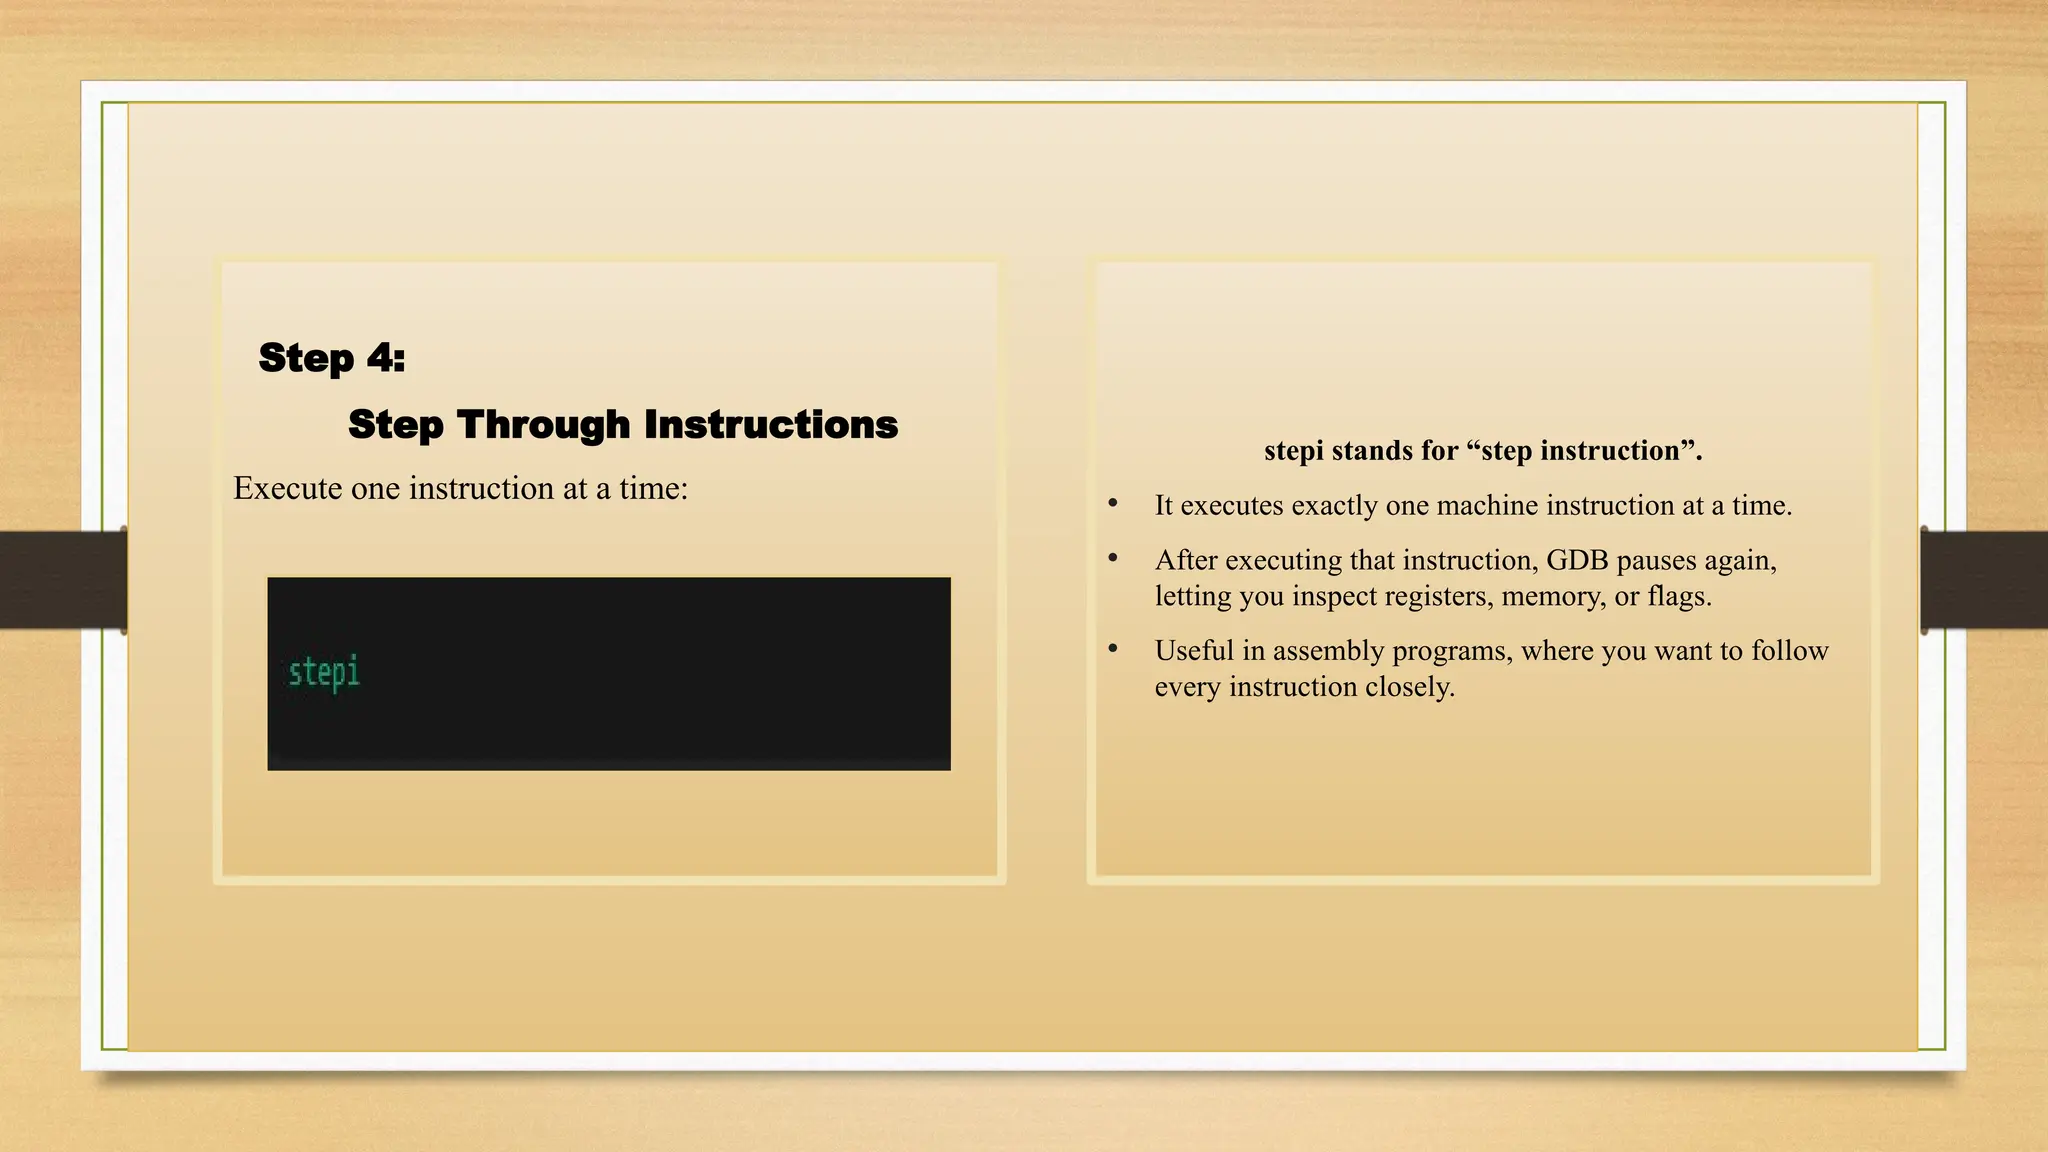
Step 4:
Step ThroughInstructions
Execute one instruction at a time:
stepi stands for “step instruction”.
• It executes exactly one machine instruction at a time.
• After executing that instruction, GDB pauses again,
letting you inspect registers, memory, or flags.
• Useful in assembly programs, where you want to follow
every instruction closely.
27.
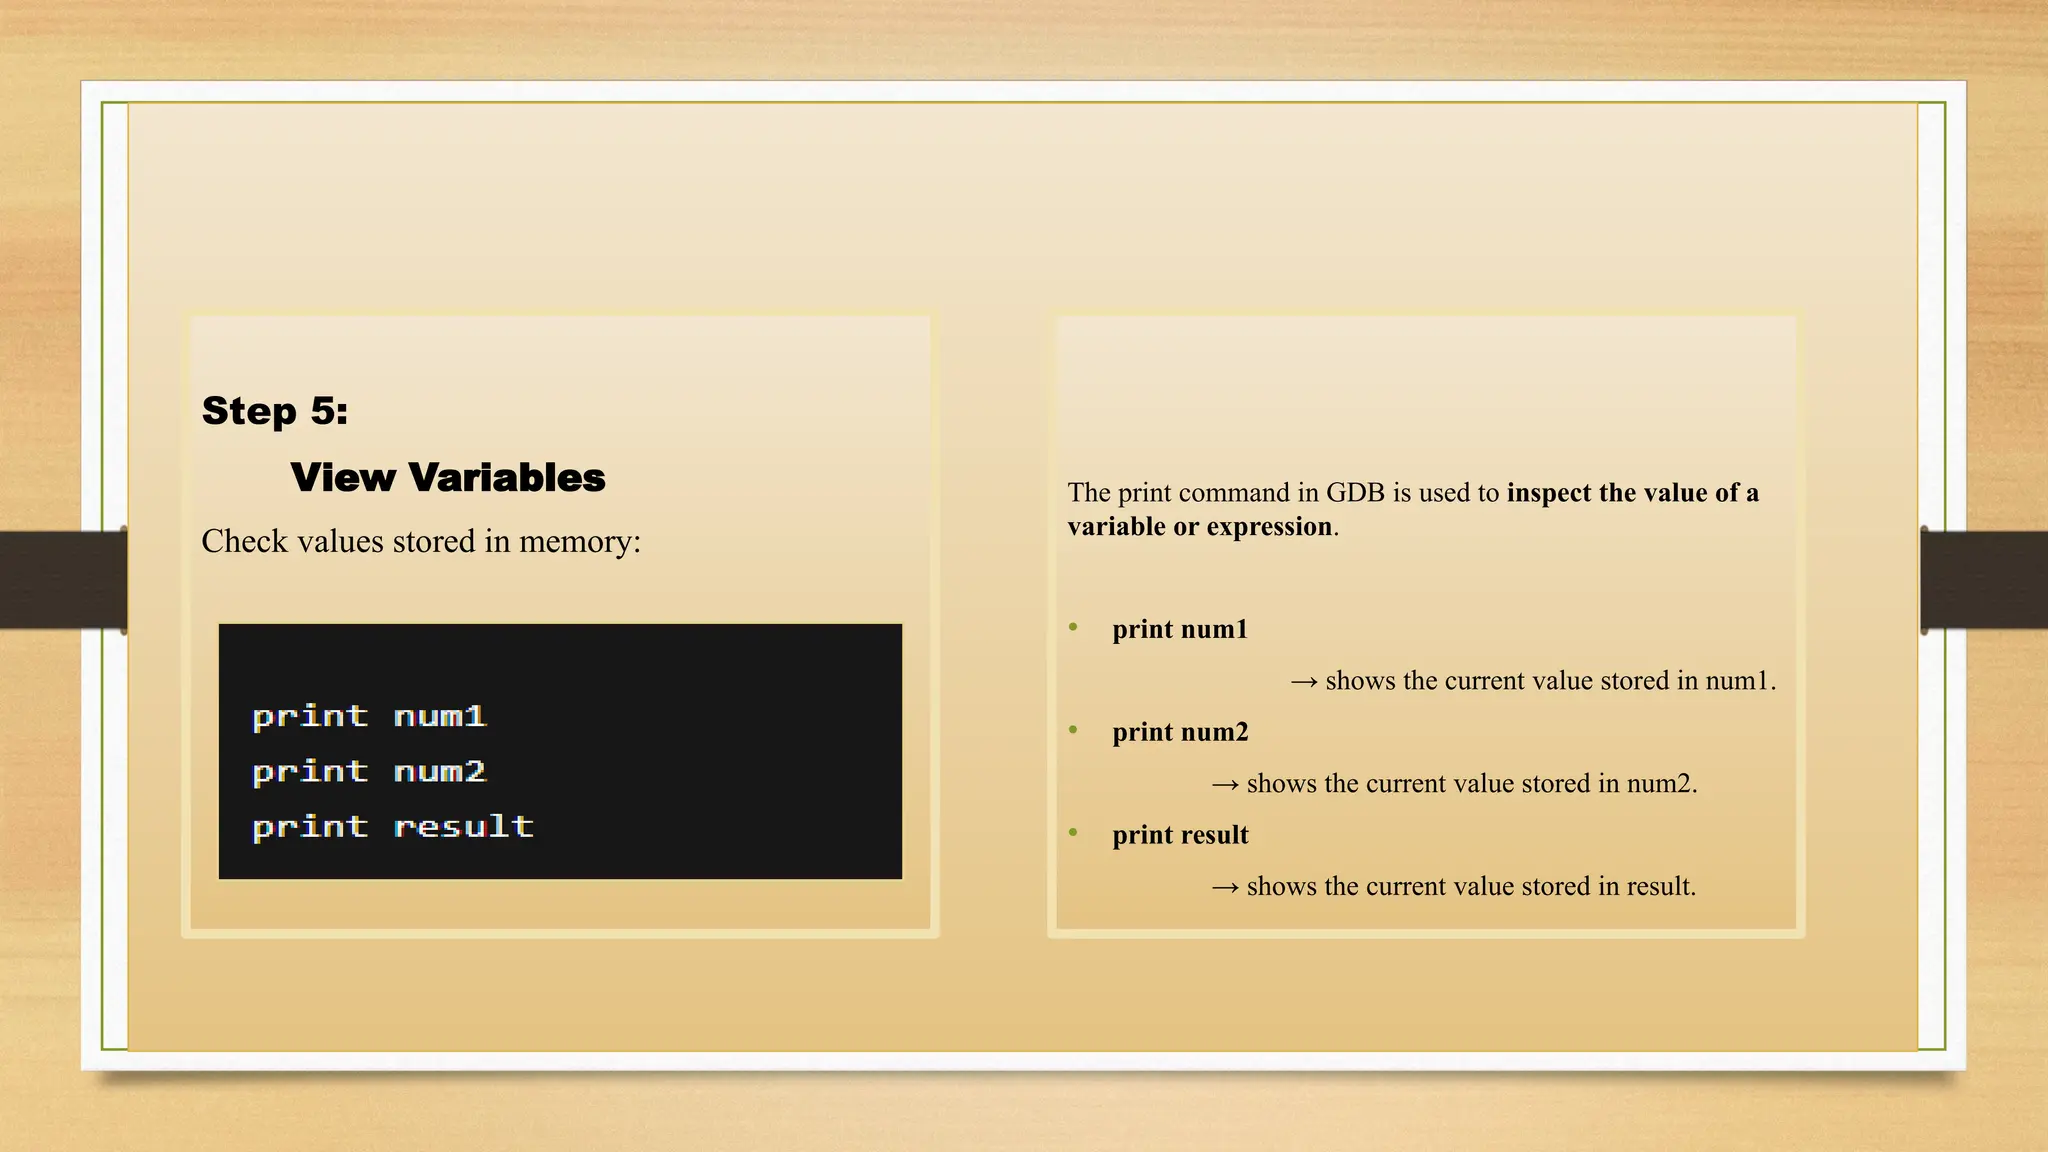
Step 5:
View Variables
Checkvalues stored in memory:
The print command in GDB is used to inspect the value of a
variable or expression.
• print num1
→ shows the current value stored in num1.
• print num2
→ shows the current value stored in num2.
• print result
→ shows the current value stored in result.
28.
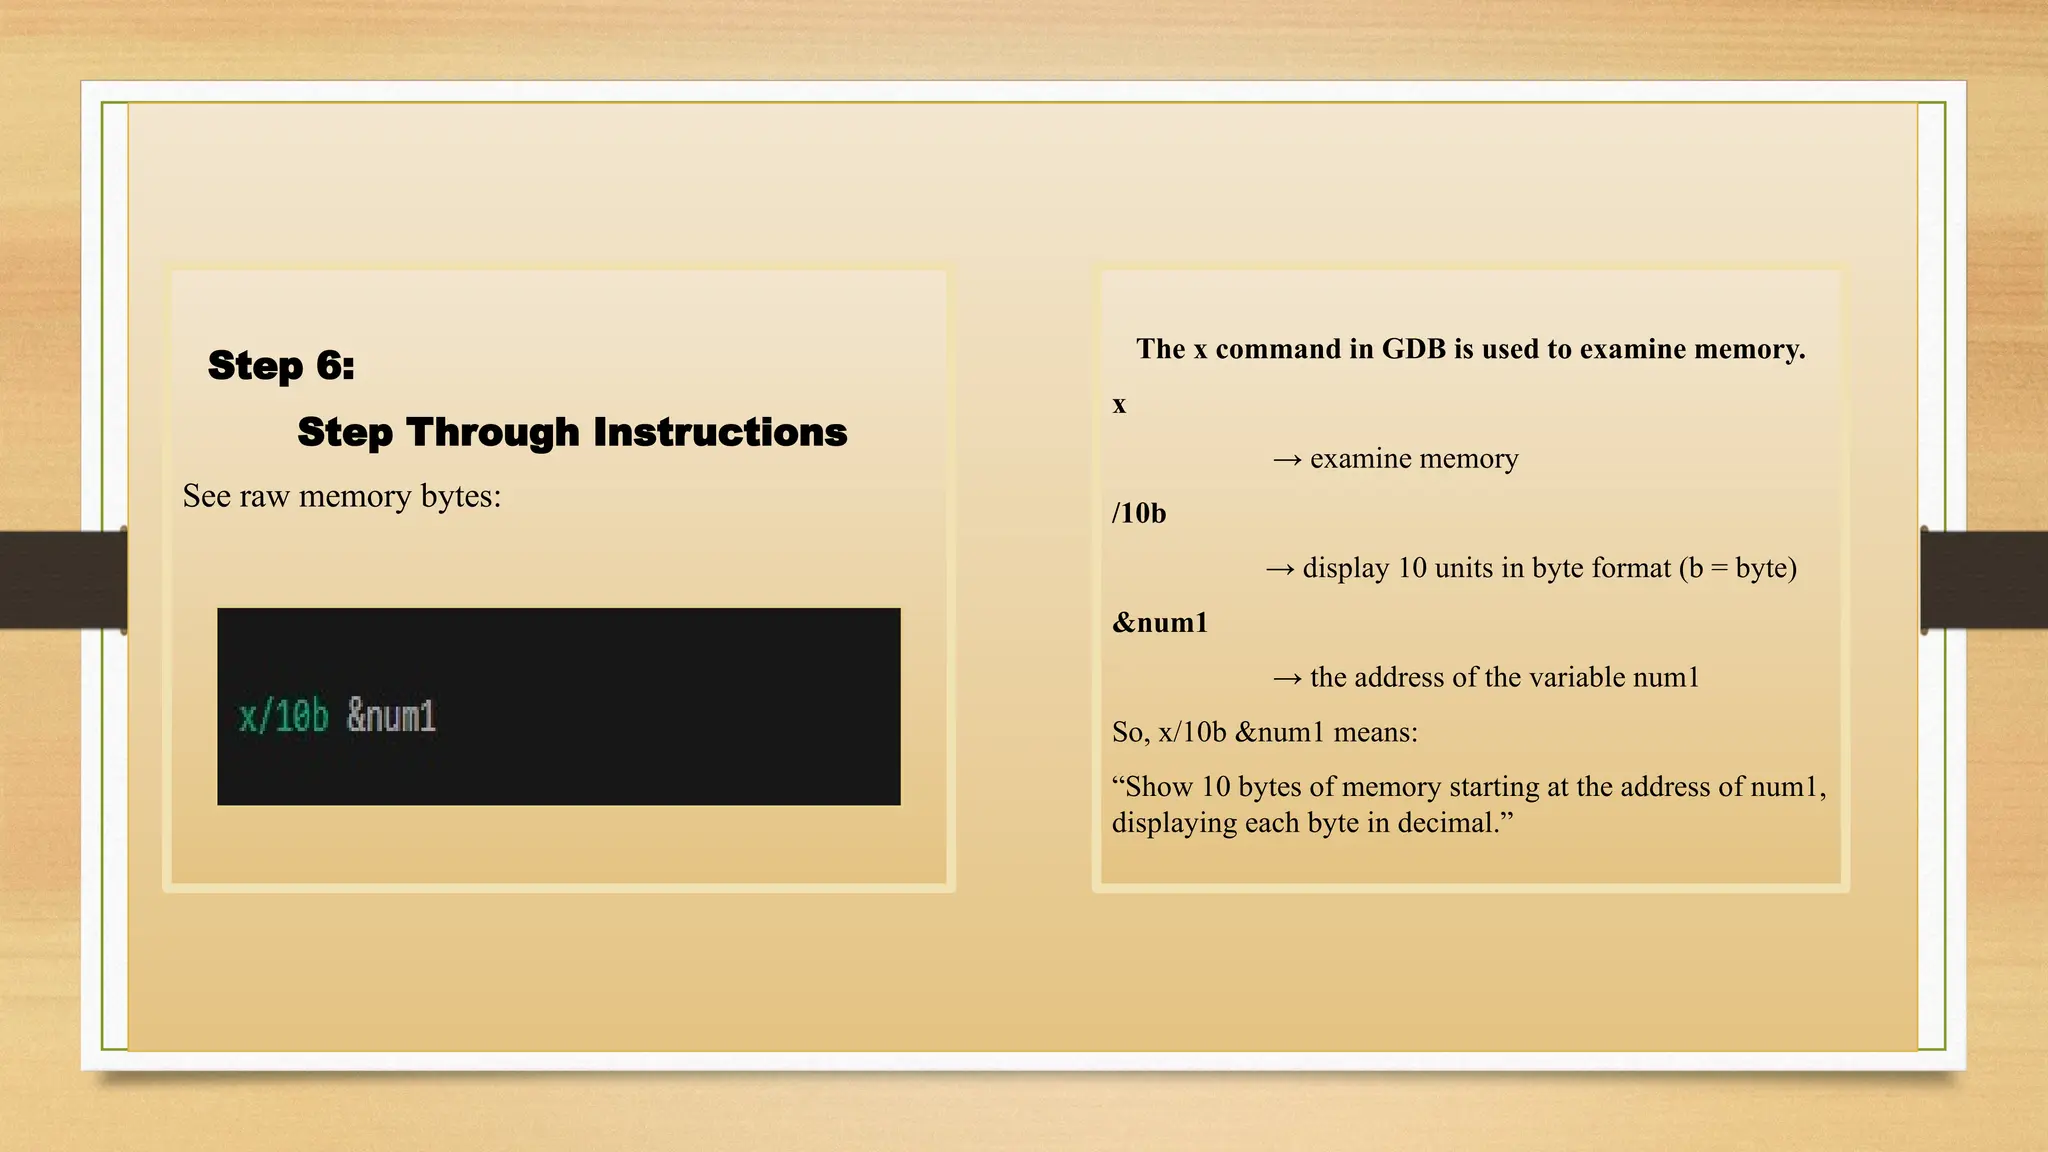
Step 6:
Step ThroughInstructions
See raw memory bytes:
The x command in GDB is used to examine memory.
x
→ examine memory
/10b
→ display 10 units in byte format (b = byte)
&num1
→ the address of the variable num1
So, x/10b &num1 means:
“Show 10 bytes of memory starting at the address of num1,
displaying each byte in decimal.”
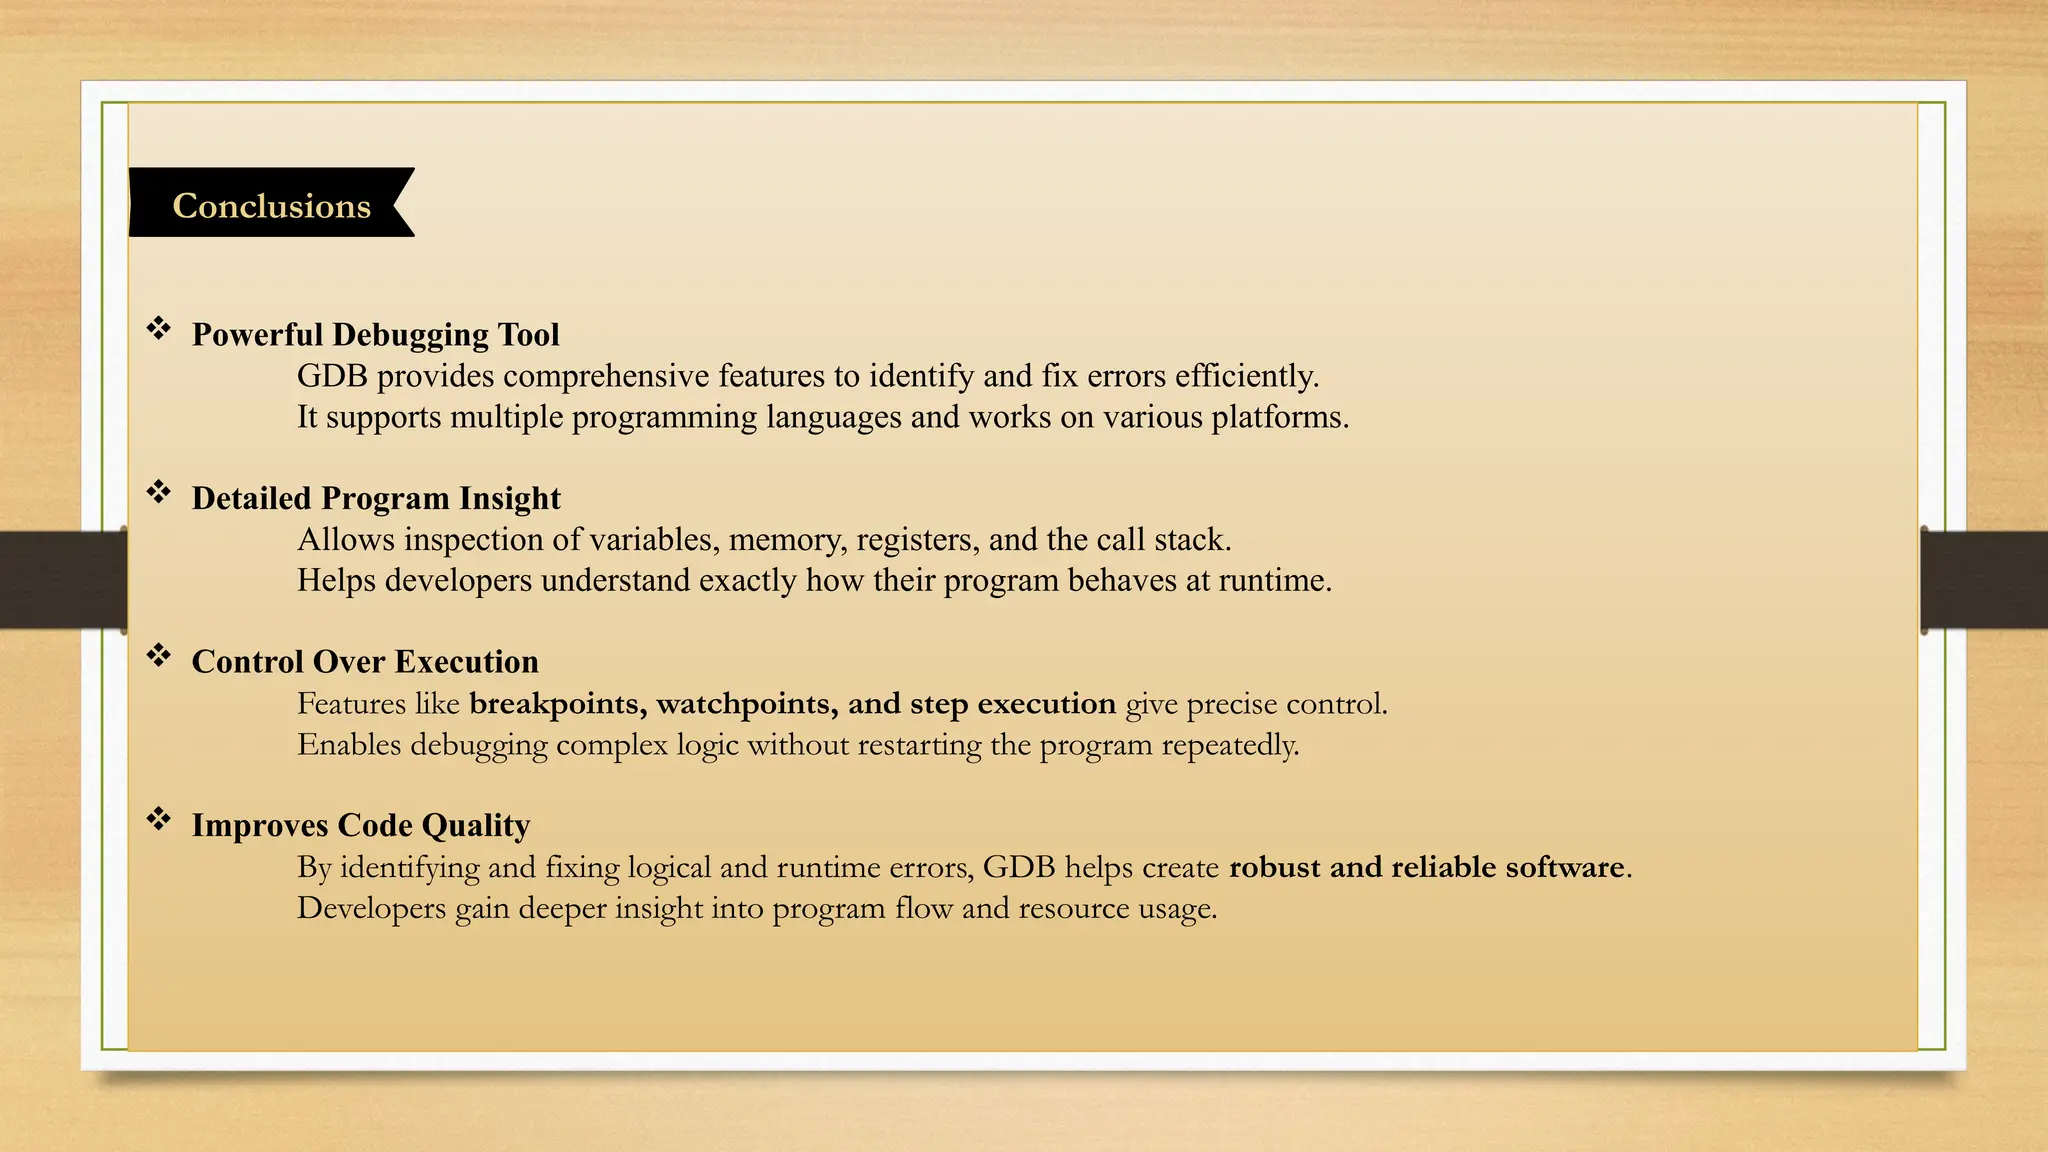
Powerful DebuggingTool
GDB provides comprehensive features to identify and fix errors efficiently.
It supports multiple programming languages and works on various platforms.
Detailed Program Insight
Allows inspection of variables, memory, registers, and the call stack.
Helps developers understand exactly how their program behaves at runtime.
Control Over Execution
Features like breakpoints, watchpoints, and step execution give precise control.
Enables debugging complex logic without restarting the program repeatedly.
Improves Code Quality
By identifying and fixing logical and runtime errors, GDB helps create robust and reliable software.
Developers gain deeper insight into program flow and resource usage.
Conclusions
31.
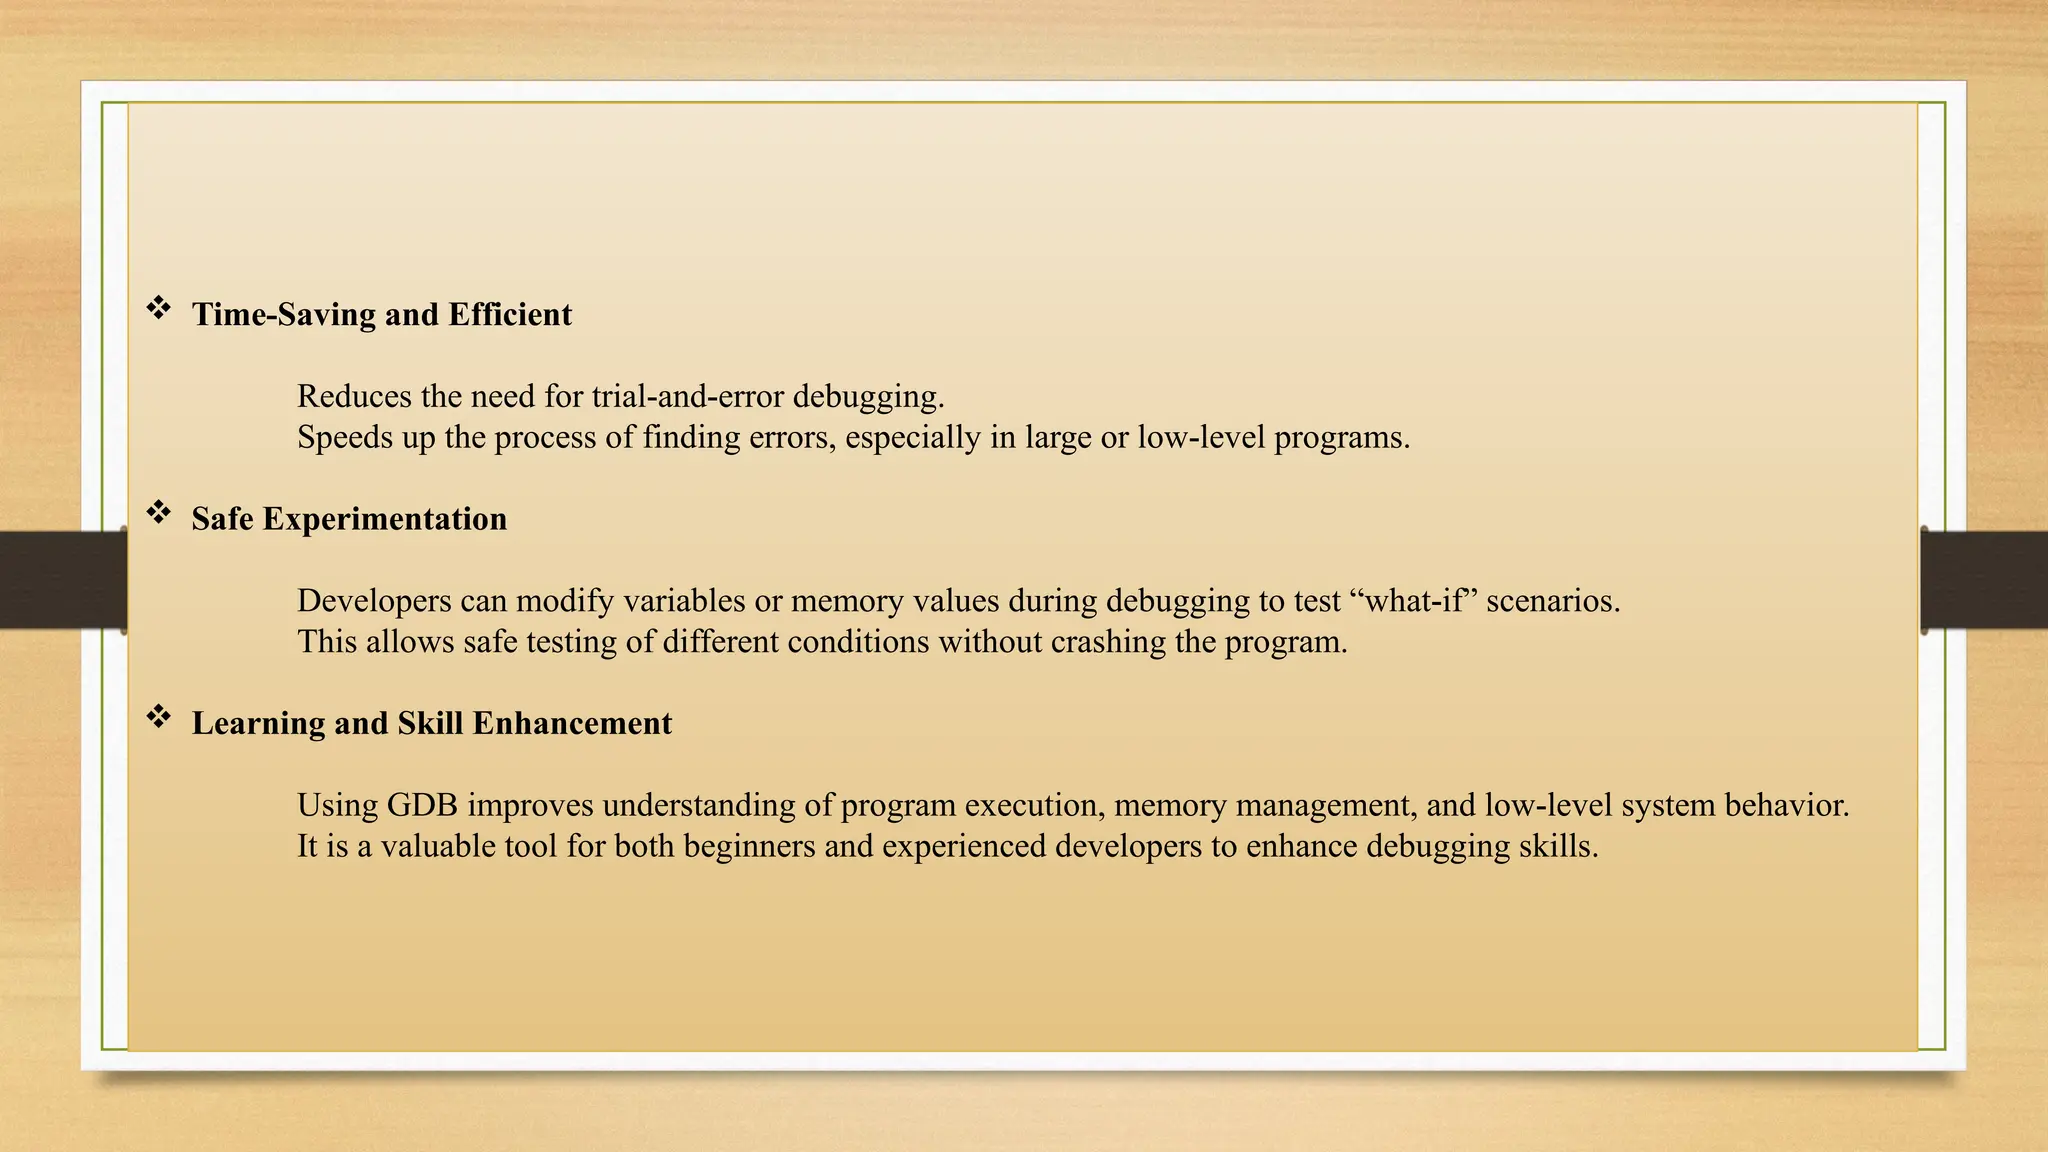
Time-Saving andEfficient
Reduces the need for trial-and-error debugging.
Speeds up the process of finding errors, especially in large or low-level programs.
Safe Experimentation
Developers can modify variables or memory values during debugging to test “what-if” scenarios.
This allows safe testing of different conditions without crashing the program.
Learning and Skill Enhancement
Using GDB improves understanding of program execution, memory management, and low-level system behavior.
It is a valuable tool for both beginners and experienced developers to enhance debugging skills.