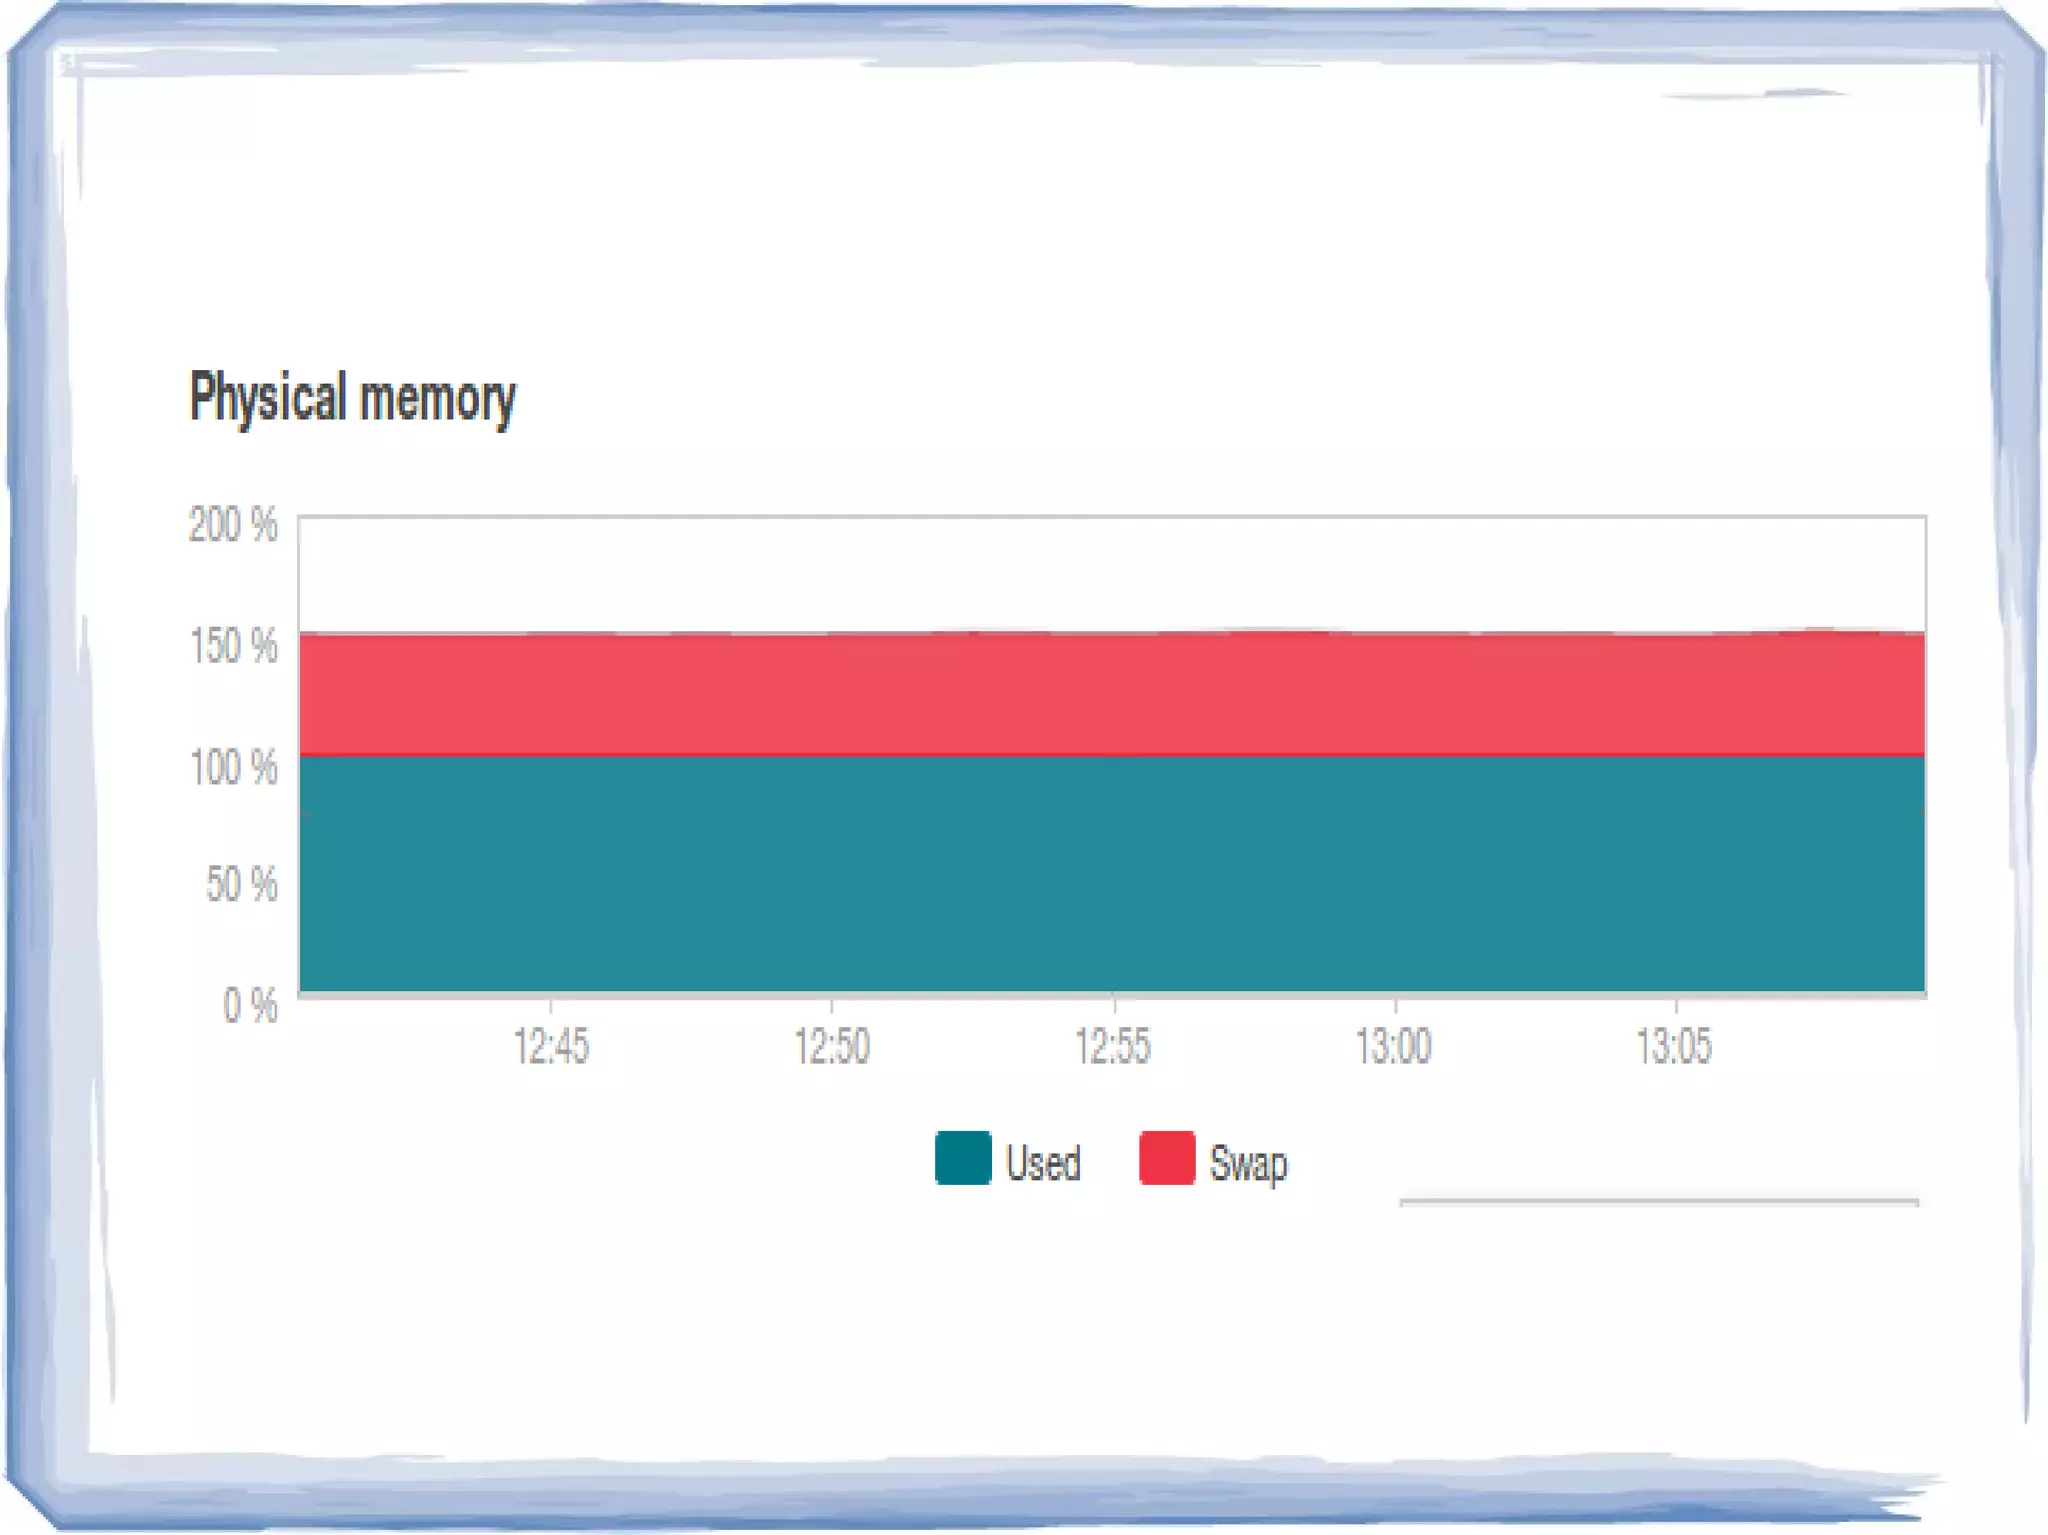

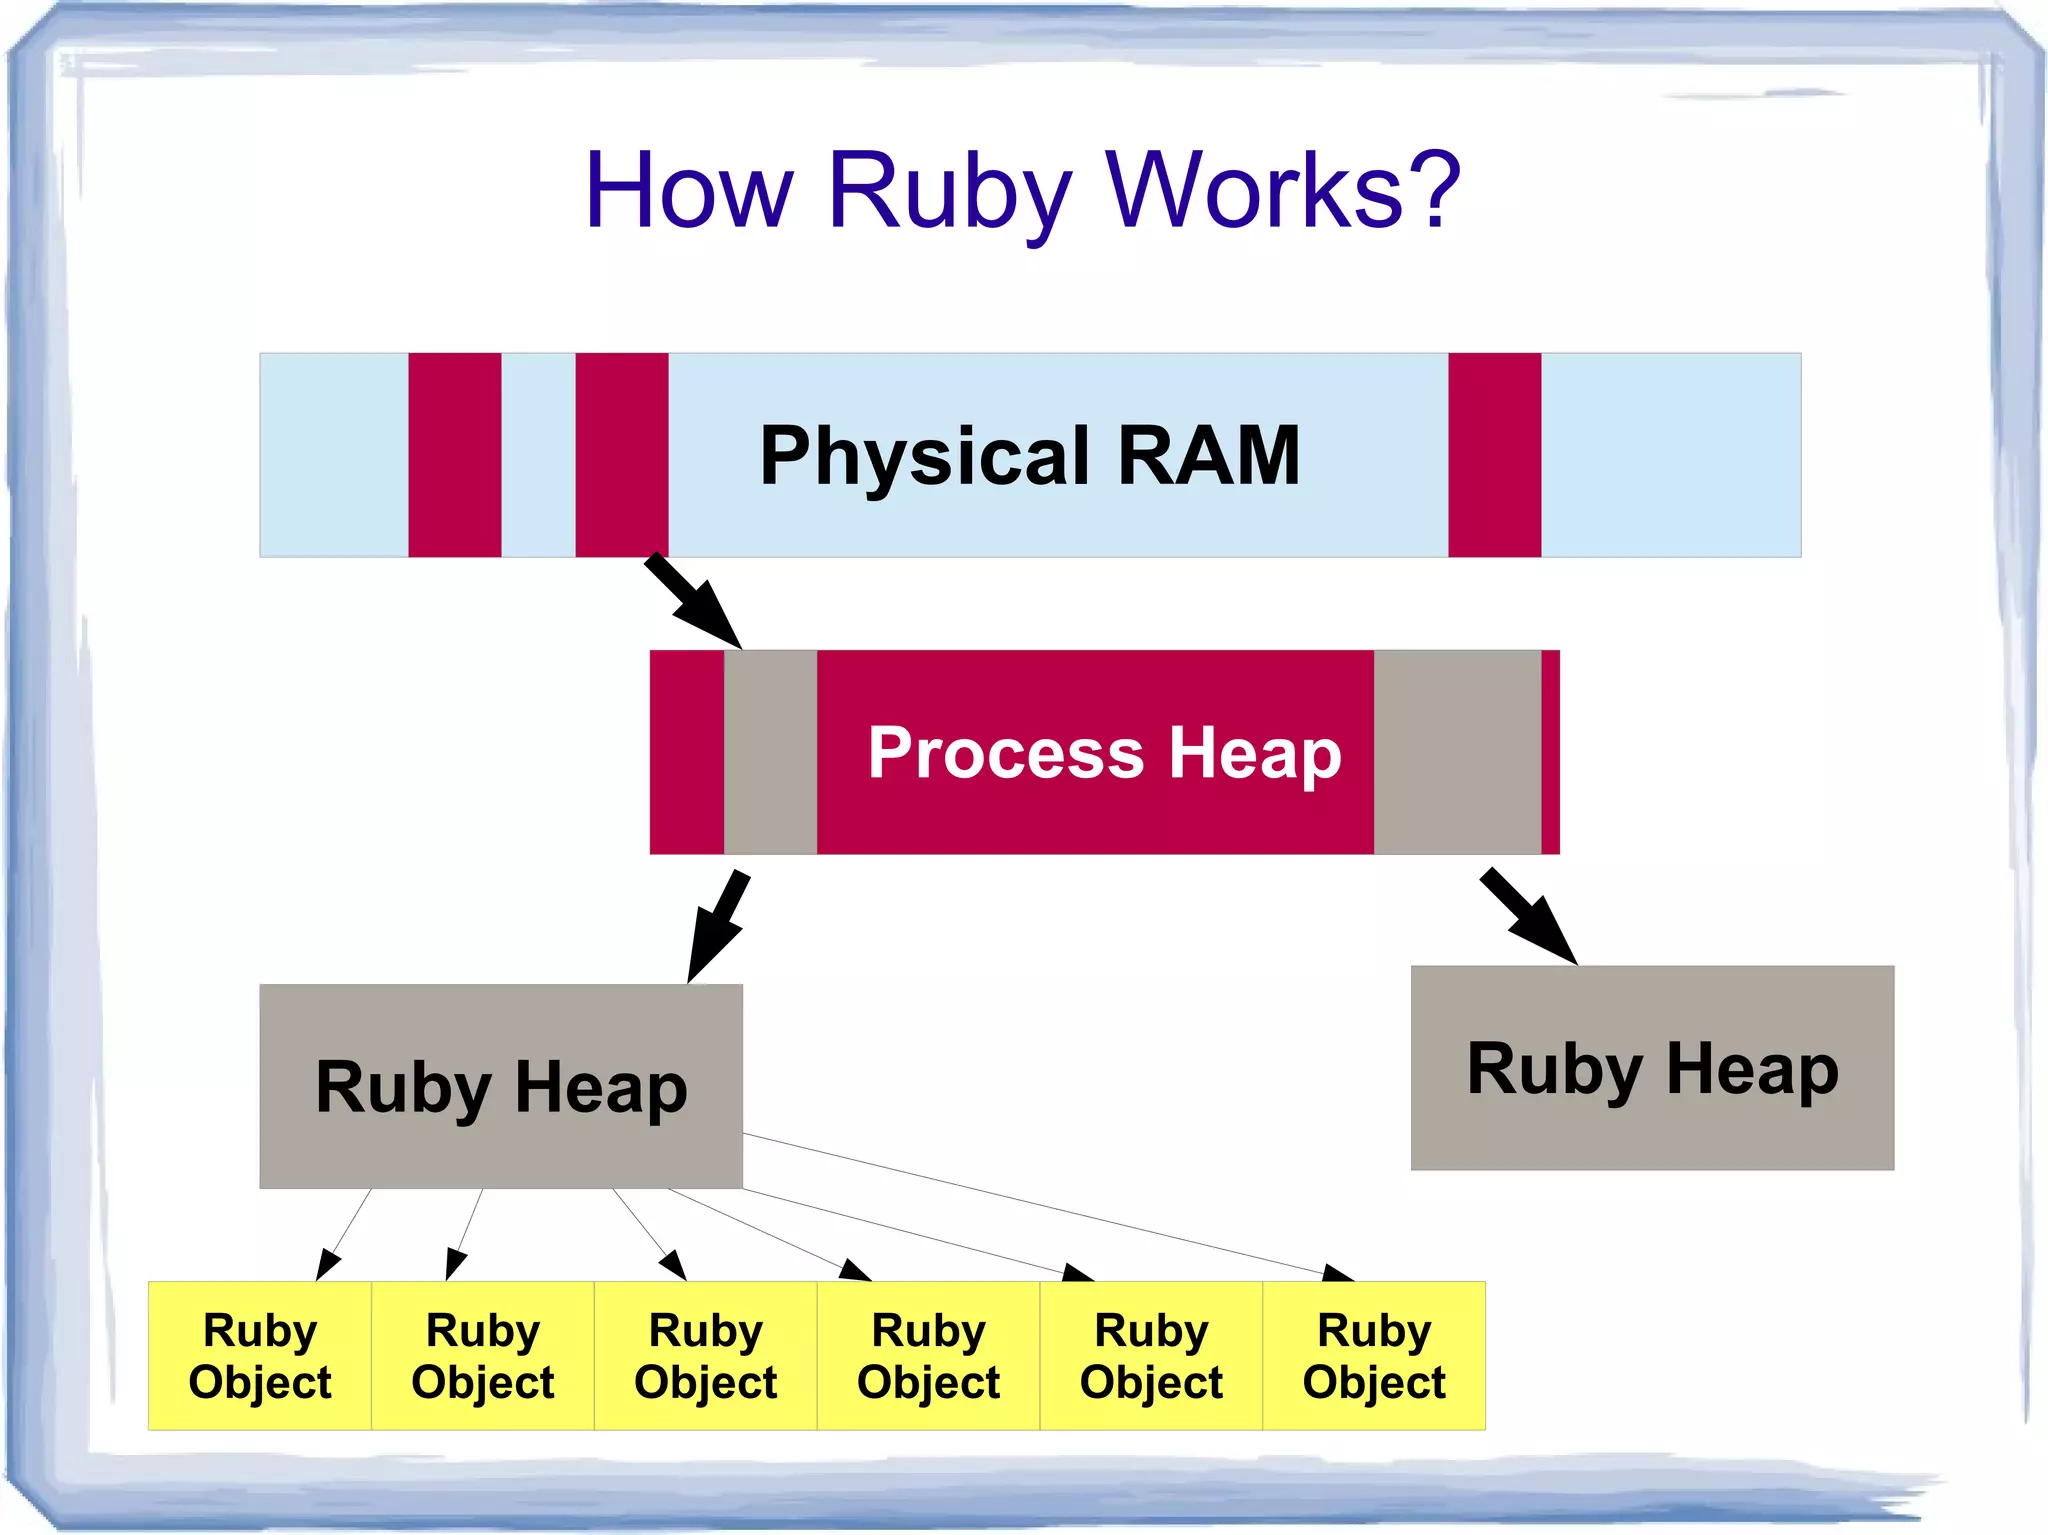
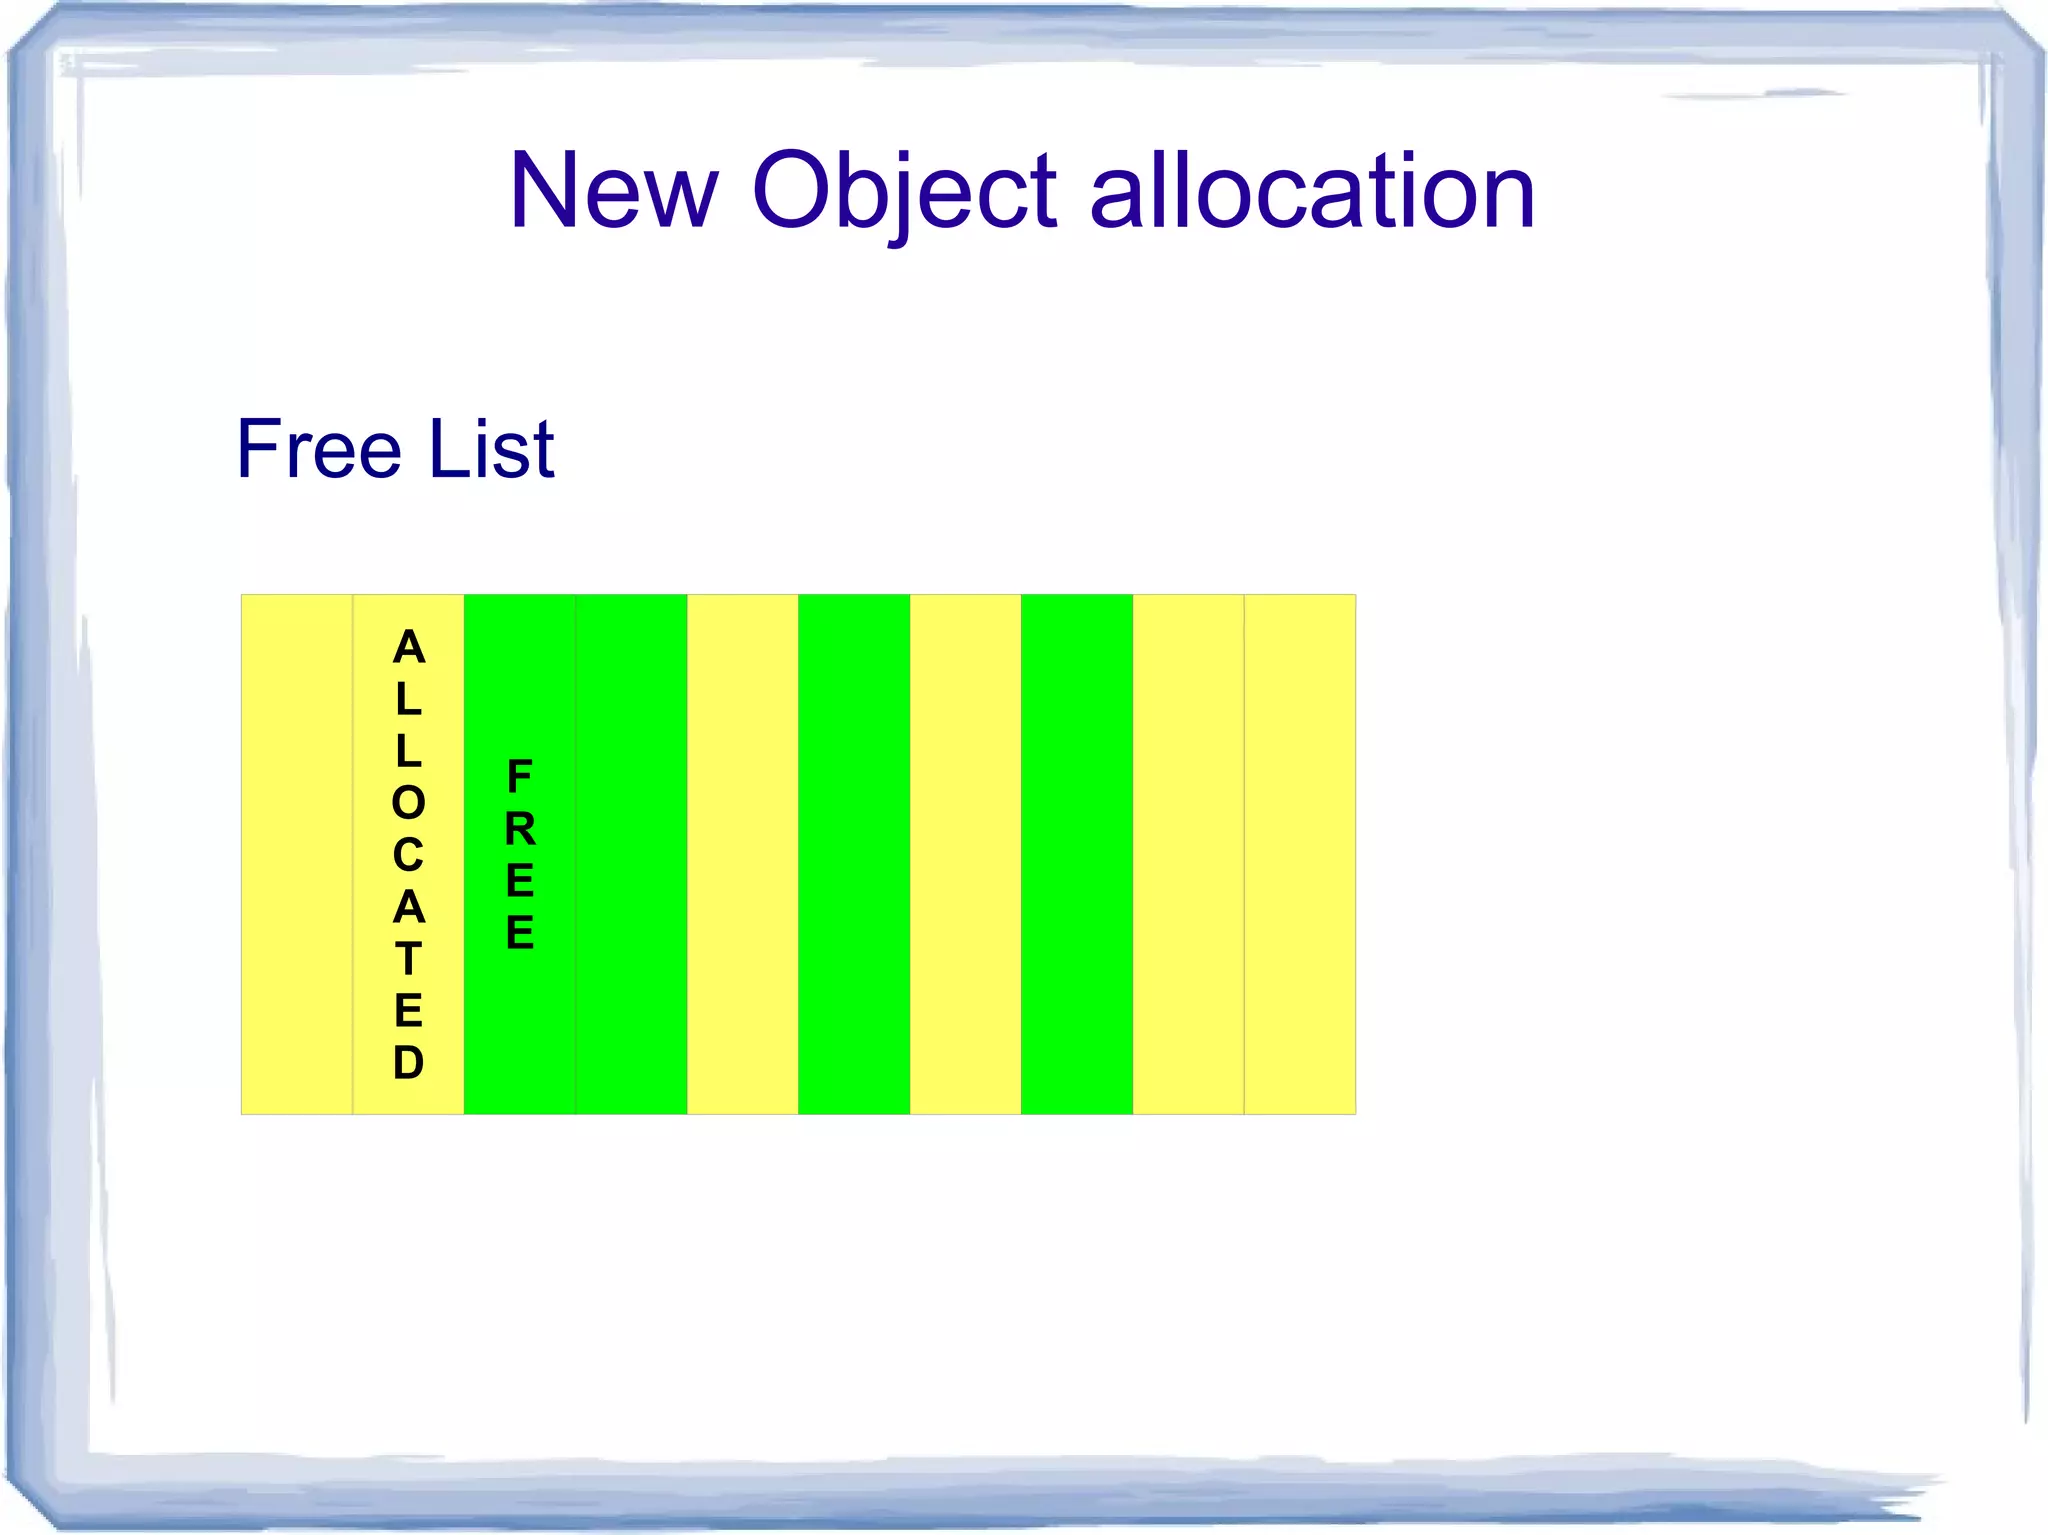
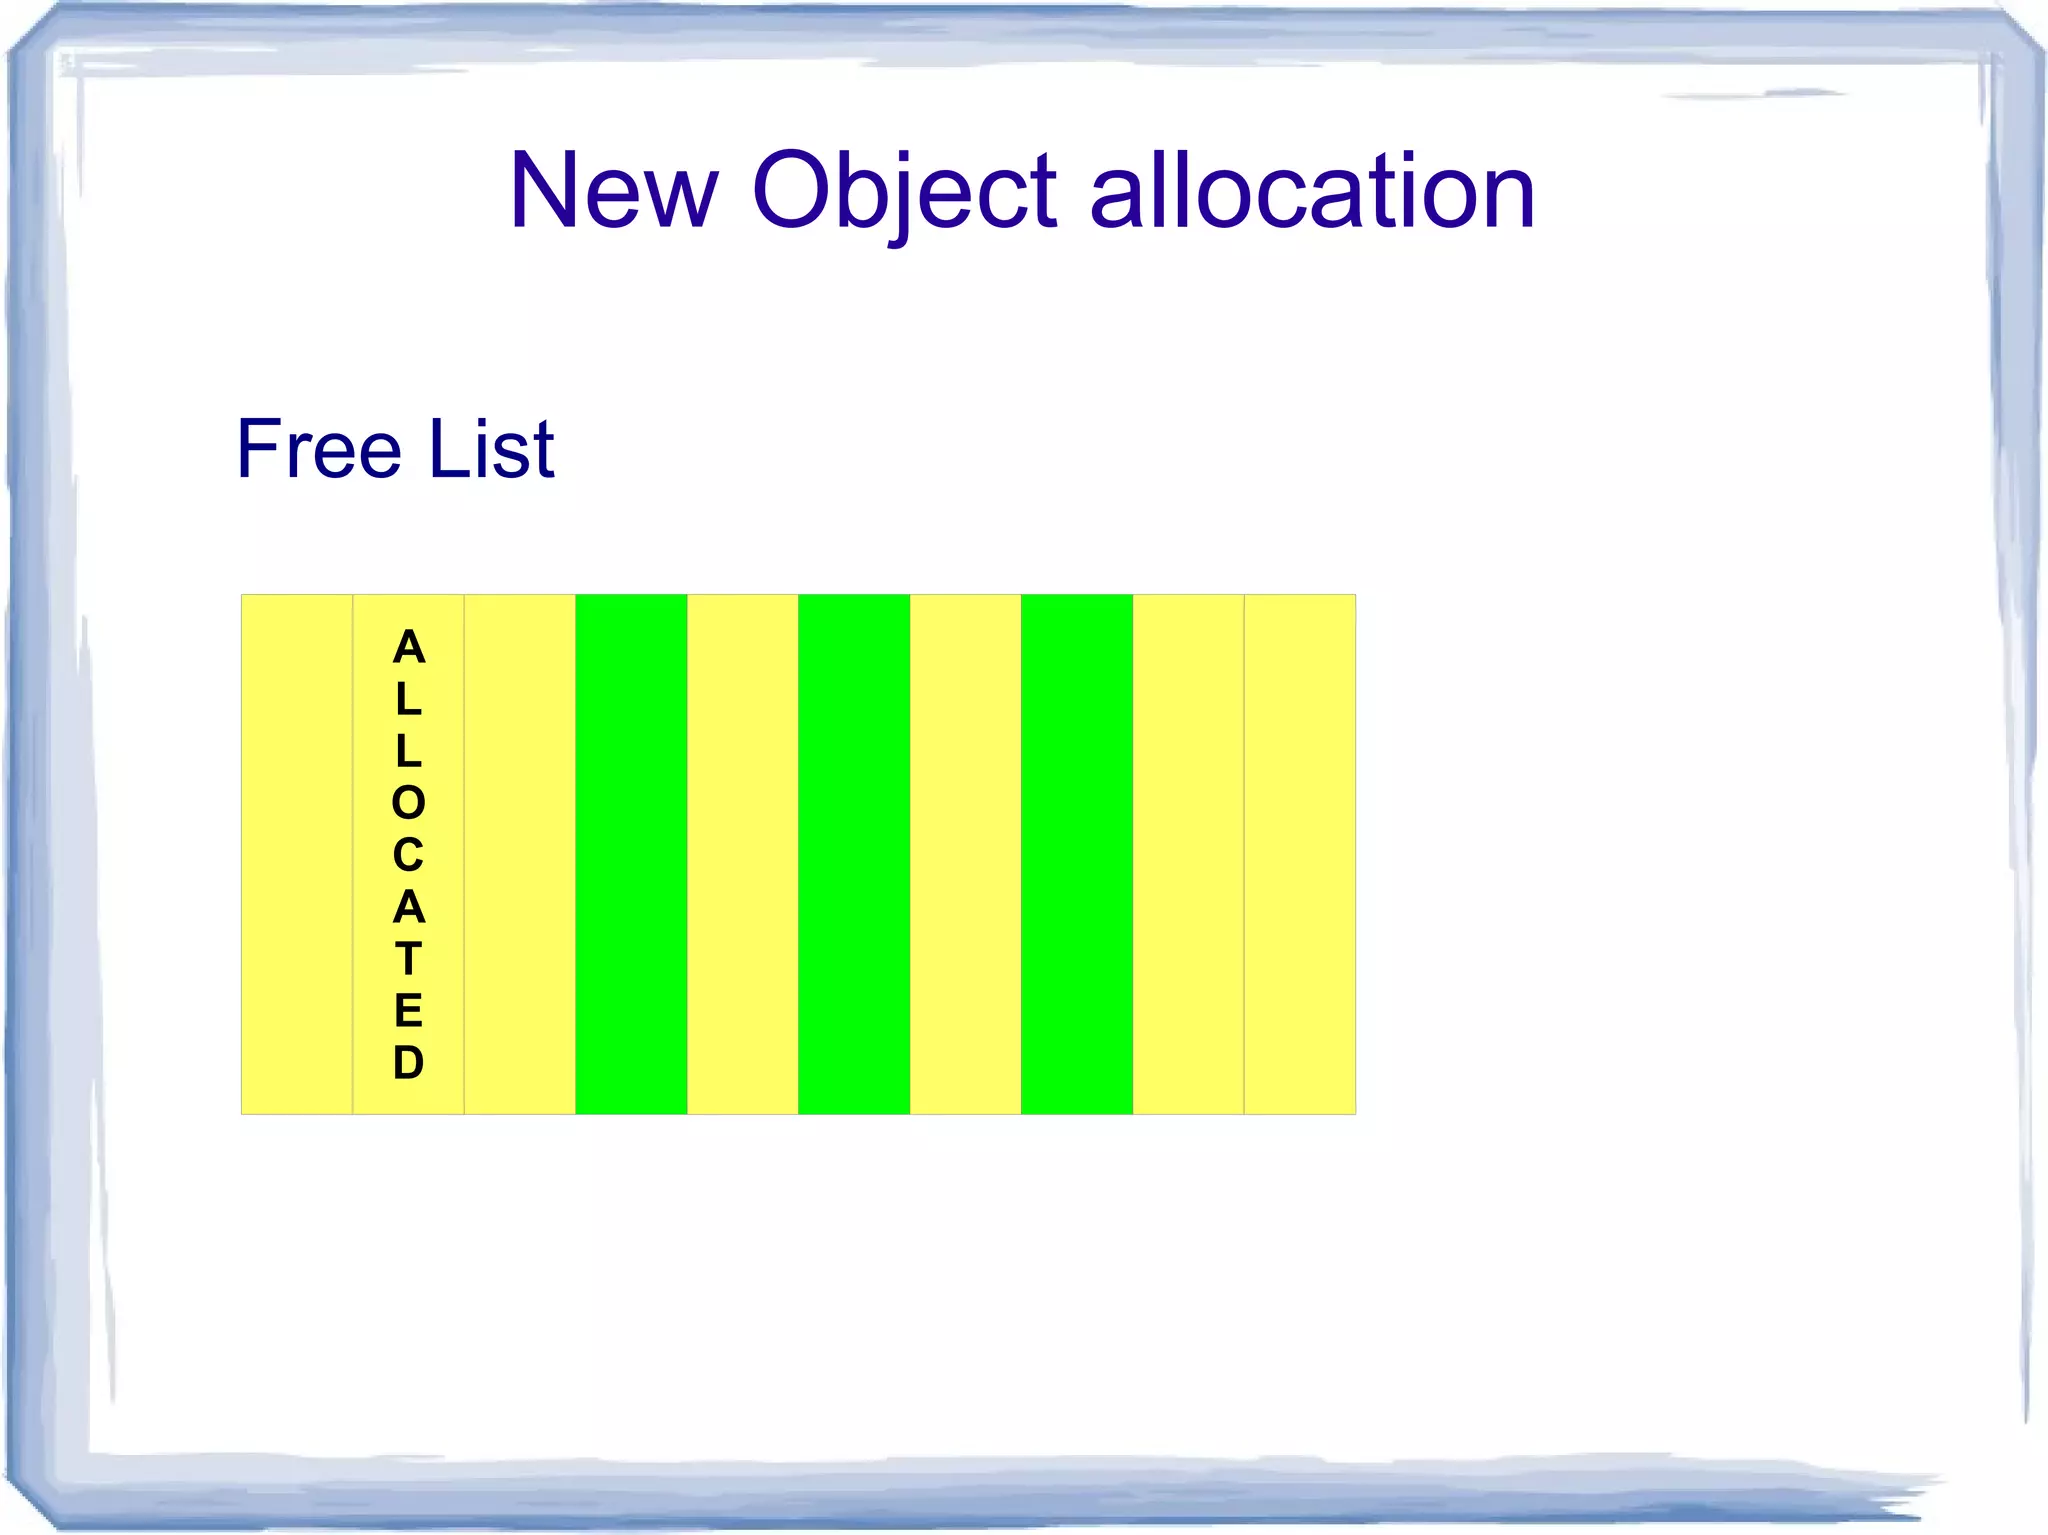
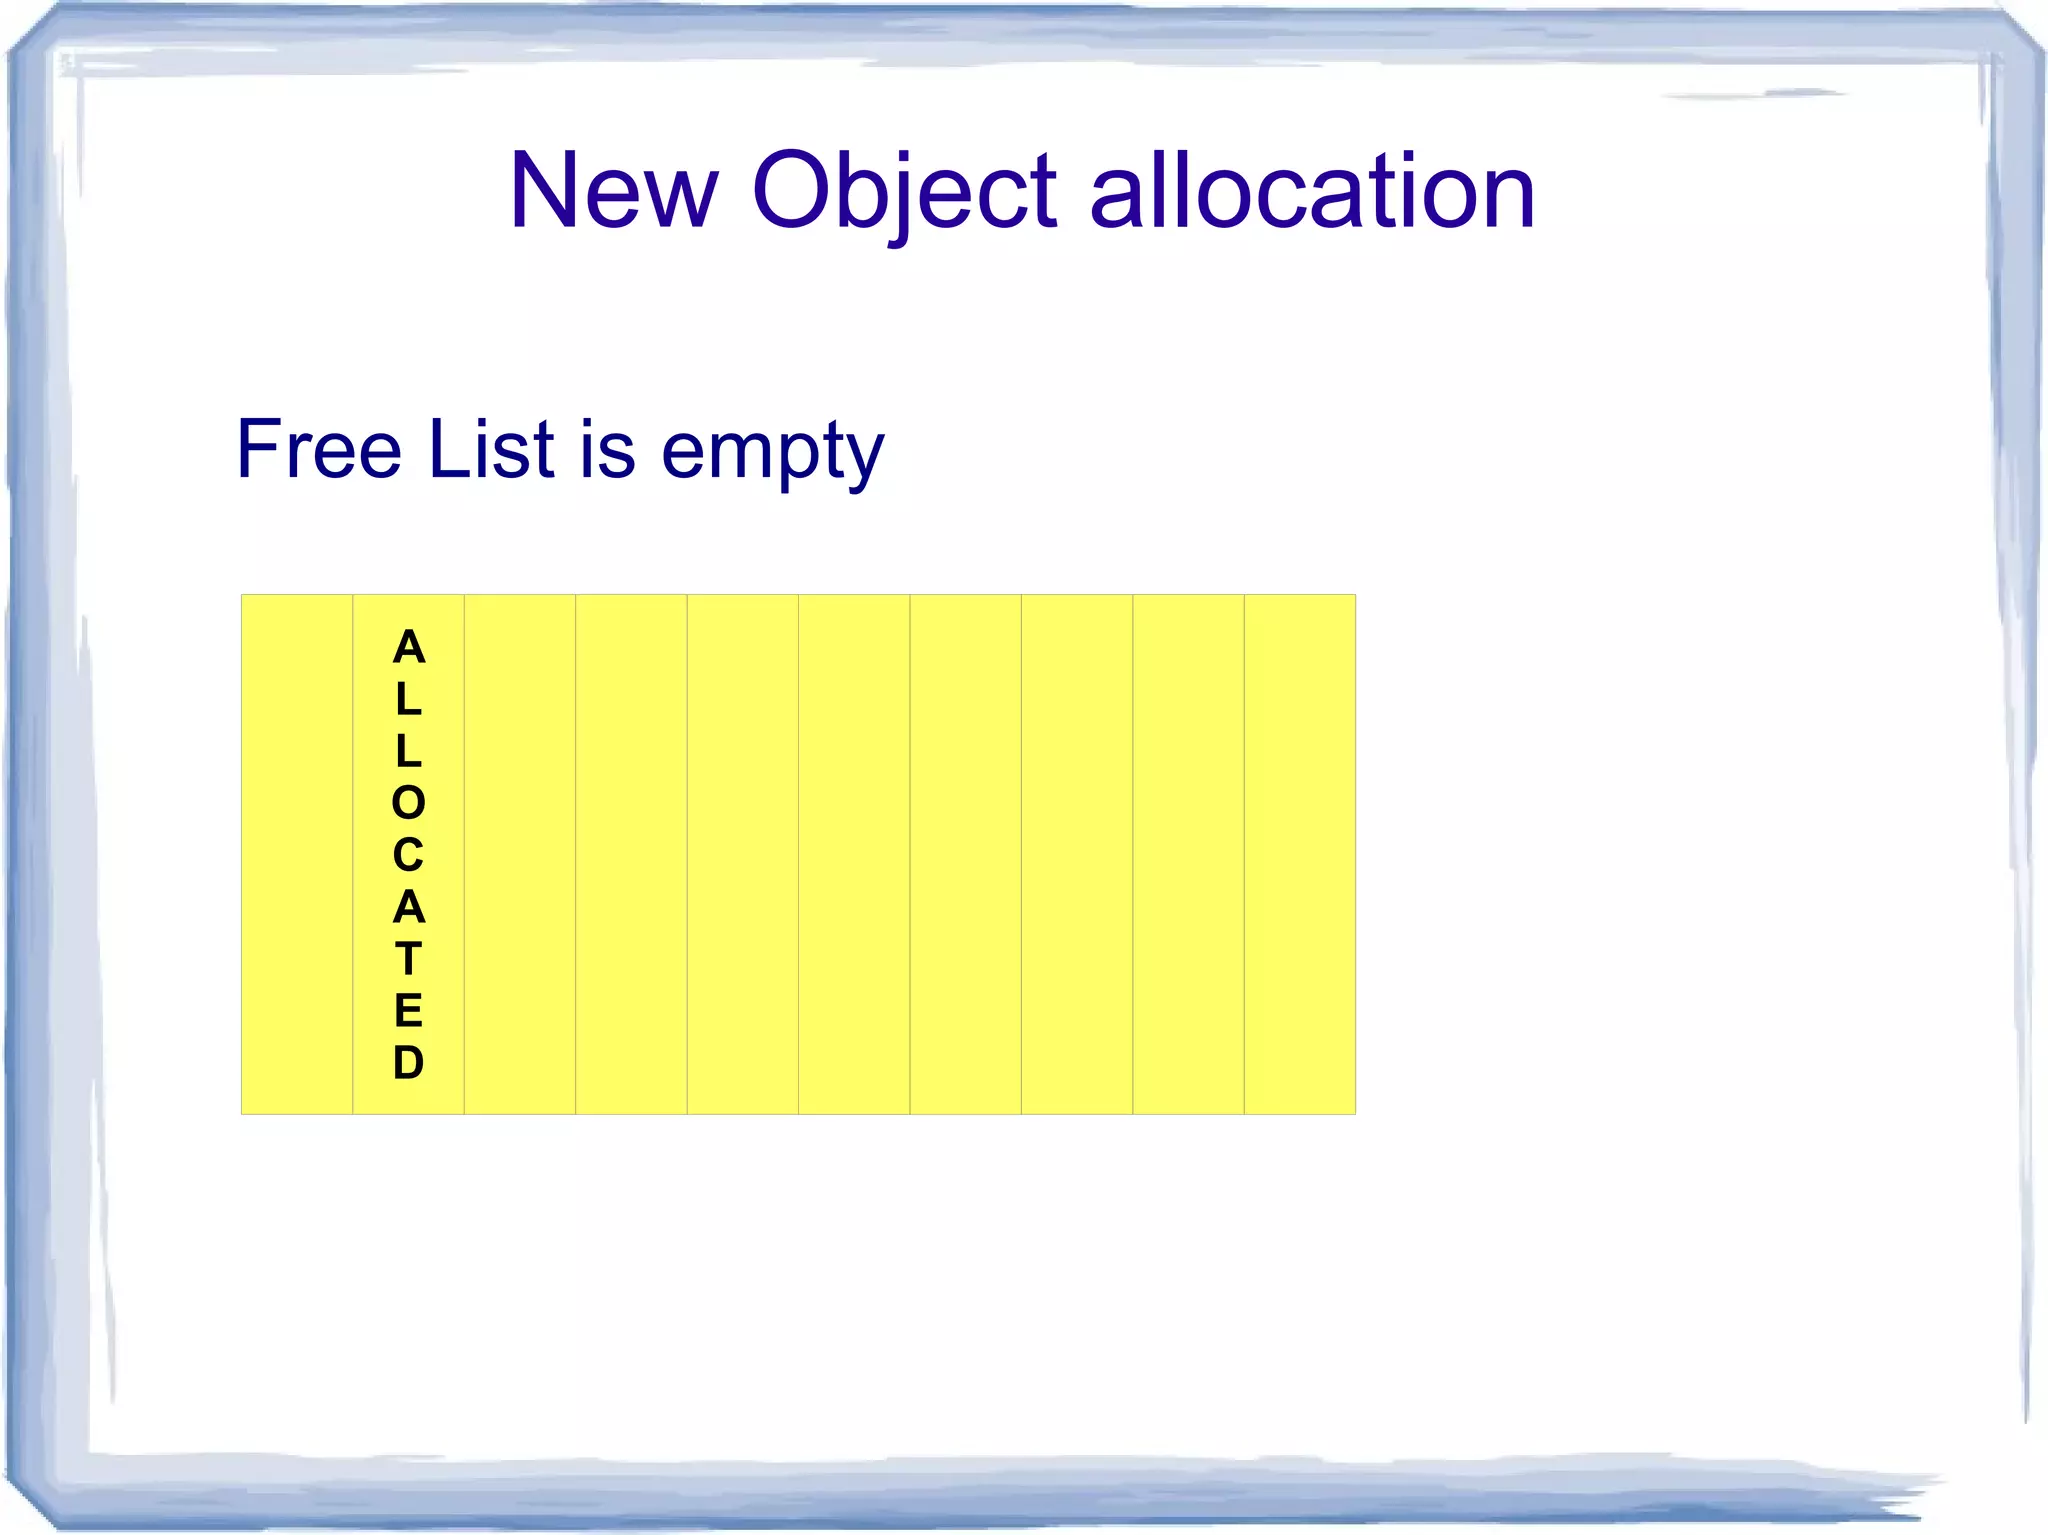

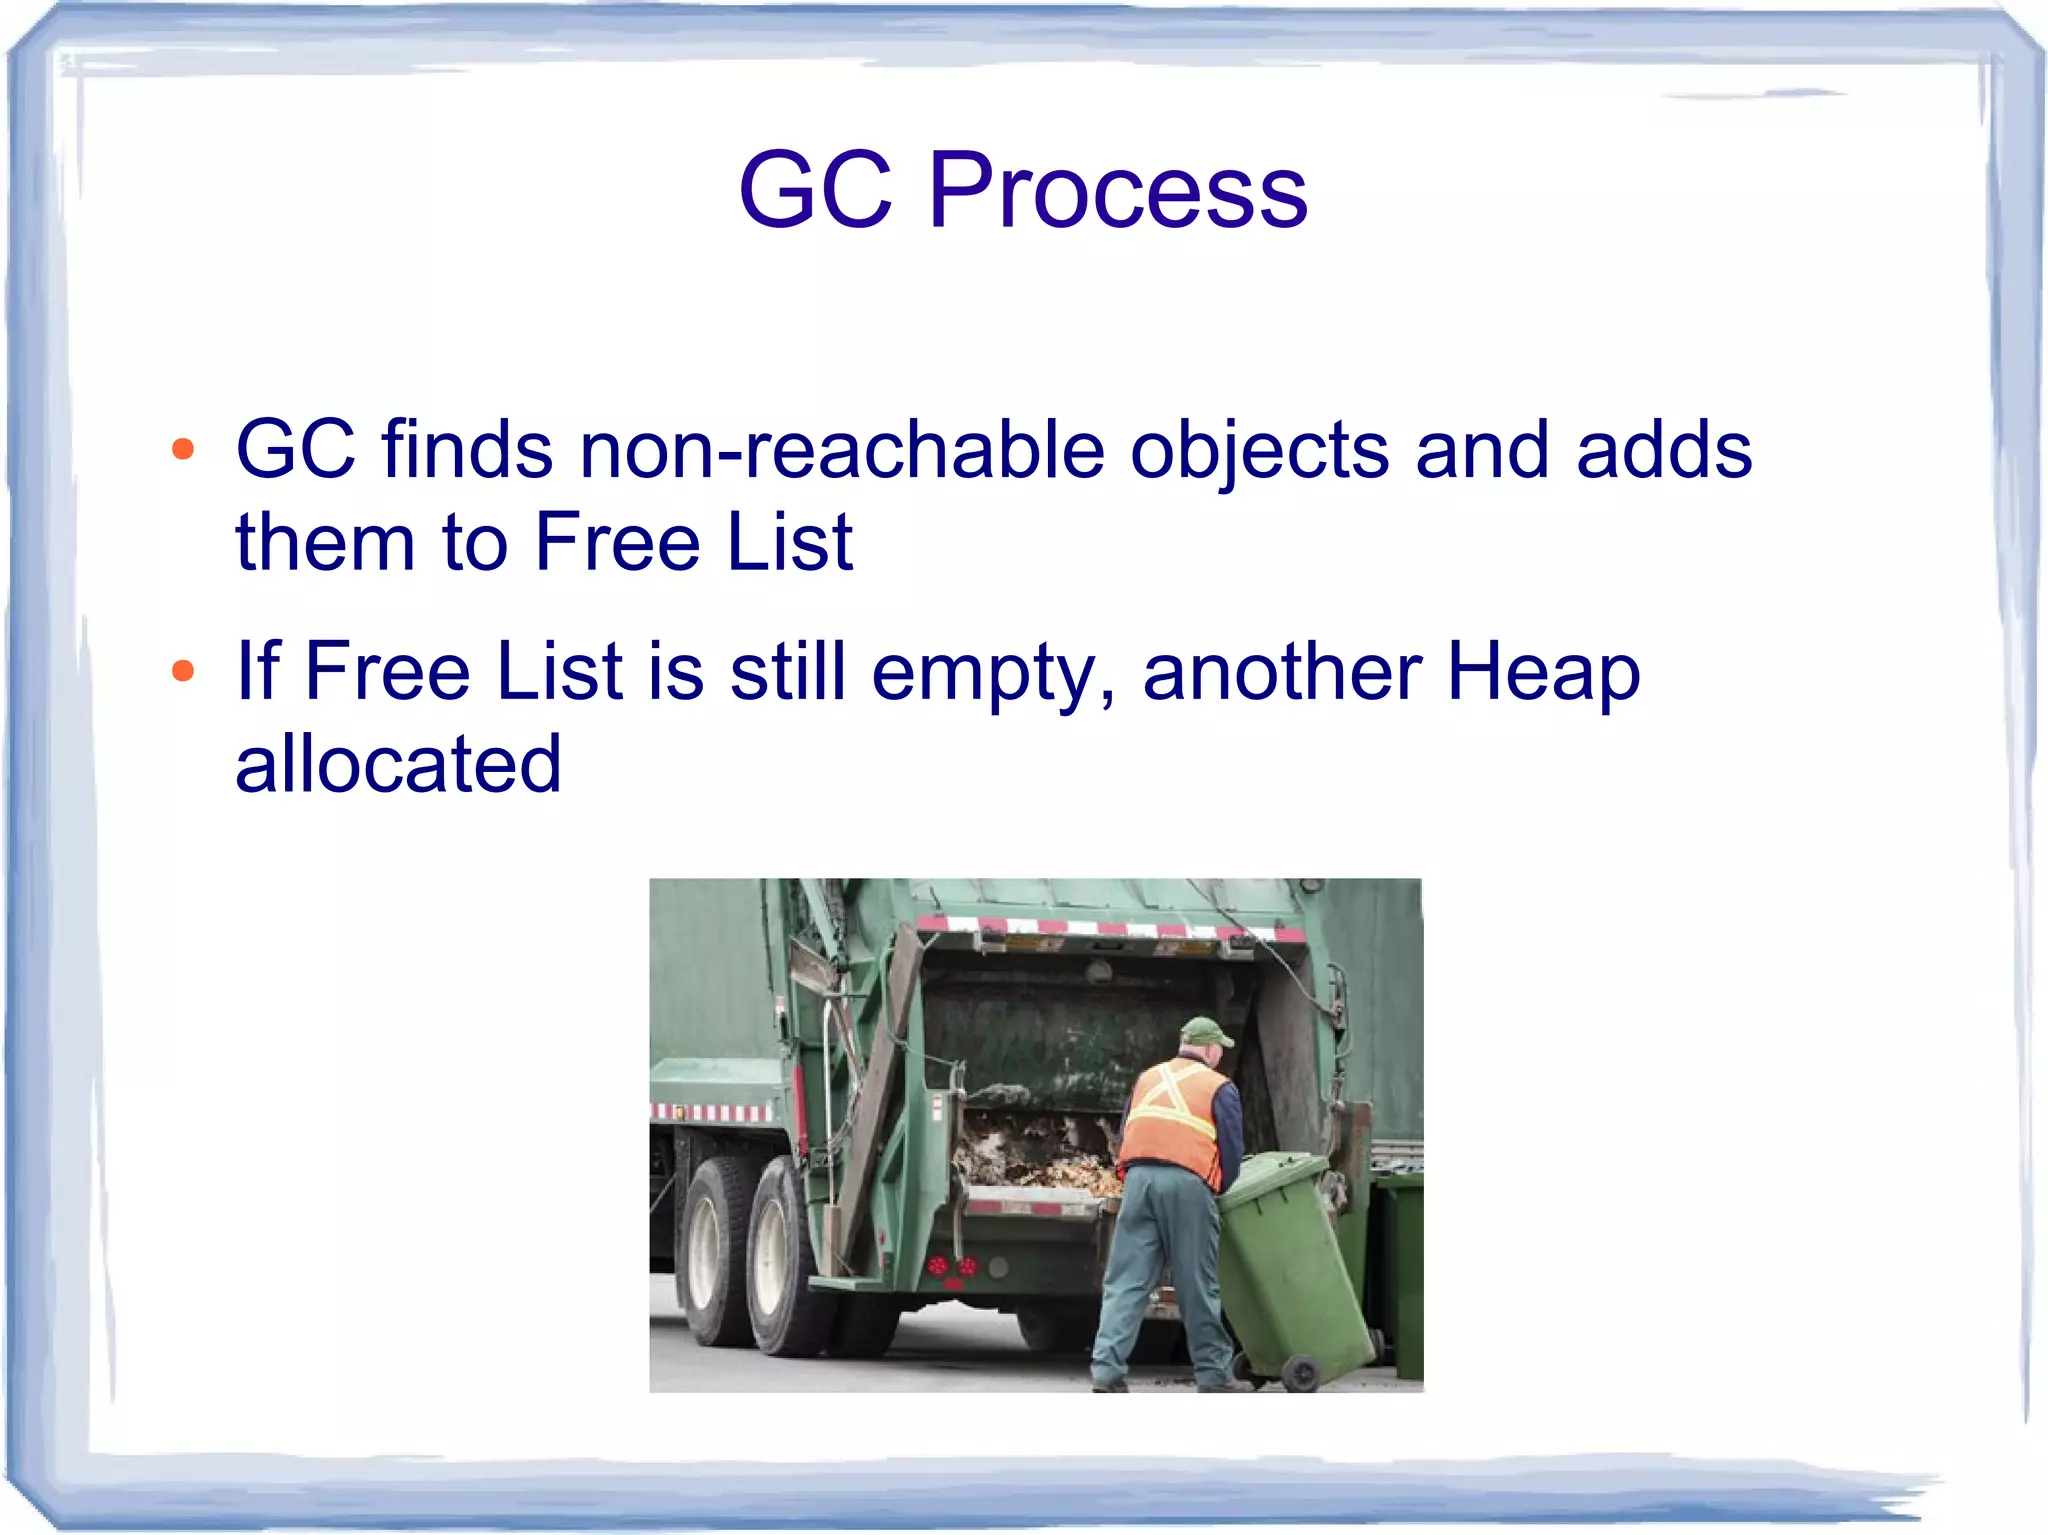
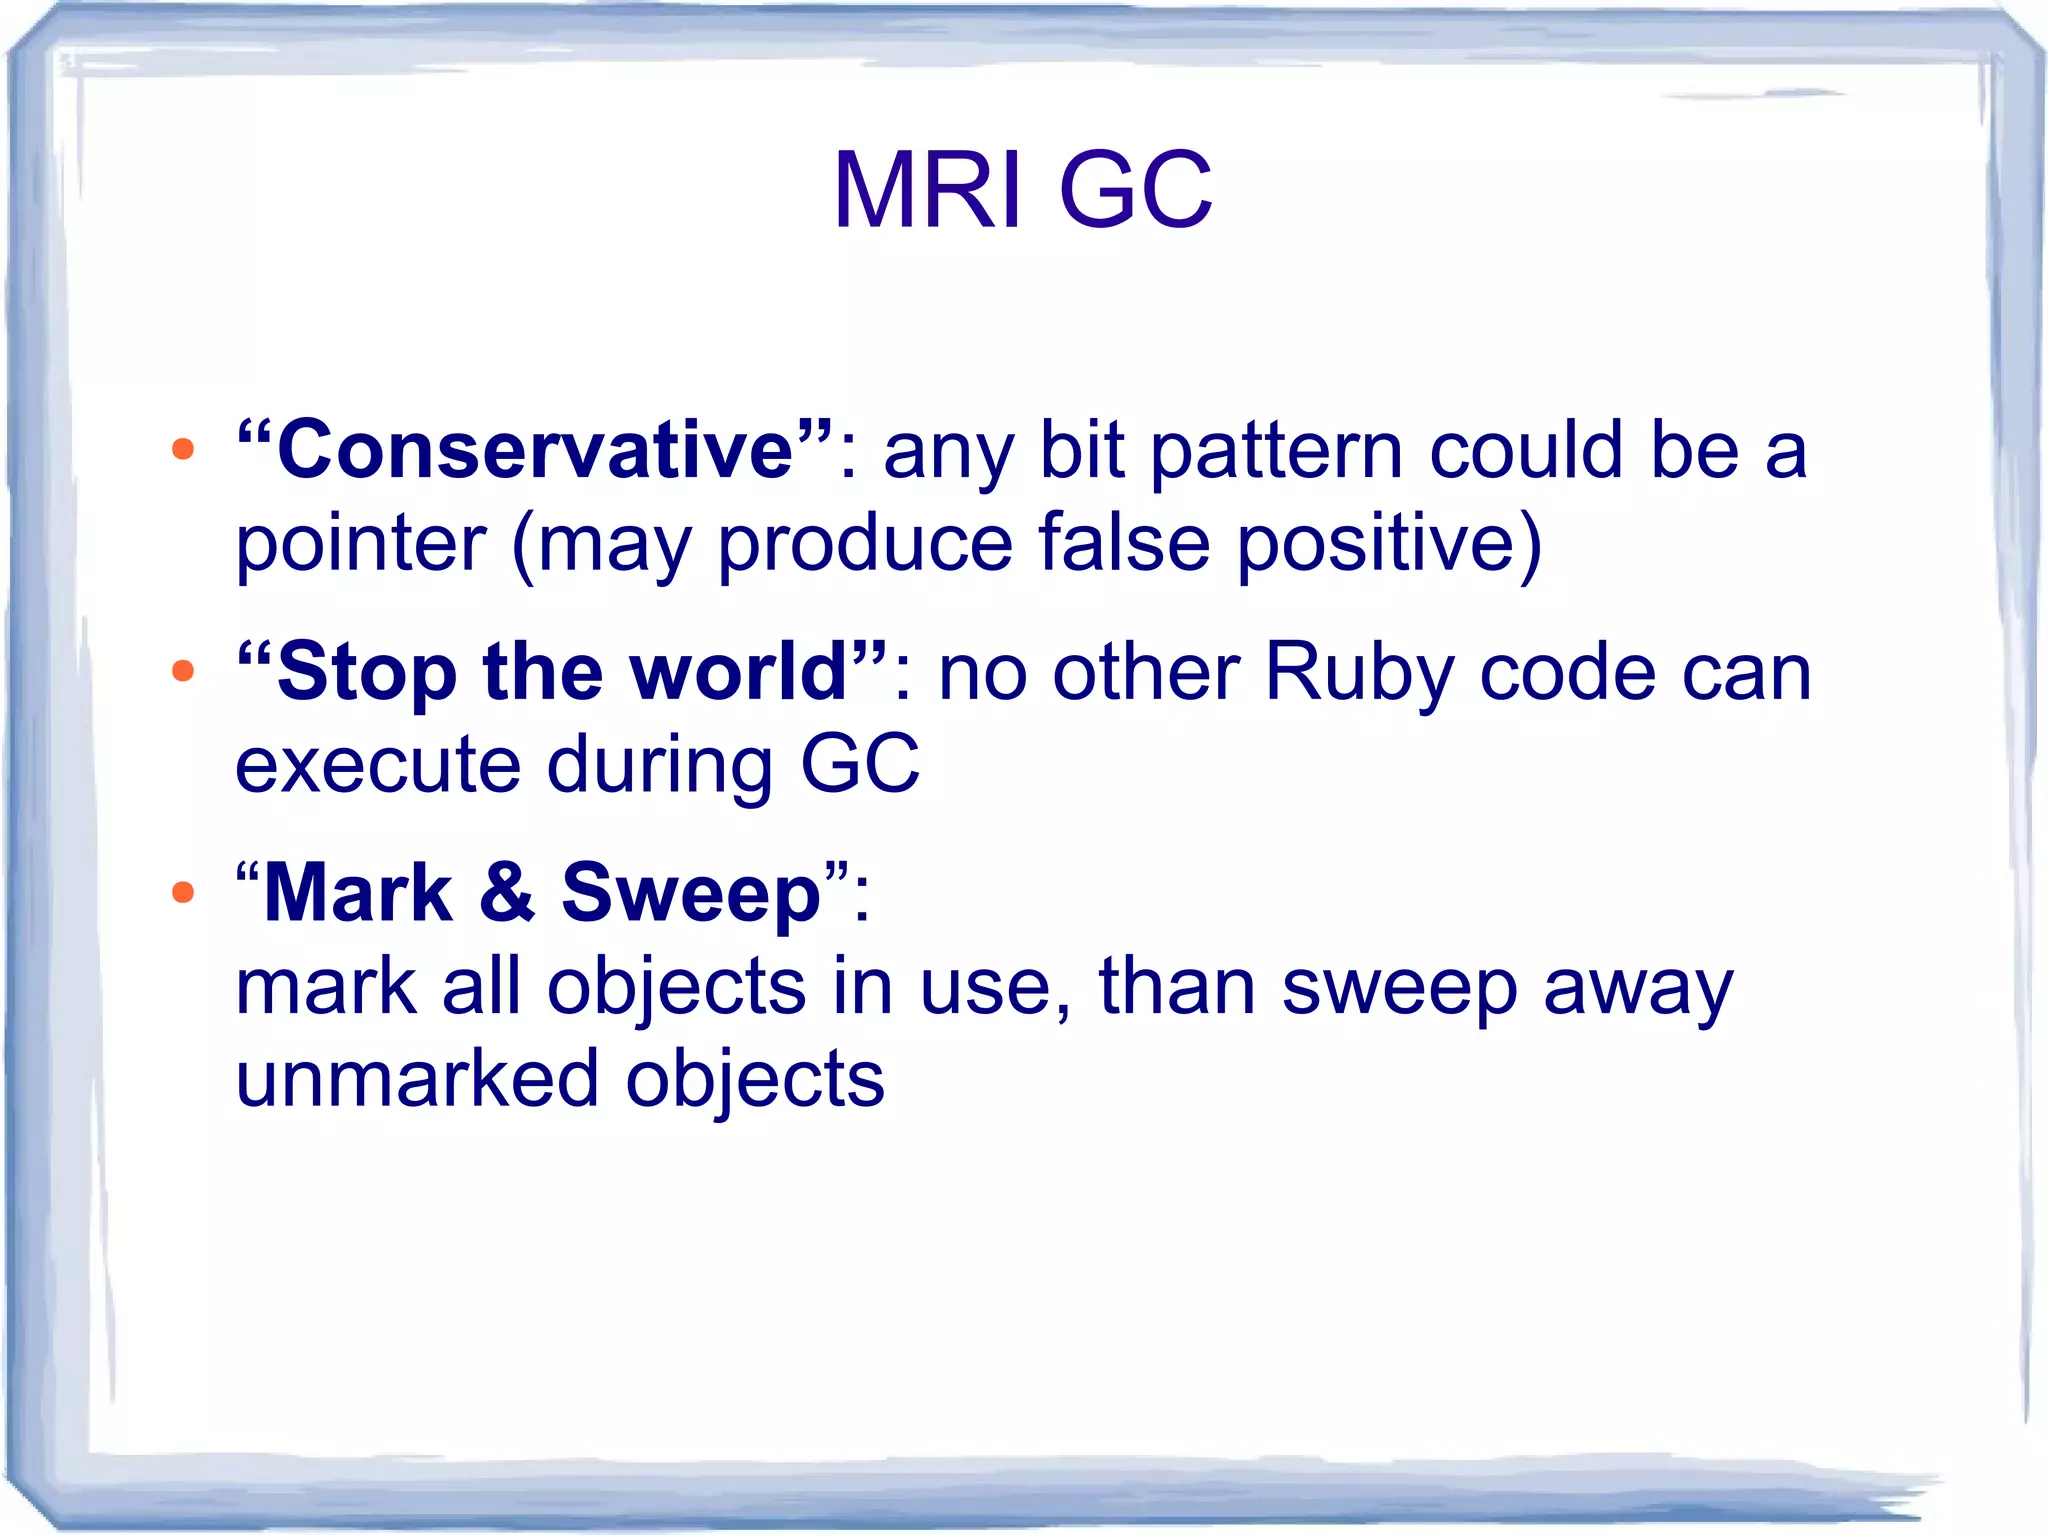


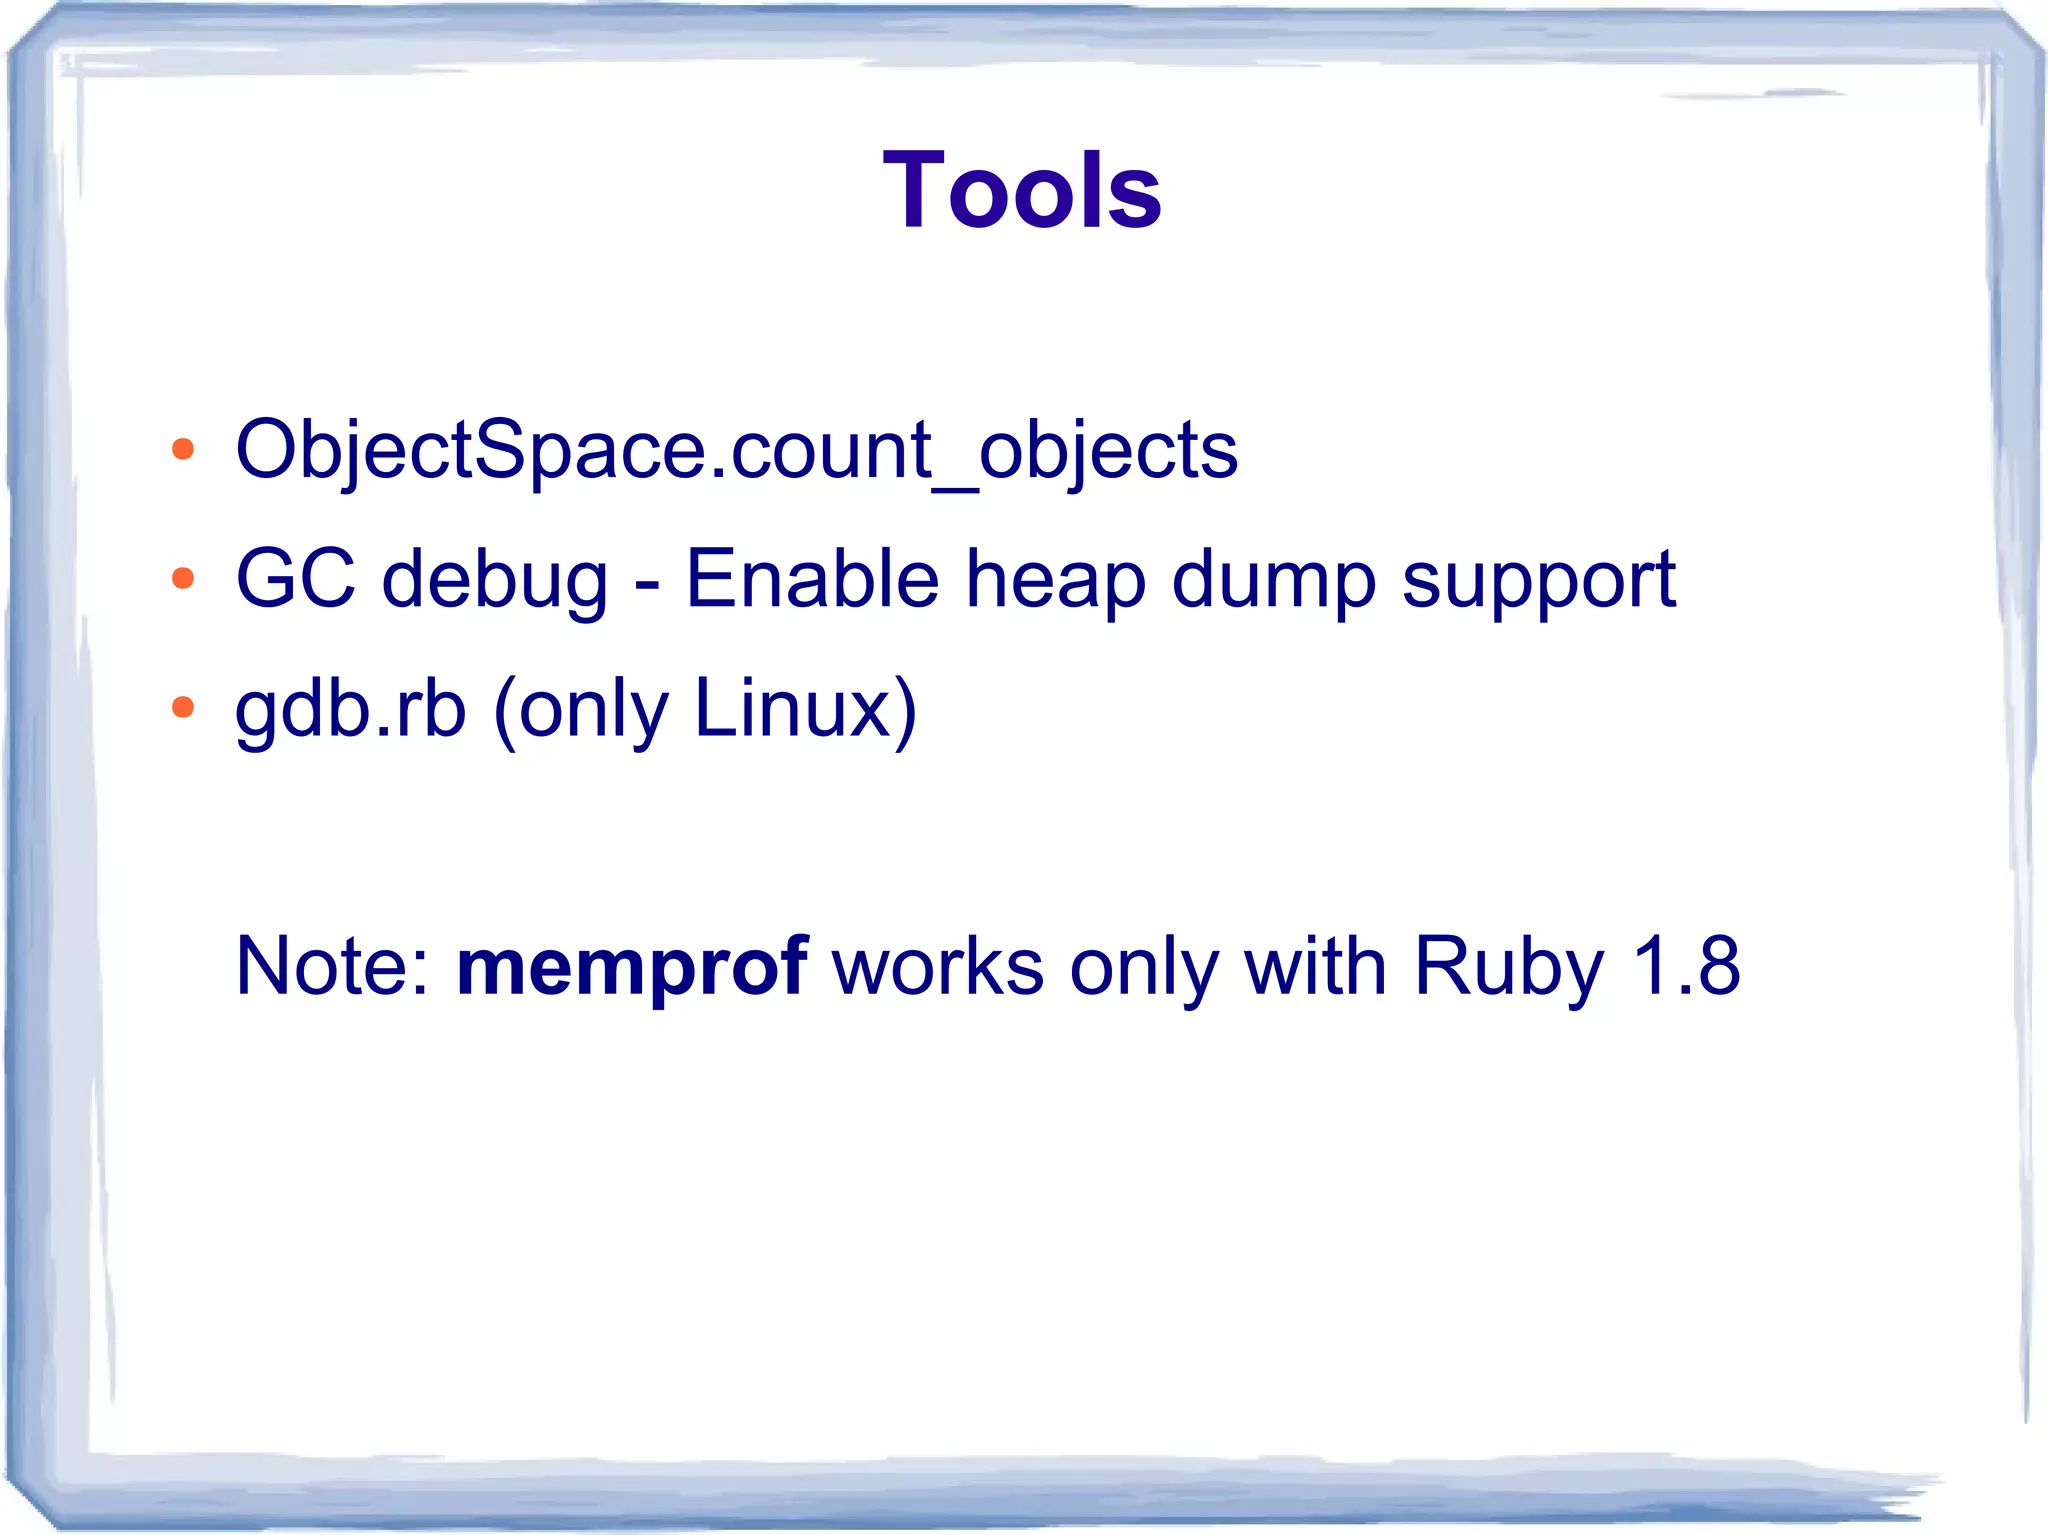
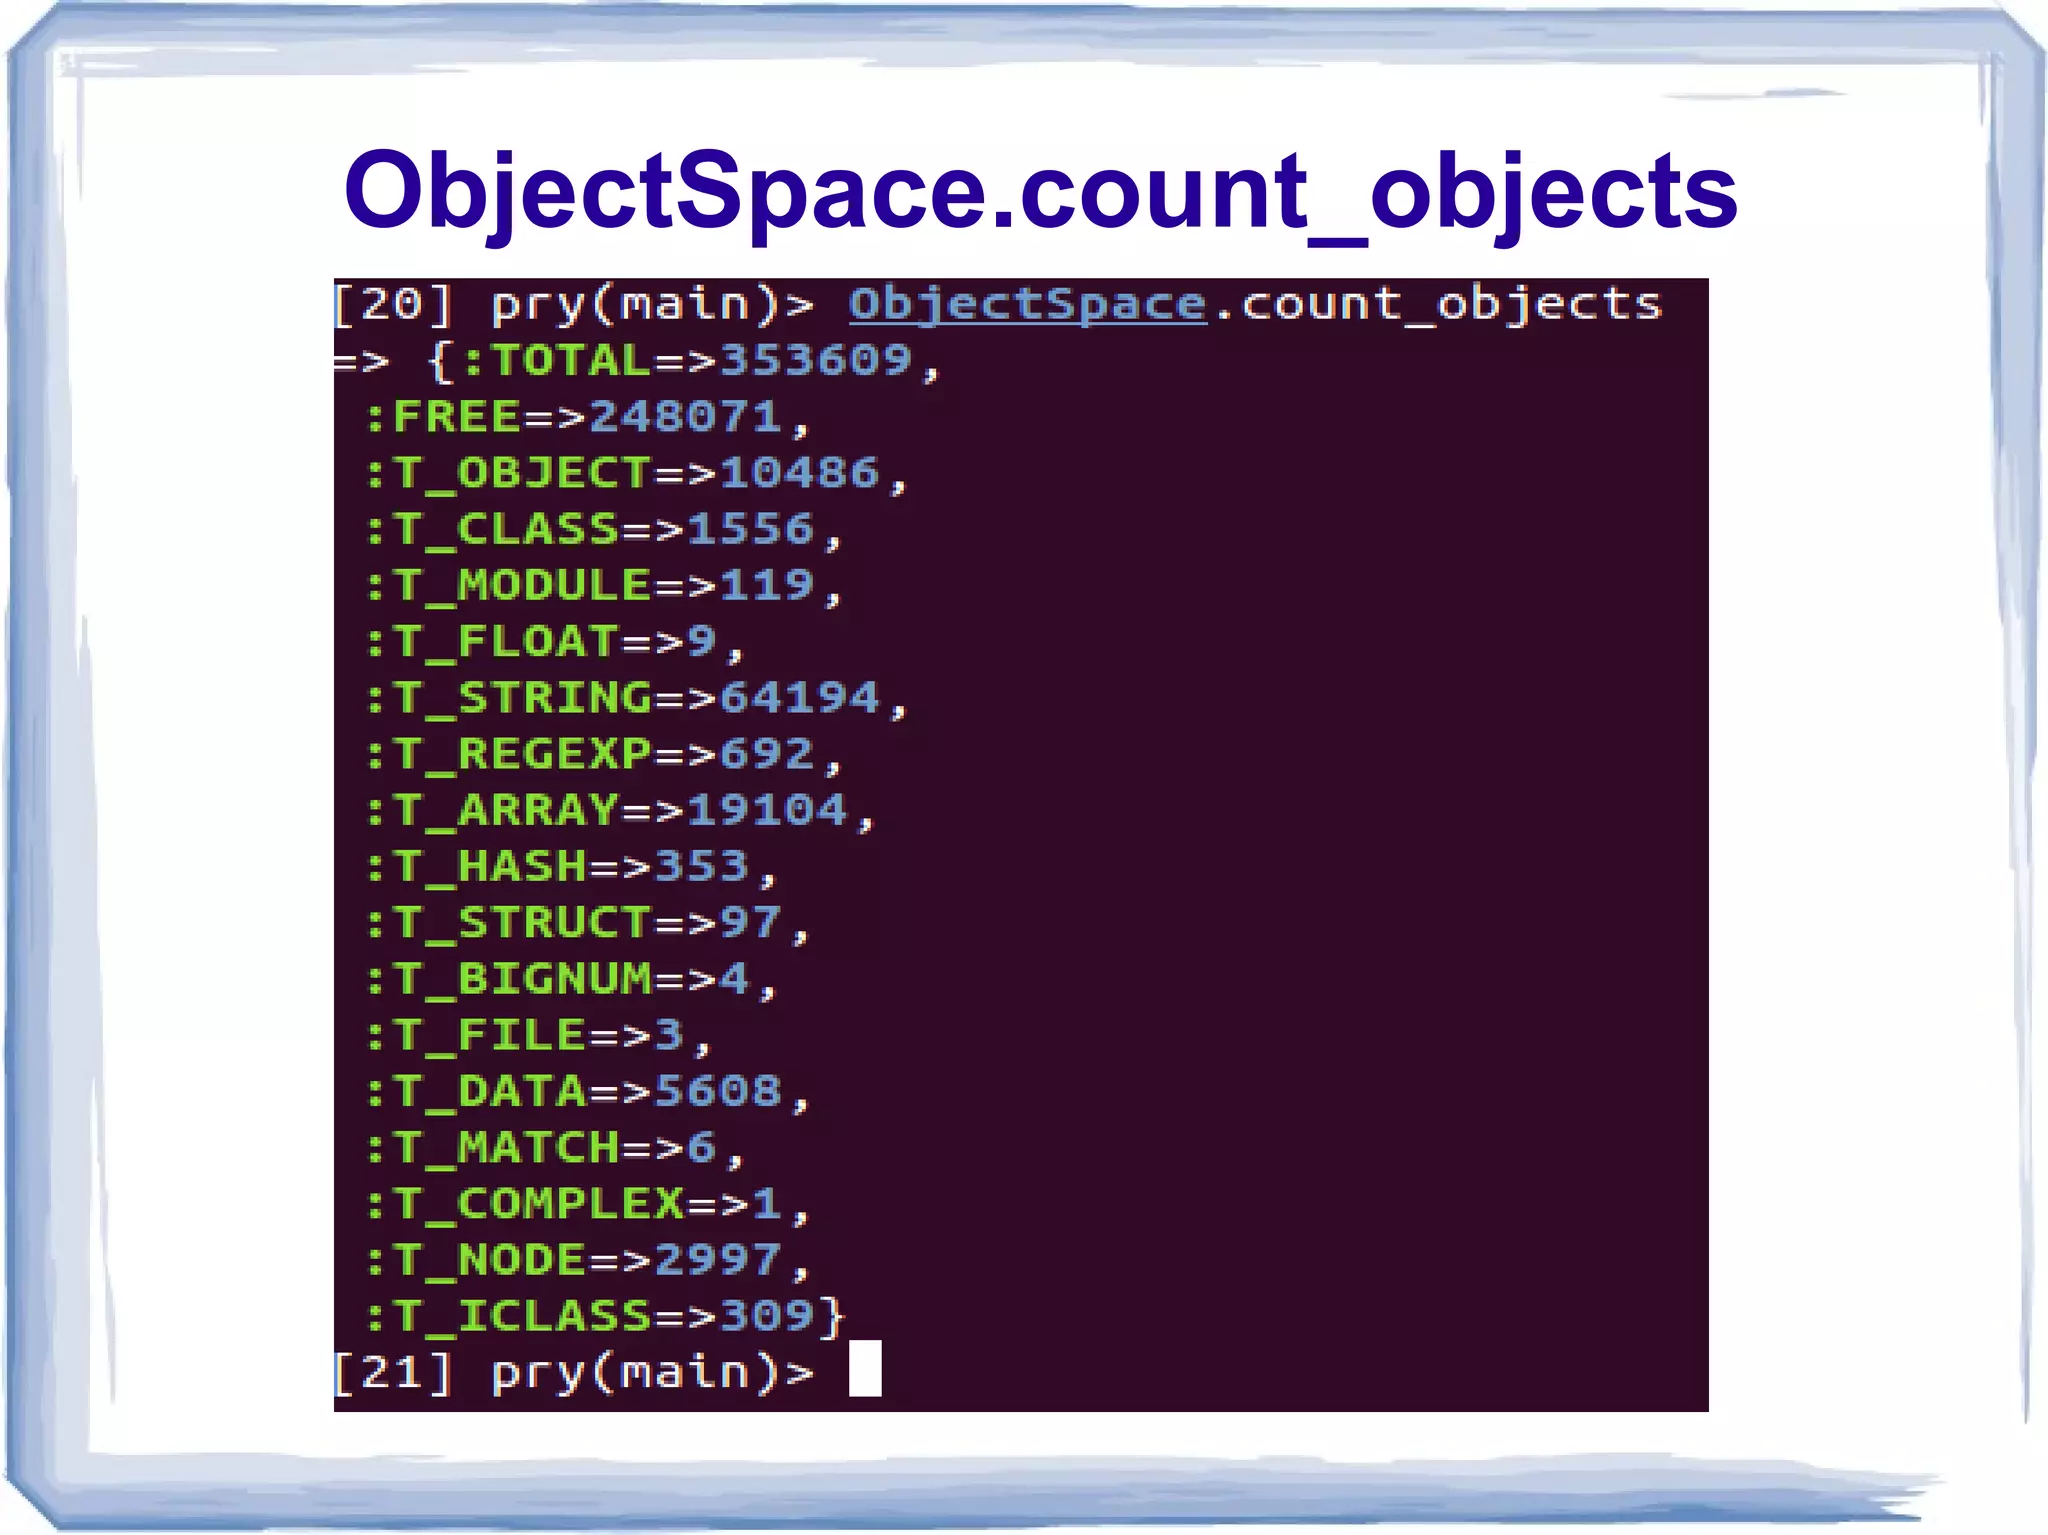
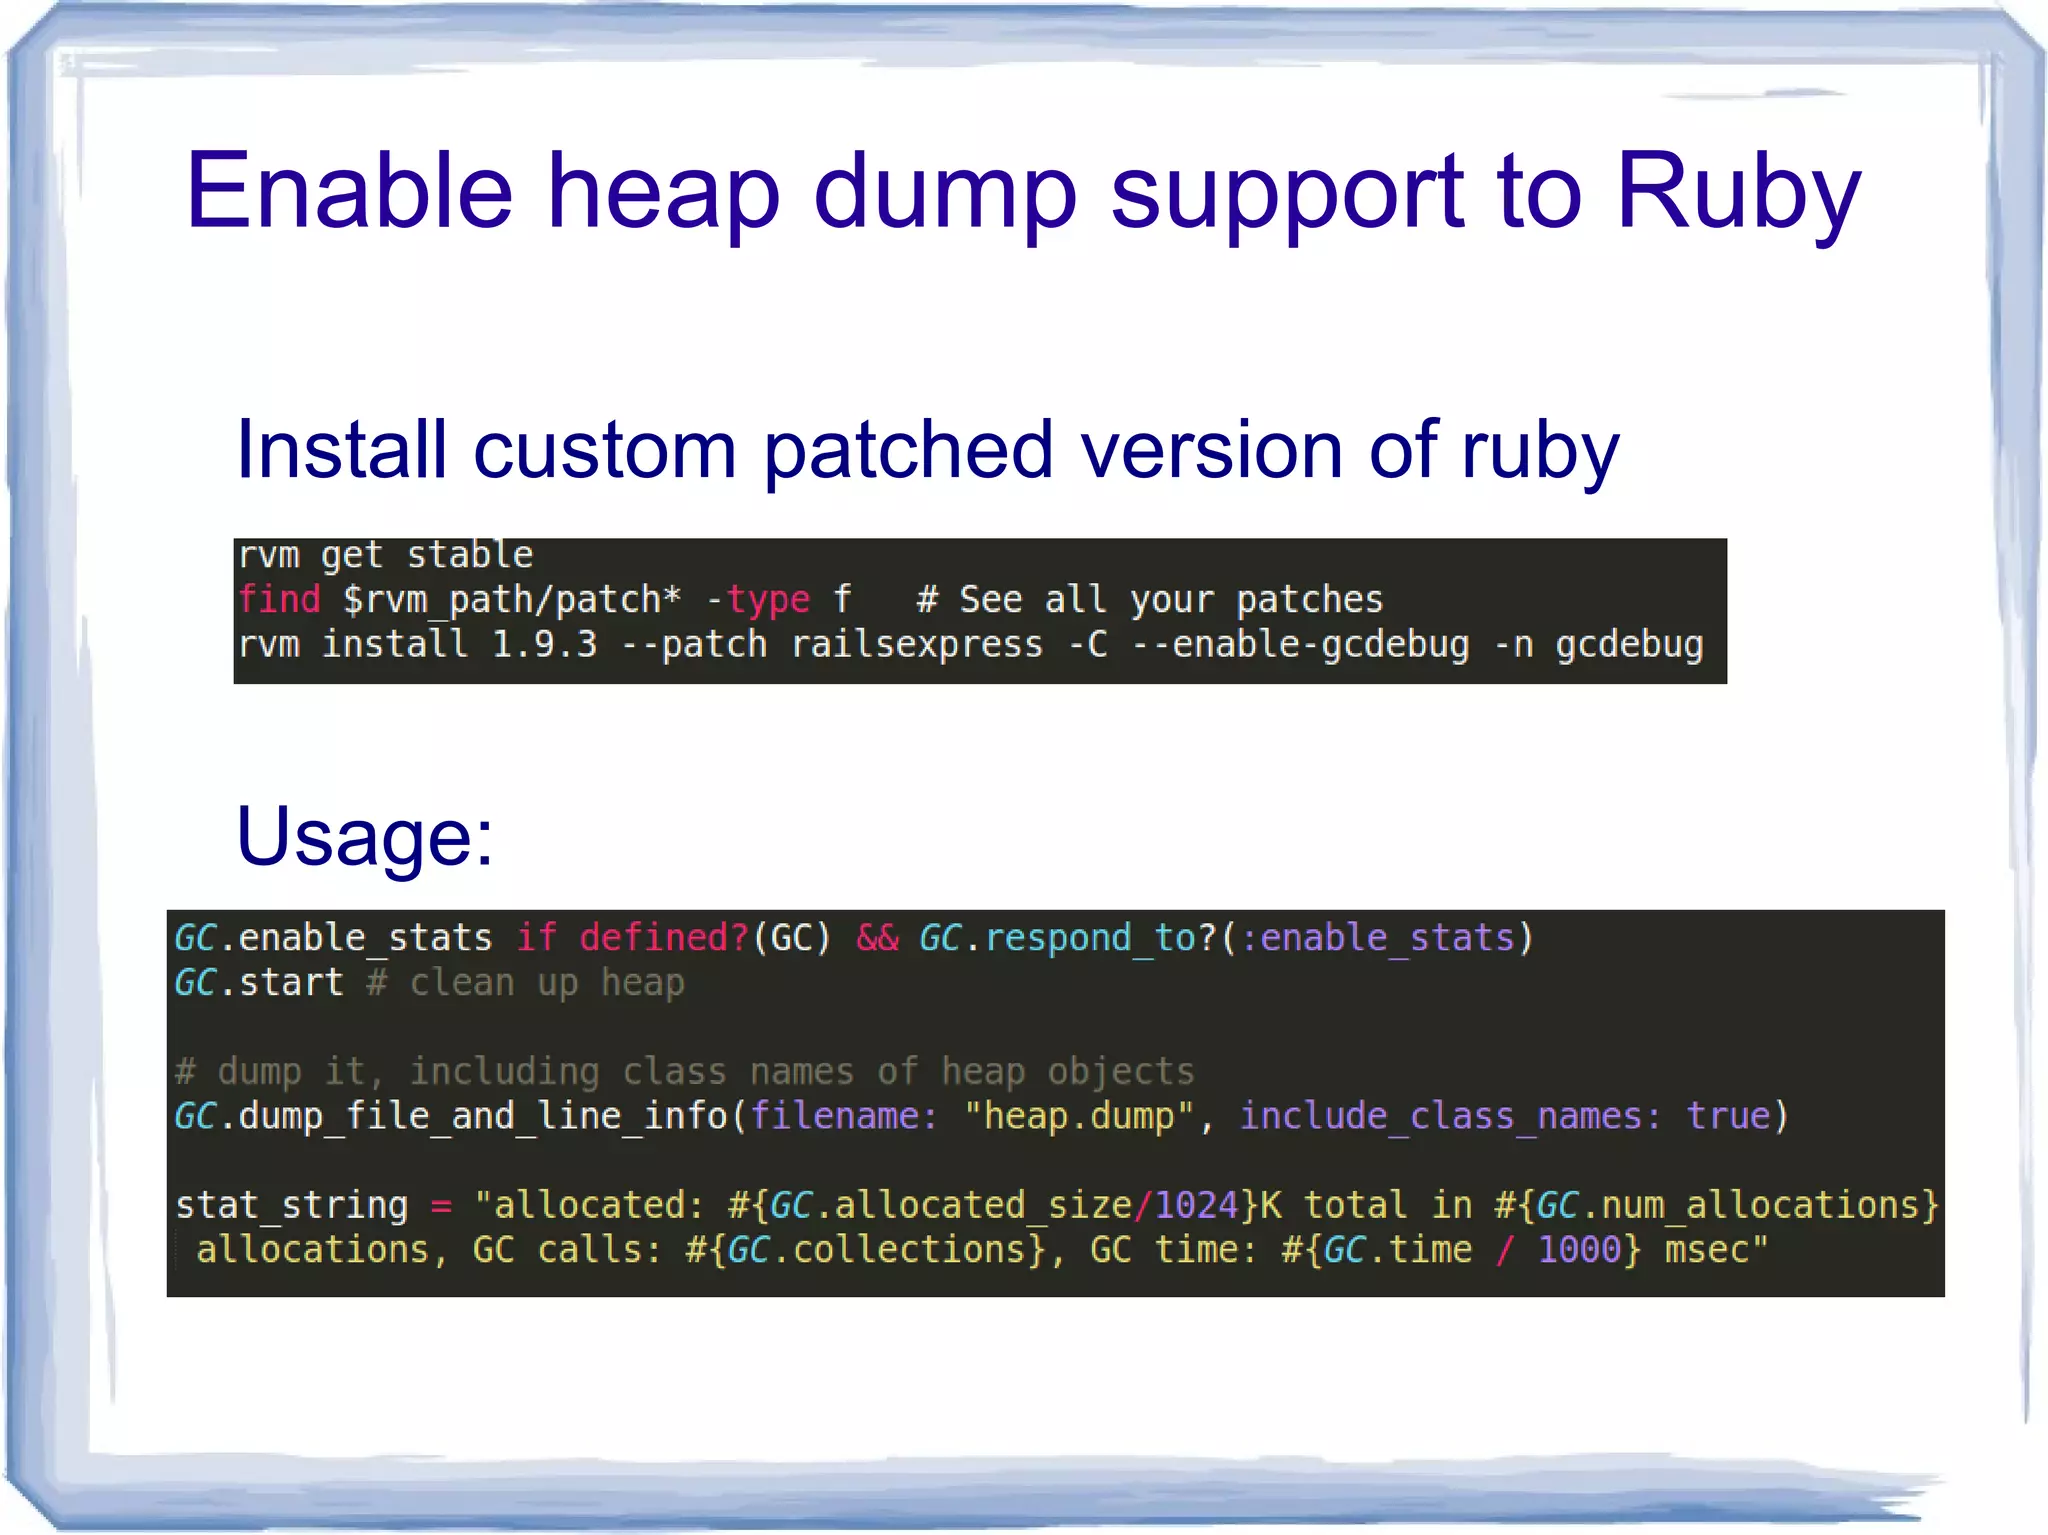
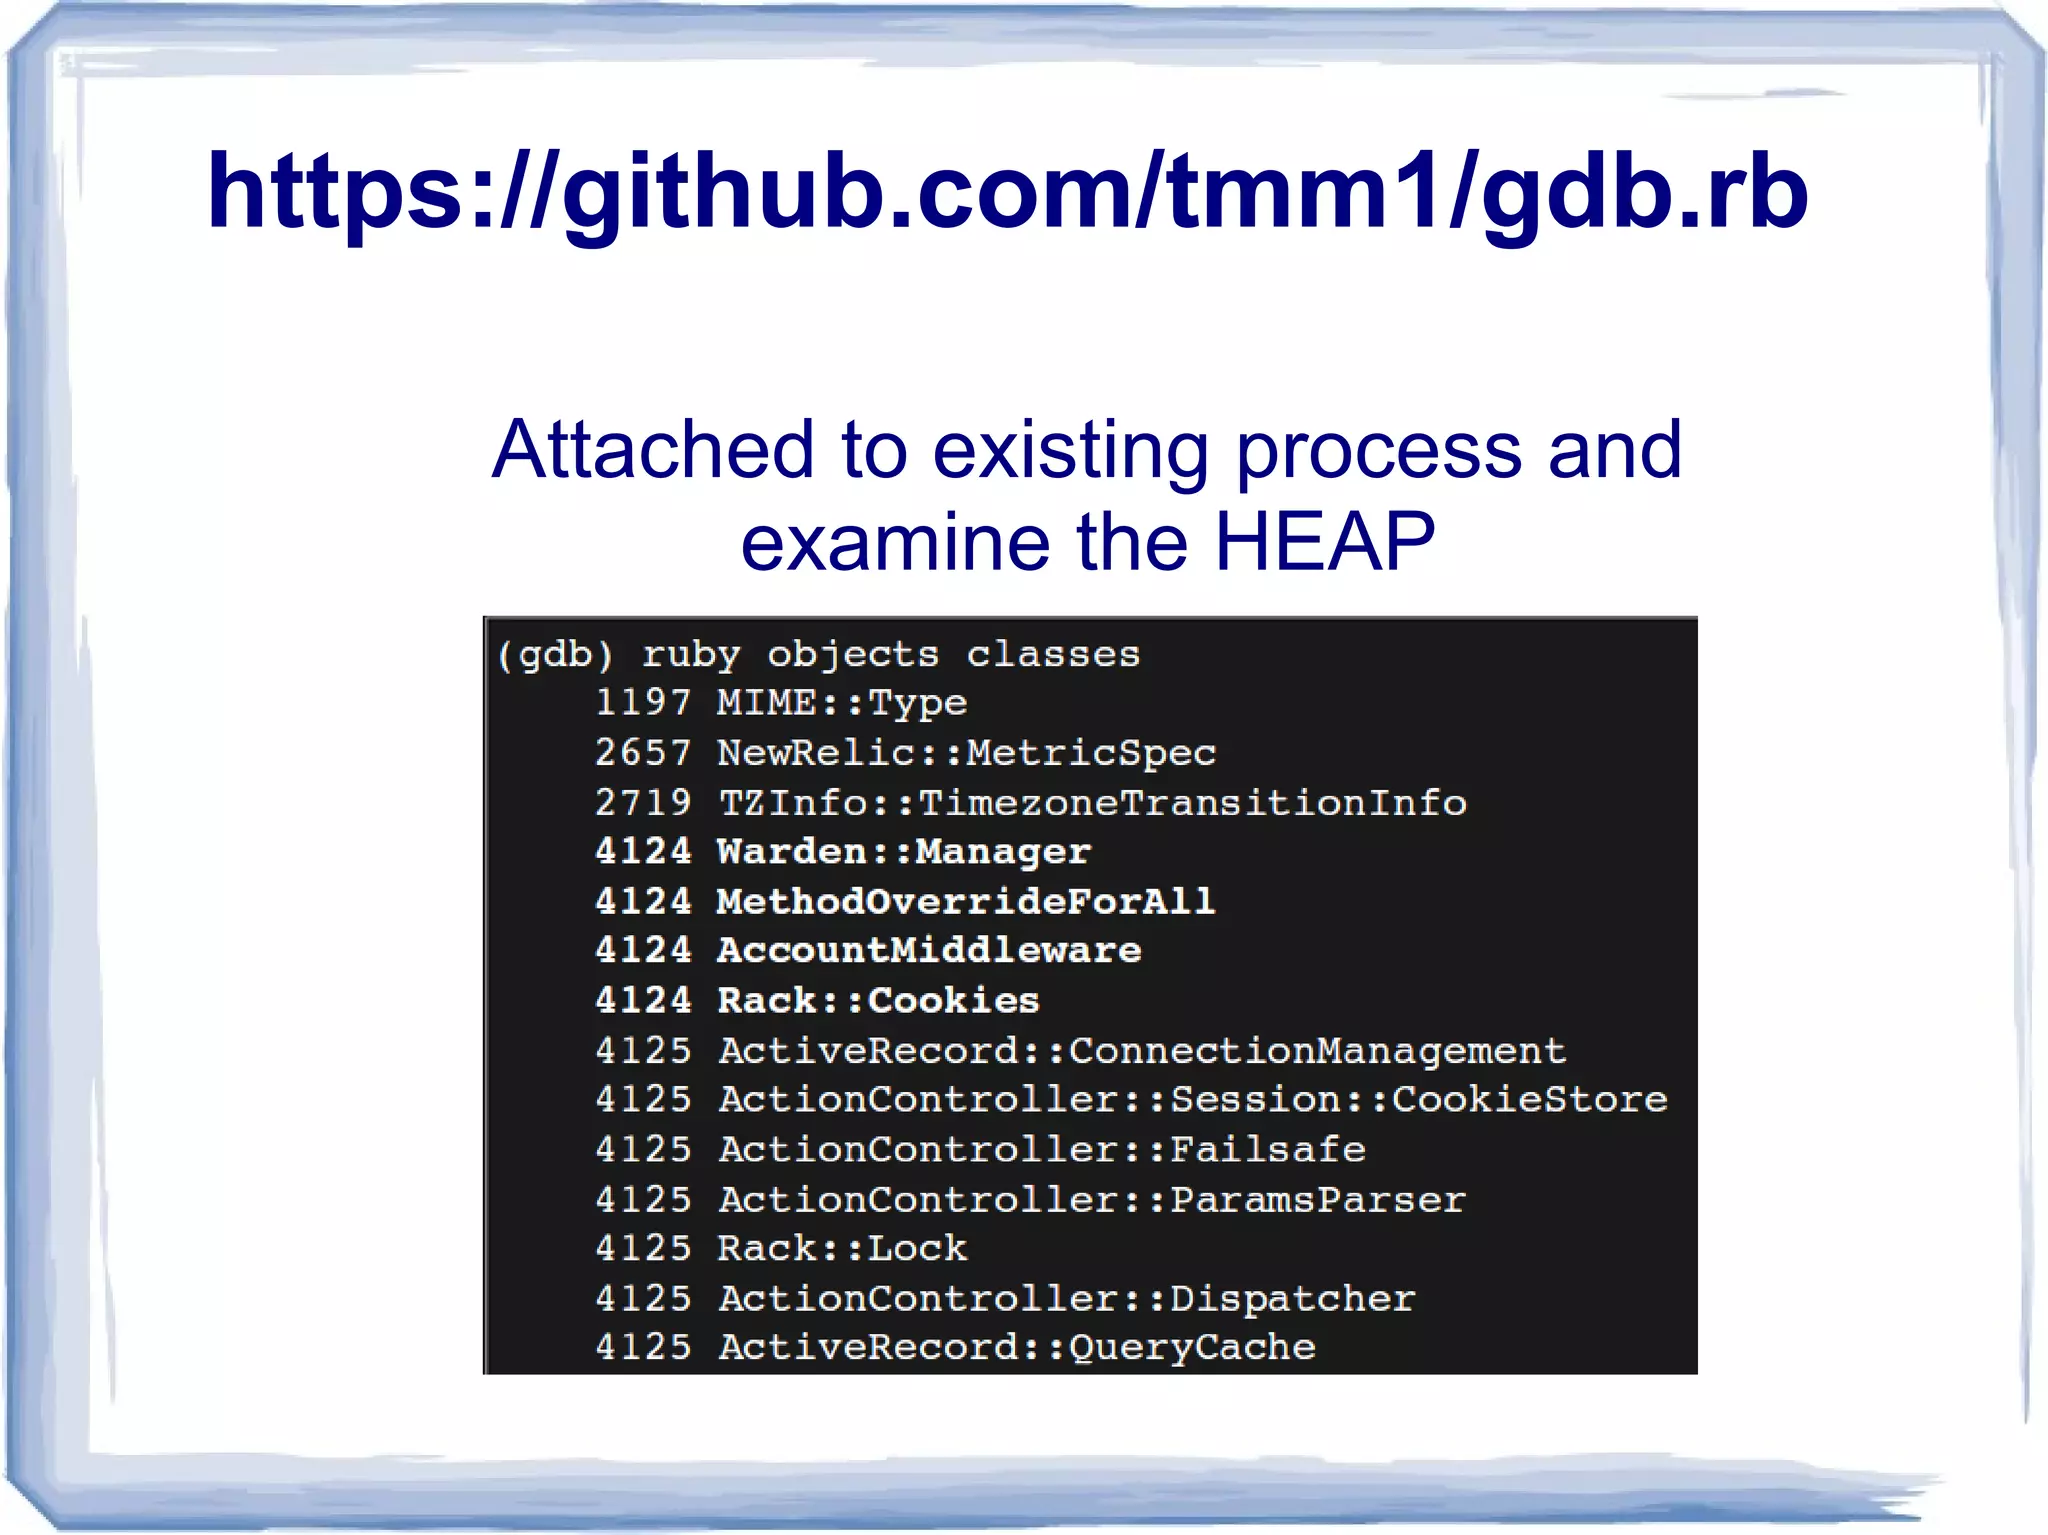
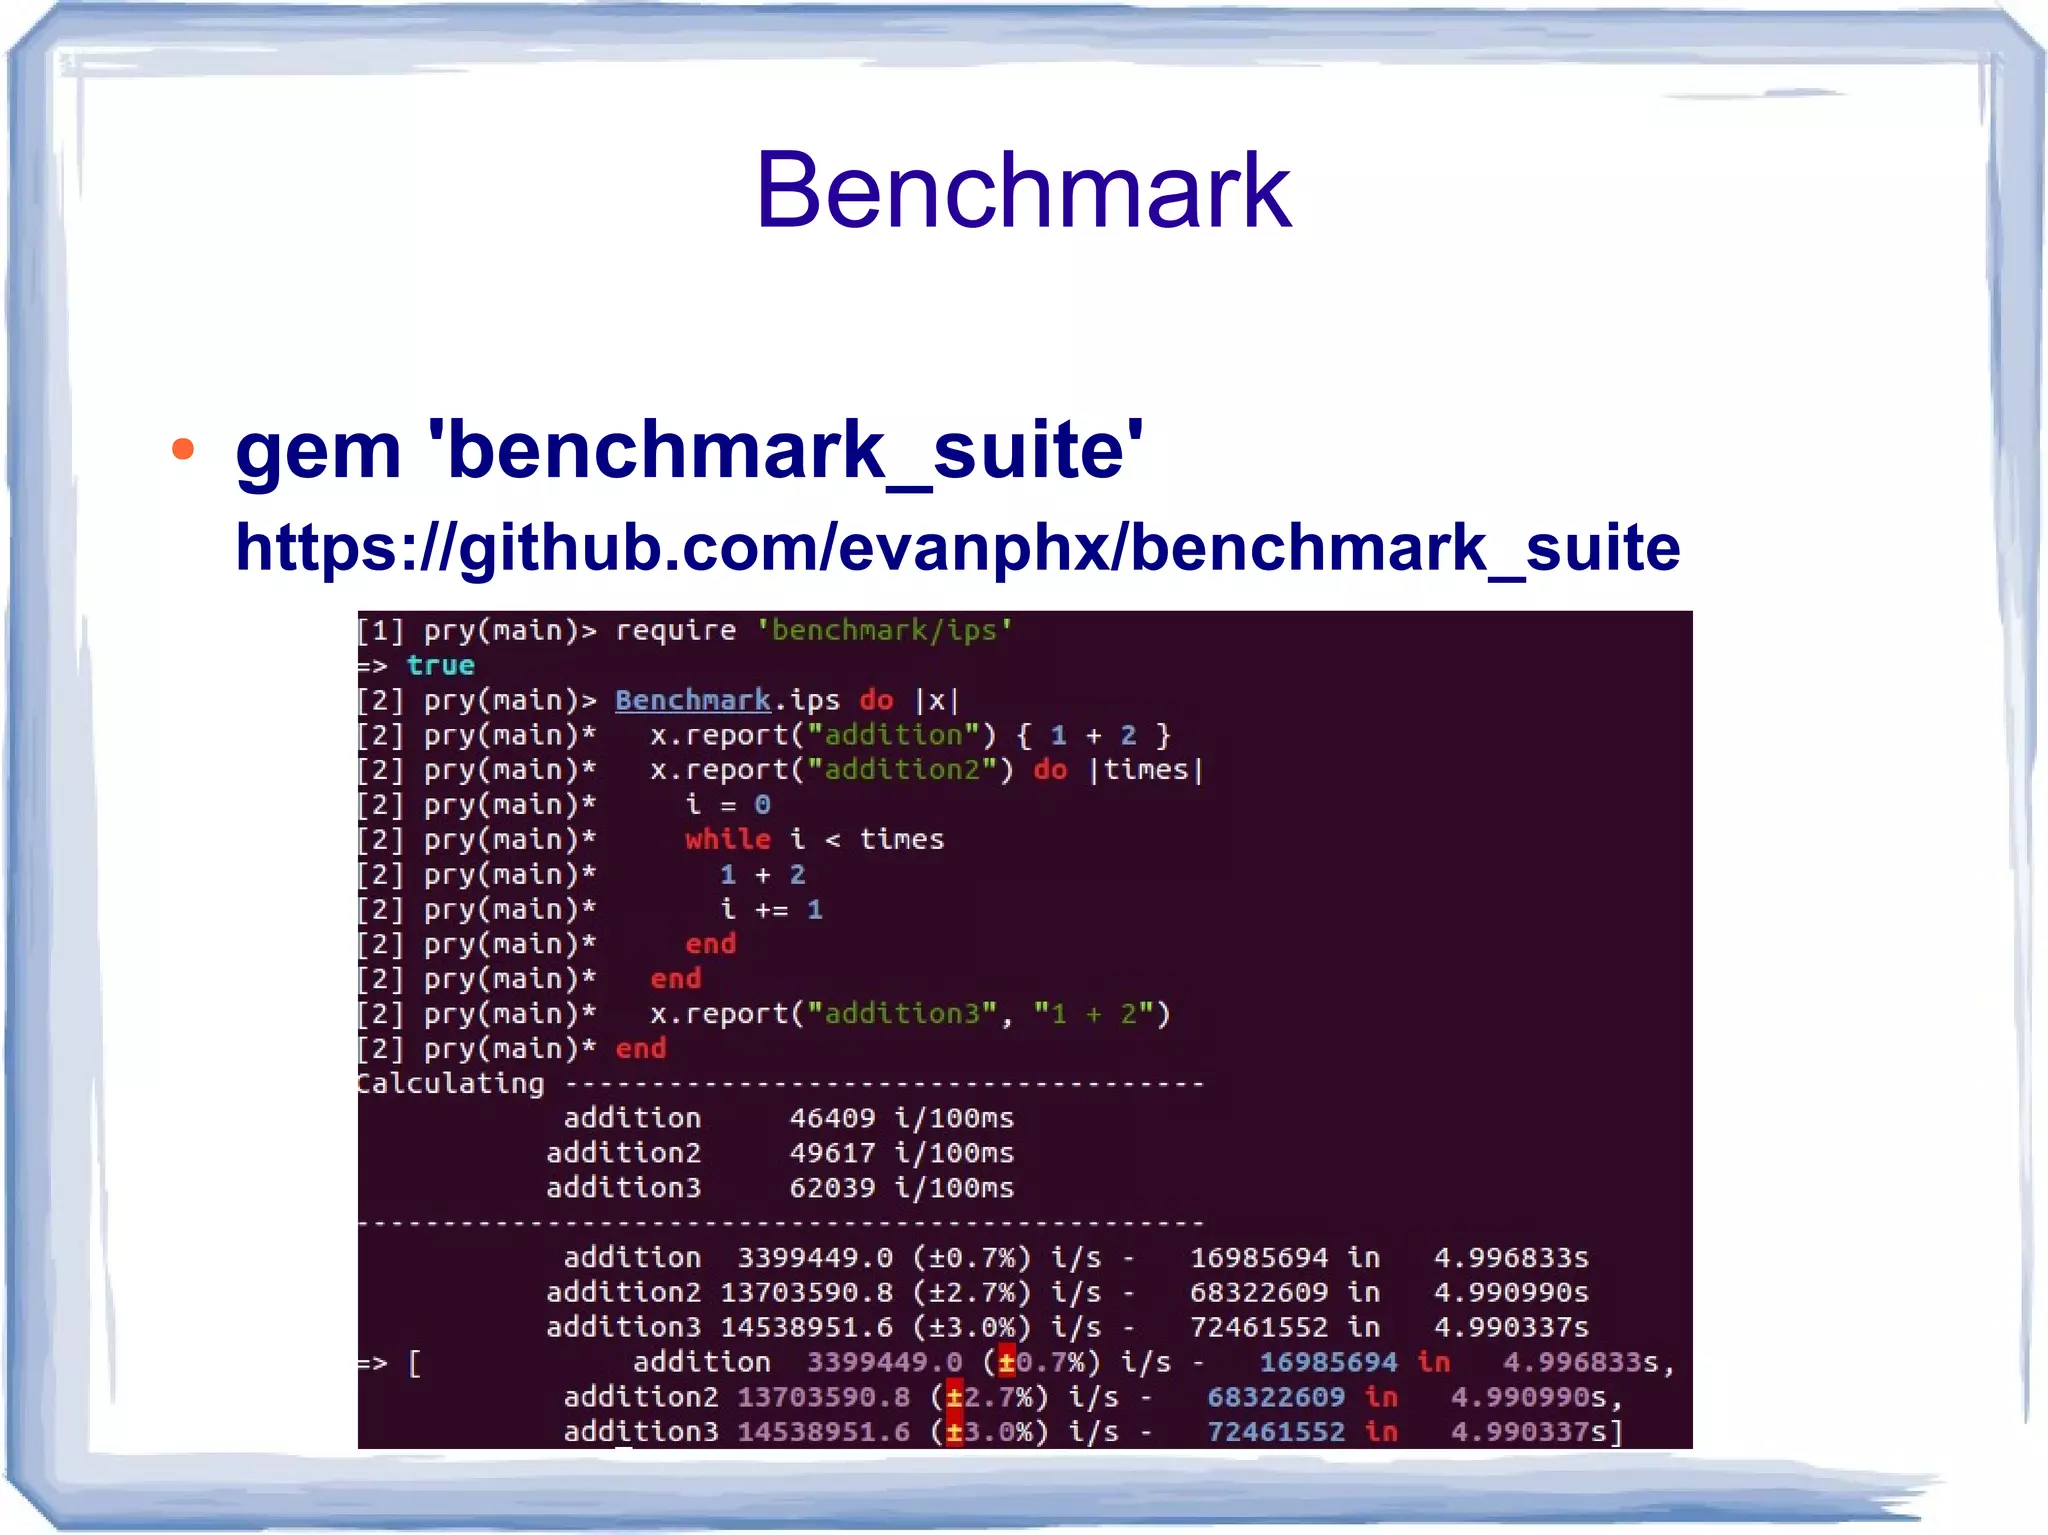
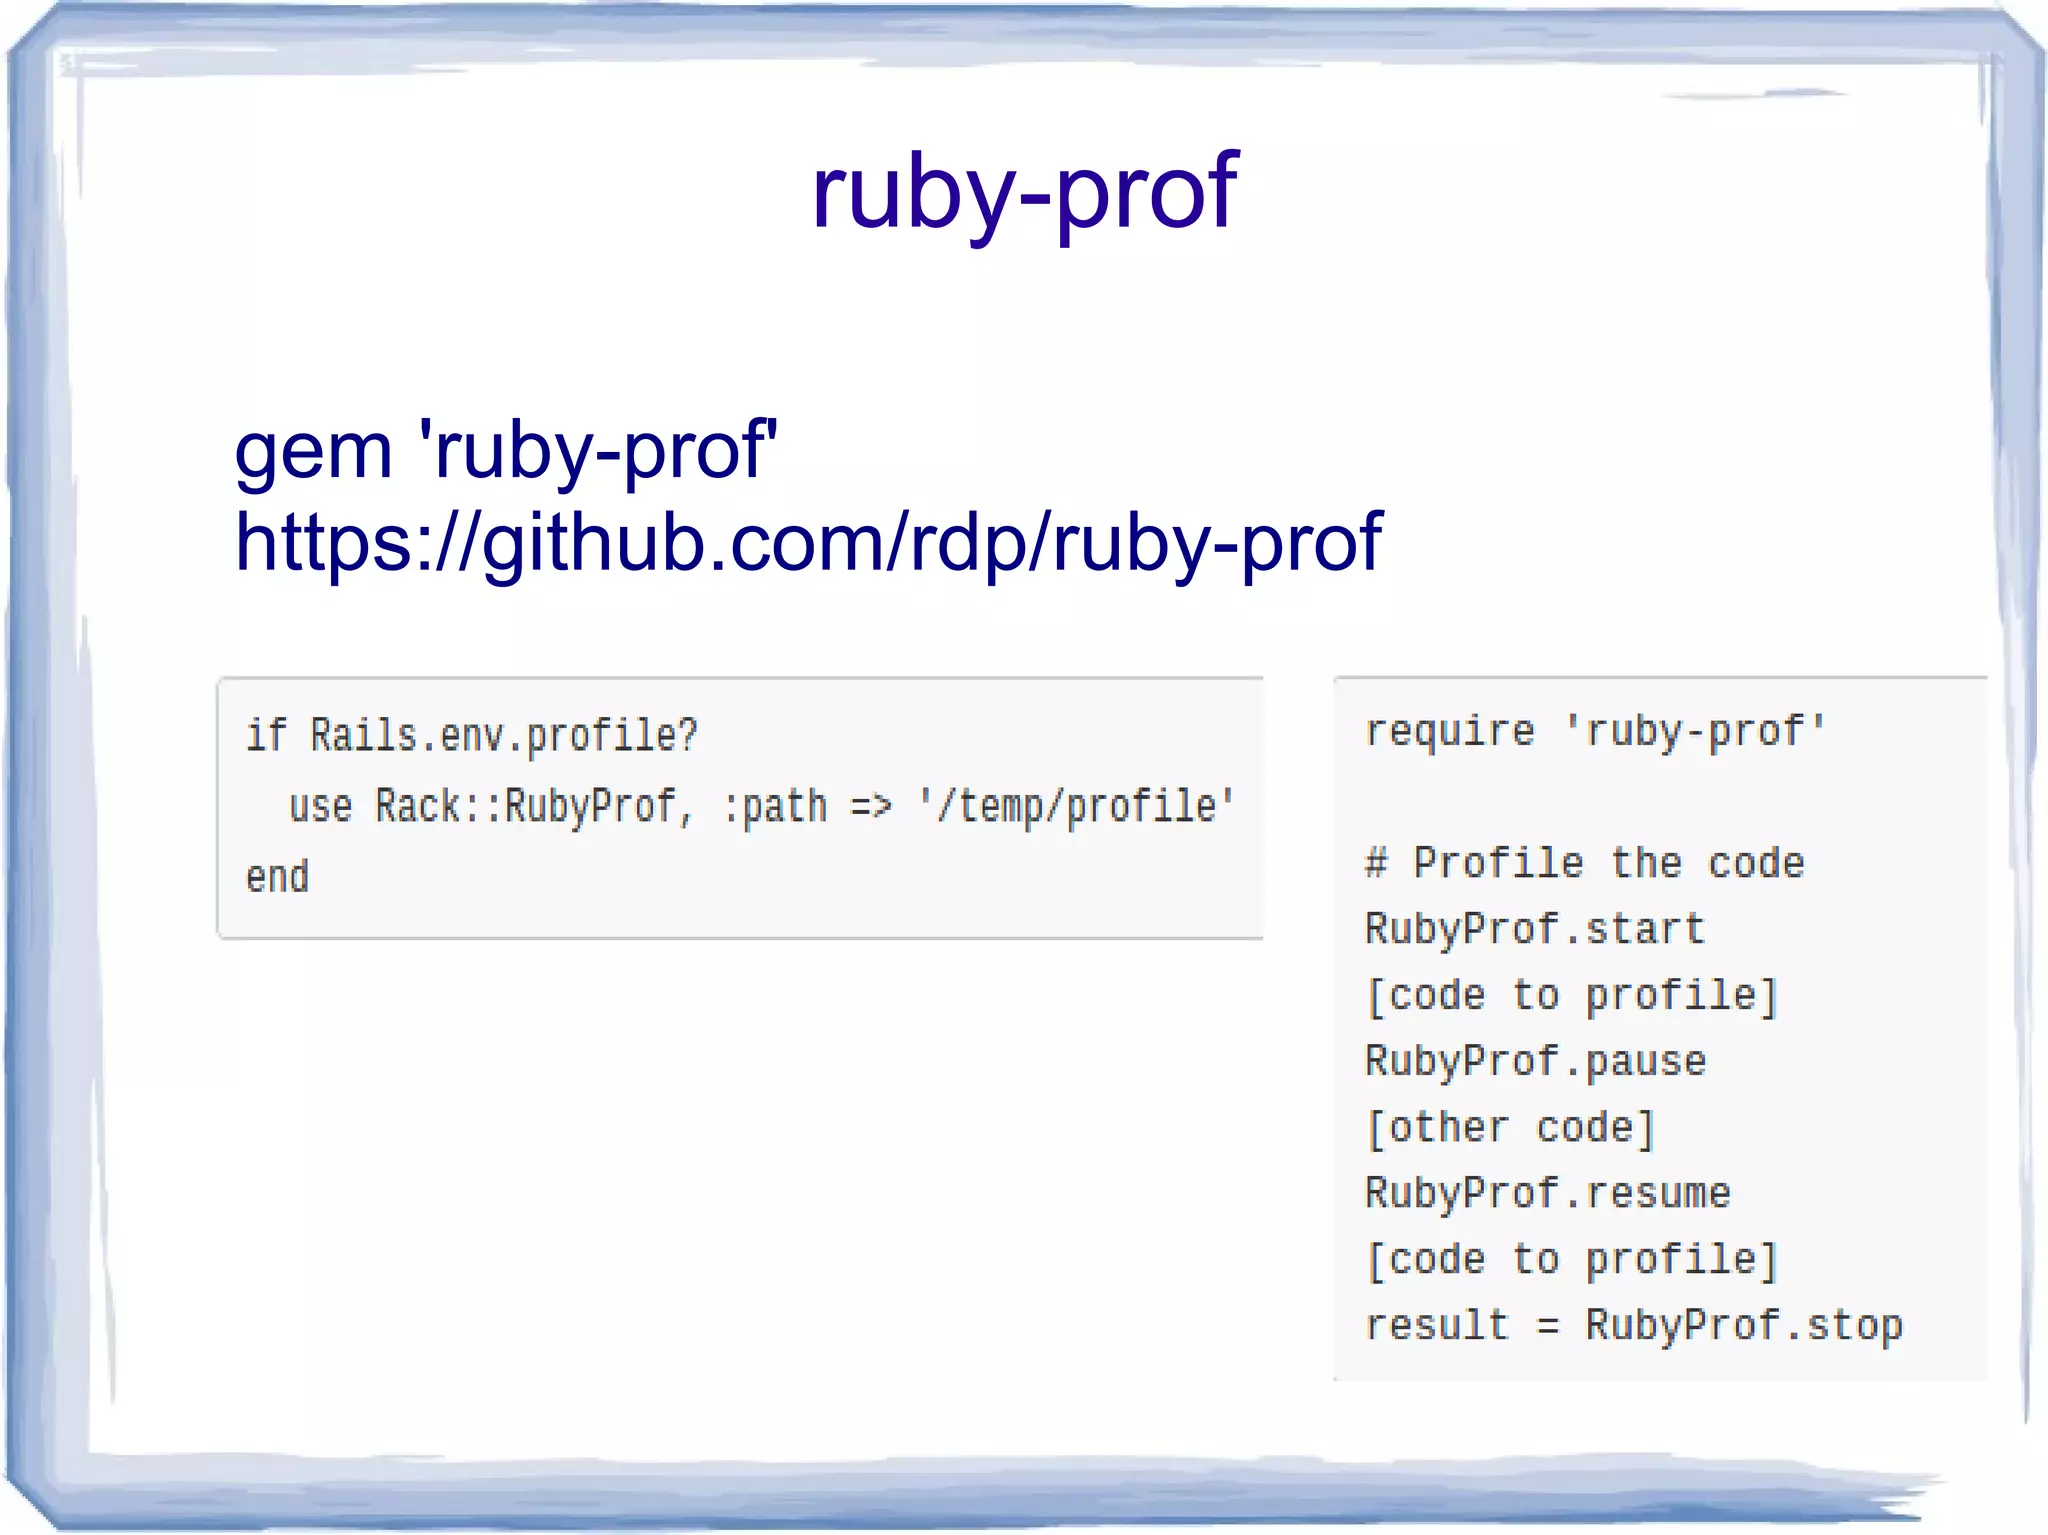
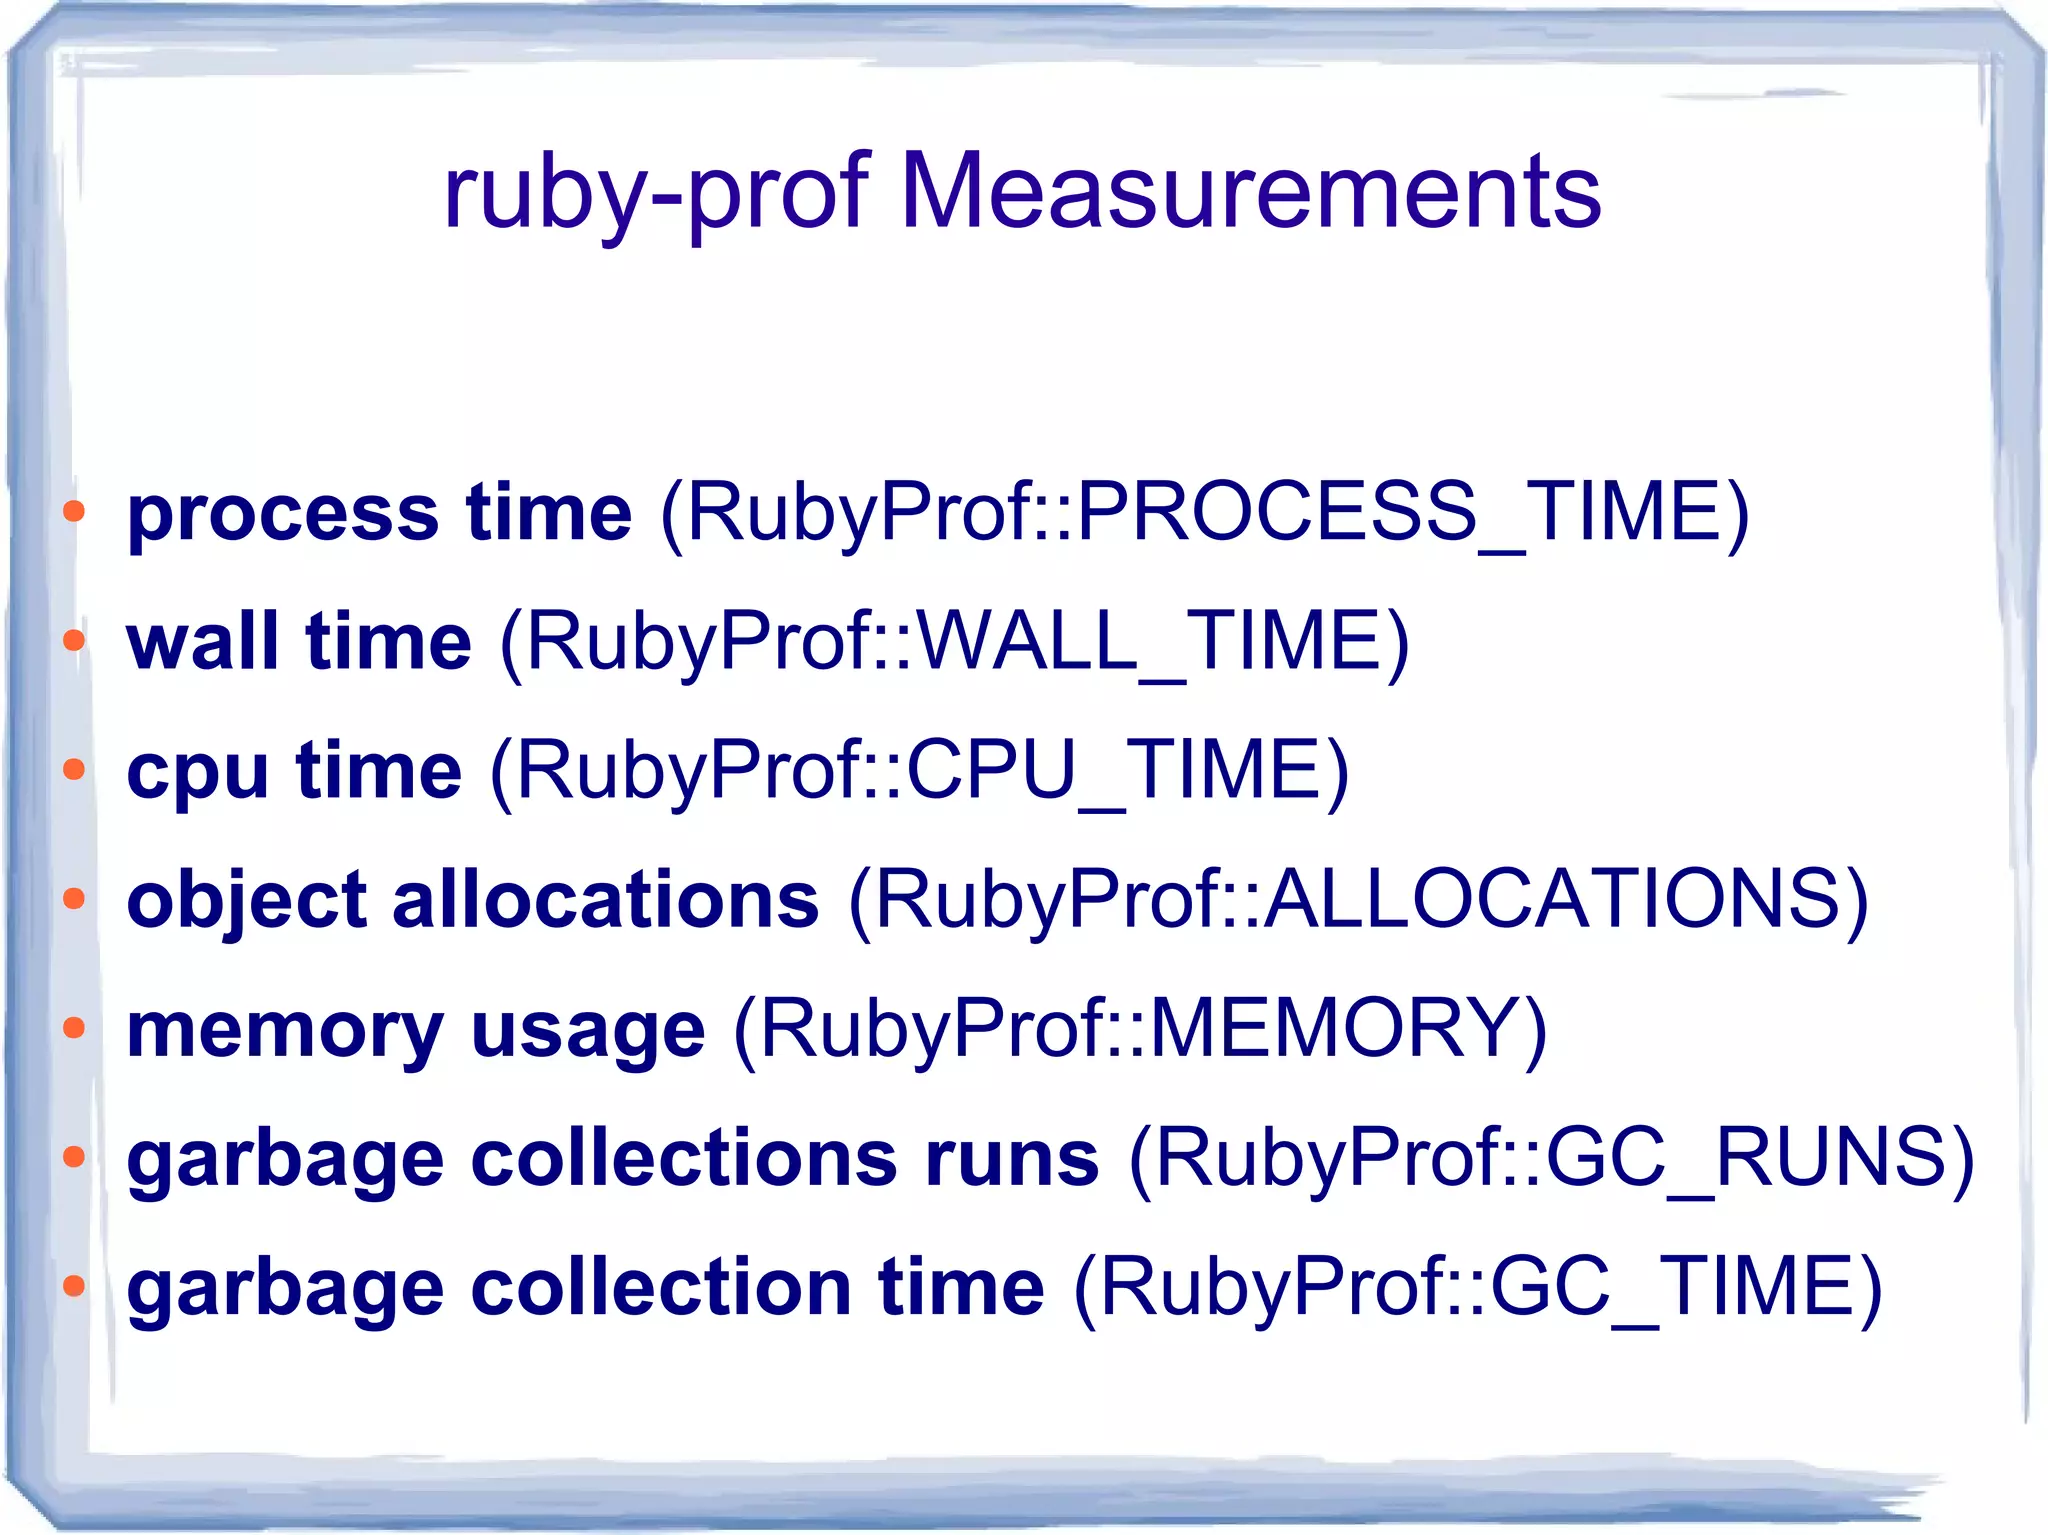
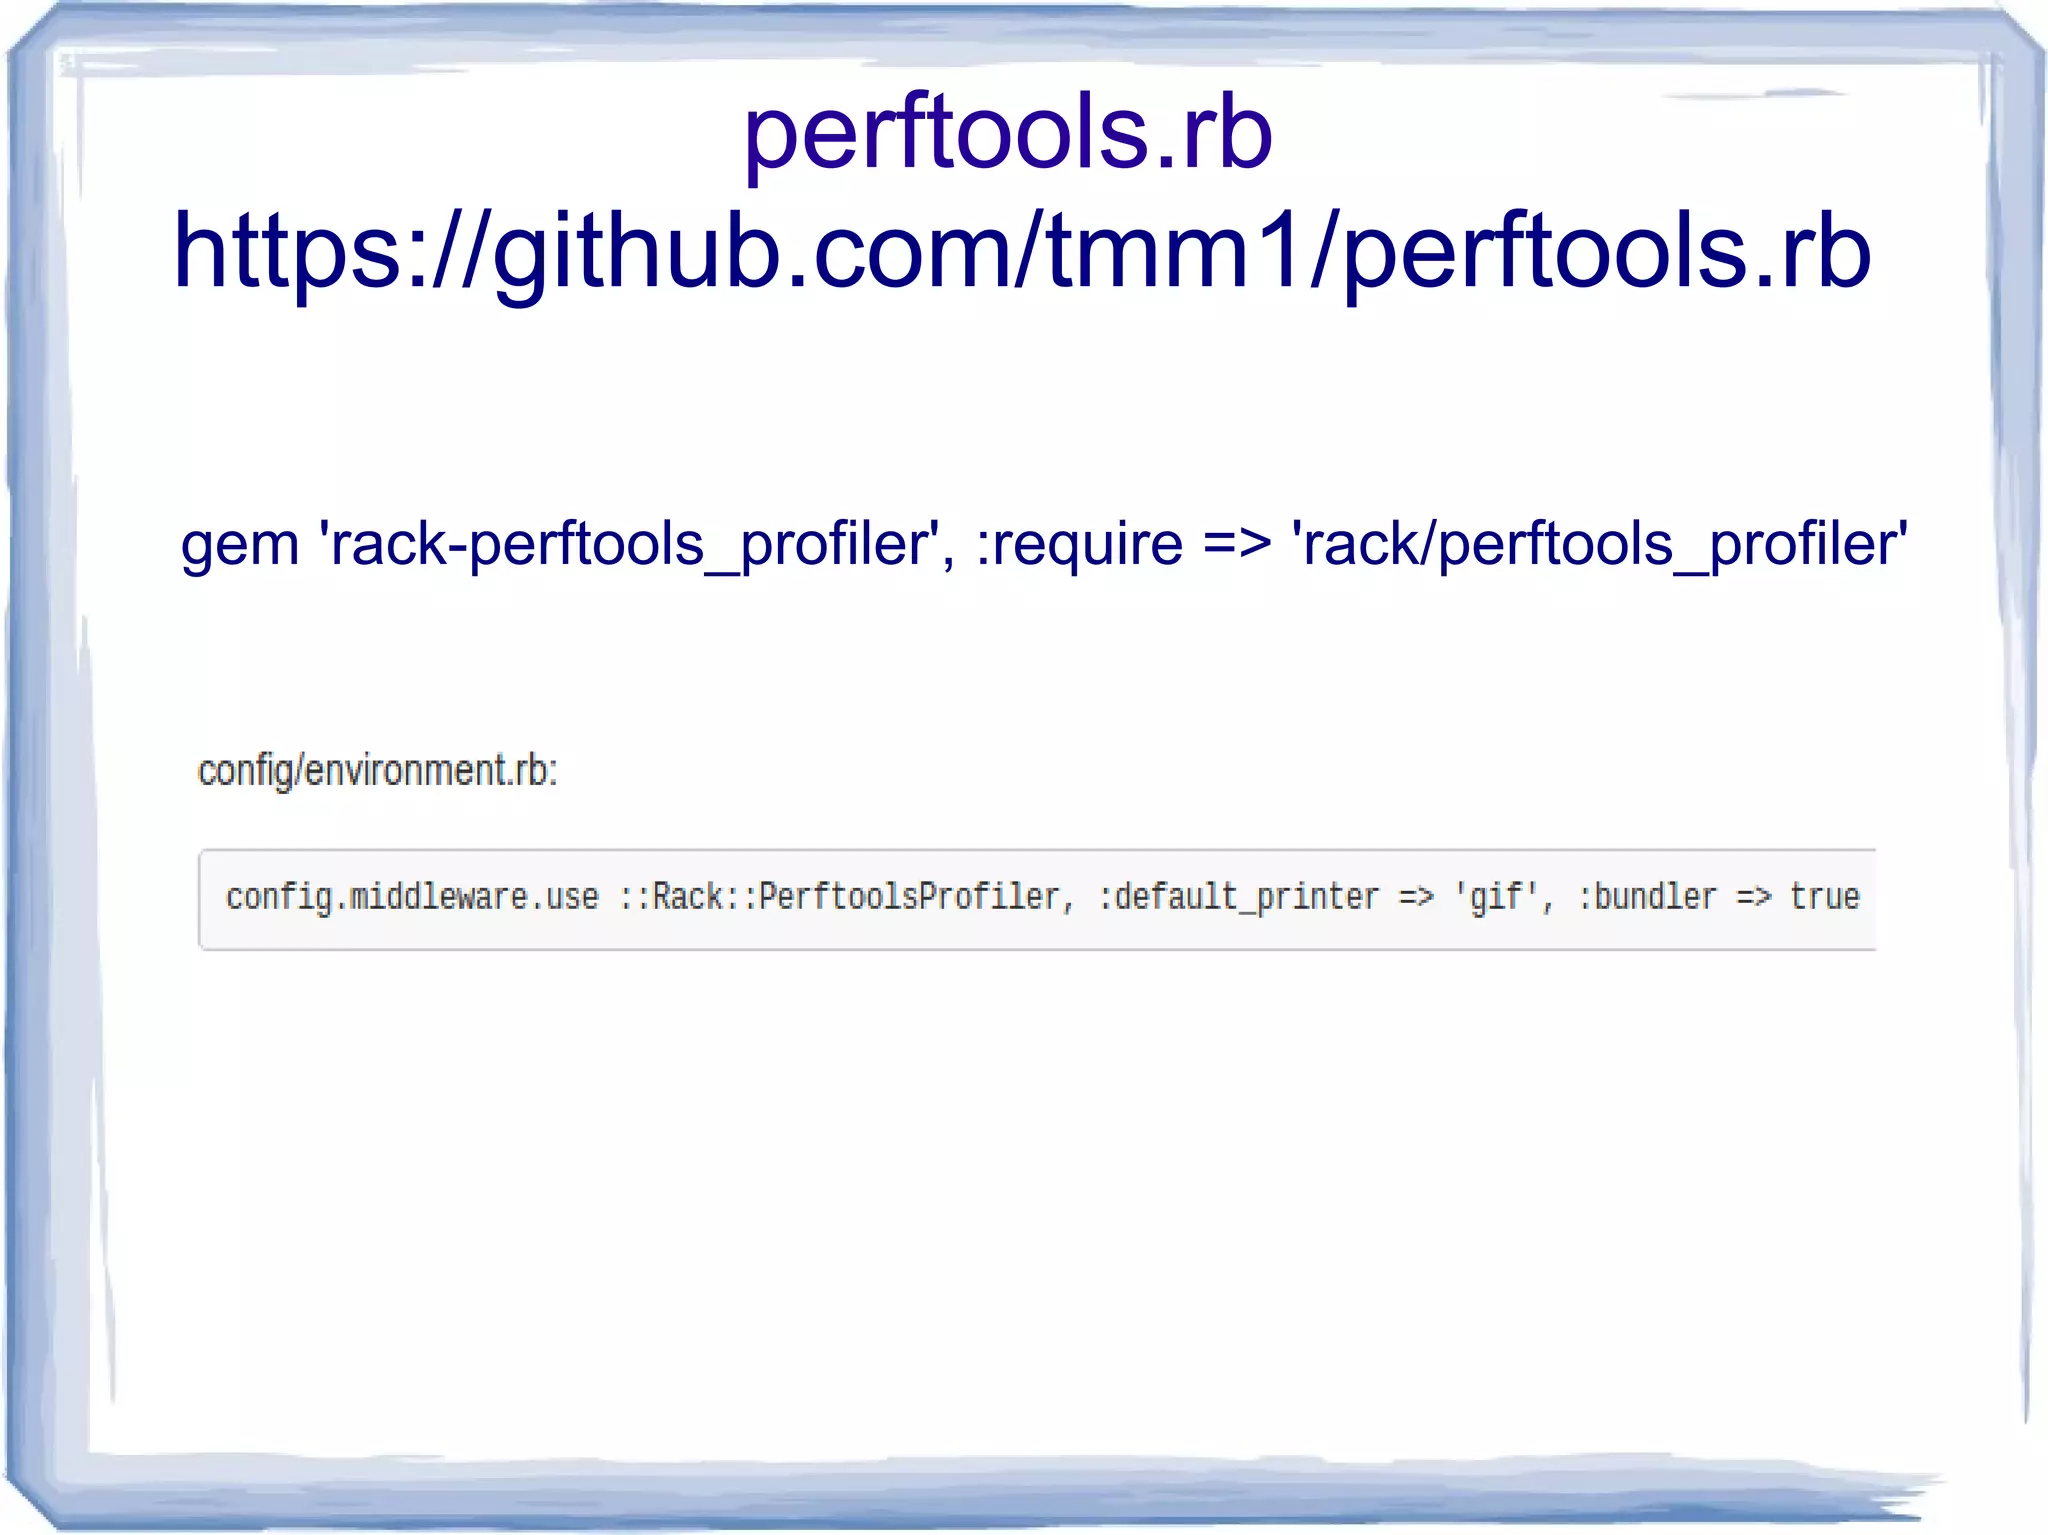
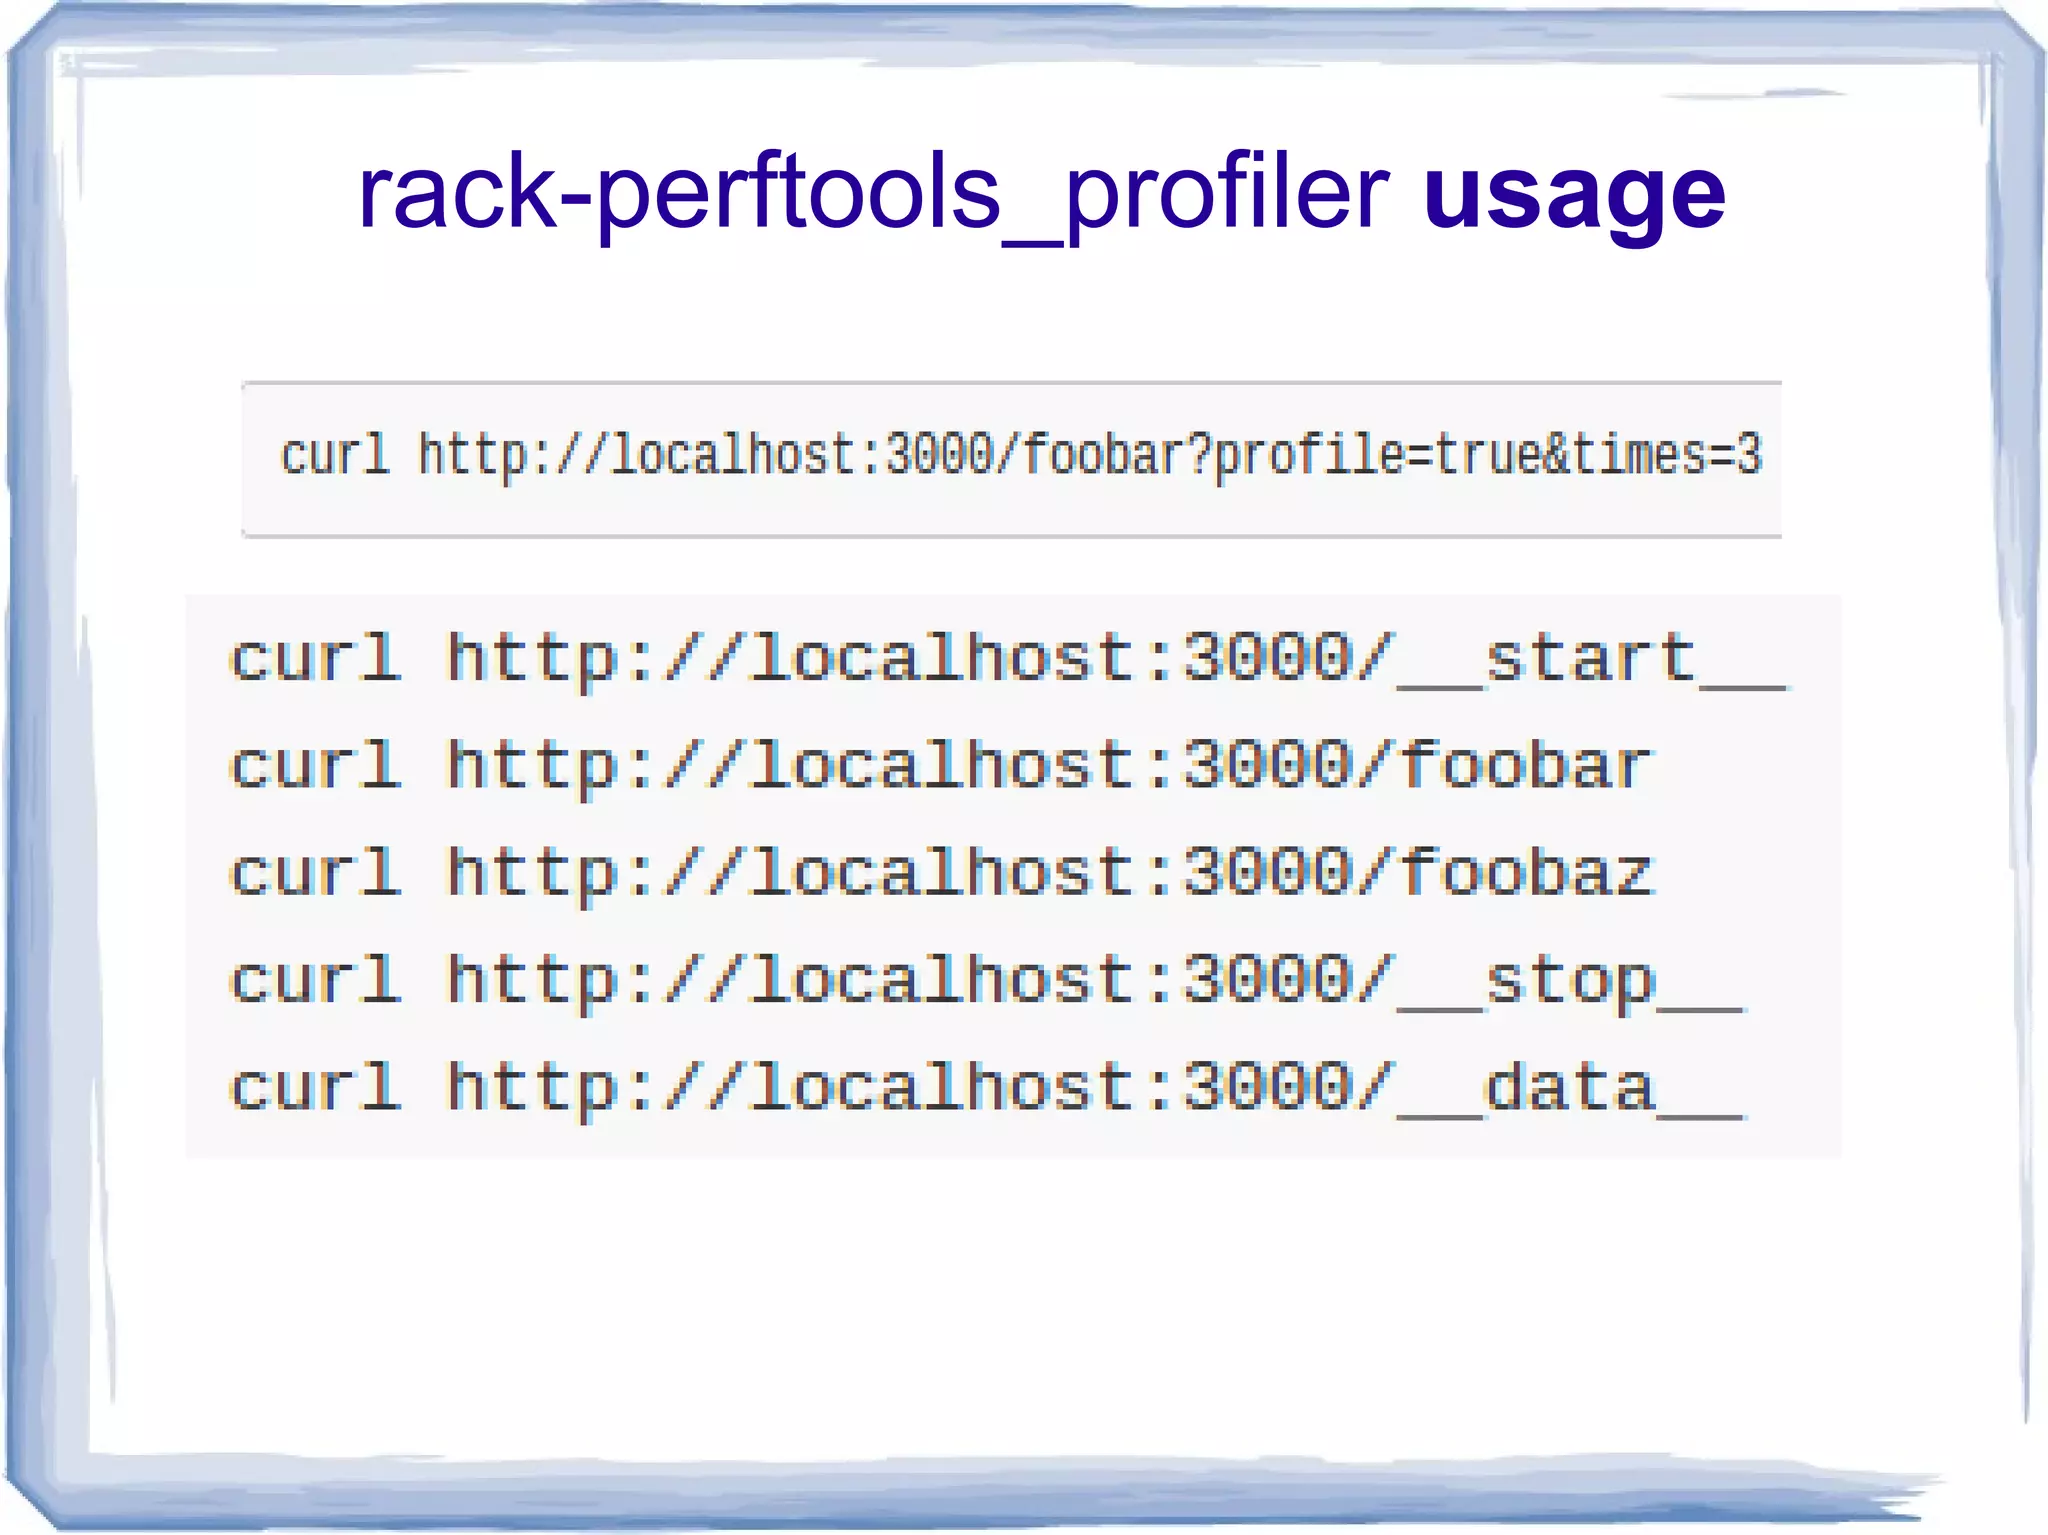


The document discusses debugging and profiling a Ruby on Rails application that is using excessive memory. It explains how the Ruby garbage collector works and that allocating too many objects can lead to longer garbage collection times and eventually running out of memory. Various tools are presented for debugging memory issues, including pry-debugger, ObjectSpace.count_objects, enabling heap dumps, and gdb.rb. Profiling tools discussed include Benchmark, ruby-prof, and perftools.rb for measuring time, allocations, memory usage, and garbage collection metrics. The key message is that allocating too many objects leads to slowdowns from longer garbage collection, so examining the heap and using debugging and profiling tools is important.