This document introduces the speaker's upcoming book, 'Clojure for Data Science,' and outlines the significance of using Clojure in data science for interactive exploration and analysis. It covers various statistical methods and data visualizations utilizing libraries like Incanter and Quil. Additionally, it incorporates practical examples of analyzing election data and concepts of correlation and regression in Python code snippets.


![LOADING UK ELECTION DATA
Using incanter's excel namespace
(ns cljds.ch1.data
(:require [incanter
[core :as i]
[excel :as xls]]
[clojure.java.io :as io]))
(defn uk-data []
(-> (io/resource "UK2010.xls")
(str)
(xls/read-xls)))
(i/view (uk-data))](https://image.slidesharecdn.com/clojurefordatascience-150903135047-lva1-app6891/75/Clojure-for-Data-Science-9-2048.jpg)
![COLUMN NAMES
(defn ex-1-1 []
(i/col-names (uk-data)))
;; => ["Press Association Reference" "Constituency Name" "Region" "Elect
ion Year" "Electorate" "Votes" "AC" "AD" "AGS" "APNI" "APP" "AWL" "AWP"
"BB" "BCP" "Bean" "Best" "BGPV" "BIB" "BIC" "Blue" "BNP" "BP Elvis" "C28
" "Cam Soc" "CG" "Ch M" "Ch P" "CIP" "CITY" "CNPG" "Comm" "Comm L" "Con"
"Cor D" "CPA" "CSP" "CTDP" "CURE" "D Lab" "D Nat" "DDP" "DUP" "ED" "EIP
" "EPA" "FAWG" "FDP" "FFR" "Grn" "GSOT" "Hum" "ICHC" "IEAC" "IFED" "ILEU
" "Impact" "Ind1" "Ind2" "Ind3" "Ind4" "Ind5" "IPT" "ISGB" "ISQM" "IUK"
"IVH" "IZB" "JAC" "Joy" "JP" "Lab" "Land" "LD" "Lib" "Libert" "LIND" "LL
PB" "LTT" "MACI" "MCP" "MEDI" "MEP" "MIF" "MK" "MPEA" "MRLP" "MRP" "Nat
Lib" "NCDV" "ND" "New" "NF" "NFP" "NICF" "Nobody" "NSPS" "PBP" "PC" "Pir
ate" "PNDP" "Poet" "PPBF" "PPE" "PPNV" "Reform" "Respect" "Rest" "RRG" "
RTBP" "SACL" "Sci" "SDLP" "SEP" "SF" "SIG" "SJP" "SKGP" "SMA" "SMRA" "SN
P" "Soc" "Soc Alt" "Soc Dem" "Soc Lab" "South" "Speaker" "SSP" "TF" "TOC
" "Trust" "TUSC" "TUV" "UCUNF" "UKIP" "UPS" "UV" "VCCA" "Vote" "Wessex R
eg" "WRP" "You" "Youth" "YRDPL"]](https://image.slidesharecdn.com/clojurefordatascience-150903135047-lva1-app6891/75/Clojure-for-Data-Science-11-2048.jpg)
![ELECTORATE
(defn uk-electorate []
(->> (uk-data)
(i/$ "Electorate")
(remove nil?))](https://image.slidesharecdn.com/clojurefordatascience-150903135047-lva1-app6891/75/Clojure-for-Data-Science-12-2048.jpg)
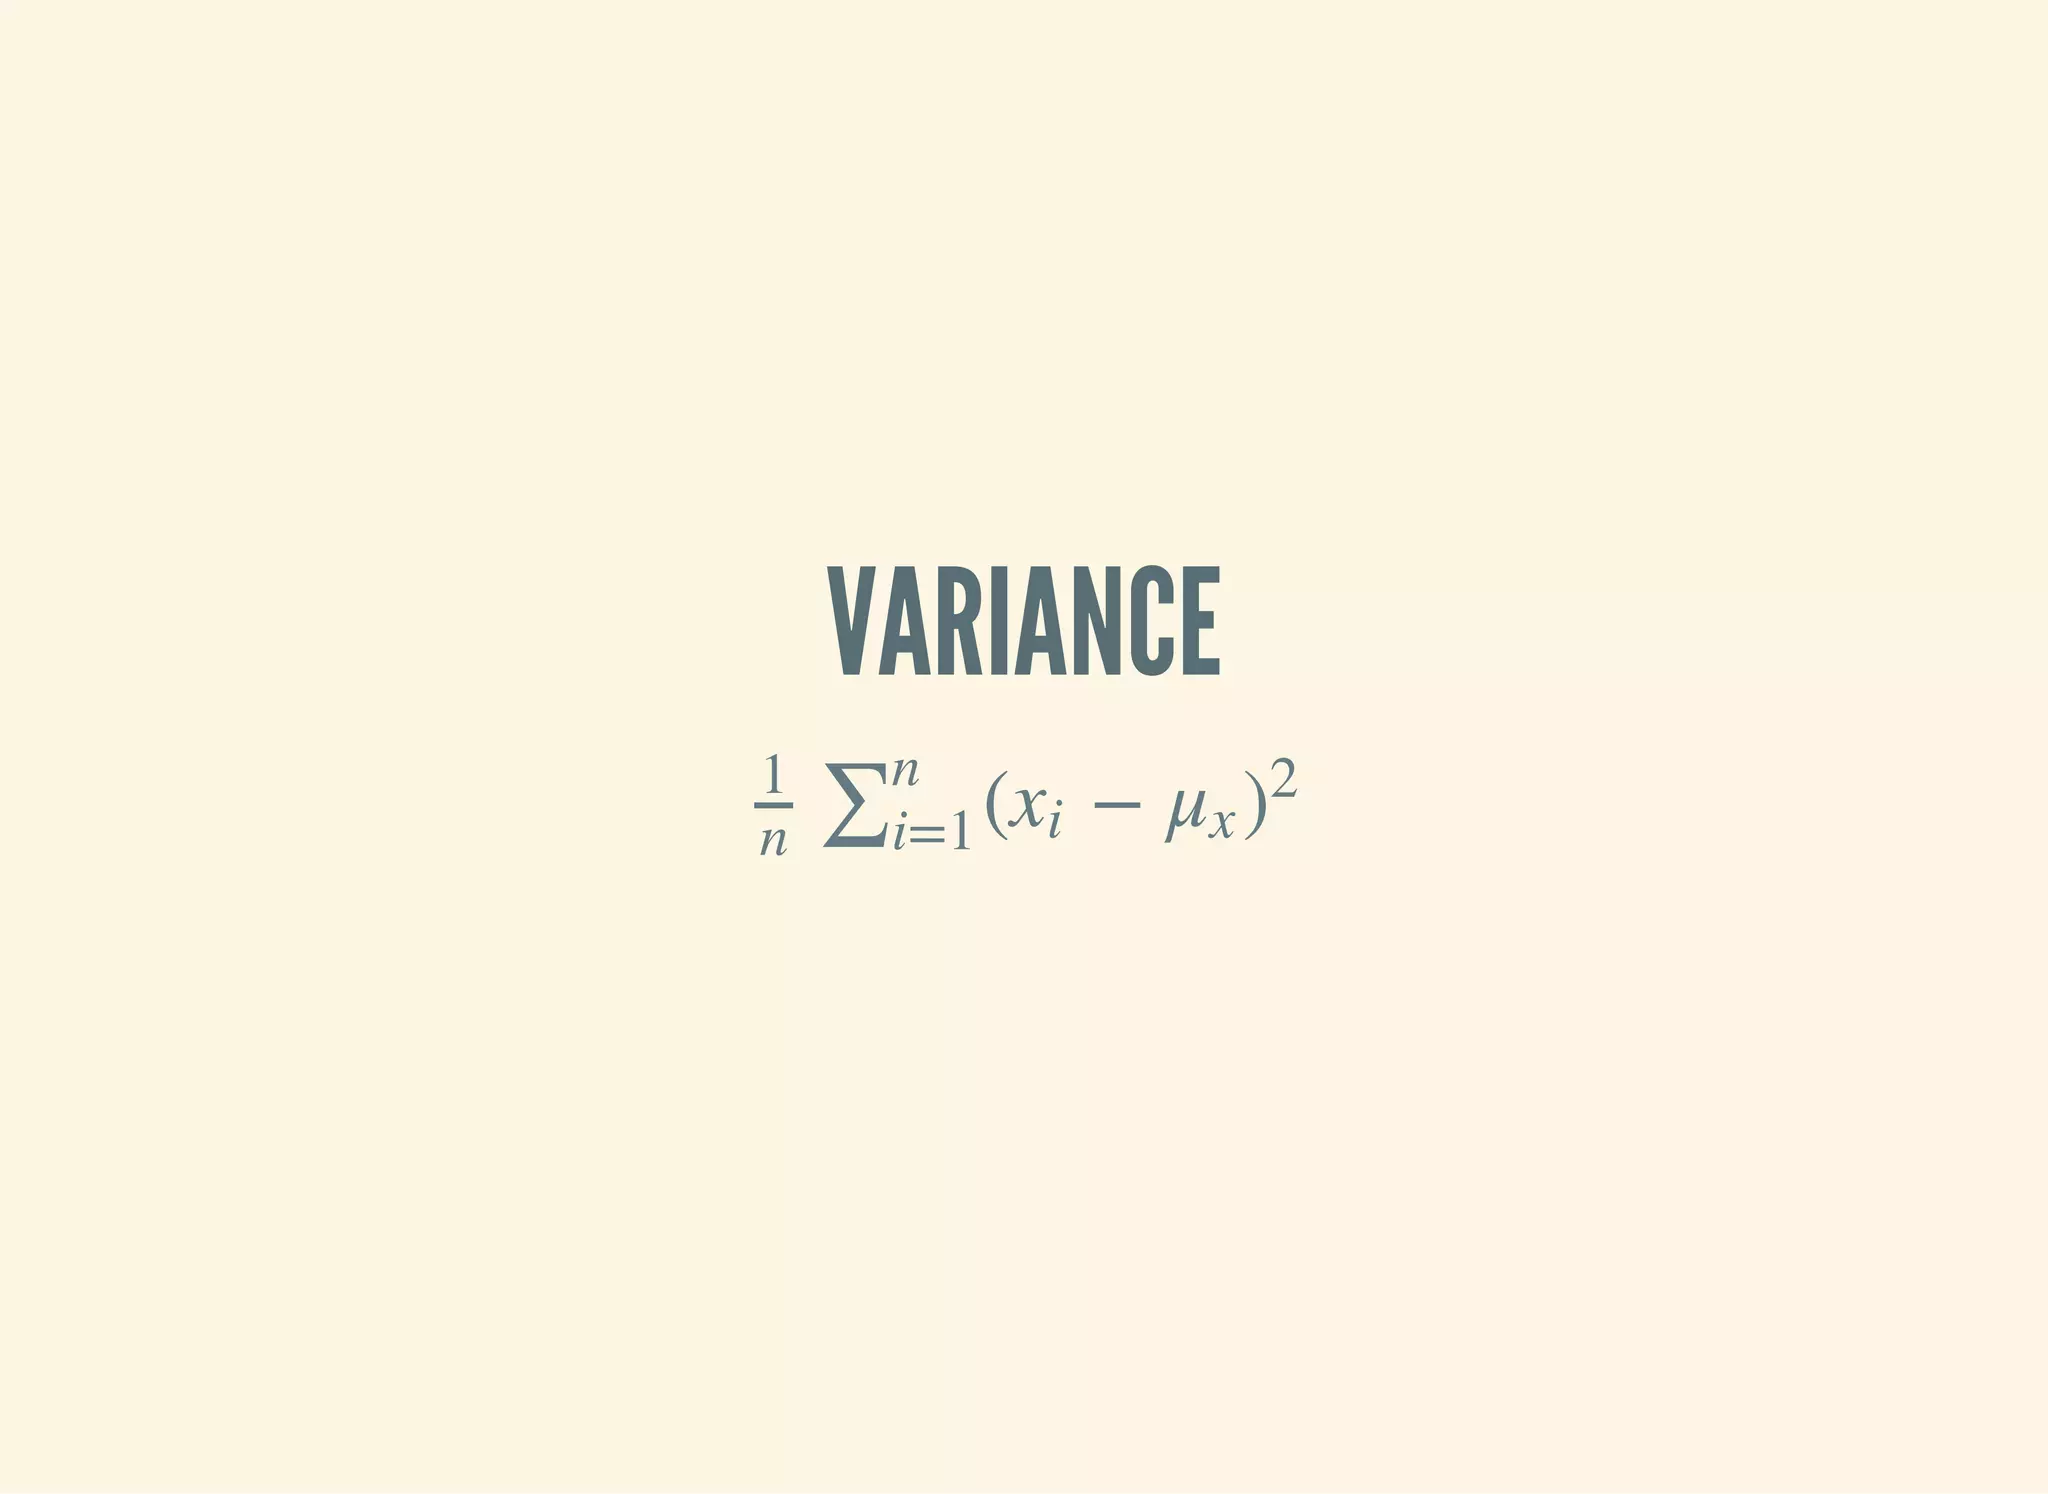
![…EXPLAINED
is `(reduce + …)`.∑
is "for all xs"∑n
i=1
is a function of x and the mean of x( −xi μx )
2
(defn variance [xs]
(let [m (mean xs)
n (count xs)
square-error (fn [x]
(Math/pow (- x m) 2))]
(/ (reduce + (map square-error xs)) n)))](https://image.slidesharecdn.com/clojurefordatascience-150903135047-lva1-app6891/75/Clojure-for-Data-Science-14-2048.jpg)
![HISTOGRAM
(require '[incanter.charts :as c])
(defn ex-1-11 []
(-> (uk-electorate)
(c/histogram :nbins 20)
(i/view)))](https://image.slidesharecdn.com/clojurefordatascience-150903135047-lva1-app6891/75/Clojure-for-Data-Science-15-2048.jpg)
![DISTIBUTIONS AS MODELS
[PDF]http://cljds.com/matura-2013](https://image.slidesharecdn.com/clojurefordatascience-150903135047-lva1-app6891/75/Clojure-for-Data-Science-16-2048.jpg)
![HONEST BAKER
(require '[incanter.distributions :as d])
(defn honest-baker []
(let [distribution (d/normal-distribution 1000 30)]
(repeatedly #(d/draw distribution))))
(defn ex-1-16 []
(-> (take 10000 (honest-baker))
(c/histogram :nbins 25)
(i/view)))](https://image.slidesharecdn.com/clojurefordatascience-150903135047-lva1-app6891/75/Clojure-for-Data-Science-18-2048.jpg)
![DISHONEST BAKER
(defn dishonest-baker []
(let [distribution (d/normal-distribution 950 30)]
(->> (repeatedly #(d/draw distribution))
(partition 13)
(map (partial apply max)))))
(defn ex-1-17 []
(-> (take 10000 (dishonest-baker))
(c/histogram :nbins 25)
(i/view)))](https://image.slidesharecdn.com/clojurefordatascience-150903135047-lva1-app6891/75/Clojure-for-Data-Science-19-2048.jpg)
![SELECTION
(defn filter-election-year [data]
(i/$where {"Election Year" {:$ne nil}} data))
(defn filter-victor-constituencies [data]
(i/$where {"Con" {:$fn number?} "LD" {:$fn number?}} data))](https://image.slidesharecdn.com/clojurefordatascience-150903135047-lva1-app6891/75/Clojure-for-Data-Science-21-2048.jpg)
![PROJECTION
(->> (uk-data)
(filter-election-year)
(filter-victor-constituencies)
(i/$ ["Region" "Electorate" "Con" "LD"])
(i/add-derived-column "Victors" ["Con" "LD"] +)
(i/add-derived-column "Victors Share" ["Victors" "Electorate"] /)
(i/view))](https://image.slidesharecdn.com/clojurefordatascience-150903135047-lva1-app6891/75/Clojure-for-Data-Science-22-2048.jpg)
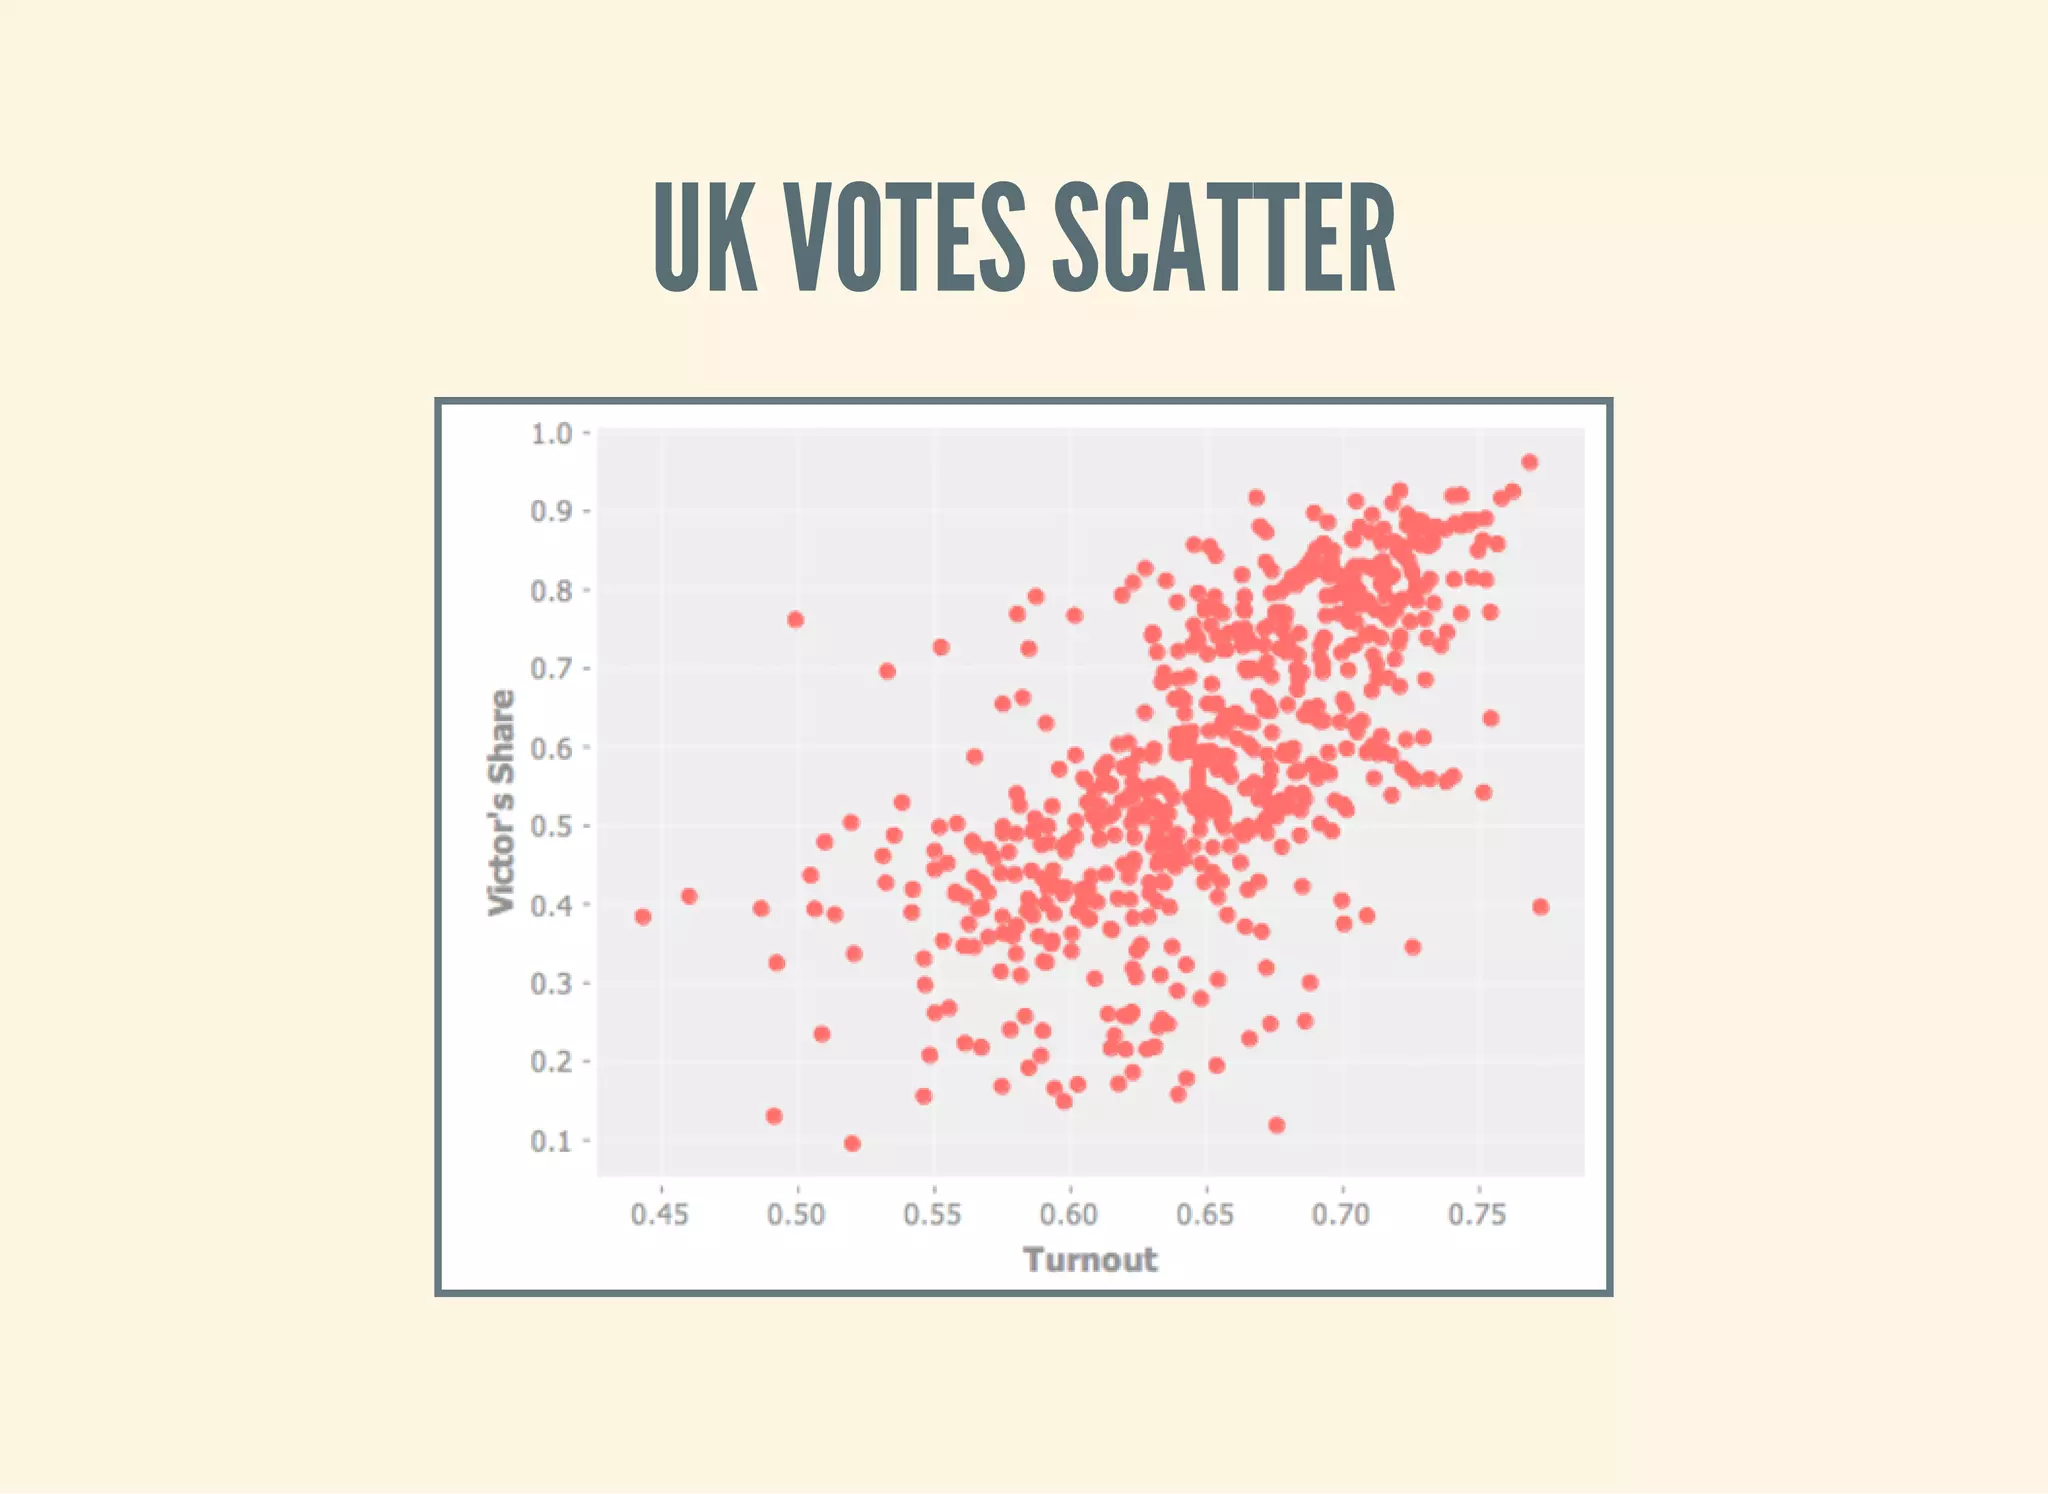
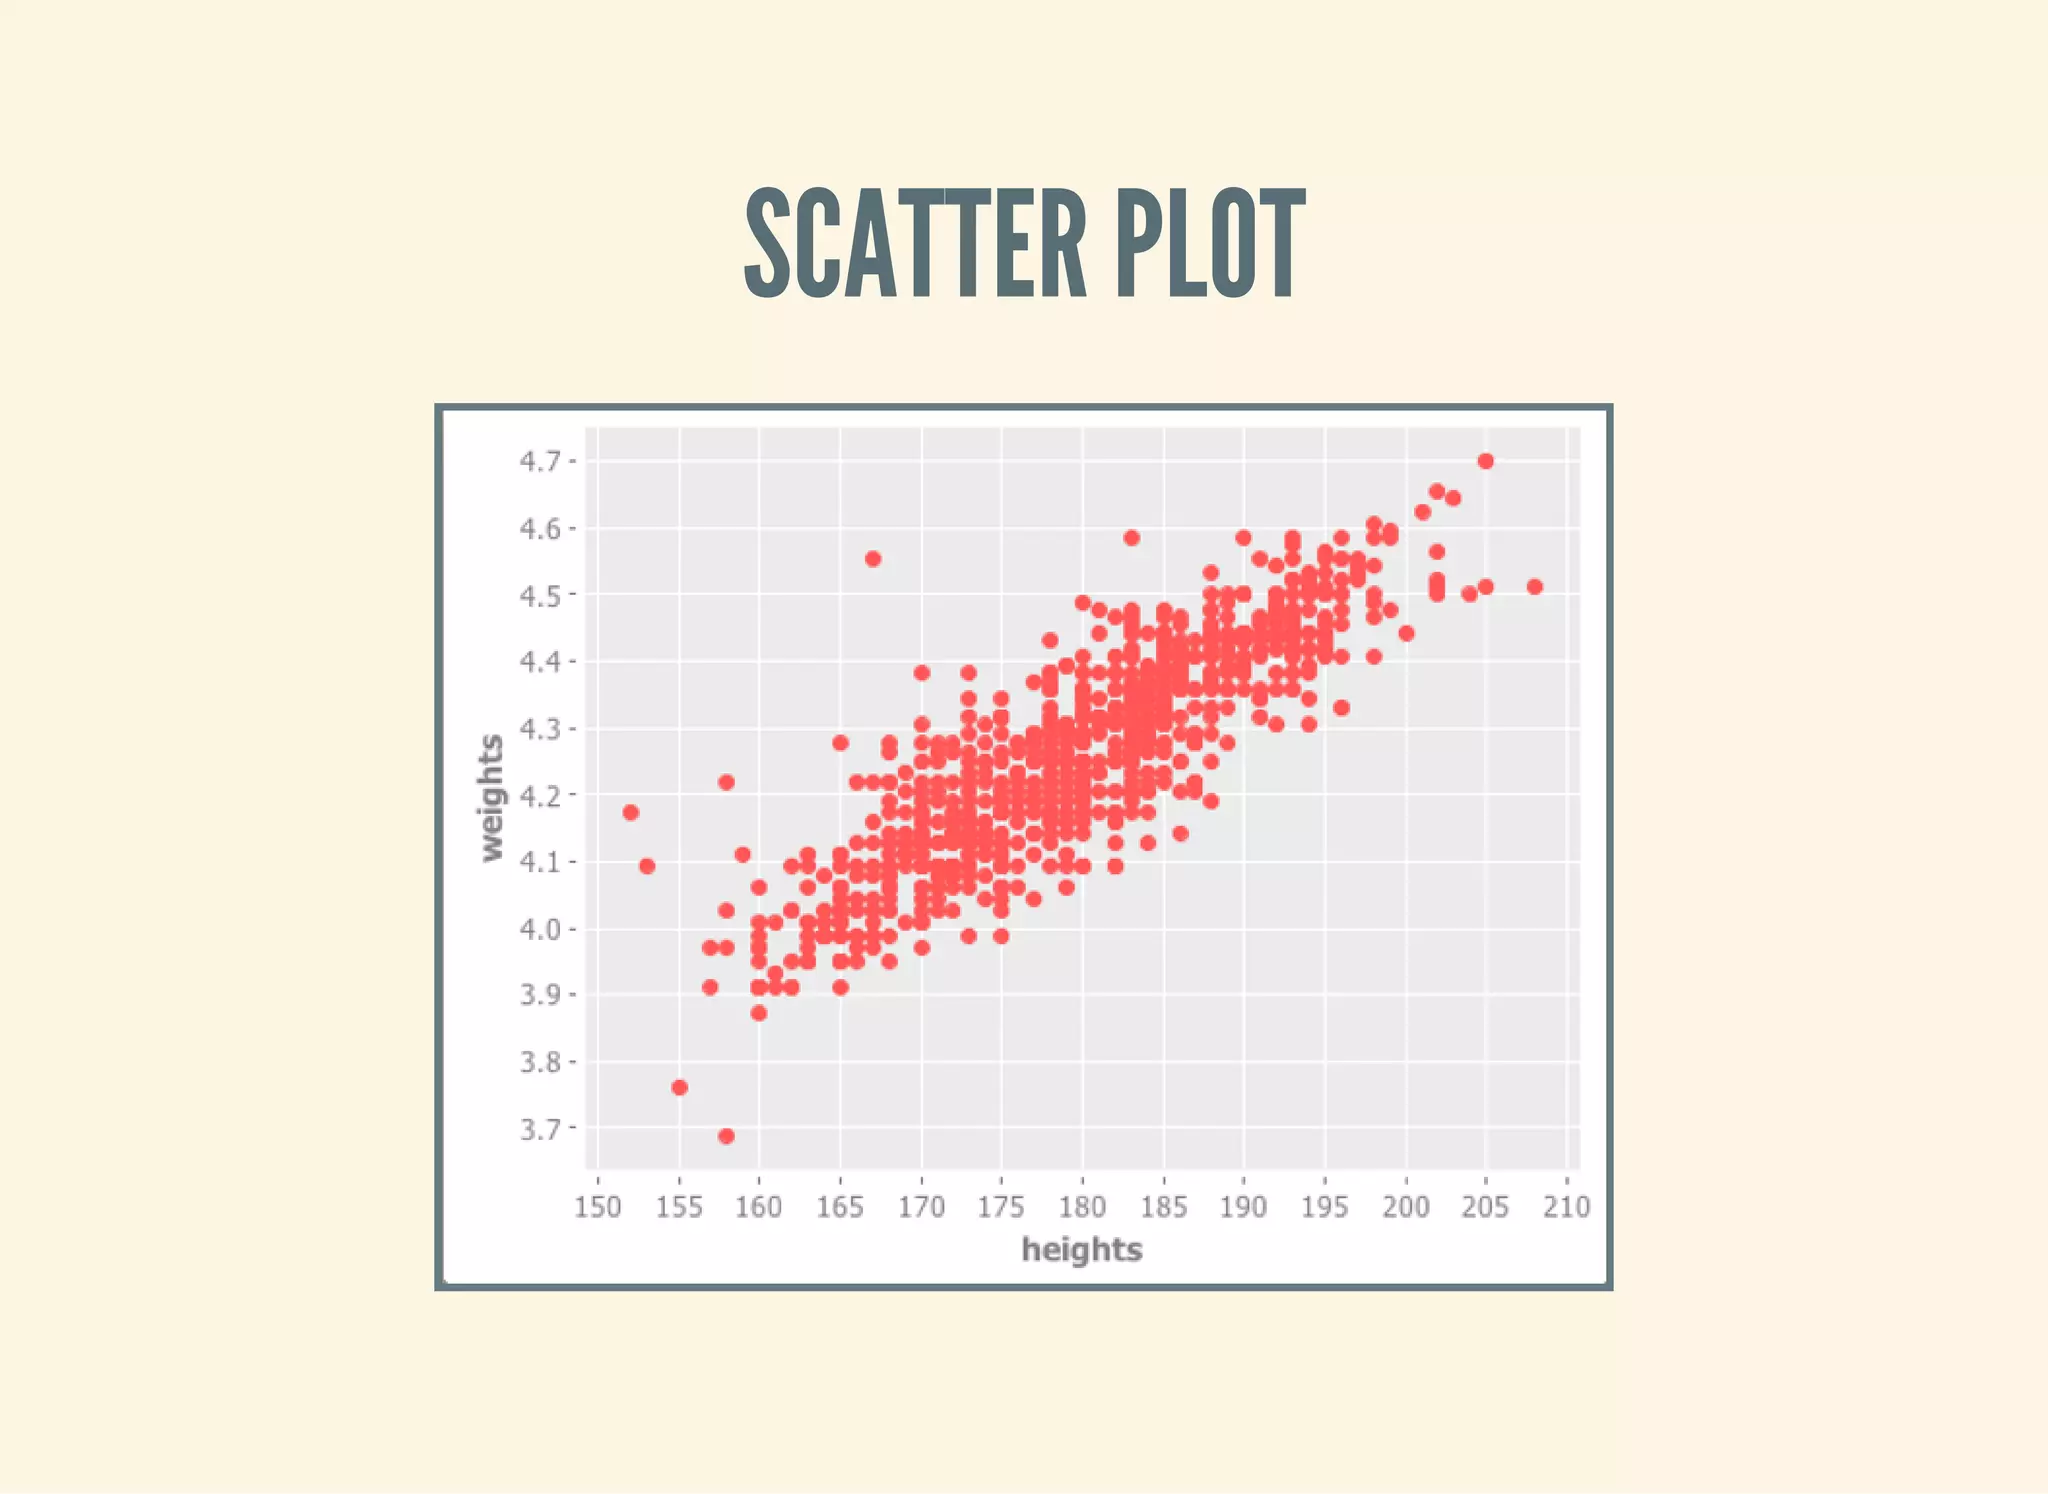
![TWO VARIABLES: SCATTER PLOTS!
(defn ex-1-33 []
(let [data (->> (uk-data)
(clean-uk-data)
(derive-uk-data))]
(-> (scatter-plot ($ "Turnout" data)
($ "Victors Share" data)
:x-label "Turnout"
:y-label "Victor's Share")
(view))))](https://image.slidesharecdn.com/clojurefordatascience-150903135047-lva1-app6891/75/Clojure-for-Data-Science-23-2048.jpg)

![BINNING DATA
(defn bin [n-bins xs]
(let [min-x (apply min xs)
range-x (- (apply max xs) min-x)
max-bin (dec n-bins)
bin-fn (fn [x]
(-> x
(- min-x)
(/ range-x)
(* n-bins)
int
(min max-bin)))]
(map bin-fn xs)))
(defn ex-1-10 []
(->> (uk-electorate)
(bin 10)
(frequencies)))
;; => {0 1, 1 1, 2 4, 3 22, 4 130, 5 320, 6 156, 7 15, 9 1}](https://image.slidesharecdn.com/clojurefordatascience-150903135047-lva1-app6891/75/Clojure-for-Data-Science-27-2048.jpg)
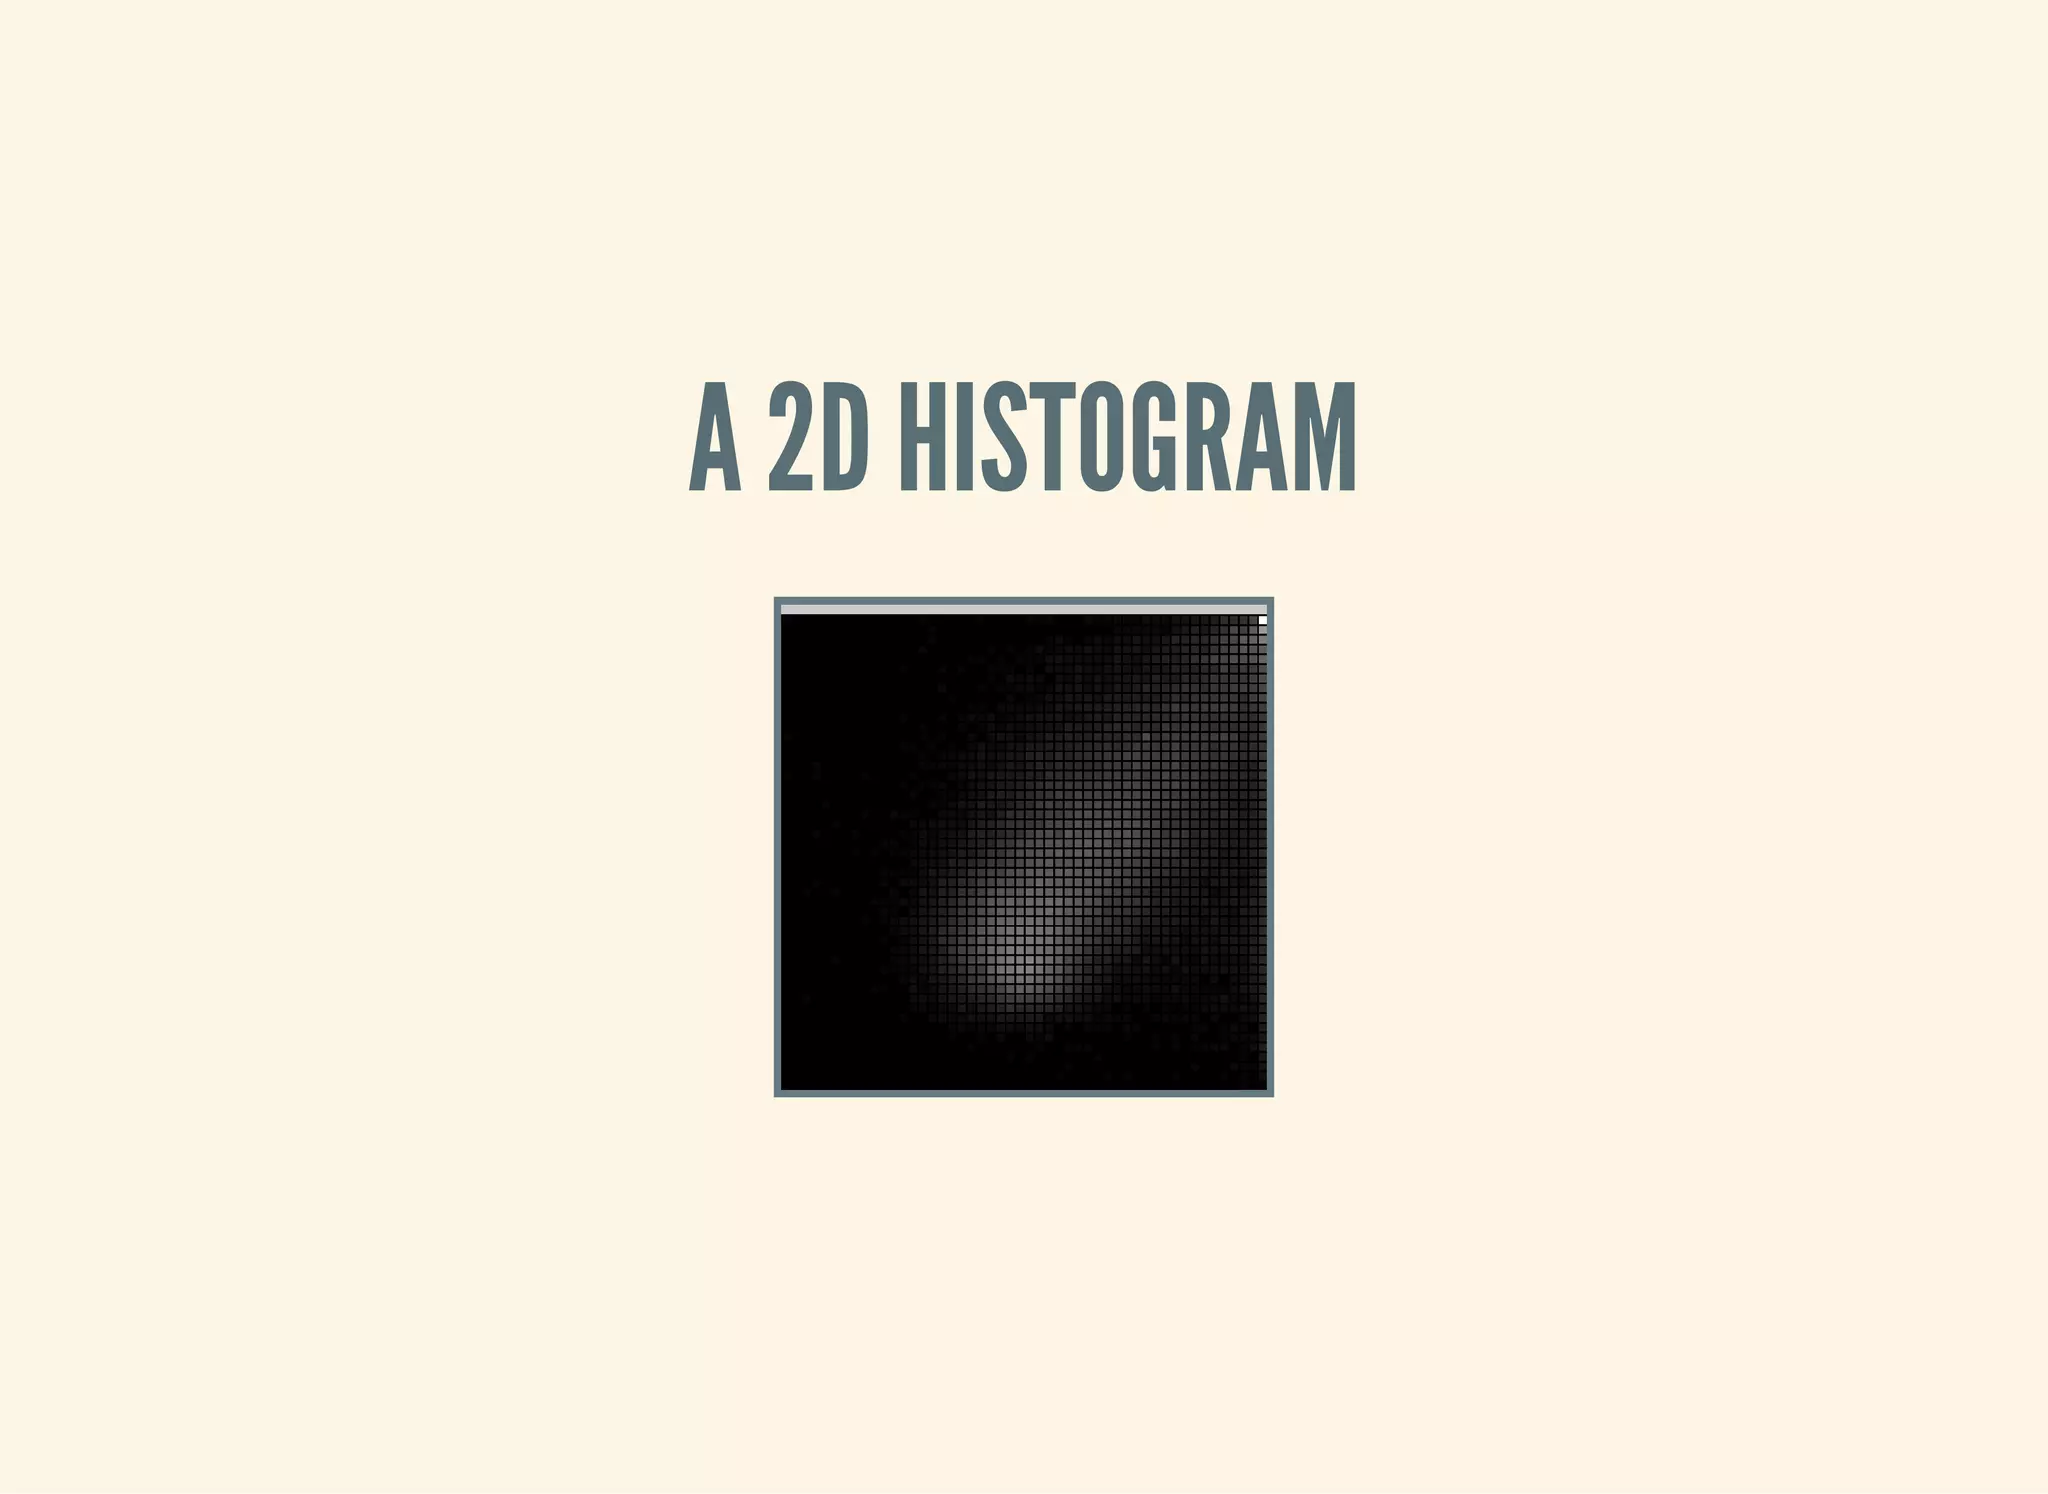
![A 2D HISTOGRAM
(defn histogram-2d [xs ys n-bins]
(-> (map vector (bin n-bins xs) (bin n-bins ys))
(frequencies)))
(defn uk-histogram-2d []
(let [data (->> (uk-data)
(clean-uk-data)
(derive-uk-data))]
(histogram-2d ($ "Turnout" data) ($ "Victors Share" data) 5)))
;; => {[2 1] 59, [3 2] 91, [4 3] 32, [1 0] 8, [2 2] 89, [3 3] 101, [4 4]
60, [0 0] 2, [1 1] 22, [2 3] 19, [3 4] 53, [0 1] 6, [1 2] 15, [2 4] 5,
[1 3] 2, [0 3] 1, [3 0] 6, [4 1] 3, [3 1] 17, [4 2] 17, [2 0] 23}](https://image.slidesharecdn.com/clojurefordatascience-150903135047-lva1-app6891/75/Clojure-for-Data-Science-28-2048.jpg)

![VISUALIZATION WITH QUIL
(require '[quil.core :as q])
(defn ratio->grayscale [f]
(-> f
(* 255)
(int)
(min 255)
(max 0)
(q/color)))
(defn draw-histogram [data {:keys [n-bins size]}]
(let [[width height] size
x-scale (/ width n-bins)
y-scale (/ height n-bins)
max-value (apply max (vals data))
setup (fn []
(doseq [x (range n-bins)
y (range n-bins)]
(let [v (get data [x y] 0)
x-pos (* x x-scale)
y-pos (- height (* y y-scale))]
(q/fill (ratio->grayscale (/ v max-value)))
(q/rect x-pos y-pos x-scale y-scale))))]
(q/sketch :setup setup :size size)))](https://image.slidesharecdn.com/clojurefordatascience-150903135047-lva1-app6891/75/Clojure-for-Data-Science-30-2048.jpg)
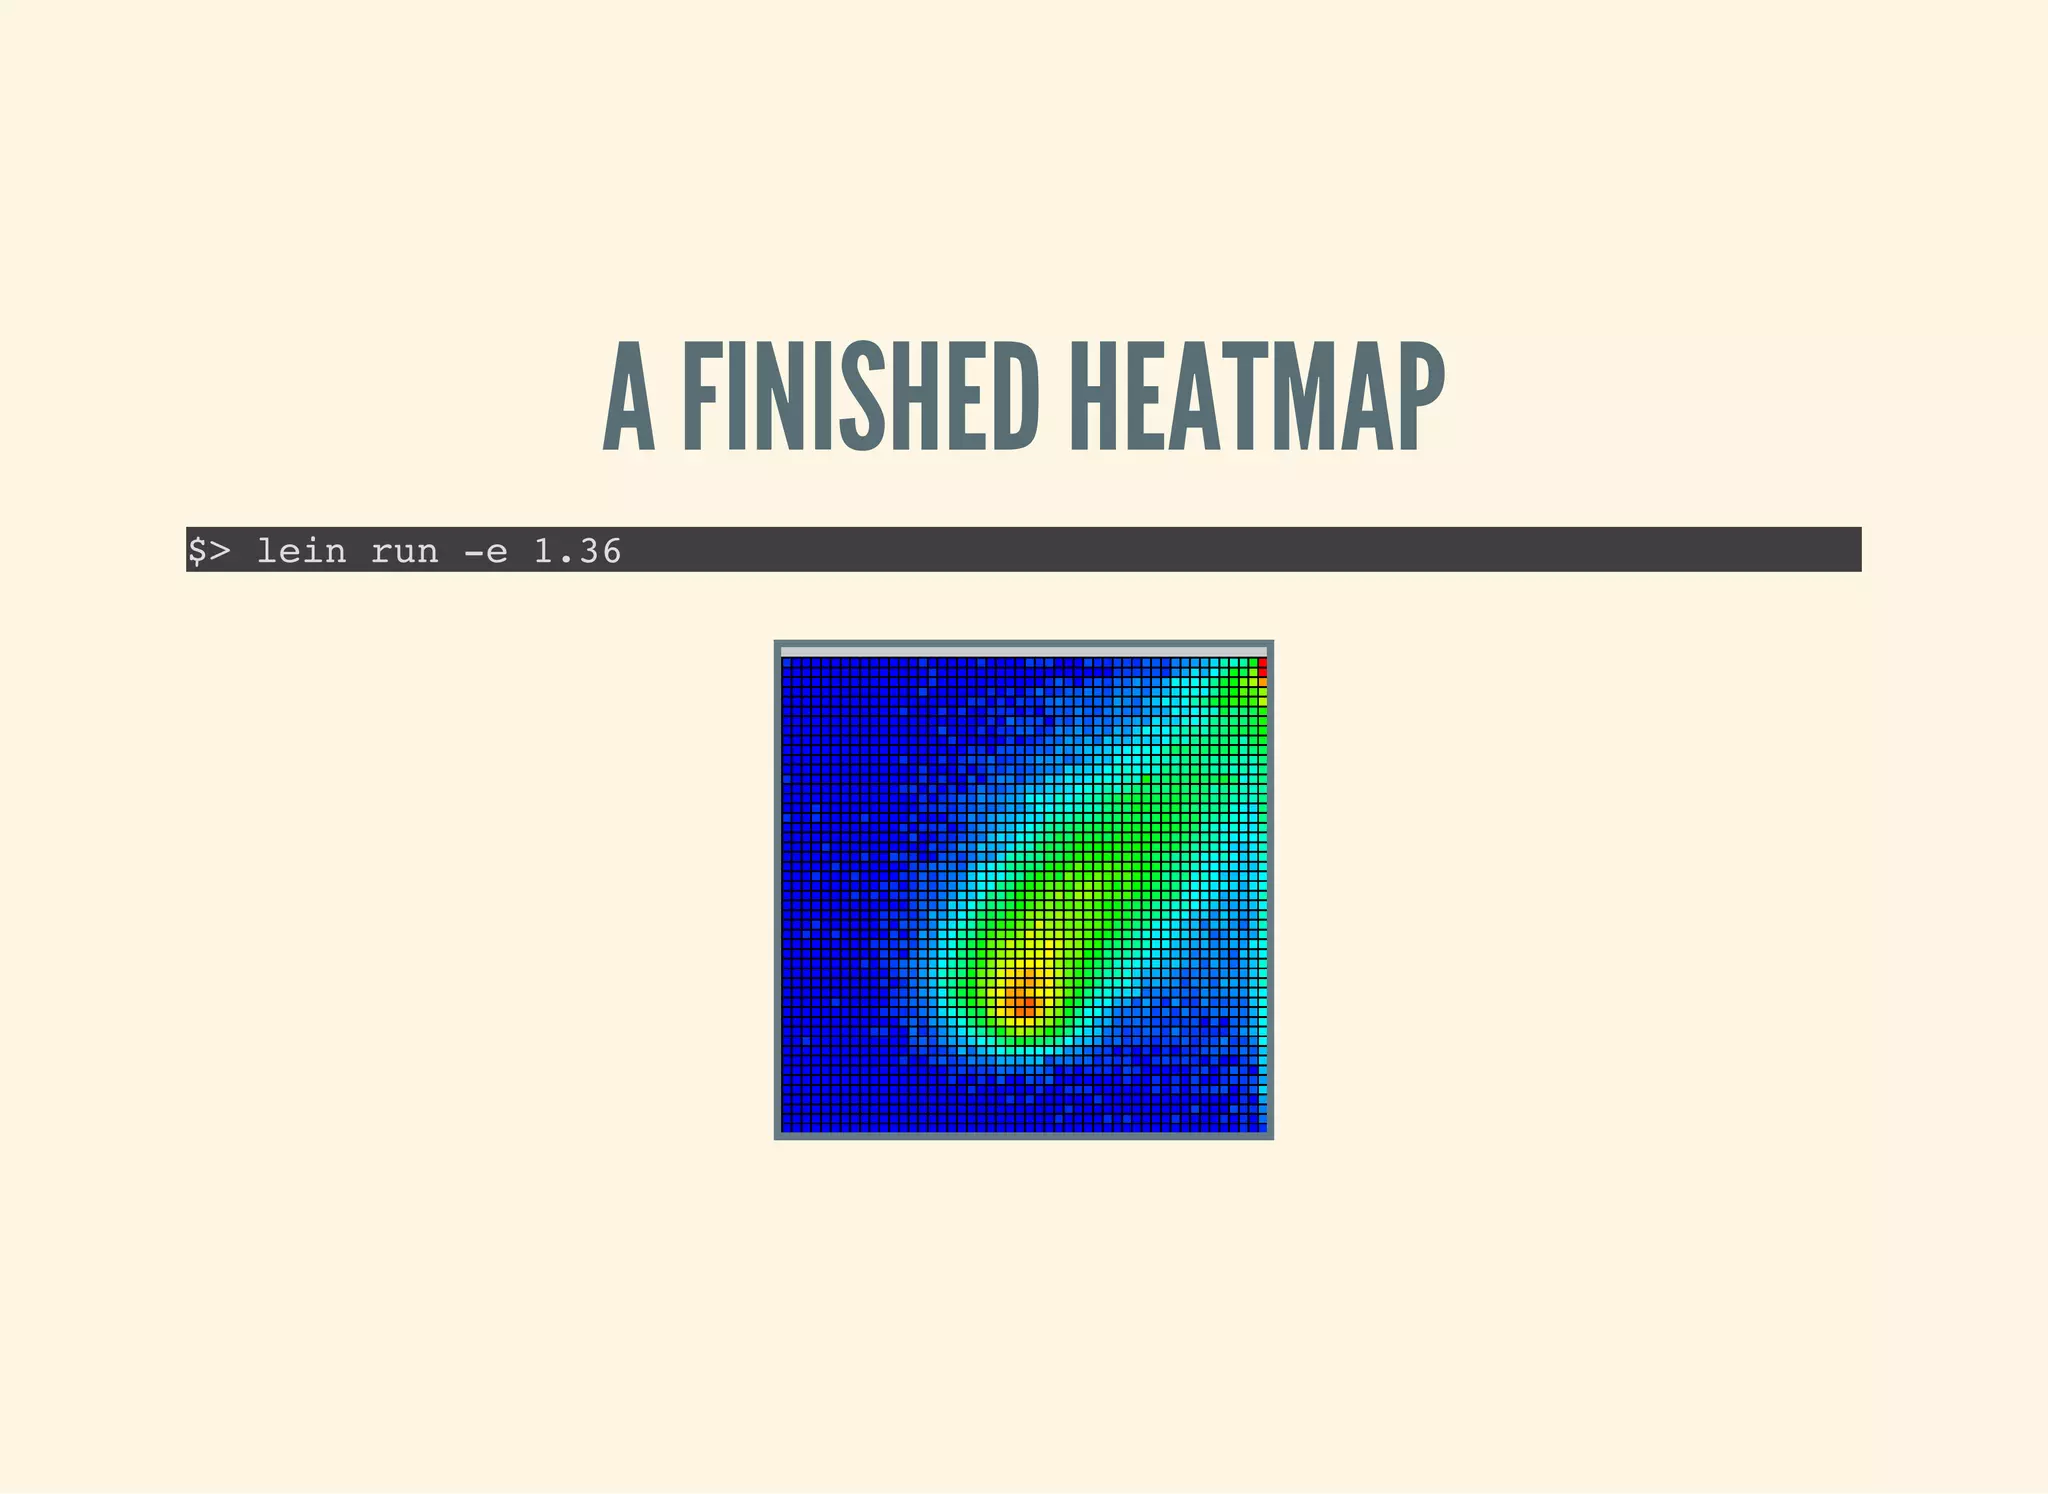
![A COLOUR HEATMAP
Interpolate between the colours of the spectrum.
(defn ratio->heat [f]
(let [colors [(q/color 0 0 255) ;; blue
(q/color 0 255 255) ;; turquoise
(q/color 0 255 0) ;; green
(q/color 255 255 0) ;; yellow
(q/color 255 0 0)] ;; red
f (-> f
(max 0.000)
(min 0.999)
(* (dec (count colors))))]
(q/lerp-color (nth colors f) (nth colors (inc f)) (rem f 1))))](https://image.slidesharecdn.com/clojurefordatascience-150903135047-lva1-app6891/75/Clojure-for-Data-Science-32-2048.jpg)


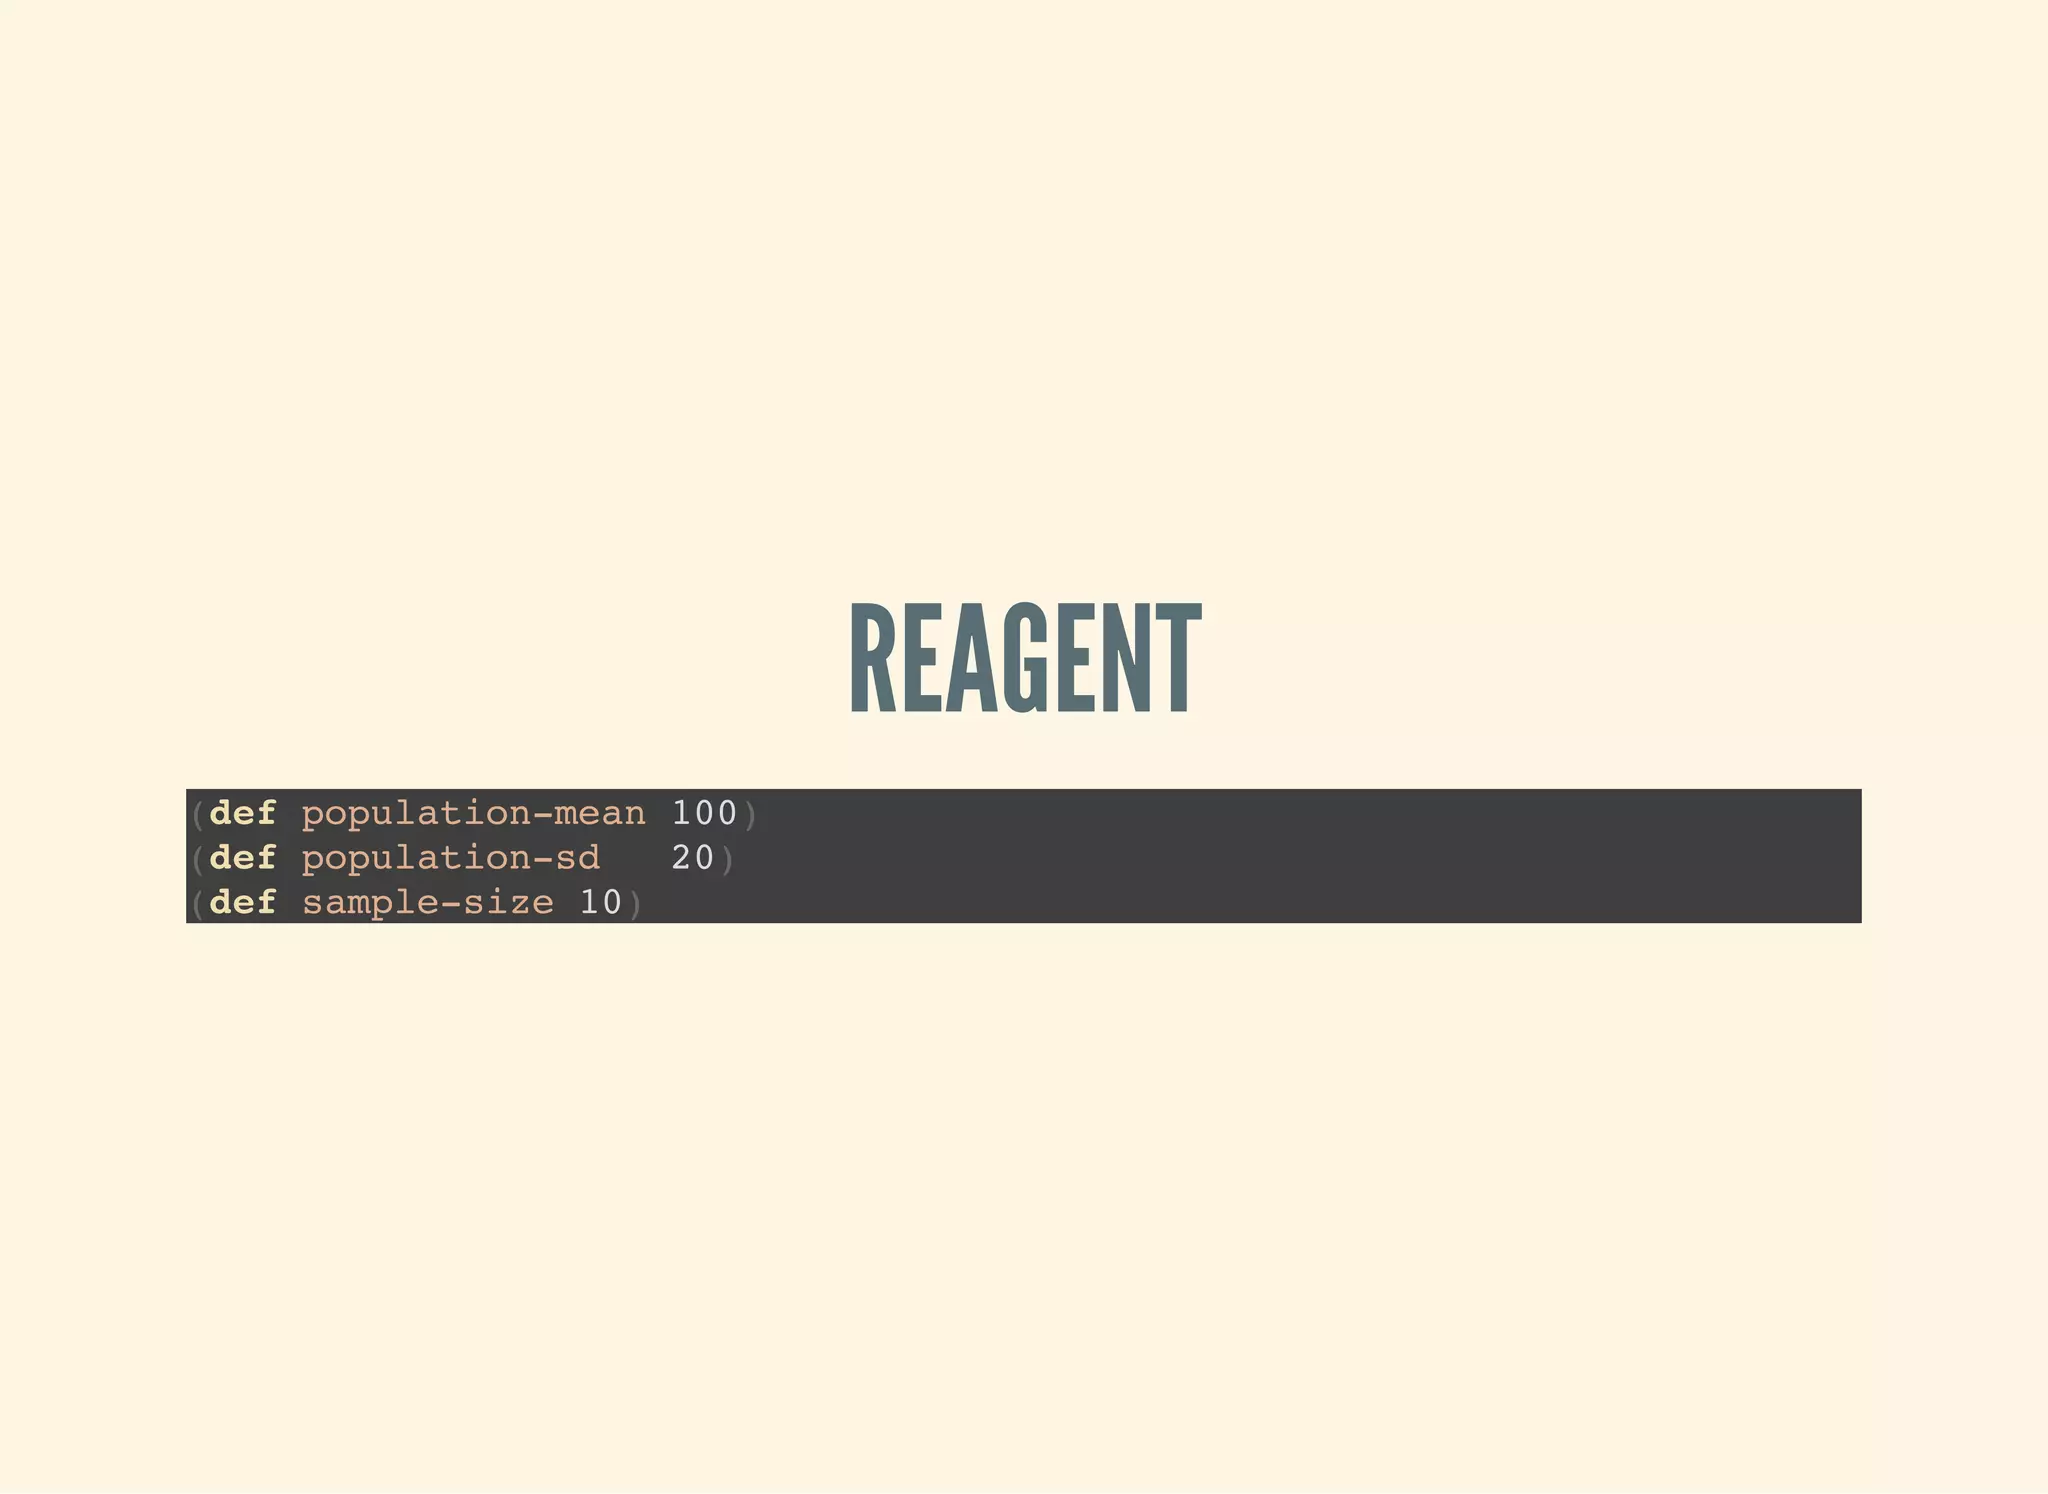
![REAGENT ATOMS
(require '[reagent.core :as r])
(defn randn [mean sd]
(.. js/jStat -normal (sample mean sd)))
(defn normal-distribution [mean sd]
(repeatedly #(randn mean sd)))
(def state
(r/atom {:sample []}))
(defn update-sample! [state]
(swap! state assoc :sample
(->> (normal-distribution population-mean population-sd)
(map int)
(take sample-size))))](https://image.slidesharecdn.com/clojurefordatascience-150903135047-lva1-app6891/75/Clojure-for-Data-Science-40-2048.jpg)
![CREATE THE WIDGETS
(defn new-sample [state]
[:button {:on-click #(update-sample! state)} "New Sample"])
(defn sample-list [state]
[:div
(let [sample (:sample @state)]
[:div
[:ul (for [n sample] [:li n])]
[:dl
[:dt "Sample Mean:"]
[:dd (mean sample)]]])])](https://image.slidesharecdn.com/clojurefordatascience-150903135047-lva1-app6891/75/Clojure-for-Data-Science-41-2048.jpg)
![LAY OUT THE INTERFACE
(defn layout-interface []
[:div
[:h1 "Normal Sample"]
[new-sample state]
[sample-list state]])
;; Render the root component
(defn run []
(r/render-component
[layout-interface]
(.getElementById js/document "root")))](https://image.slidesharecdn.com/clojurefordatascience-150903135047-lva1-app6891/75/Clojure-for-Data-Science-42-2048.jpg)


![CALCULATING THE T-STATISTIC
Based entirely on our sample statistics
(defn t-statistic [sample test-mean]
(let [sample-mean (mean sample)
sample-size (count sample)
sample-sd (standard-deviation sample)]
(/ (- sample-mean test-mean)
(/ sample-sd (Math/sqrt sample-size)))))](https://image.slidesharecdn.com/clojurefordatascience-150903135047-lva1-app6891/75/Clojure-for-Data-Science-51-2048.jpg)


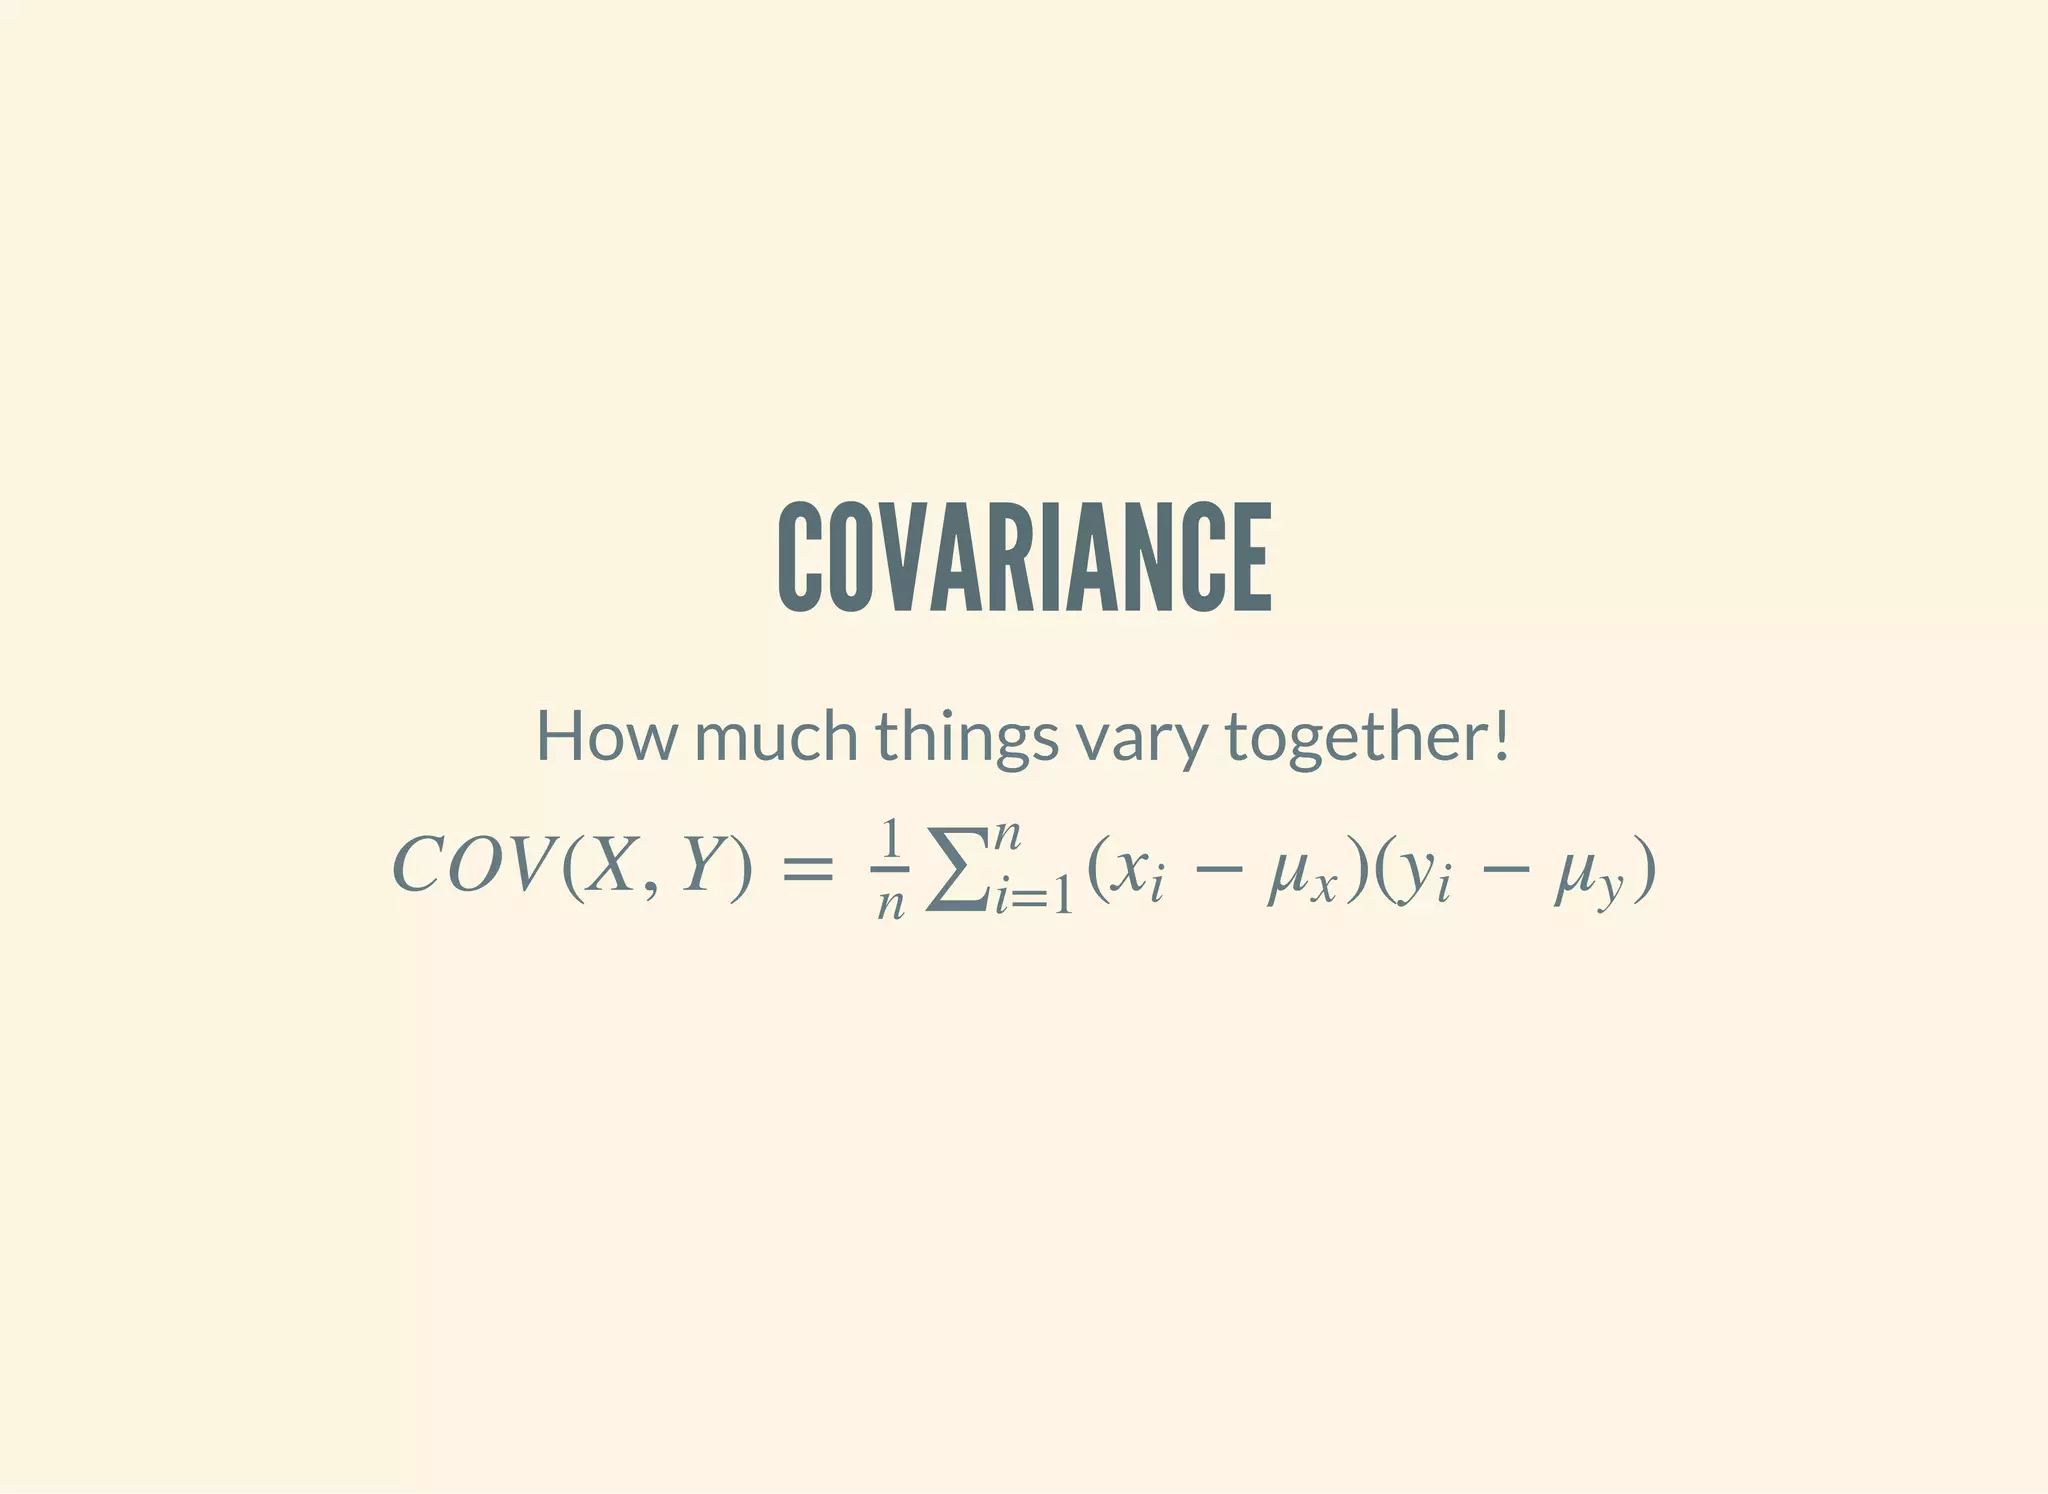
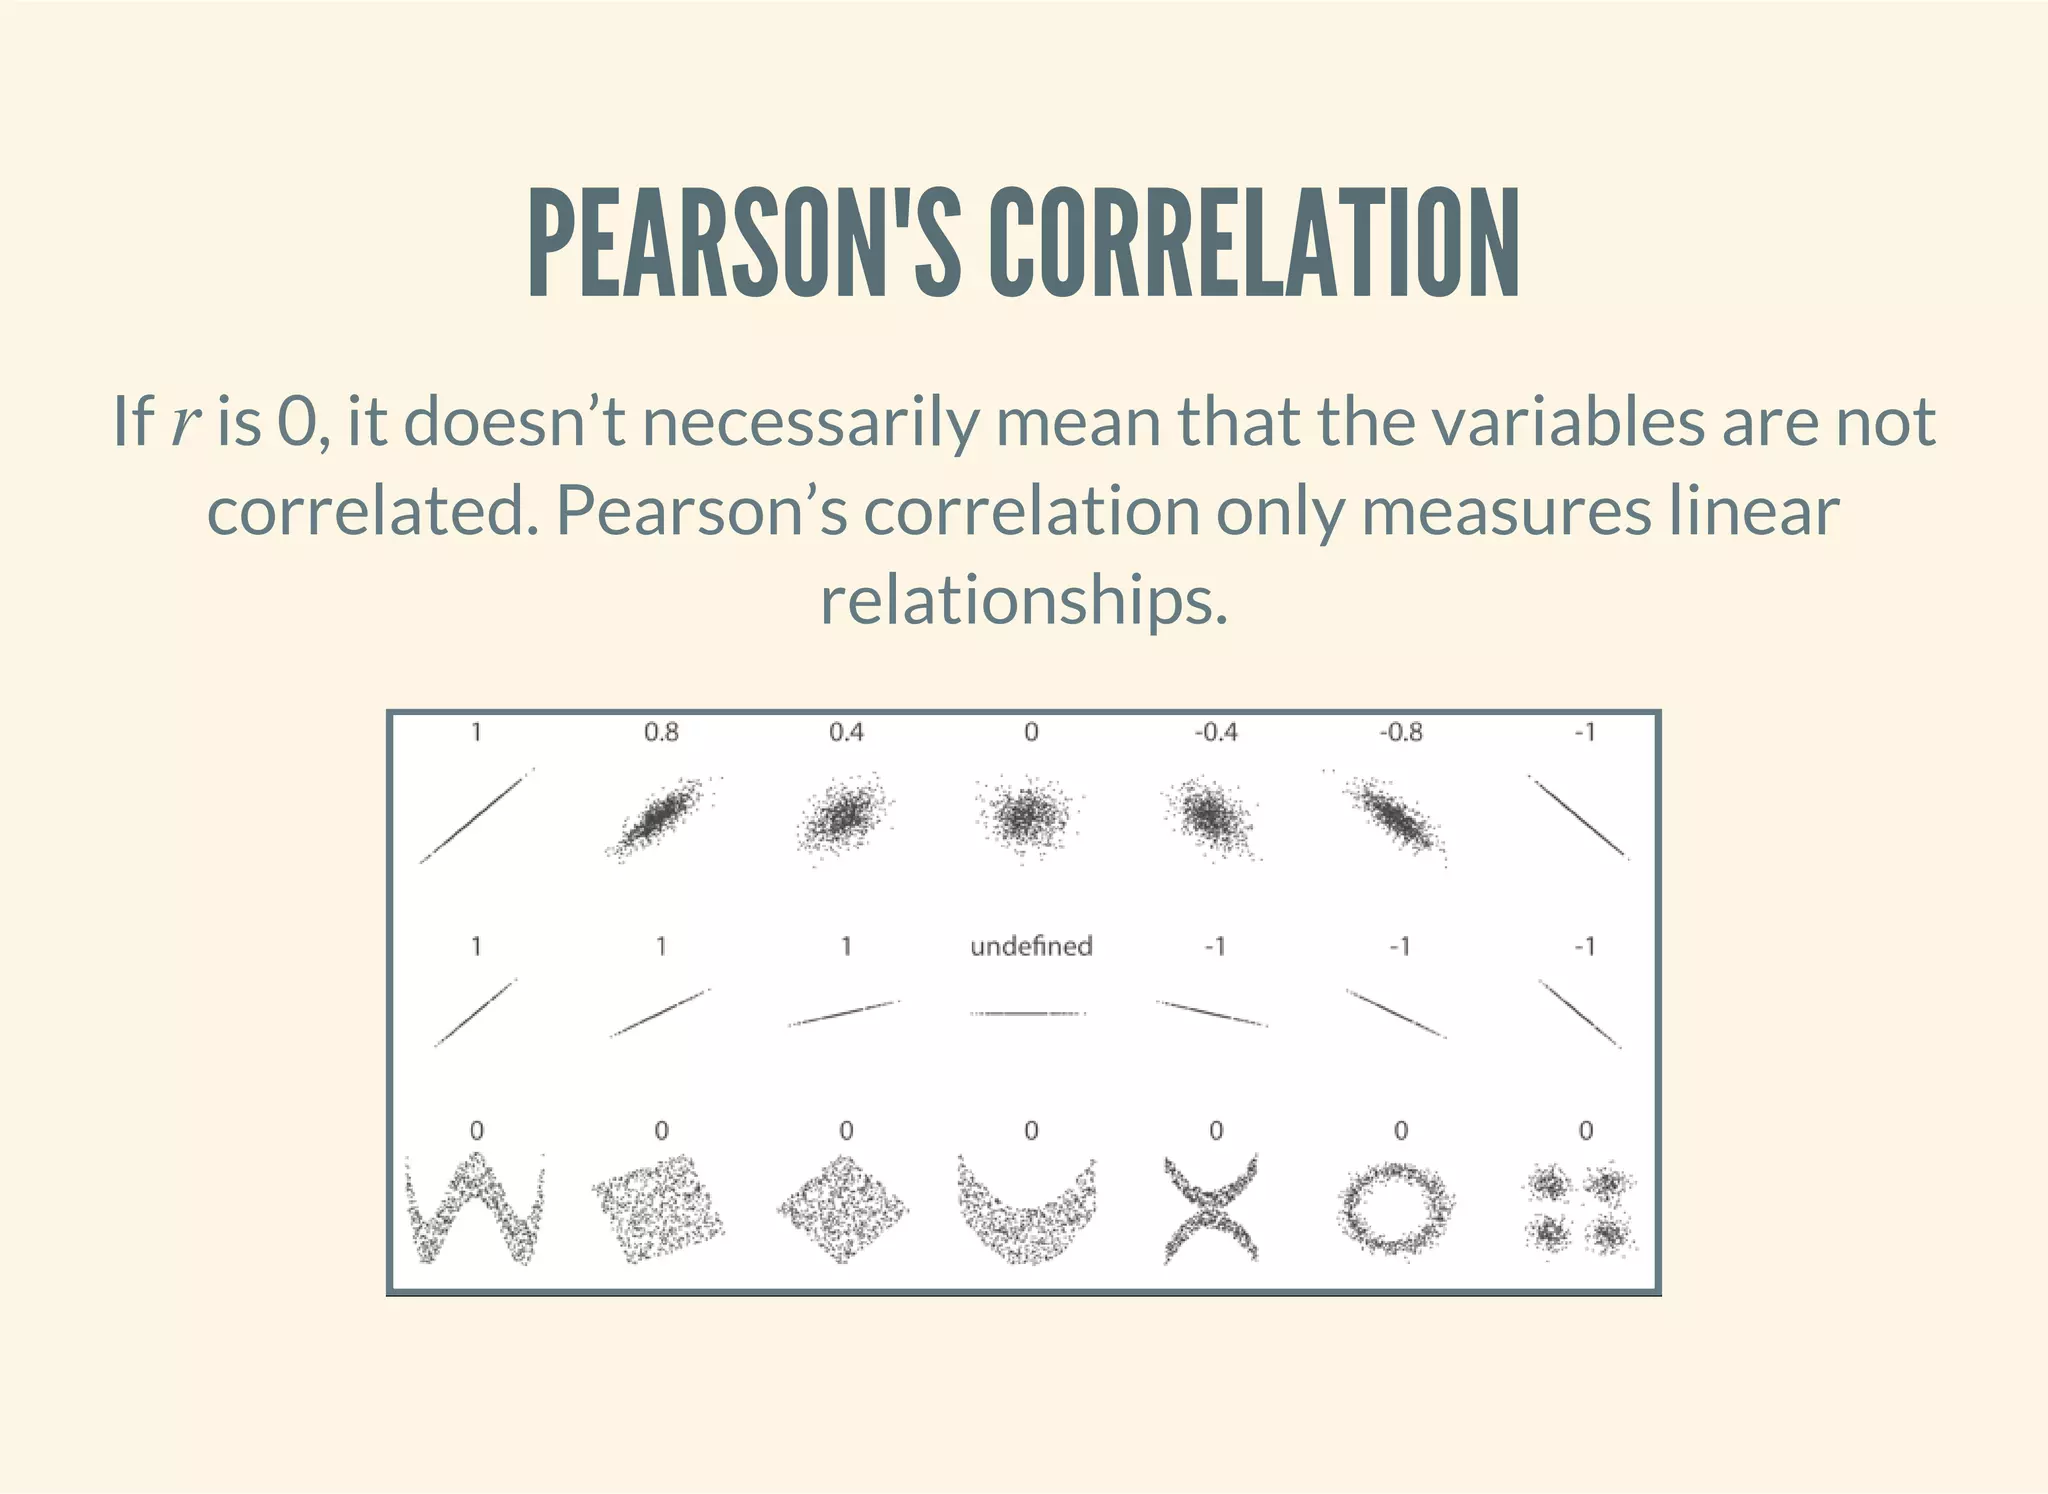
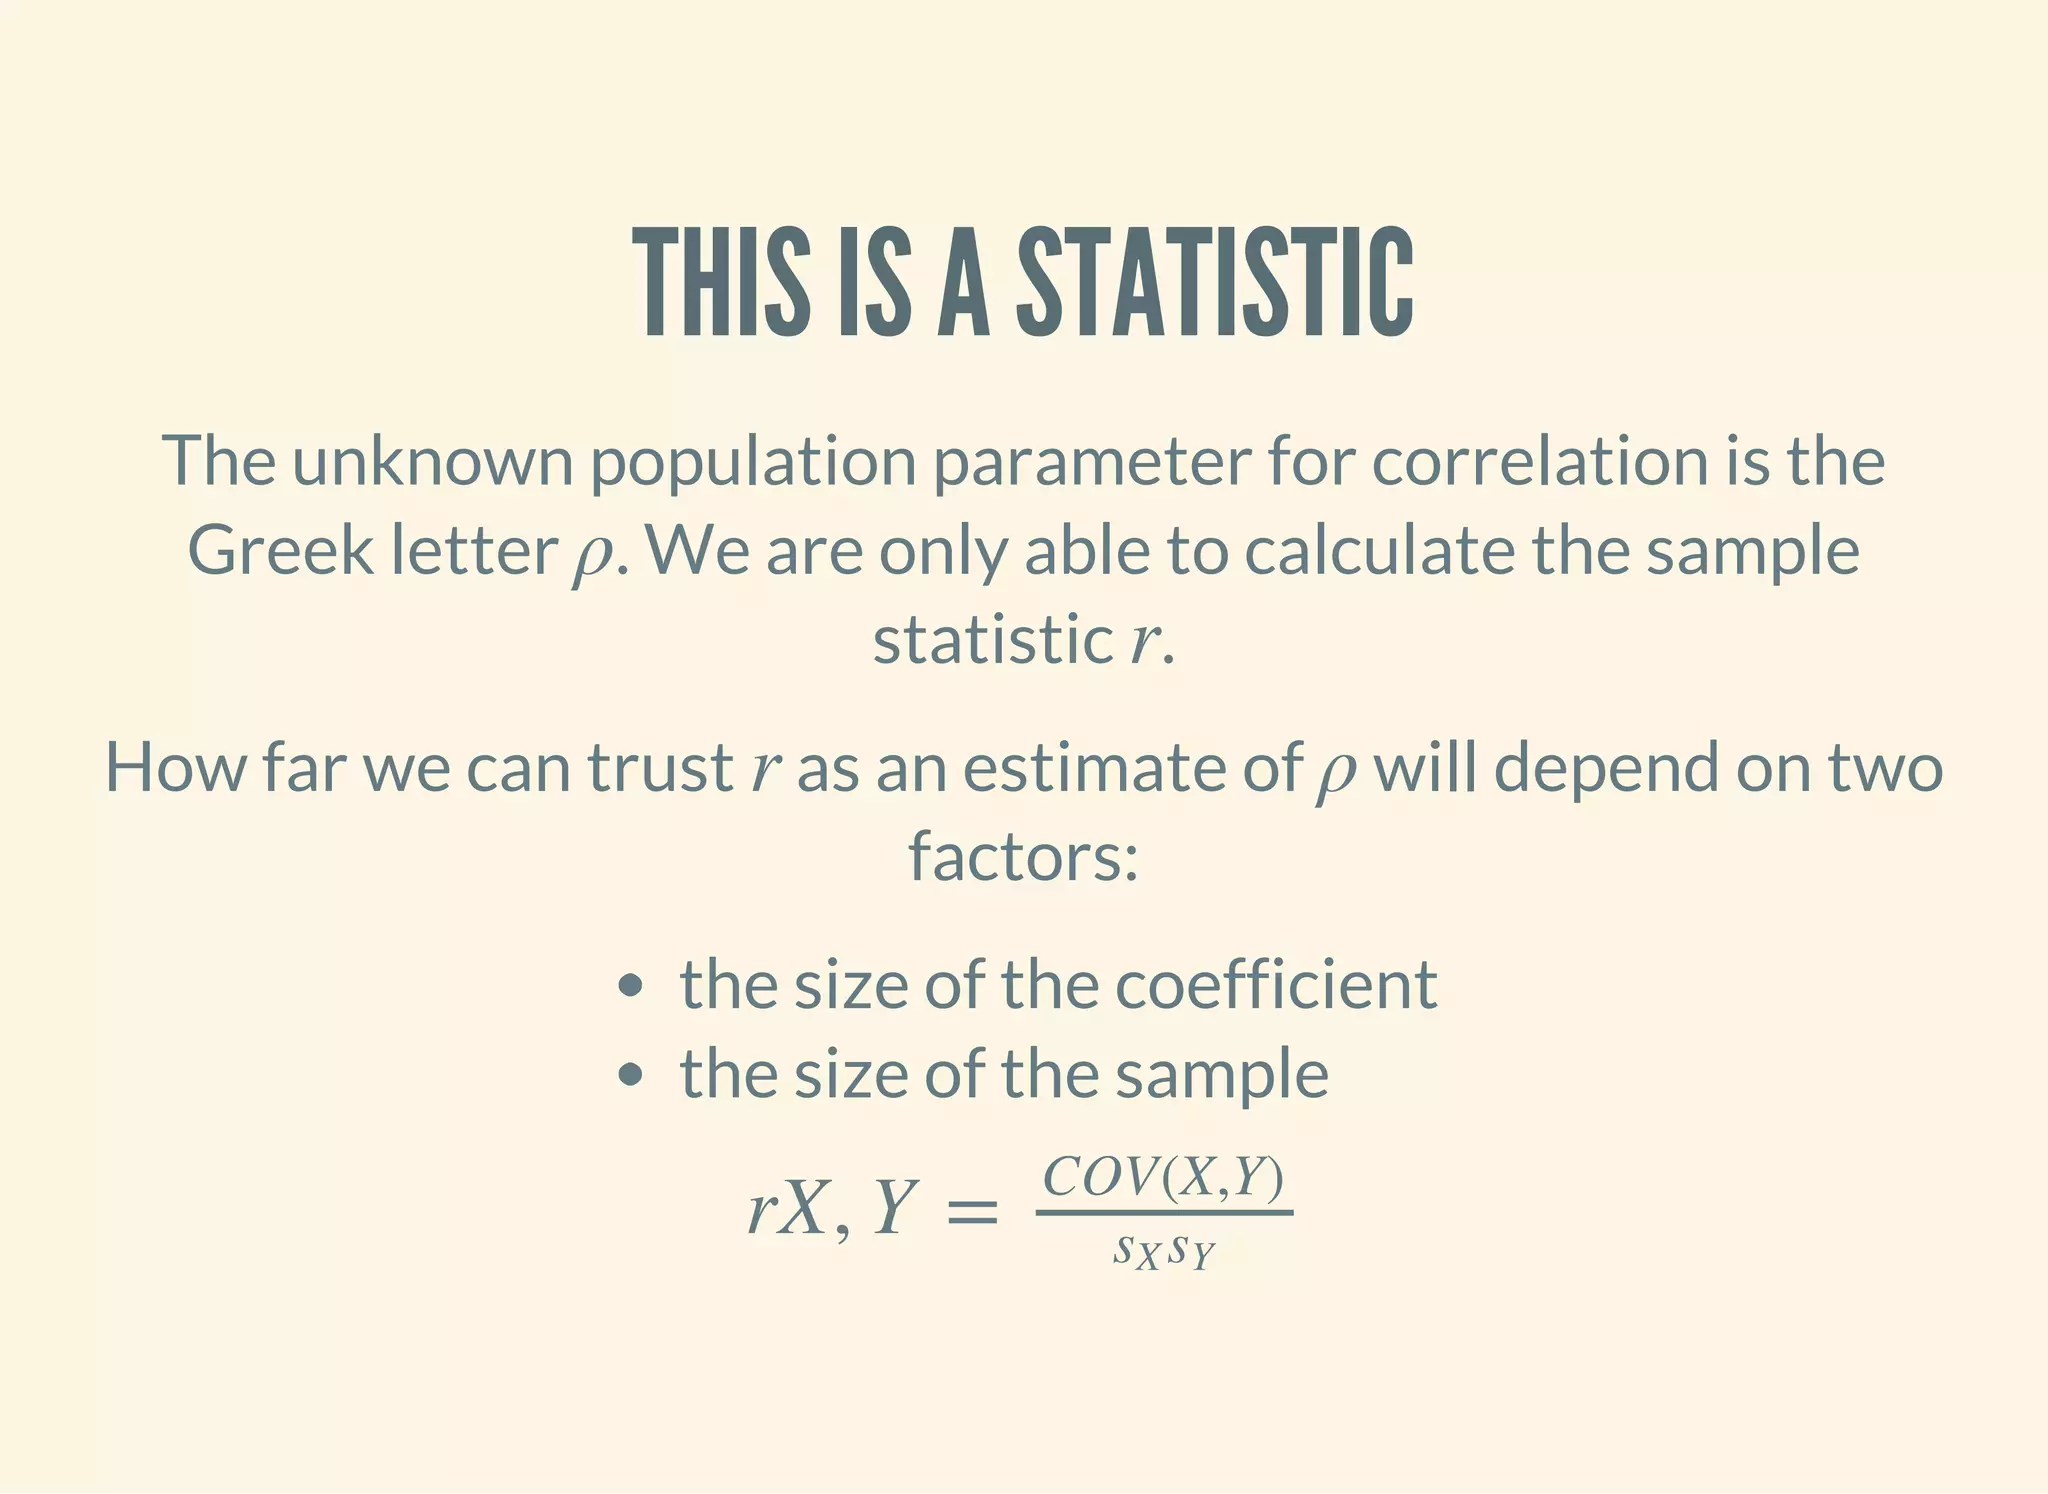
![PEARSON'S CORRELATION
Covariance divided by the product of standard deviations. It
measures linear correlation.
ρX, Y =
COV(X,Y)
σX σY
(defn pearsons-correlation [x y]
(/ (covariance x y)
(* (standard-deviation x)
(standard-deviation y))))](https://image.slidesharecdn.com/clojurefordatascience-150903135047-lva1-app6891/75/Clojure-for-Data-Science-67-2048.jpg)
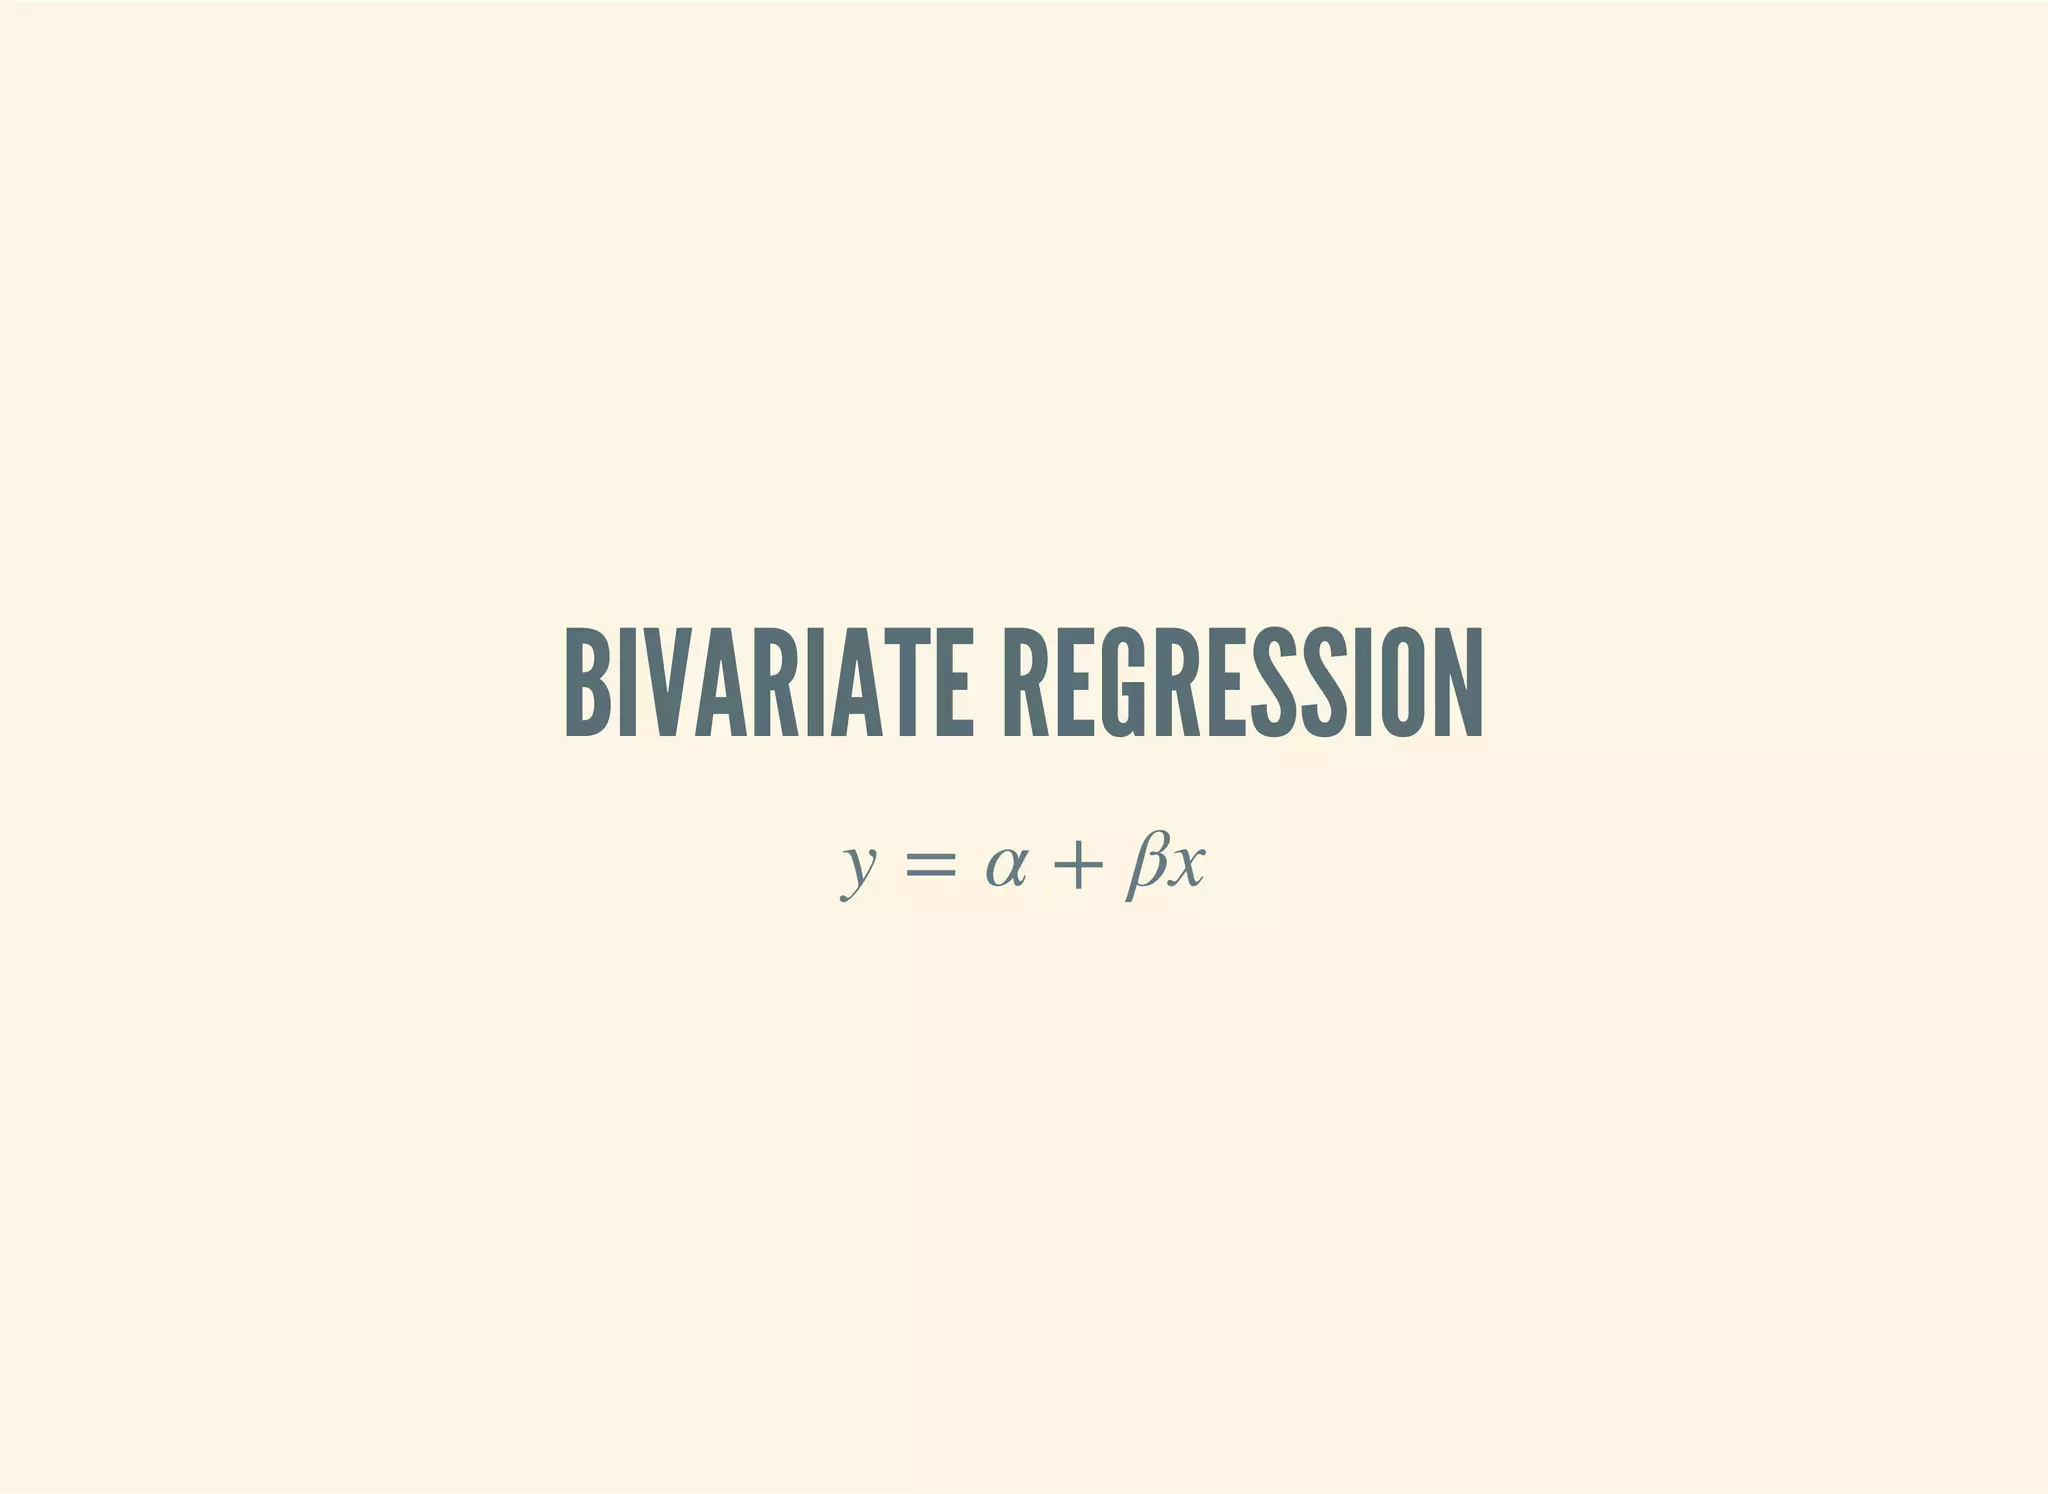
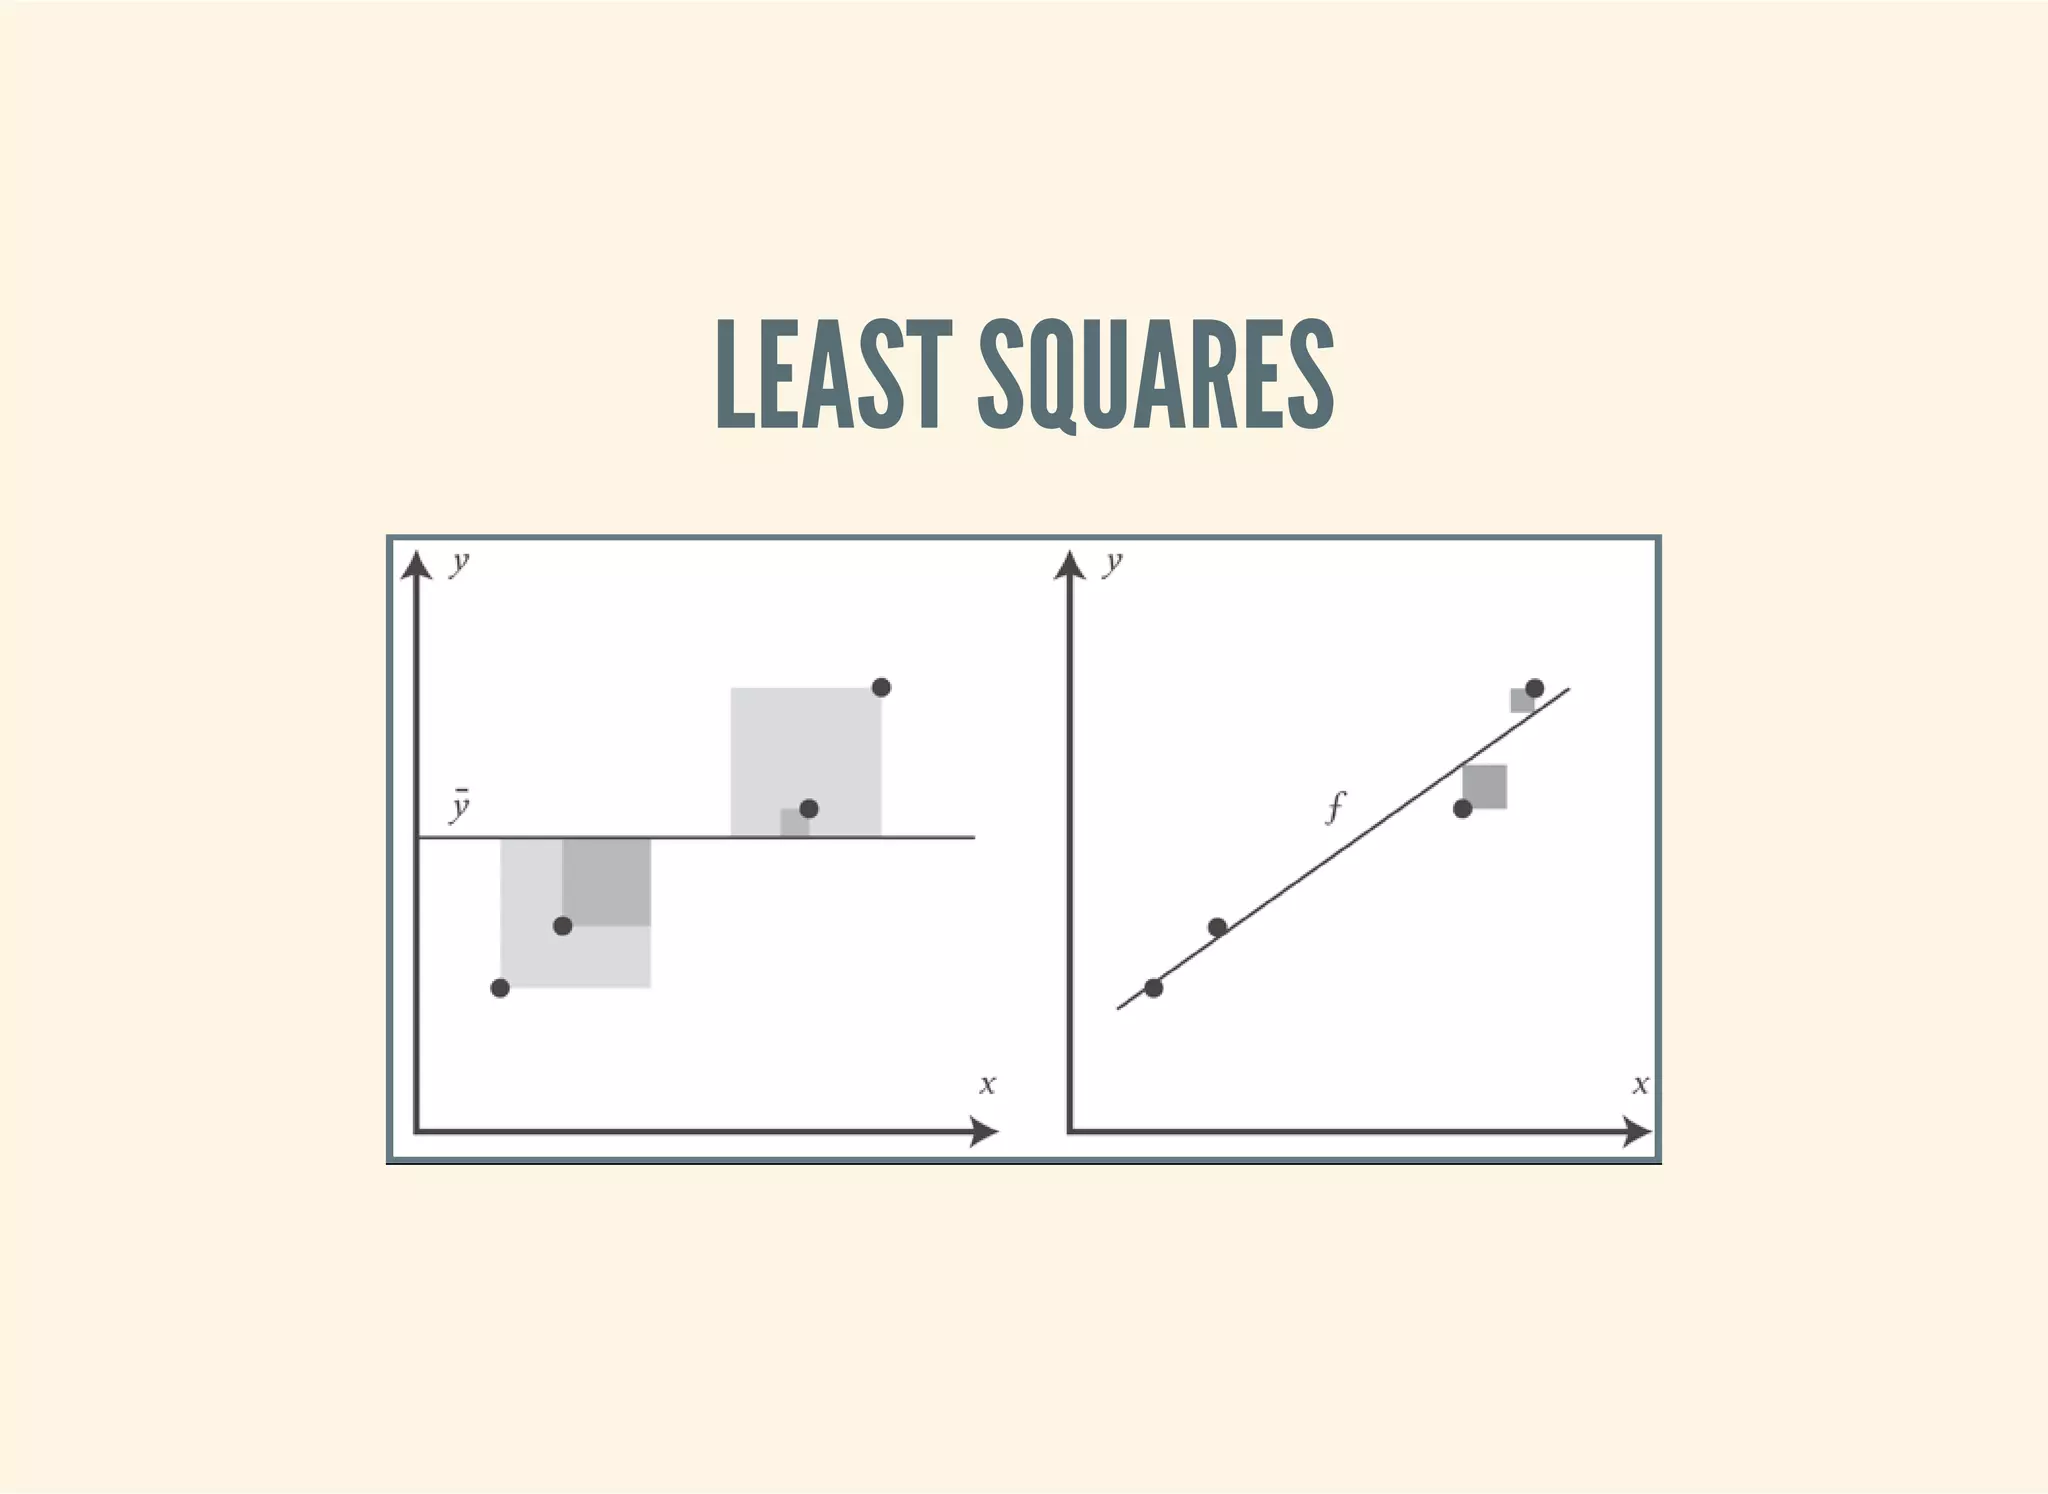
![SIMPLE LINEAR REGRESSION
(defn slope [x y]
(/ (covariance x y)
(variance x)))
(defn intercept [x y]
(- (mean y)
(* (mean x)
(slope x y))))
(defn predict [a b x]
(+ a (* b x)))](https://image.slidesharecdn.com/clojurefordatascience-150903135047-lva1-app6891/75/Clojure-for-Data-Science-71-2048.jpg)
![TRAINING A MODEL
(defn swimmer-data []
(->> (athlete-data)
($where {"Height, cm" {:$ne nil} "Weight" {:$ne nil}
"Sport" {:$eq "Swimming"}})))
(defn ex-3-12 []
(let [data (swimmer-data)
heights ($ "Height, cm" data)
weights (log ($ "Weight" data))
a (intercept heights weights)
b (slope heights weights)]
(println "Intercept: " a)
(println "Slope: " b)))](https://image.slidesharecdn.com/clojurefordatascience-150903135047-lva1-app6891/75/Clojure-for-Data-Science-72-2048.jpg)
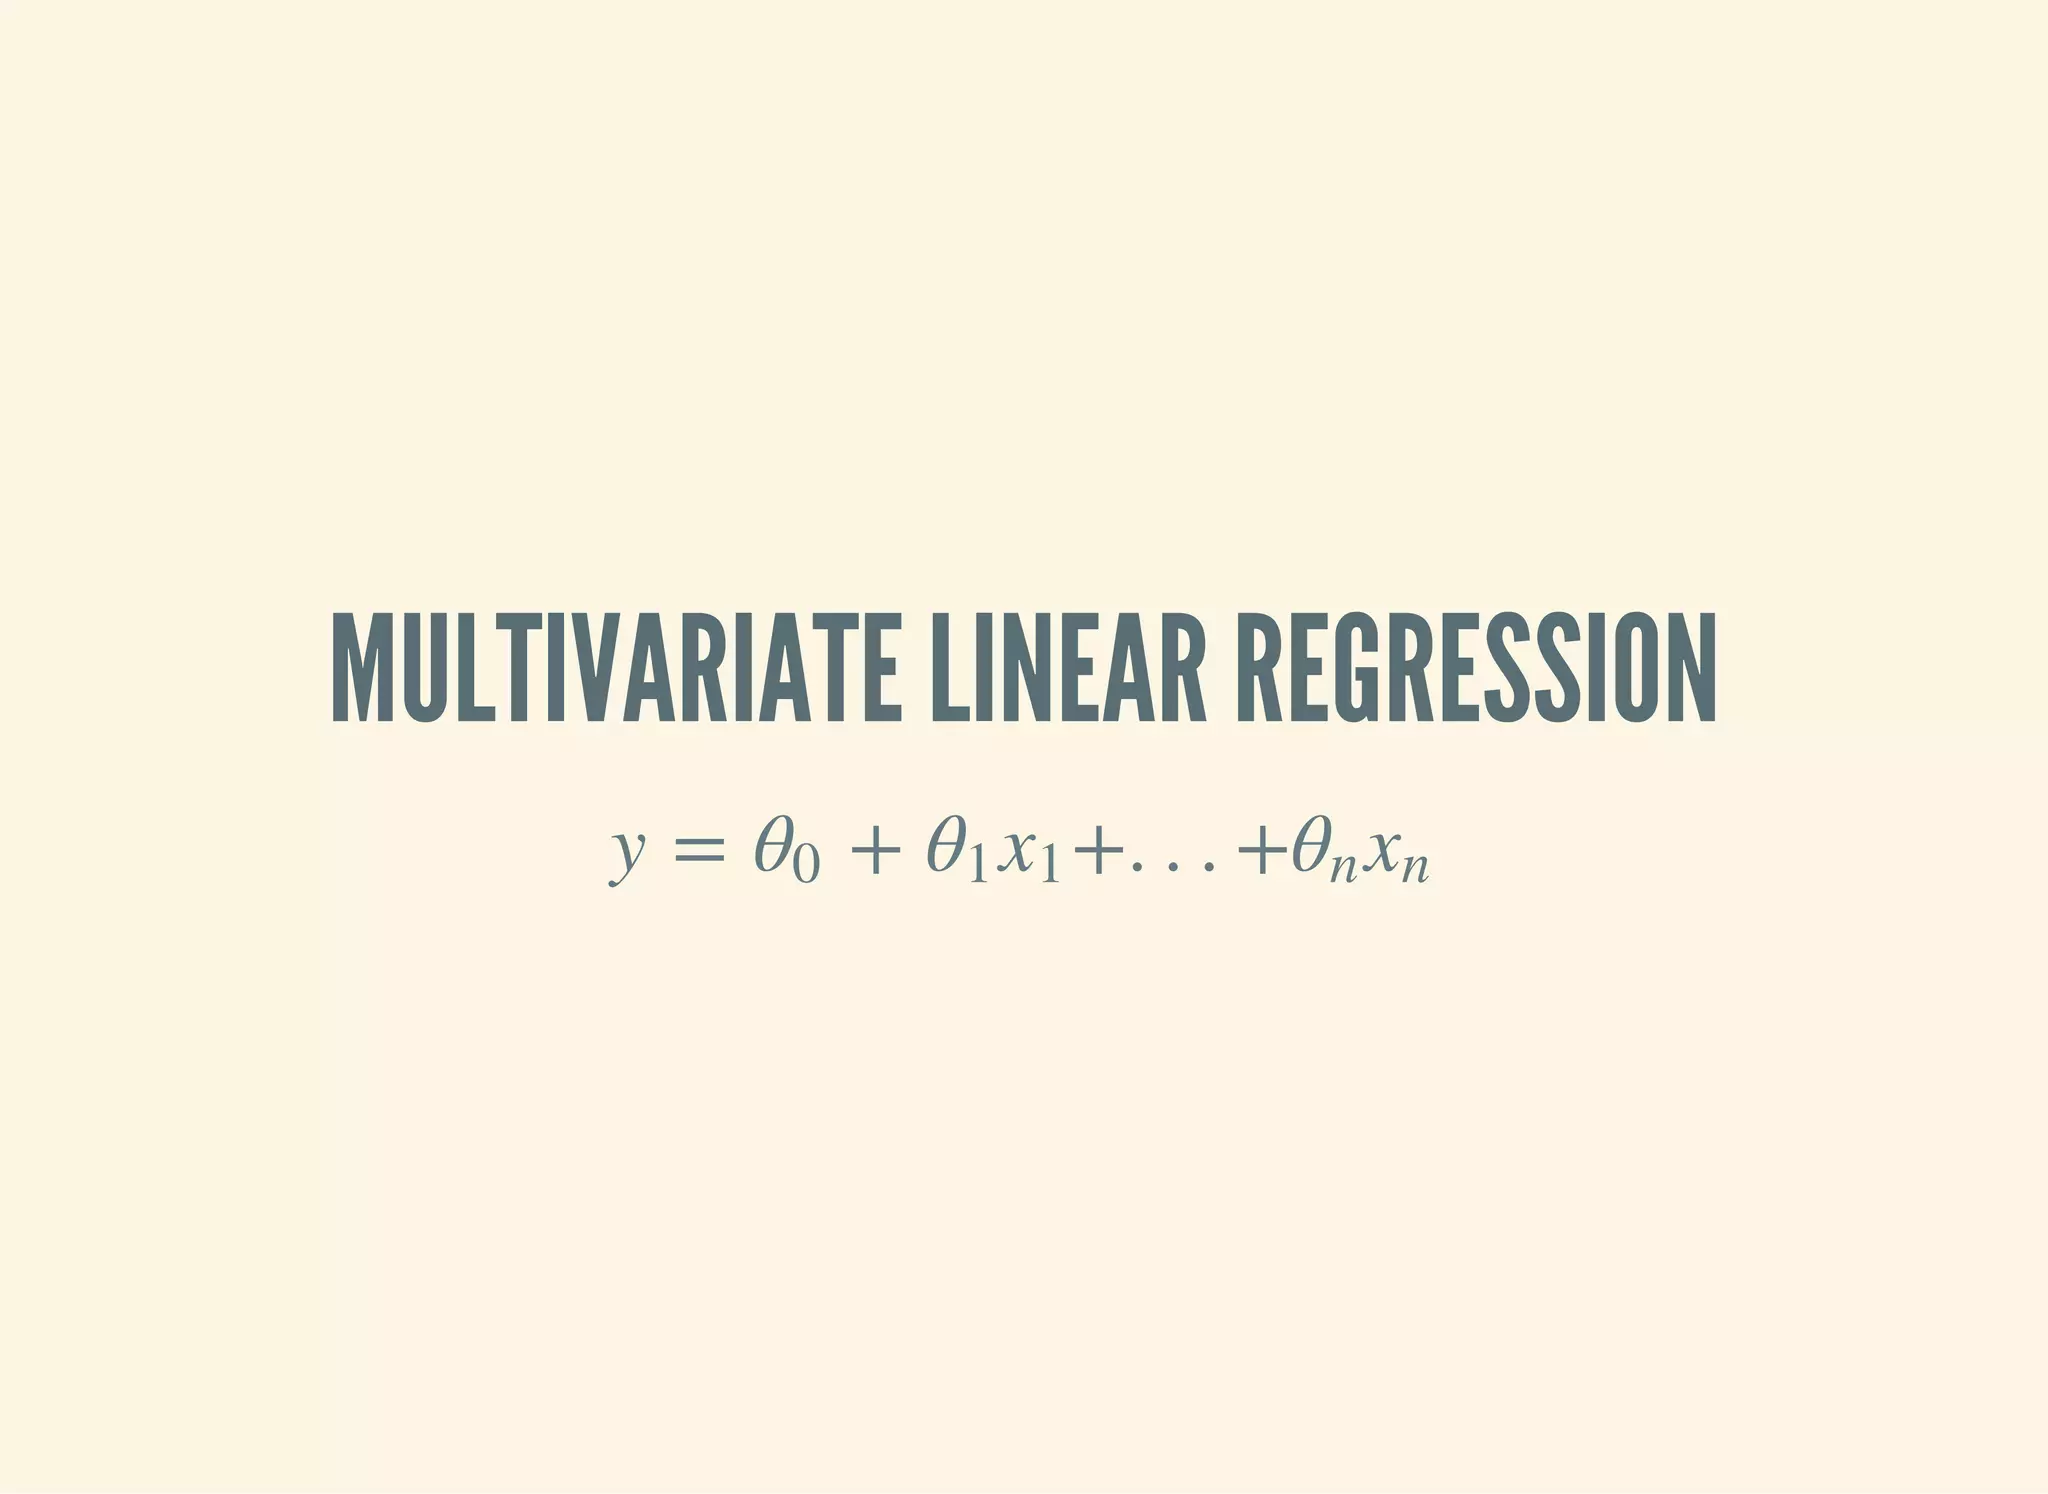
![MORE DATA!
(defn features [dataset col-names]
(->> (i/$ col-names dataset)
(i/to-matrix)))
(defn gender-dummy [gender]
(if (= gender "F")
0.0 1.0))
(defn ex-3-26 []
(let [data (->> (swimmer-data)
(i/add-derived-column "Gender Dummy"
["Sex"] gender-dummy))
x (features data ["Height, cm" "Age" "Gender Dummy"])
y (i/log ($ "Weight" data))
model (s/linear-model y x)]
(:coefs model)))
;; => [2.2307529431422637 0.010714697827121089 0.002372188749408574 0.09
75412532492026]](https://image.slidesharecdn.com/clojurefordatascience-150903135047-lva1-app6891/75/Clojure-for-Data-Science-74-2048.jpg)
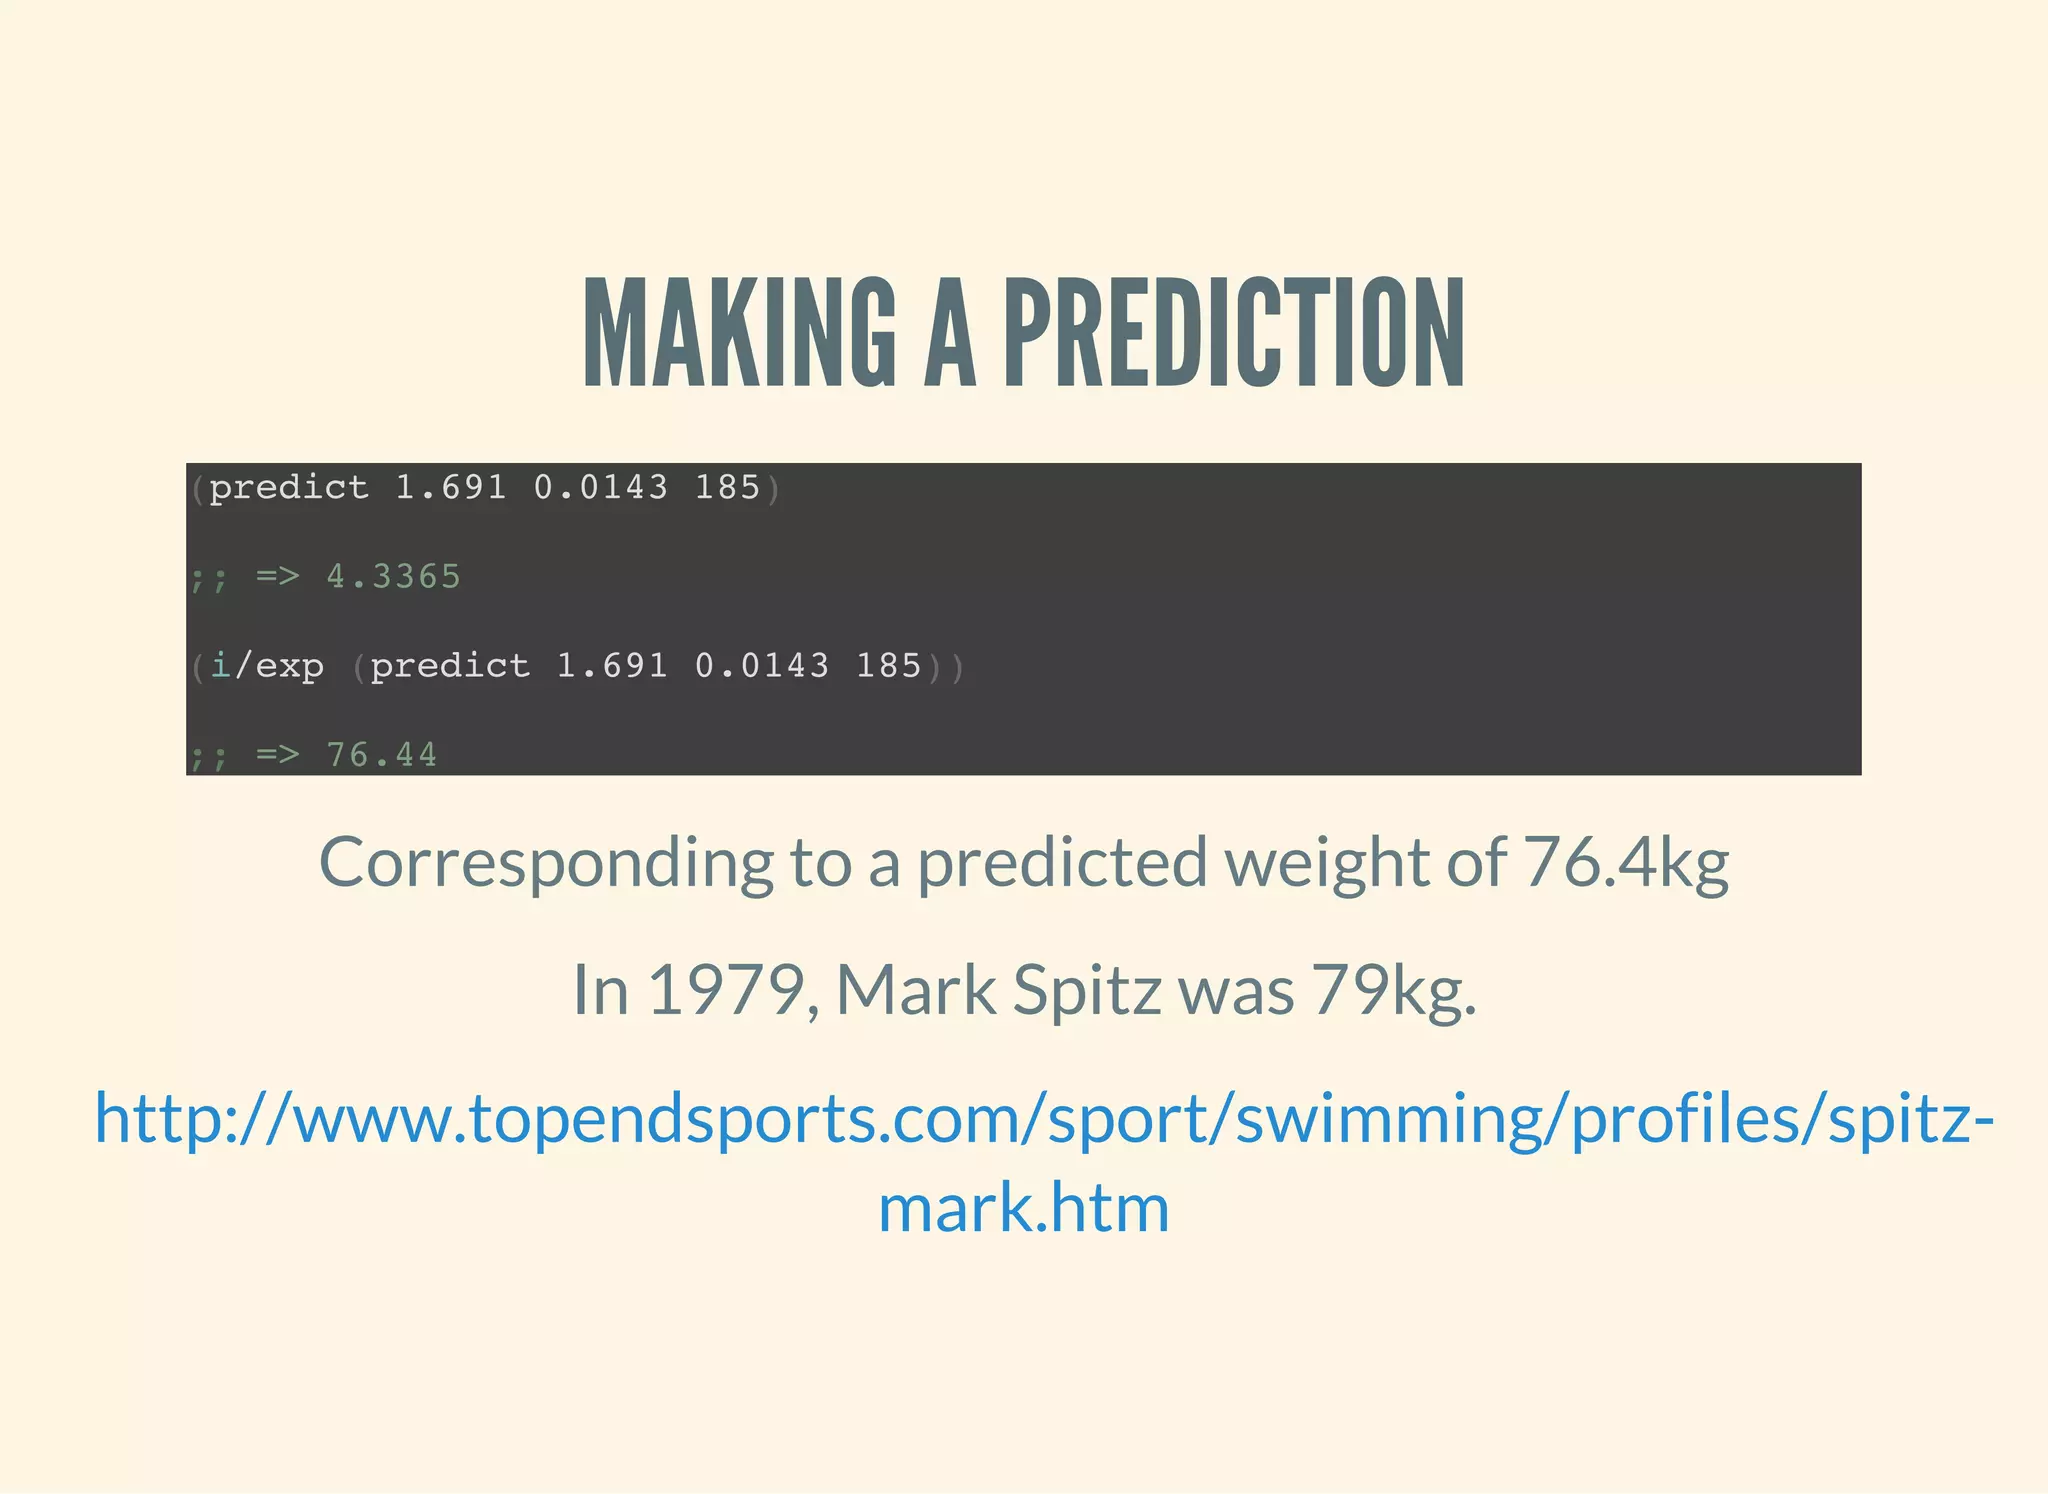
![MAKING PREDICTIONS
y = xθT
(defn predict [theta x]
(-> (cl/t theta)
(cl/* x)
(first)))
(defn ex-3-27 []
(let [data (->> (swimmer-data)
(i/add-derived-column "Gender Dummy"
["Sex"] gender-dummy))
x (features data ["Height, cm" "Age" "Gender Dummy"])
y (i/log ($ "Weight" data))
model (s/linear-model y x)]
(i/exp (predict (i/matrix (:coefs model))
(i/matrix [1 185 22 1])))))
;; => 78.46882772631697](https://image.slidesharecdn.com/clojurefordatascience-150903135047-lva1-app6891/75/Clojure-for-Data-Science-77-2048.jpg)


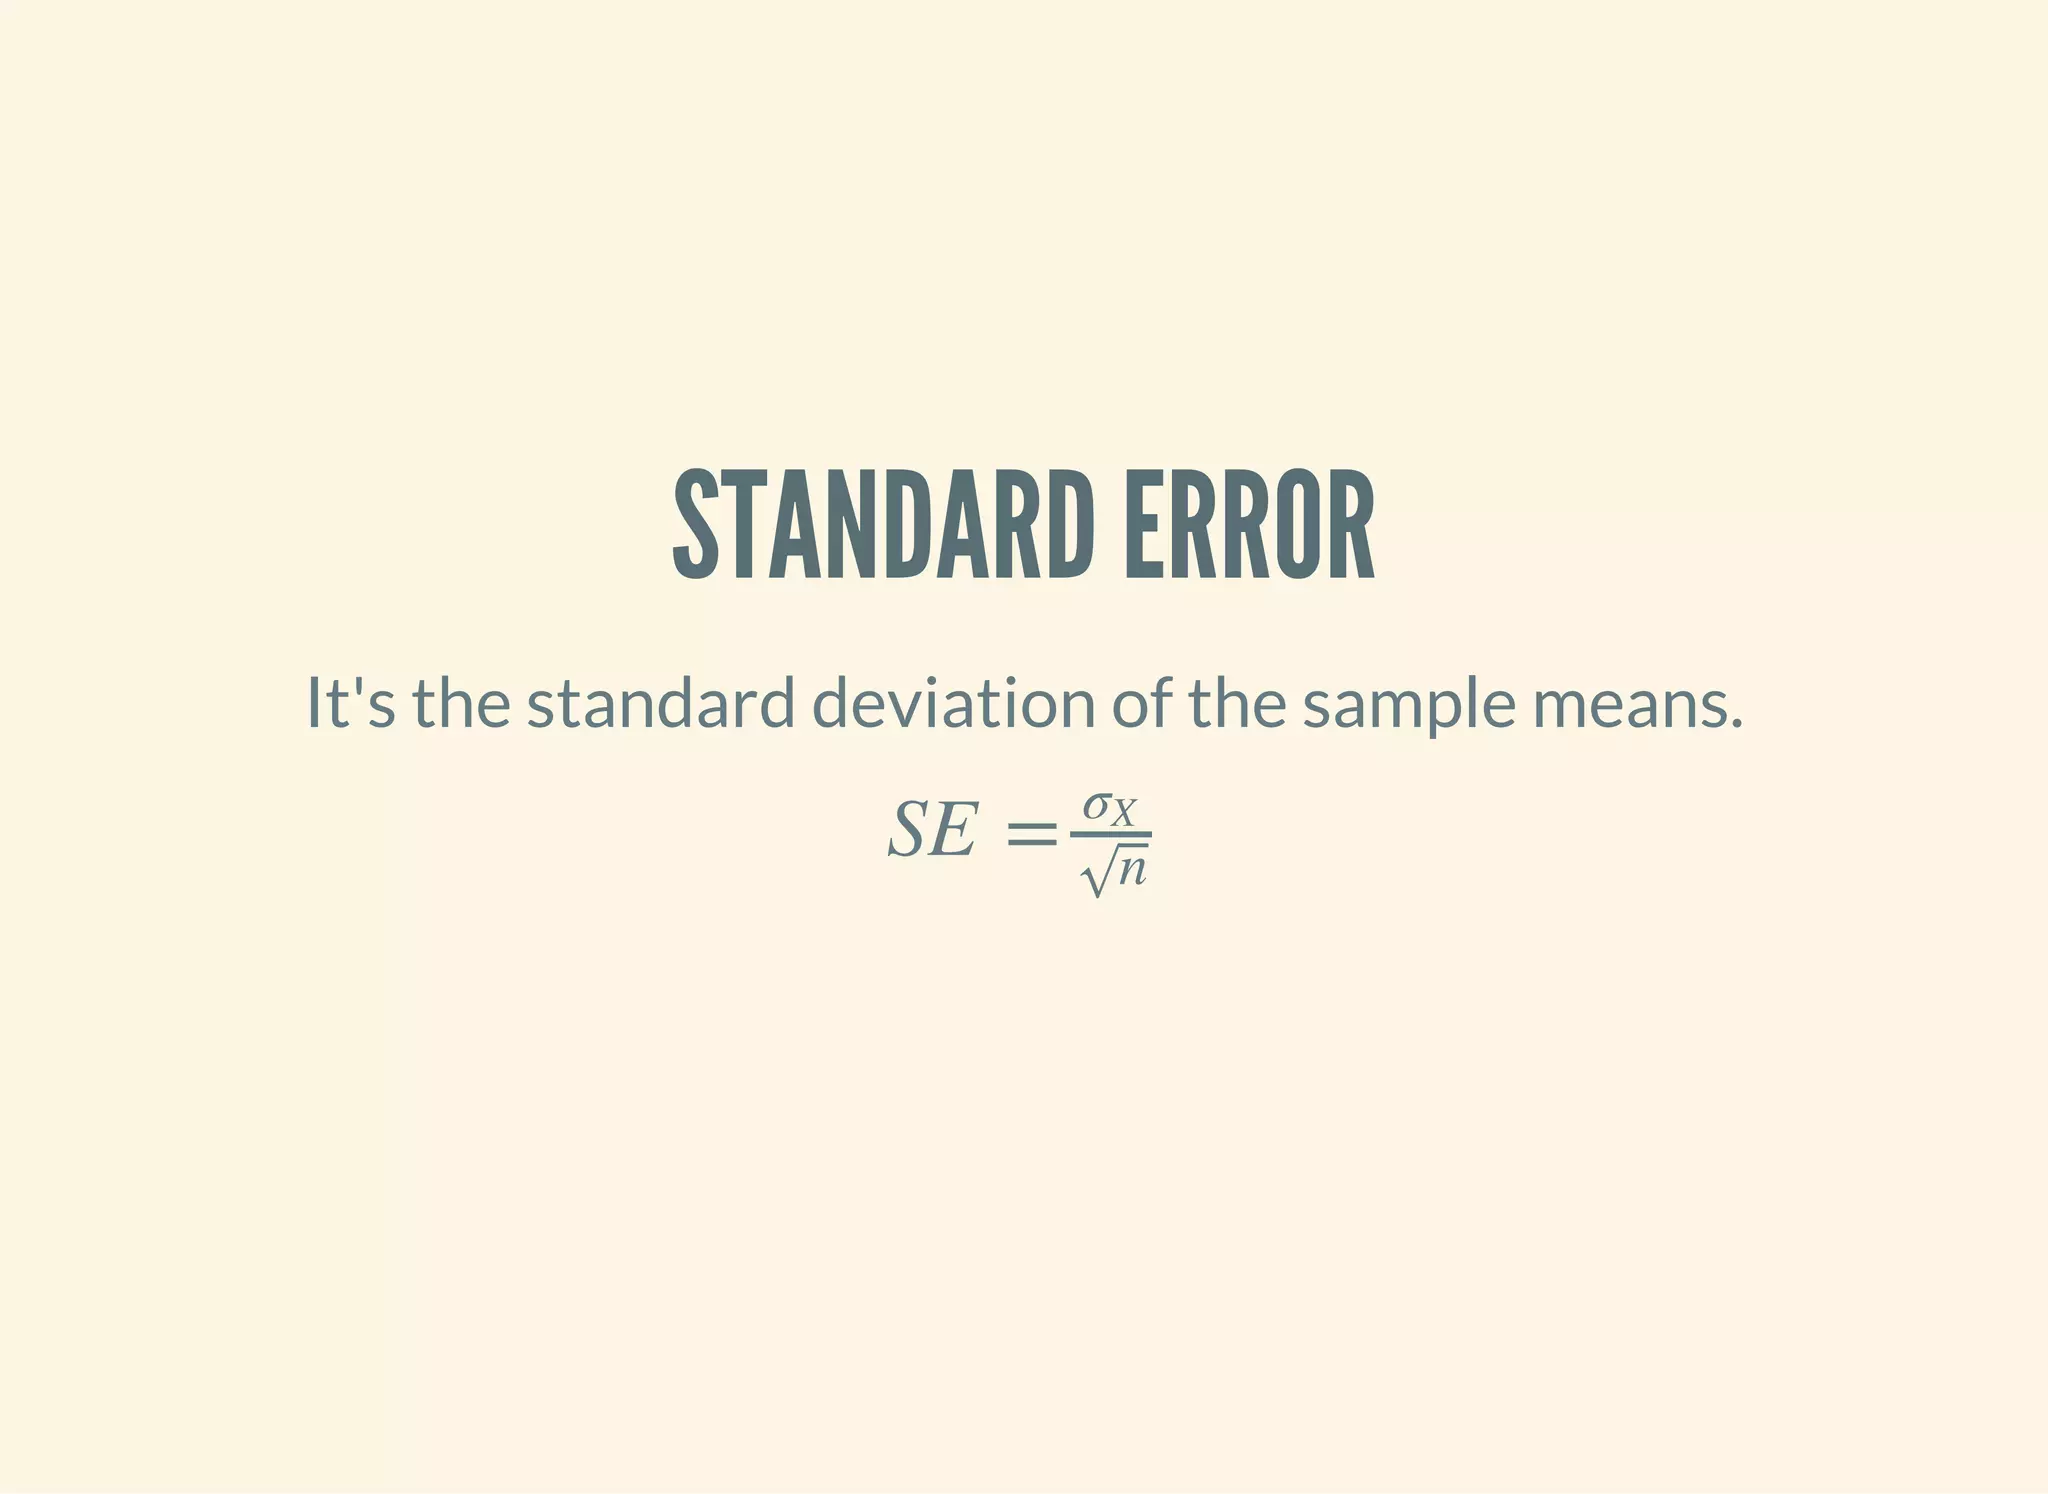
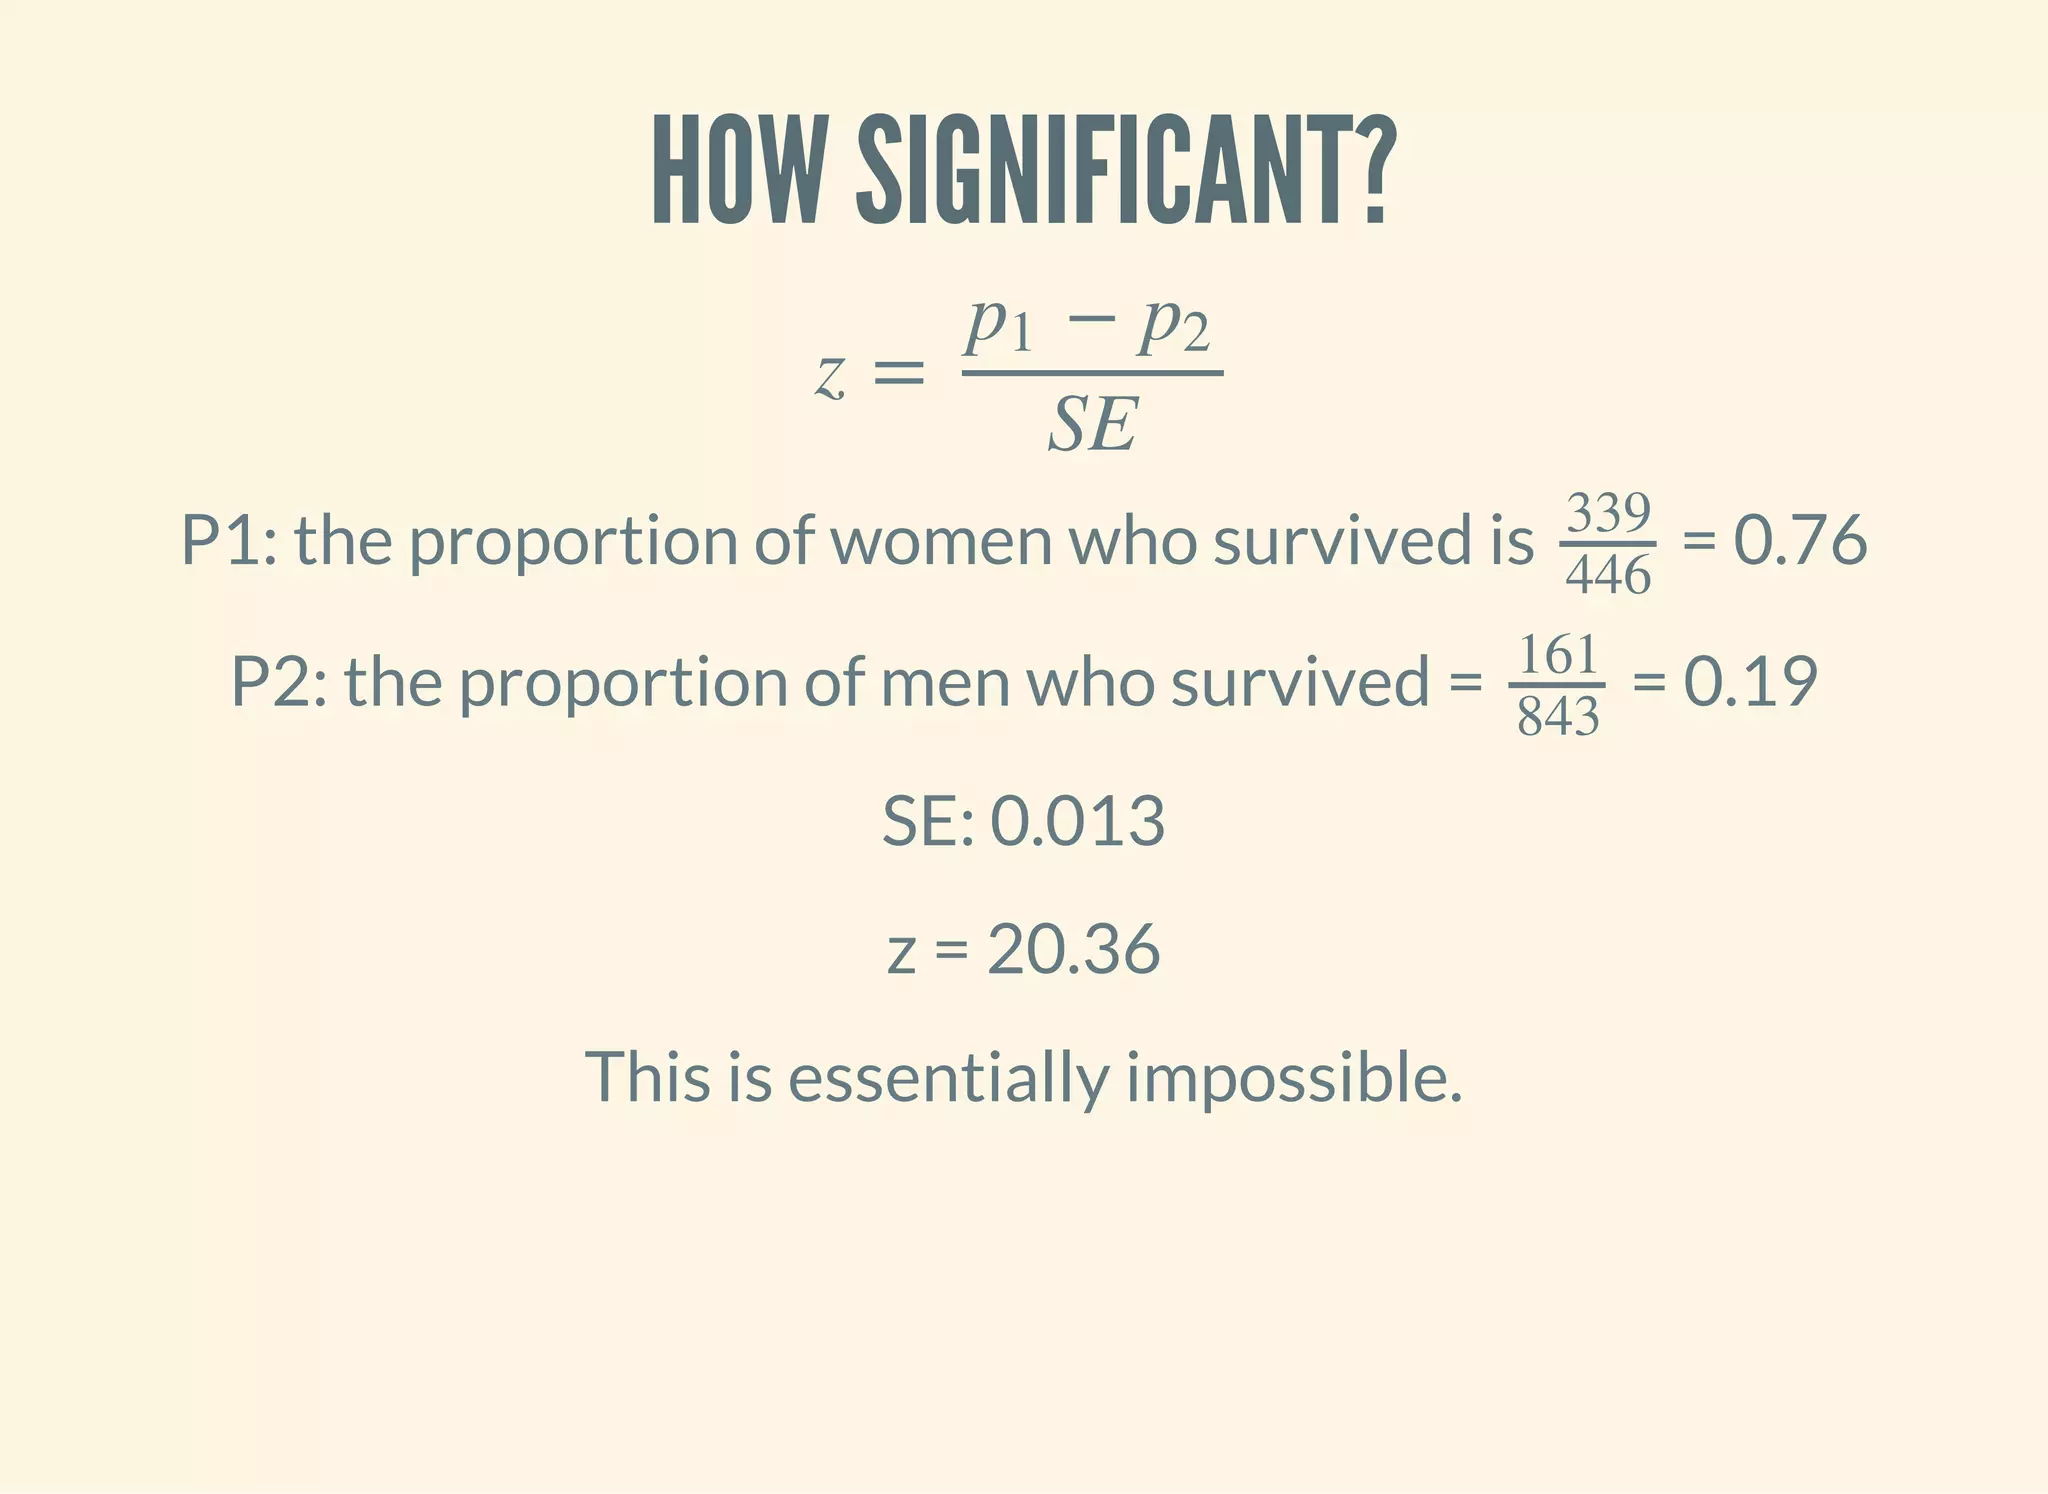
![STANDARD ERROR FOR A PROPORTION
SE =
p(1 − p)
n
‾ ‾‾‾‾‾‾‾‾
√
(defn standard-error-proportion [p n]
(-> (- 1 p)
(* p)
(/ n)
(Math/sqrt)))
= = 0.61
161 + 339
682 + 127
500
809
SE = 0.013](https://image.slidesharecdn.com/clojurefordatascience-150903135047-lva1-app6891/75/Clojure-for-Data-Science-86-2048.jpg)
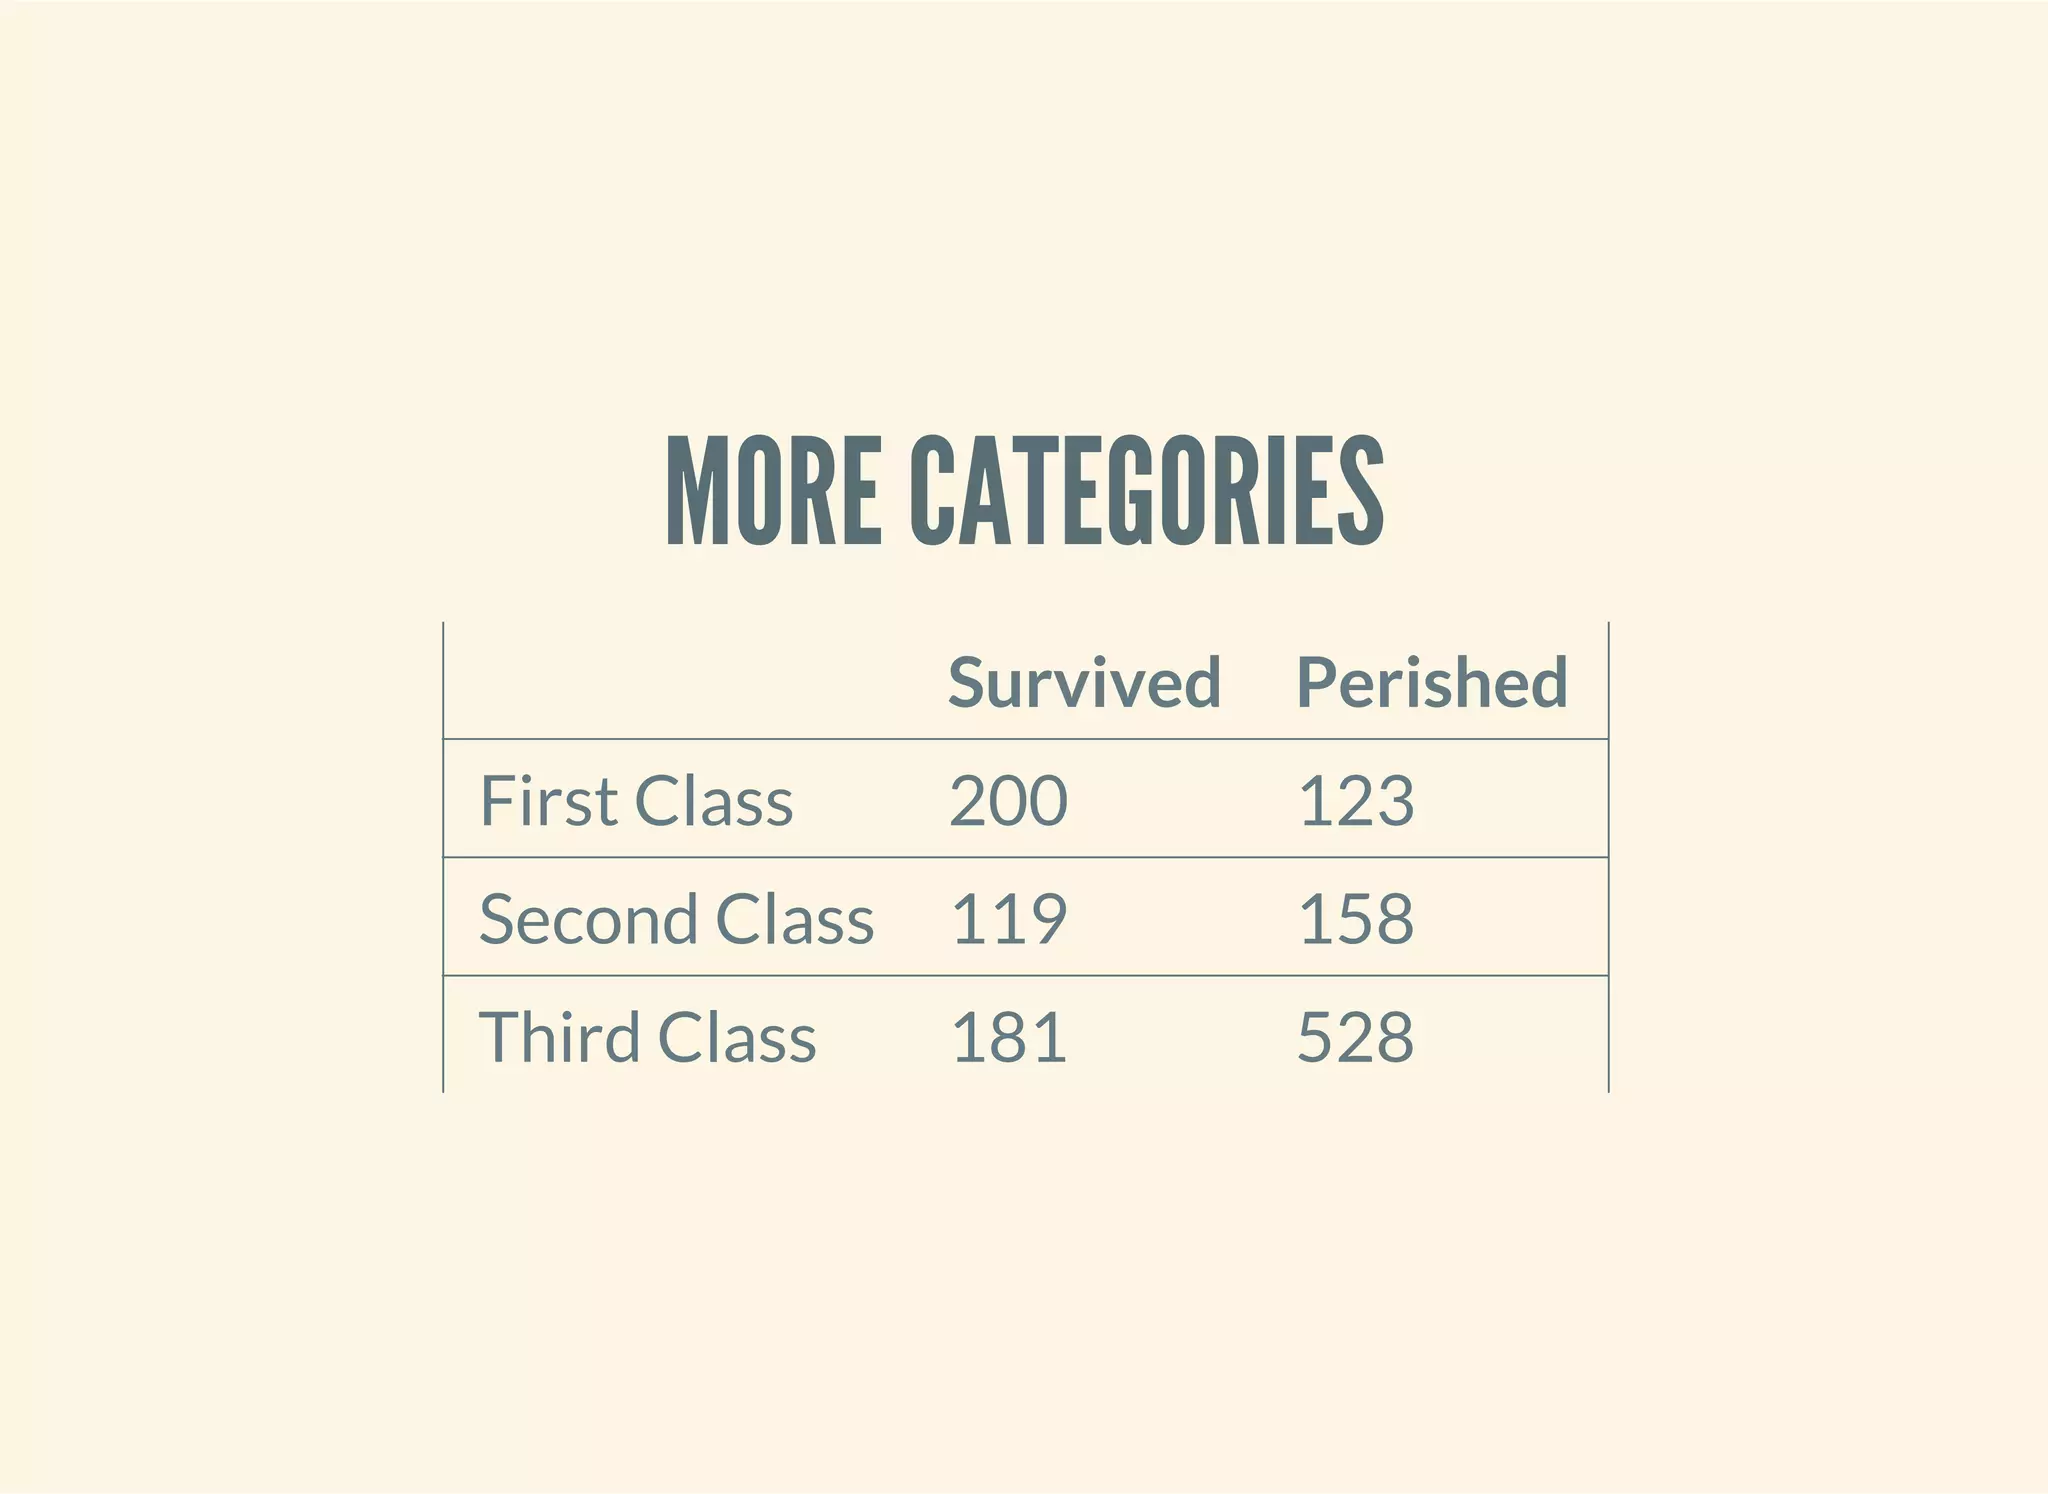
![OUR APPROACH DOESN'T SCALE
We can use a test.χ2
(defn ex-5-5 []
(let [observations (i/matrix [[200 119 181] [123 158 528]])]
(s/chisq-test :table observations)))
How likely is that this distribution occurred via chance?
{:X-sq 127.85915643930326, :col-levels (0 1 2), :row-margins {0 500.0, 1
809.0}, :table [matrix] , :p-value 1.7208259588256175E-28, :df 2, :prob
s nil, :col-margins {0 323.0, 1 277.0, 2 709.0}, :E (123.37662337662337
199.62337662337663 105.80595874713522 171.1940412528648 270.817417876241
4 438.1825821237586), :row-levels (0 1), :two-samp? true, :N 1309.0}](https://image.slidesharecdn.com/clojurefordatascience-150903135047-lva1-app6891/75/Clojure-for-Data-Science-89-2048.jpg)

![IMPLEMENTING A NAIVE BAYES MODEL
(defn safe-inc [v]
(inc (or v 0)))
(defn inc-class-total [model class]
(update-in model [class :total] safe-inc))
(defn inc-predictors-count-fn [row class]
(fn [model attr]
(let [val (get row attr)]
(update-in model [class attr val] safe-inc))))](https://image.slidesharecdn.com/clojurefordatascience-150903135047-lva1-app6891/75/Clojure-for-Data-Science-96-2048.jpg)
![IMPLEMENTING A NAIVE BAYES MODEL
(defn assoc-row-fn [class-attr predictors]
(fn [model row]
(let [class (get row class-attr)]
(reduce (inc-predictors-count-fn row class)
(inc-class-total model class)
predictors))))
(defn naive-bayes [data class-attr predictors]
(reduce (assoc-row-fn class-attr predictors) {} data))](https://image.slidesharecdn.com/clojurefordatascience-150903135047-lva1-app6891/75/Clojure-for-Data-Science-97-2048.jpg)
![NAIVE BAYES MODEL
(defn ex-5-6 []
(let [data (titanic-samples)]
(pprint (naive-bayes data :survived [:gender :class]))))
…produces the following output…
;; {false
;; {:class {:third 528, :second 158, :first 123},
;; :gender {:male 682, :female 127},
;; :total 809},
;; true
;; {:class {:third 181, :second 119, :first 198},
;; :gender {:male 161, :female 337},
;; :total 498}}](https://image.slidesharecdn.com/clojurefordatascience-150903135047-lva1-app6891/75/Clojure-for-Data-Science-98-2048.jpg)
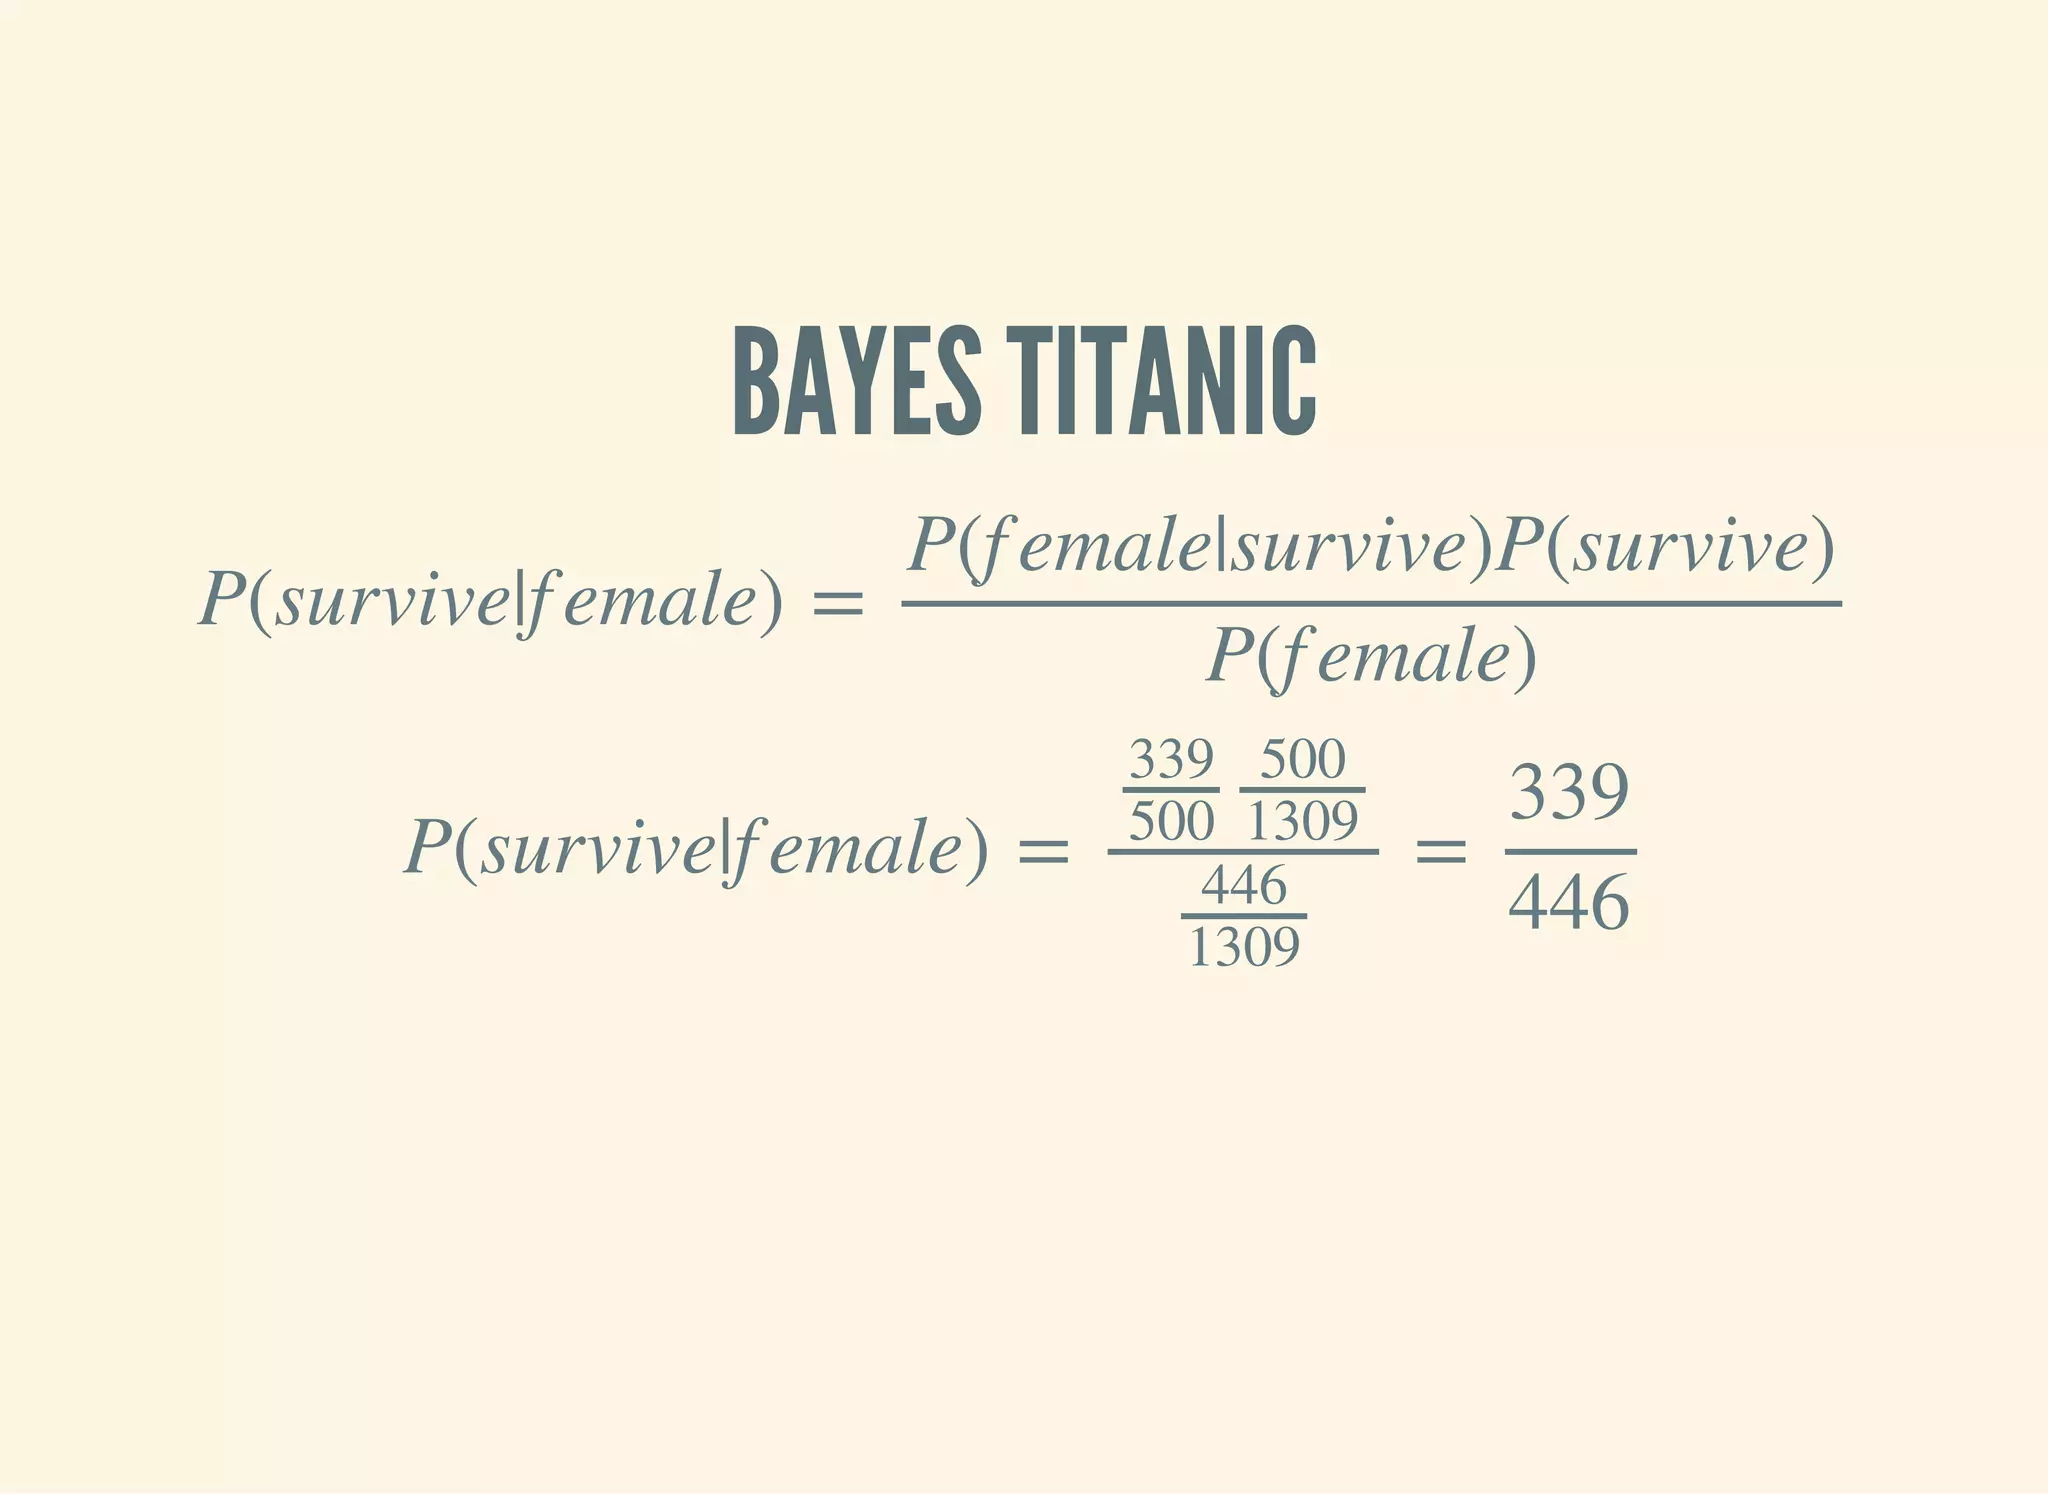
![MAKING PREDICTIONS
(defn n [model]
(->> (vals model)
(map :total)
(apply +)))
(defn conditional-probability [model test class]
(let [evidence (get model class)
prior (/ (:total evidence)
(n model))]
(apply * prior
(for [kv test]
(/ (get-in evidence kv)
(:total evidence))))))
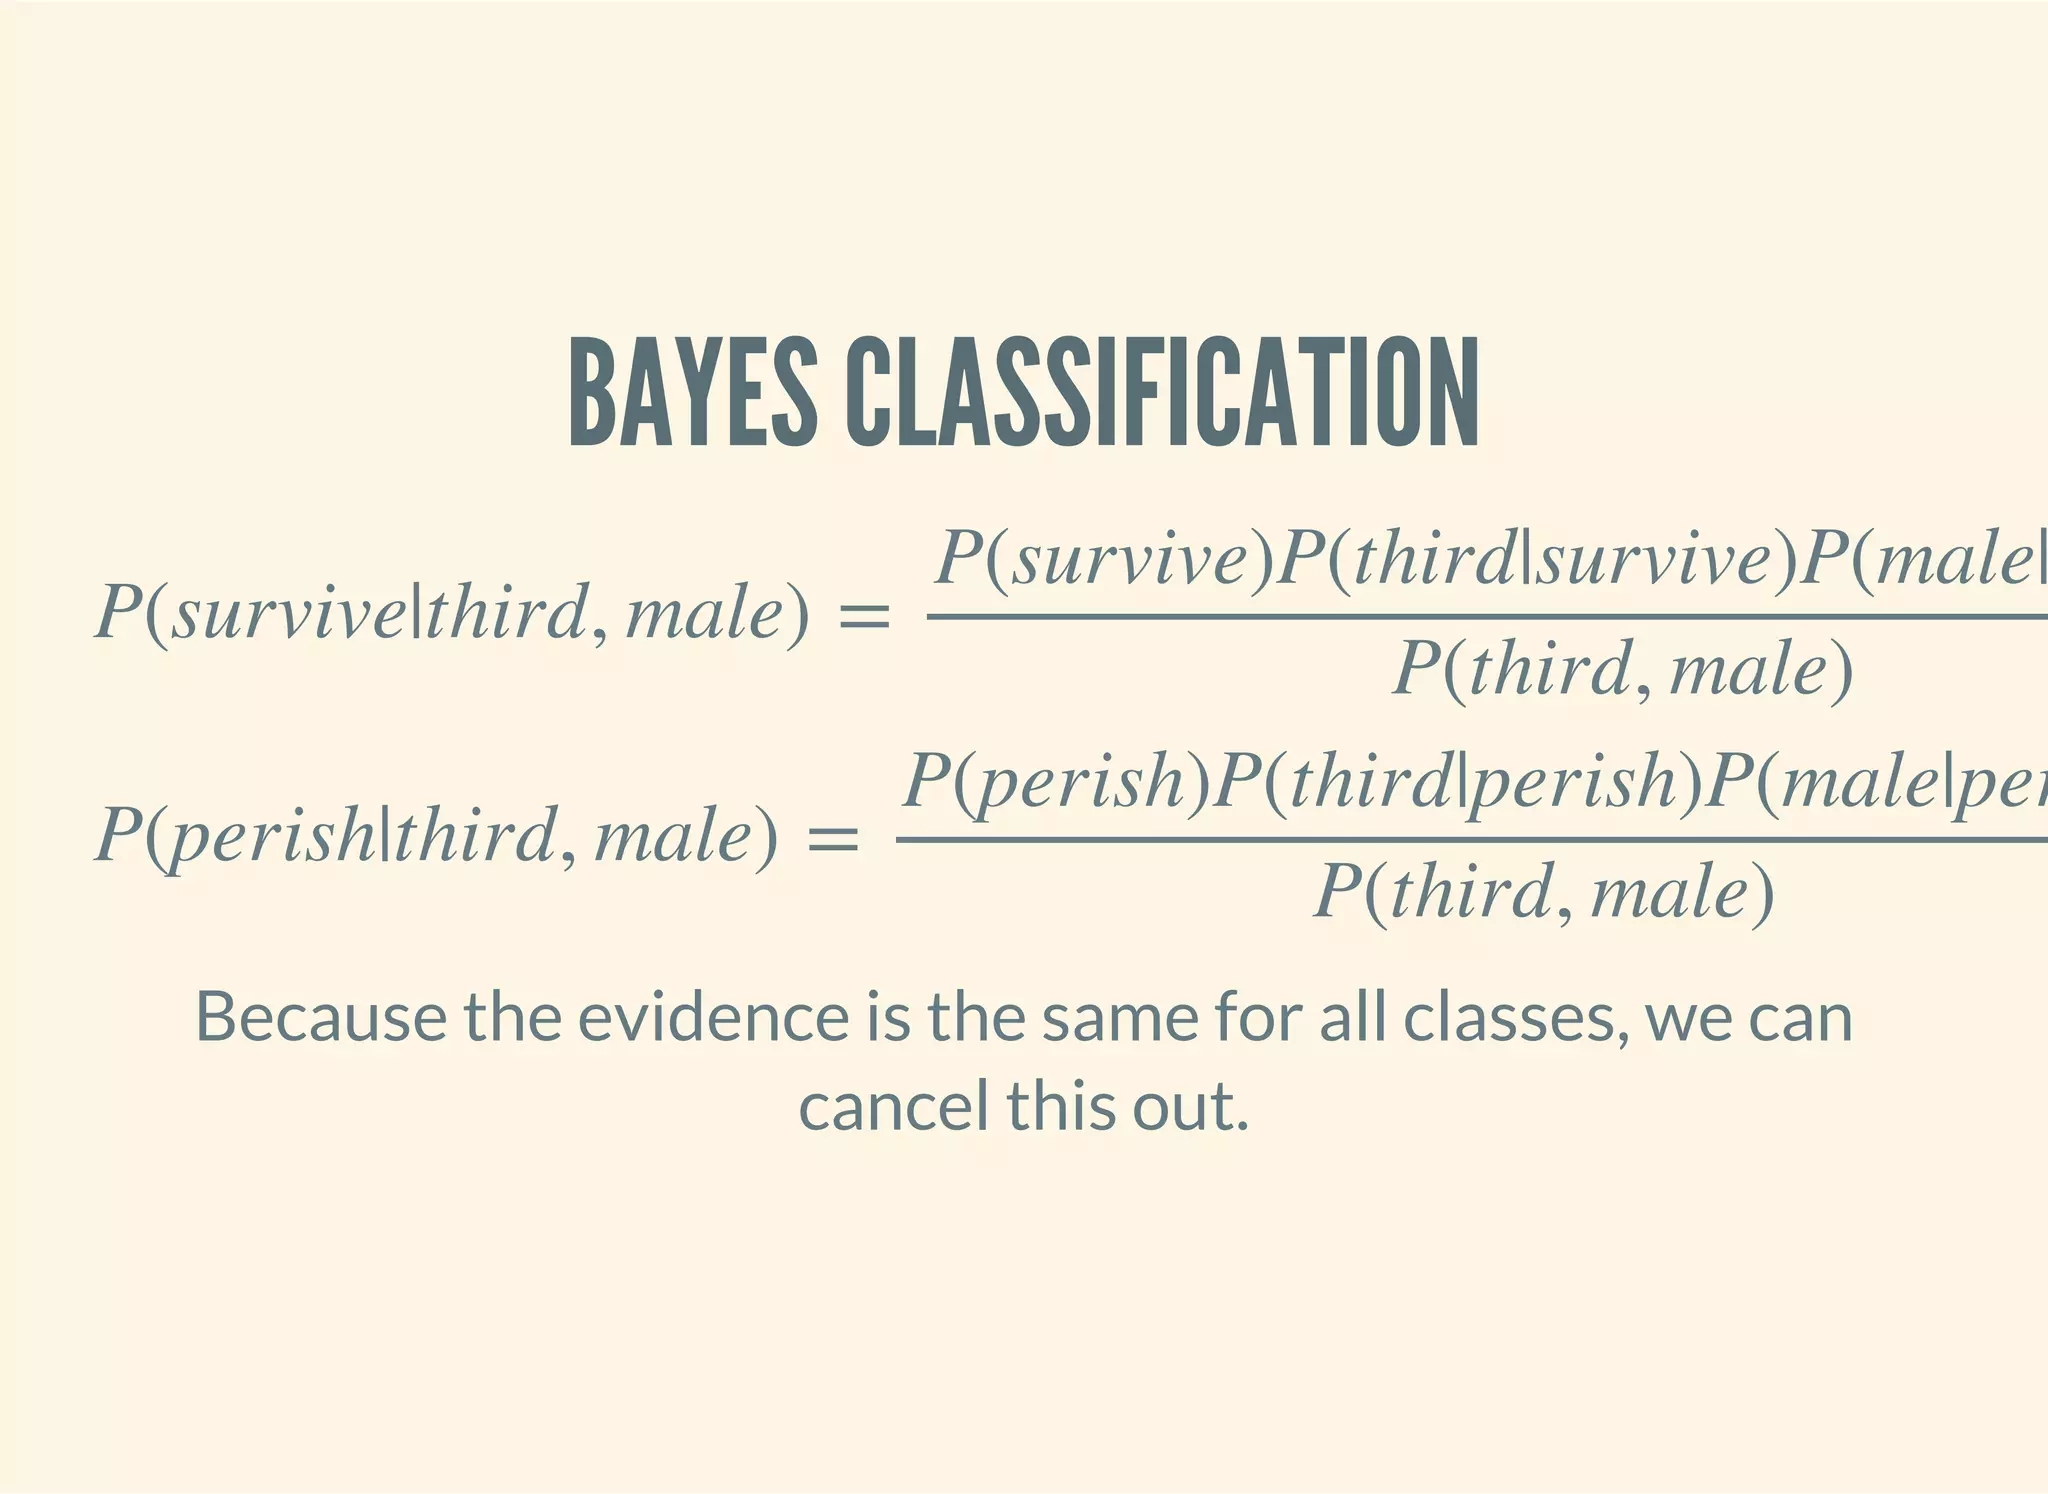
(defn bayes-classify [model test]
(let [probs (map (fn [class]
[class (conditional-probability model test class)])
(keys model))]
(-> (sort-by second > probs)
(ffirst))))](https://image.slidesharecdn.com/clojurefordatascience-150903135047-lva1-app6891/75/Clojure-for-Data-Science-99-2048.jpg)
![DOES IT WORK?
(defn ex-5-7 []
(let [data (titanic-samples)
model (naive-bayes data :survived [:gender :class])]
(bayes-classify model {:gender :male :class :third})))
;; => false
(defn ex-5-8 []
(let [data (titanic-samples)
model (naive-bayes data :survived [:gender :class])]
(bayes-classify model {:gender :female :class :first})))
;; => true](https://image.slidesharecdn.com/clojurefordatascience-150903135047-lva1-app6891/75/Clojure-for-Data-Science-100-2048.jpg)

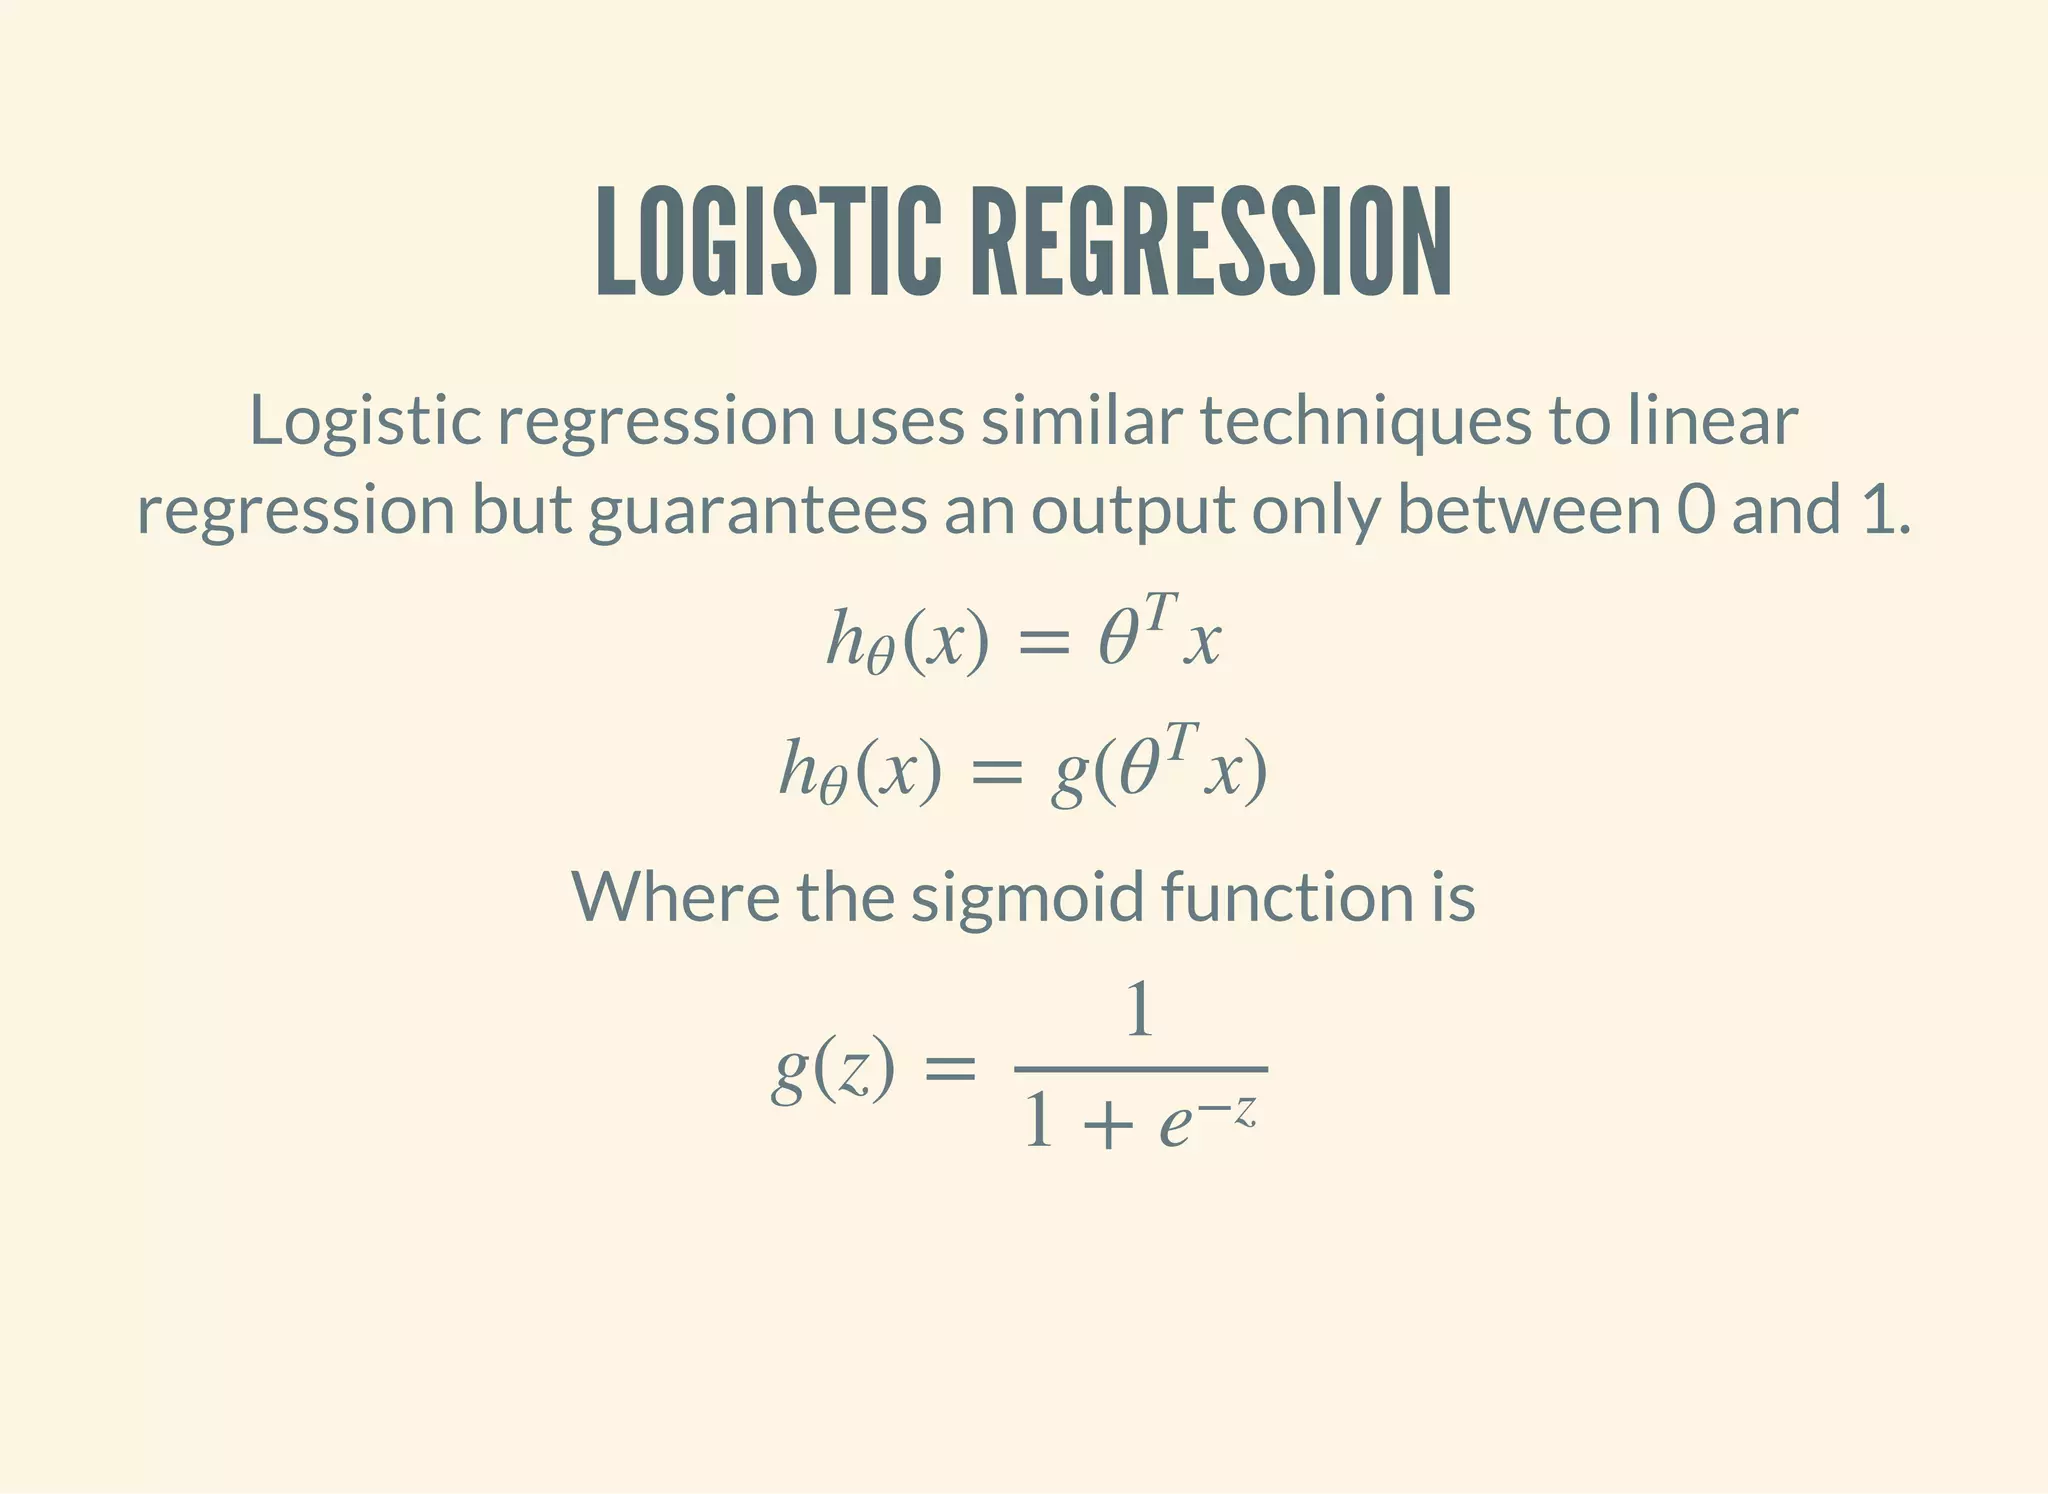
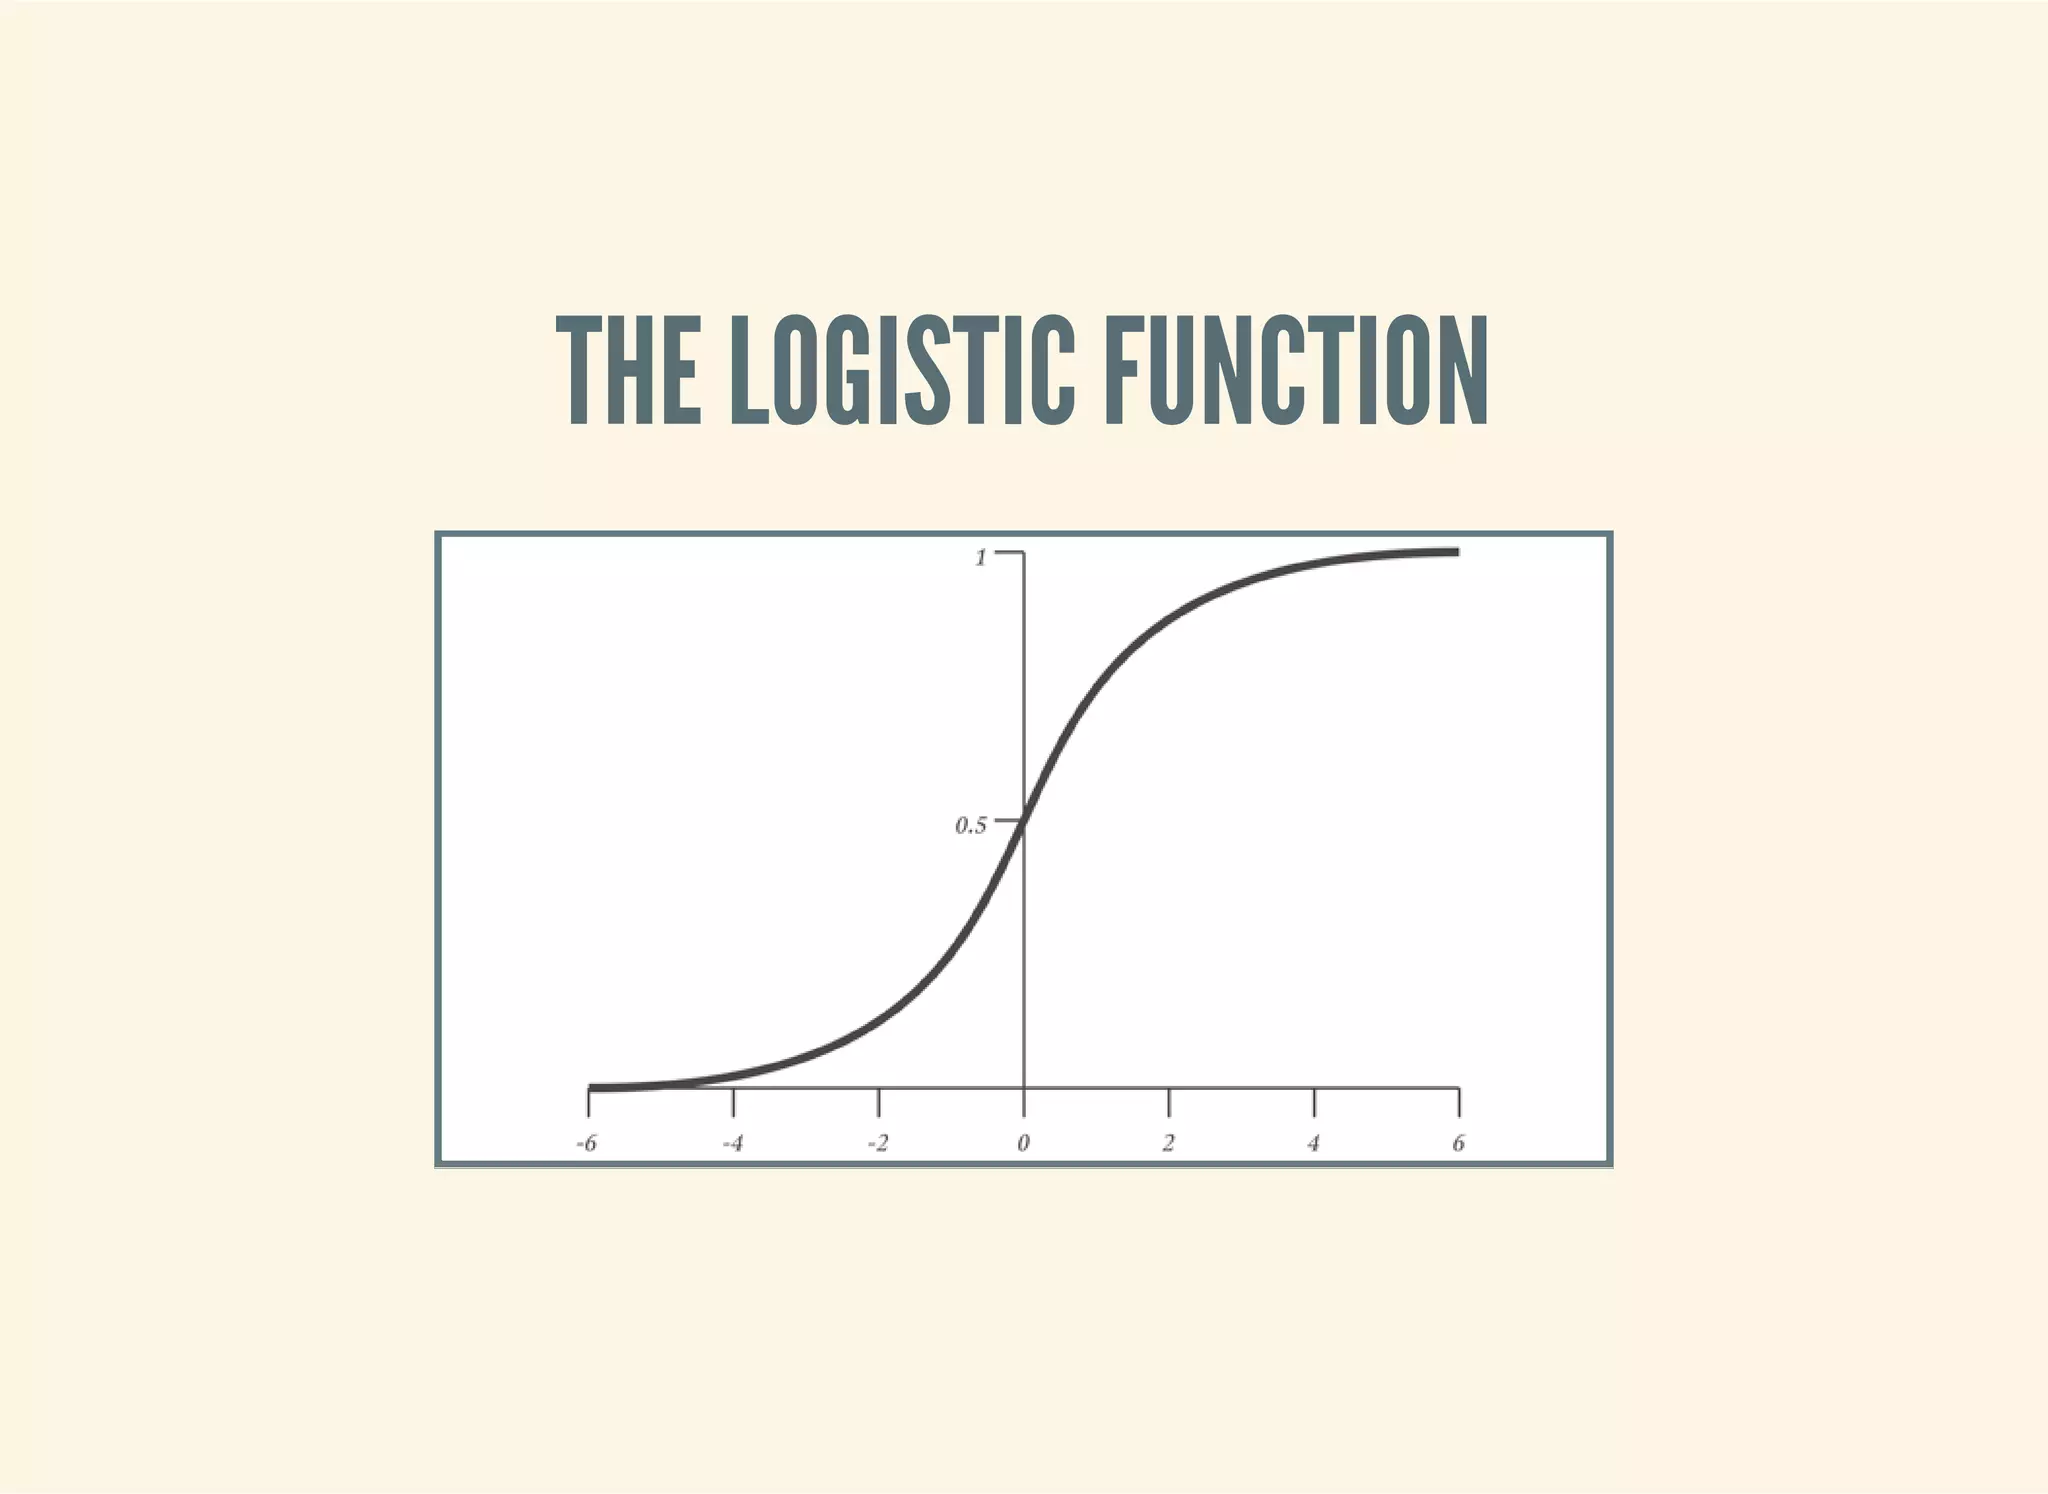
![THE LOGISTIC FUNCTION
(defn logistic-function [theta]
(let [tt (matrix/transpose (vec theta))
z (fn [x] (- (matrix/mmul tt (vec x))))]
(fn [x]
(/ 1 (+ 1 (Math/exp (z x)))))))](https://image.slidesharecdn.com/clojurefordatascience-150903135047-lva1-app6891/75/Clojure-for-Data-Science-105-2048.jpg)
![INTERPRETATION
(let [f (logistic-function [0])]
(f [1])
;; => 0.5
(f [-1])
;; => 0.5
(f [42])
;; => 0.5
)
(let [f (logistic-function [0.2])
g (logistic-function [-0.2])]
(f [5])
;; => 0.73
(g [5])
;; => 0.27
)](https://image.slidesharecdn.com/clojurefordatascience-150903135047-lva1-app6891/75/Clojure-for-Data-Science-106-2048.jpg)
![COST FUNCTION
Cost varies between 0 and (a big number).
(defn cost-function [y y-hat]
(- (if (zero? y)
(Math/log (max (- 1 y-hat) Double/MIN_VALUE))
(Math/log (max y-hat (Double/MIN_VALUE))))))
(defn logistic-cost [ys y-hats]
(avg (map cost-function ys y-hats)))](https://image.slidesharecdn.com/clojurefordatascience-150903135047-lva1-app6891/75/Clojure-for-Data-Science-107-2048.jpg)
![CONVERTING TITANIC DATA TO FEATURES
(defn titanic-features []
(remove (partial some nil?)
(for [row (titanic-data)]
[(:survived row)
(:pclass row)
(:sibsp row)
(:parch row)
(if (nil? (:age row)) 30 (:age row))
(if (= (:sex row) "female") 1.0 0.0)
(if (= (:embarked row) "S") 1.0 0.0)
(if (= (:embarked row) "C") 1.0 0.0)
(if (= (:embarked row) "Q") 1.0 0.0)])))](https://image.slidesharecdn.com/clojurefordatascience-150903135047-lva1-app6891/75/Clojure-for-Data-Science-108-2048.jpg)
![CALCULATING THE GRADIENT
(defn gradient-fn [h-theta xs ys]
(let [g (fn [x y]
(matrix/mmul (- (h-theta x) y) x))]
(->> (map g xs ys)
(matrix/transpose)
(map avg))))
We transpose to calculate the average for each feature
across all xs rather than average for each x across all
features.](https://image.slidesharecdn.com/clojurefordatascience-150903135047-lva1-app6891/75/Clojure-for-Data-Science-109-2048.jpg)
![APACHE COMMONS MATH
Provides heavy-lifting for running tasks like gradient descent.
(:import [org.apache.commons.math3.analysis MultivariateFunction Multiva
riateVectorFunction]
[org.apache.commons.math3.optim InitialGuess MaxEval SimpleBoun
ds OptimizationData SimpleValueChecker PointValuePair]
[org.apache.commons.math3.optim.nonlinear.scalar ObjectiveFunct
ion ObjectiveFunctionGradient GoalType]
[org.apache.commons.math3.optim.nonlinear.scalar.gradient NonLi
nearConjugateGradientOptimizer NonLinearConjugateGradientOptimizer$Formu
la])](https://image.slidesharecdn.com/clojurefordatascience-150903135047-lva1-app6891/75/Clojure-for-Data-Science-111-2048.jpg)
![CLOJURE'S JAVA INTEROP
An object wrapper to represent a function: too many levels of
indirection?!
(defn objective-function [f]
(ObjectiveFunction. (reify MultivariateFunction
(value [_ v]
(apply f (vec v))))))
(defn objective-function-gradient [f]
(ObjectiveFunctionGradient. (reify MultivariateVectorFunction
(value [_ v]
(double-array
(apply f (vec v)))))))](https://image.slidesharecdn.com/clojurefordatascience-150903135047-lva1-app6891/75/Clojure-for-Data-Science-112-2048.jpg)
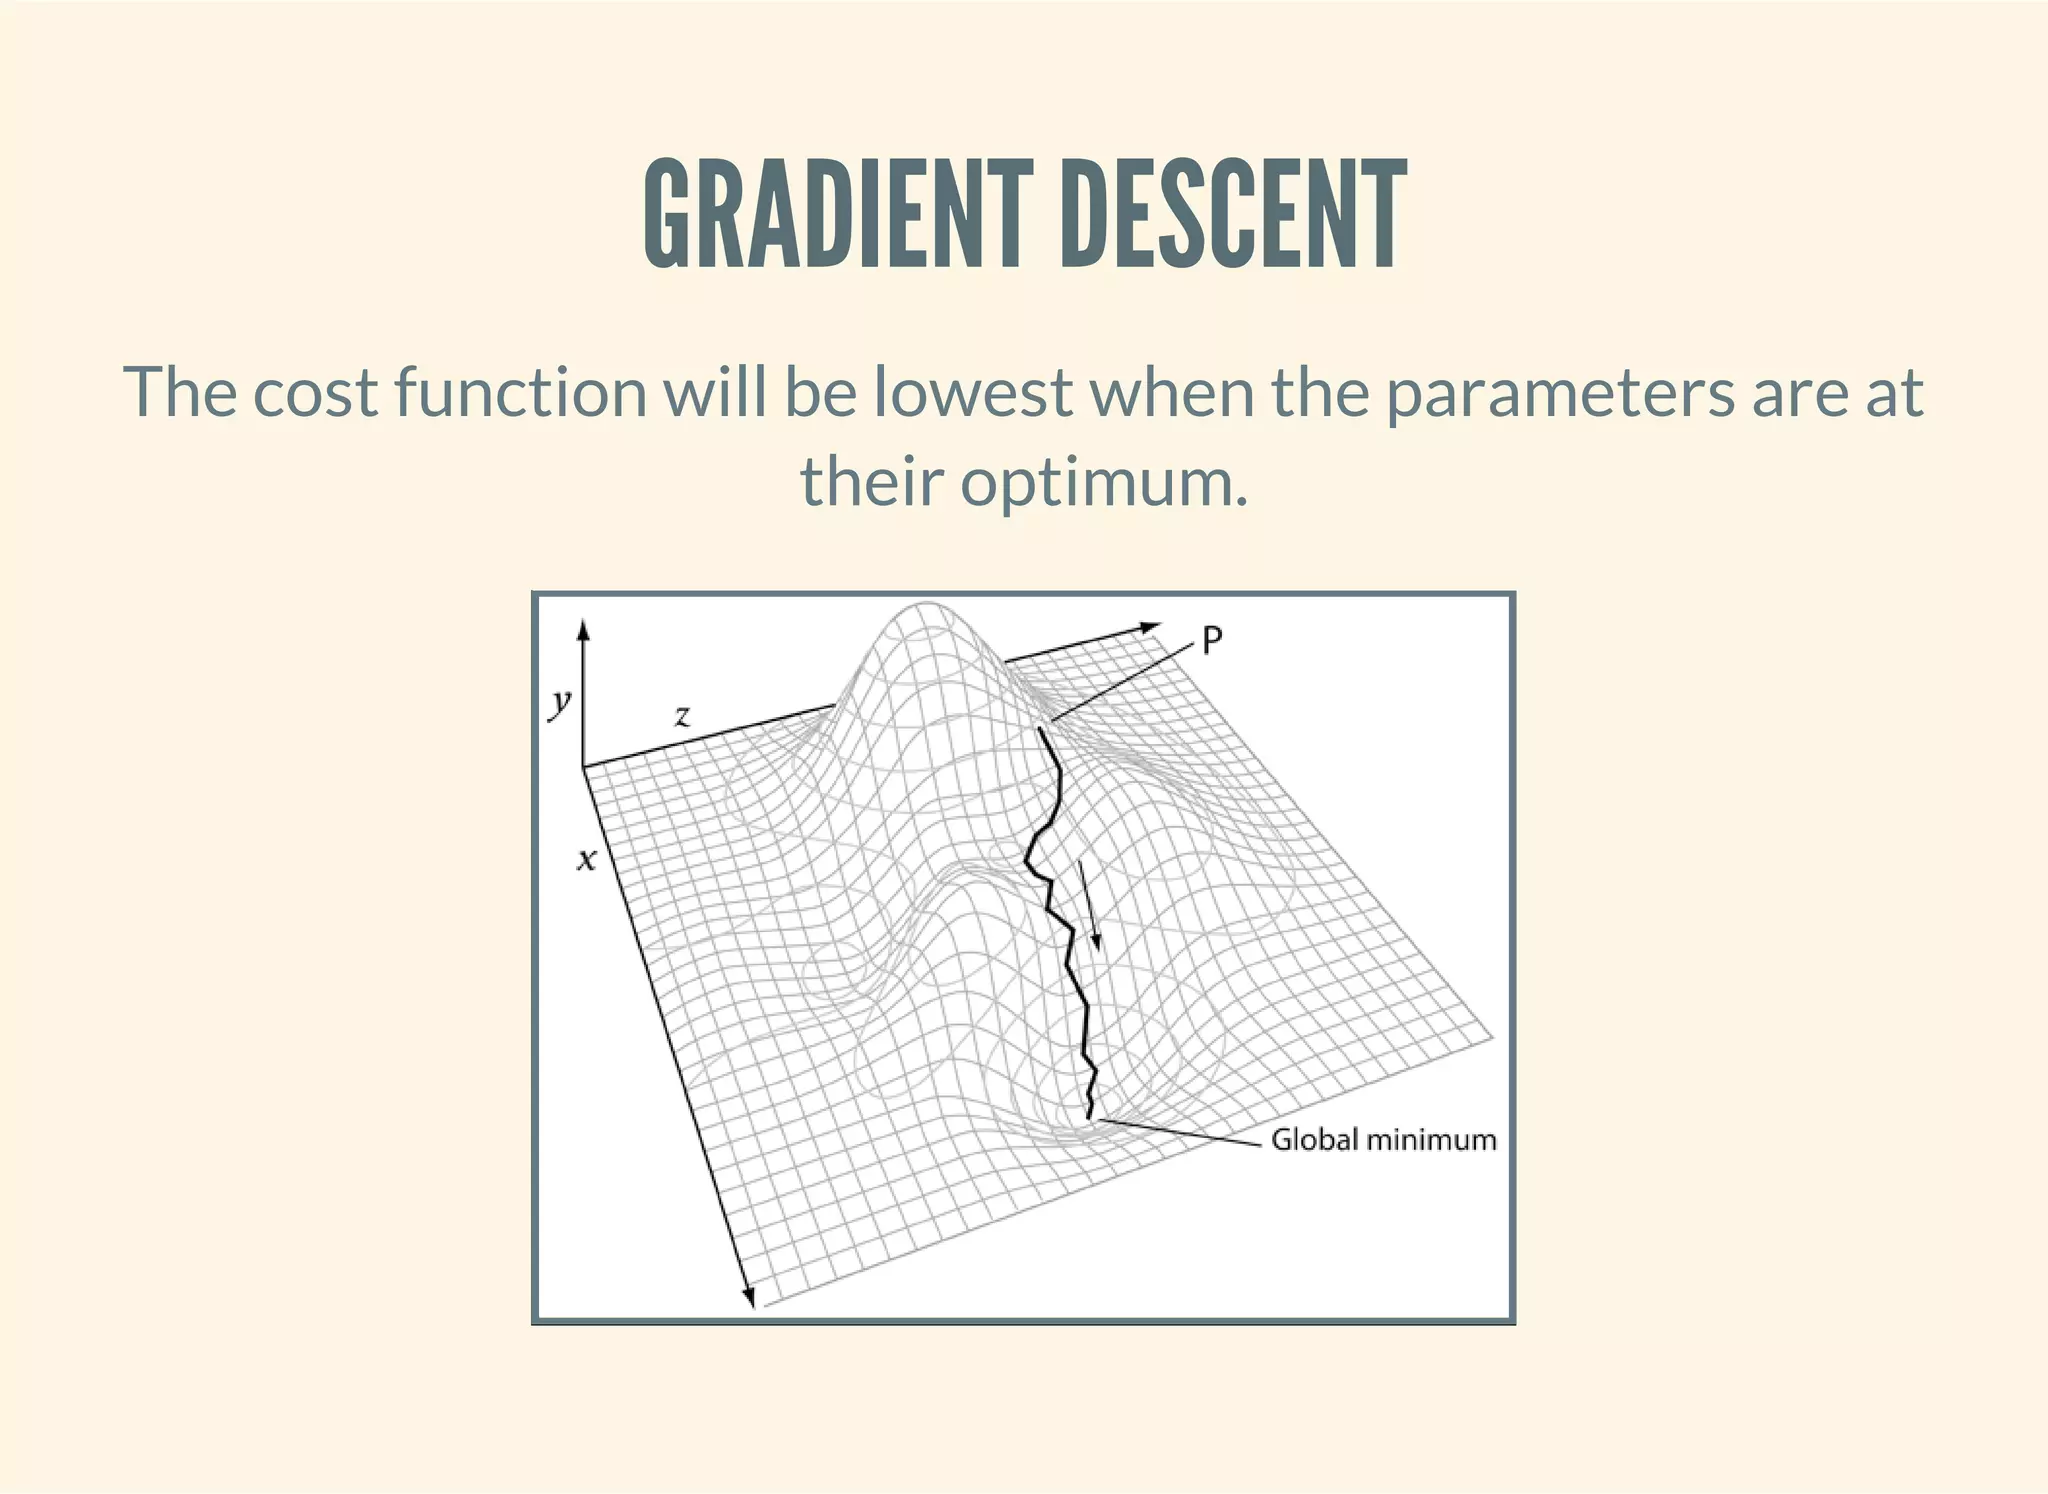
![GRADIENT DESCENT
(defn make-ncg-optimizer []
(NonLinearConjugateGradientOptimizer.
NonLinearConjugateGradientOptimizer$Formula/FLETCHER_REEVES
(SimpleValueChecker. (double 1e-6) (double 1e-6))))
(defn initial-guess [guess]
(InitialGuess. (double-array guess)))
(defn max-evaluations [n]
(MaxEval. n))
(defn gradient-descent [f g estimate n]
(let [options (into-array OptimizationData
[(objective-function f)
(objective-function-gradient g)
(initial-guess estimate)
(max-evaluations n)
GoalType/MINIMIZE])]
(-> (make-ncg-optimizer)
(.optimize options)
(.getPoint)
(vec))))](https://image.slidesharecdn.com/clojurefordatascience-150903135047-lva1-app6891/75/Clojure-for-Data-Science-113-2048.jpg)
![RUNNING GRADIENT DESCENT
(defn run-logistic-regression [data initial-guess]
(let [points (titanic-features)
xs (->> points (map rest) (map #(cons 1 %)))
ys (map first points)]
(gradient-descent
(fn [& theta]
(let [f (logistic-function theta)]
(logistic-cost (map f xs) ys)))
(fn [& theta]
(gradient-fn (logistic-function theta) xs ys))
initial-guess
2000)))](https://image.slidesharecdn.com/clojurefordatascience-150903135047-lva1-app6891/75/Clojure-for-Data-Science-114-2048.jpg)
![PRODUCING A MODEL
(defn ex-5-11 []
(let [data (titanic-features)
initial-guess (-> data first count (take (repeatedly rand)))]
(run-logistic-regression data initial-guess)))](https://image.slidesharecdn.com/clojurefordatascience-150903135047-lva1-app6891/75/Clojure-for-Data-Science-115-2048.jpg)
![MAKING PREDICTIONS
(def theta
[0.690807824623404 -0.9033828001369435 -0.3114375278698766 -0.01894319
673287219 -0.03100315579768661 2.5894858366033273 0.7939190708193374 1.3
711334887947388 0.6672555257828919])
(defn round [x]
(Math/round x))
(def logistic-model
(logistic-function theta))
(defn ex-5-13 []
(let [data (titanic-features)
test (fn [x]
(= (round (logistic-model (cons 1 (rest x))))
(round (first x))))
results (frequencies (map test data))]
(/ (get results true)
(apply + (vals results)))))
;; => 1030/1309](https://image.slidesharecdn.com/clojurefordatascience-150903135047-lva1-app6891/75/Clojure-for-Data-Science-116-2048.jpg)

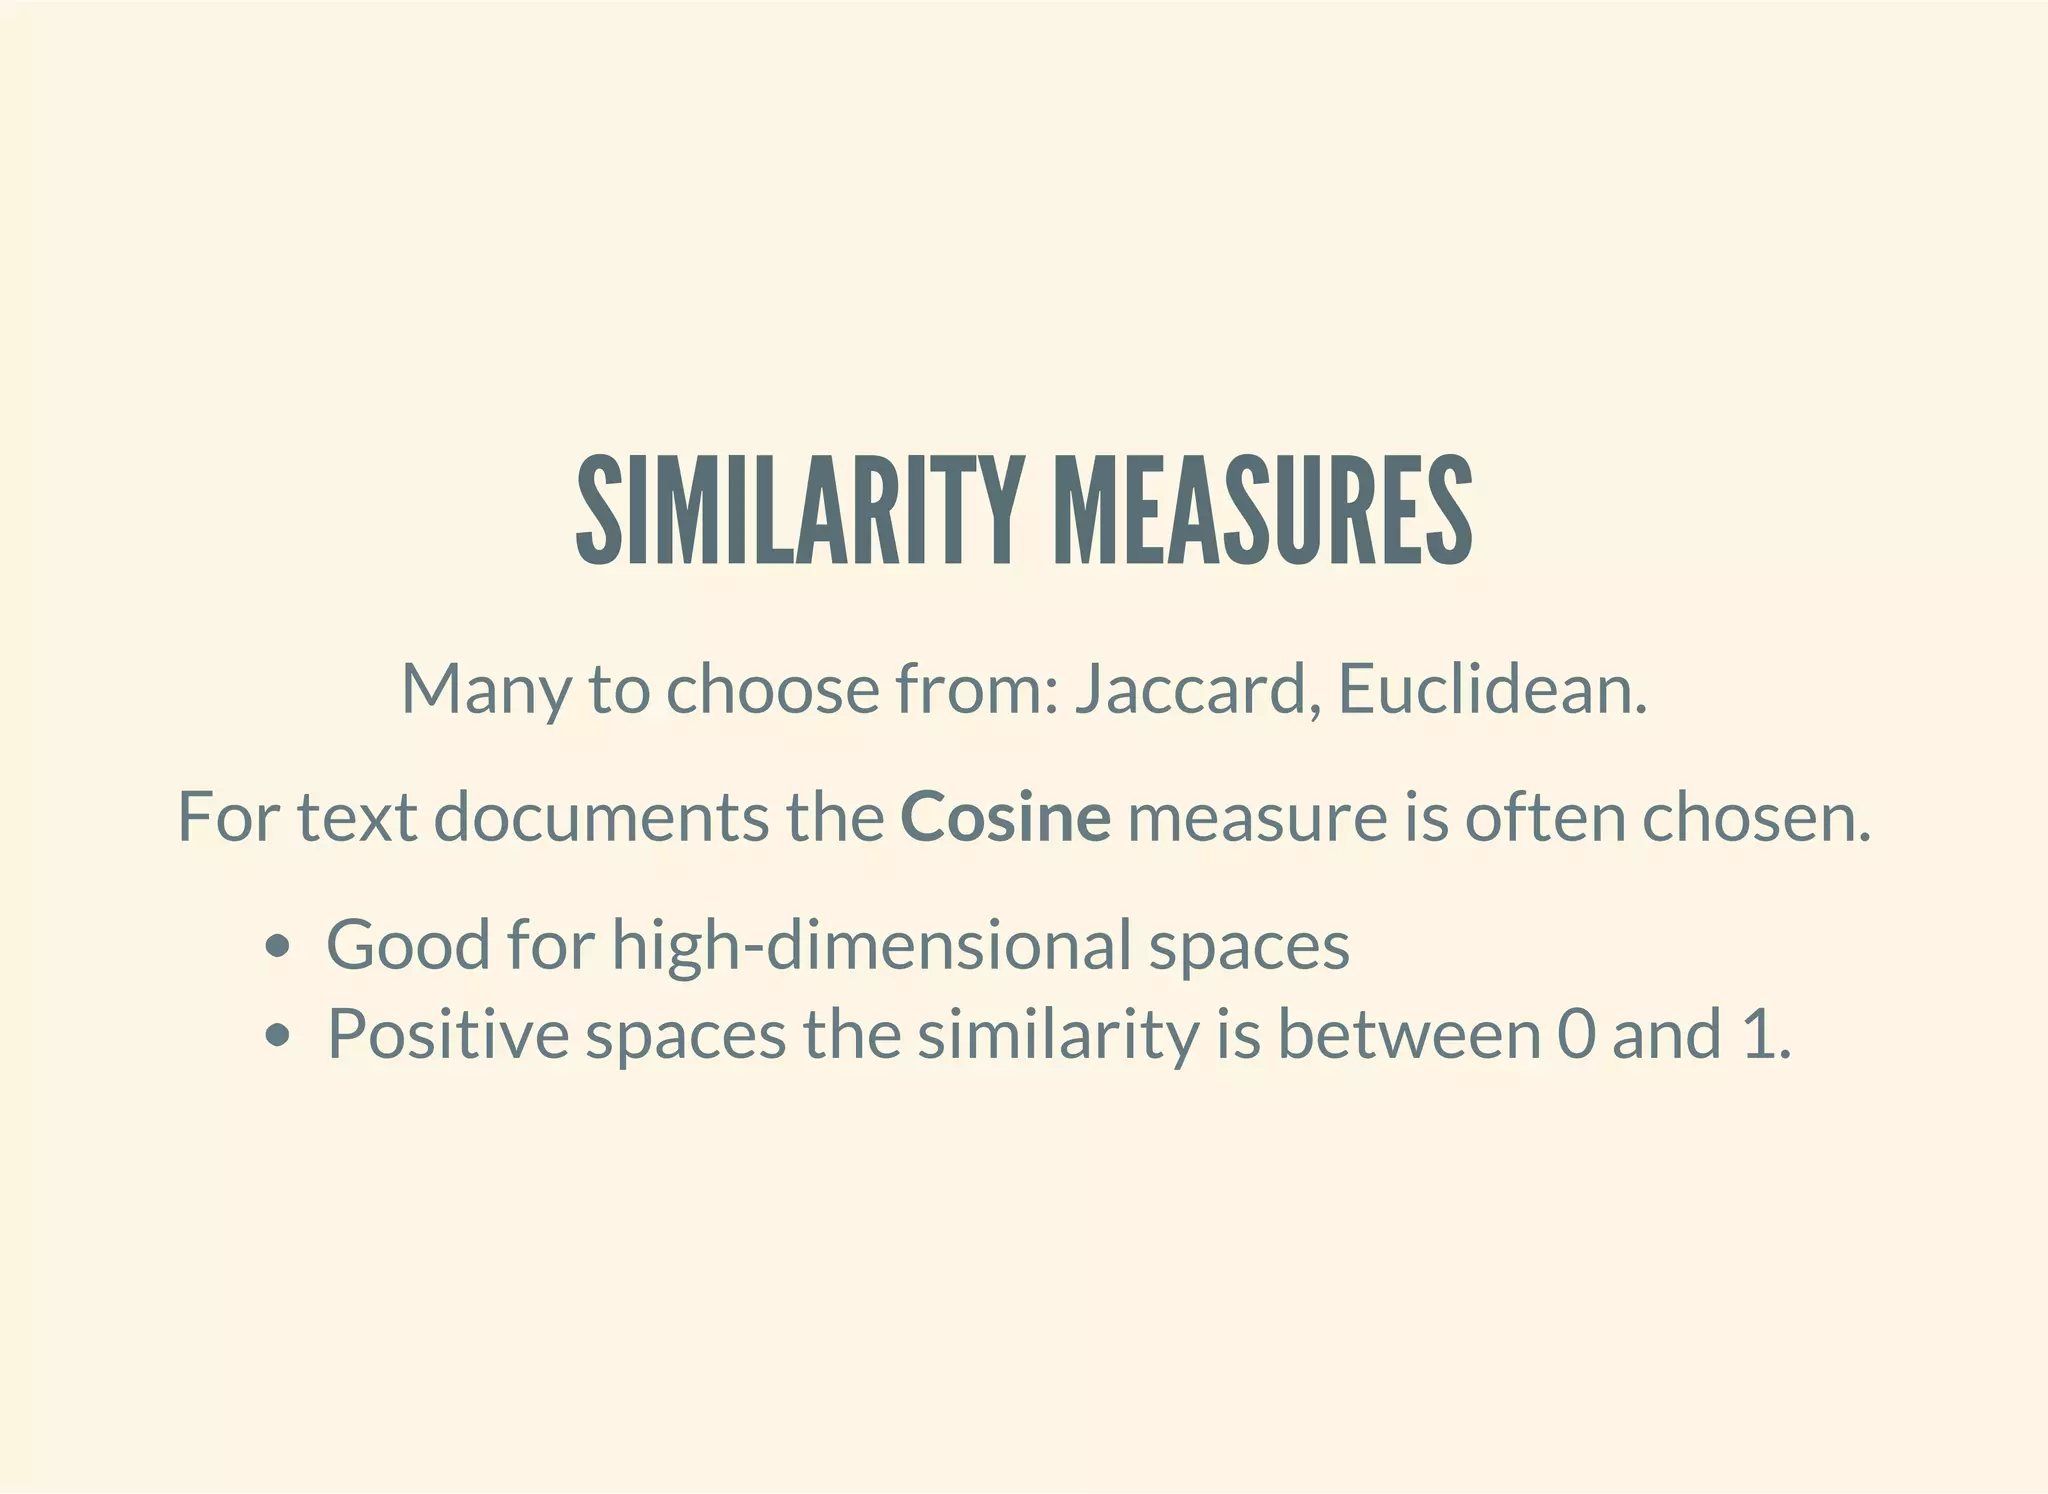
![COSINE SIMILARITY
cos(θ) =
A ⋅ B
∥A∥∥B∥
(defn cosine [a b]
(let [dot-product (->> (map * a b)
(apply +))
magnitude (fn [d]
(->> (map #(Math/pow % 2) d)
(apply +)
Math/sqrt))]
(/ dot-product
(* (magnitude a) (magnitude b)))))](https://image.slidesharecdn.com/clojurefordatascience-150903135047-lva1-app6891/75/Clojure-for-Data-Science-121-2048.jpg)
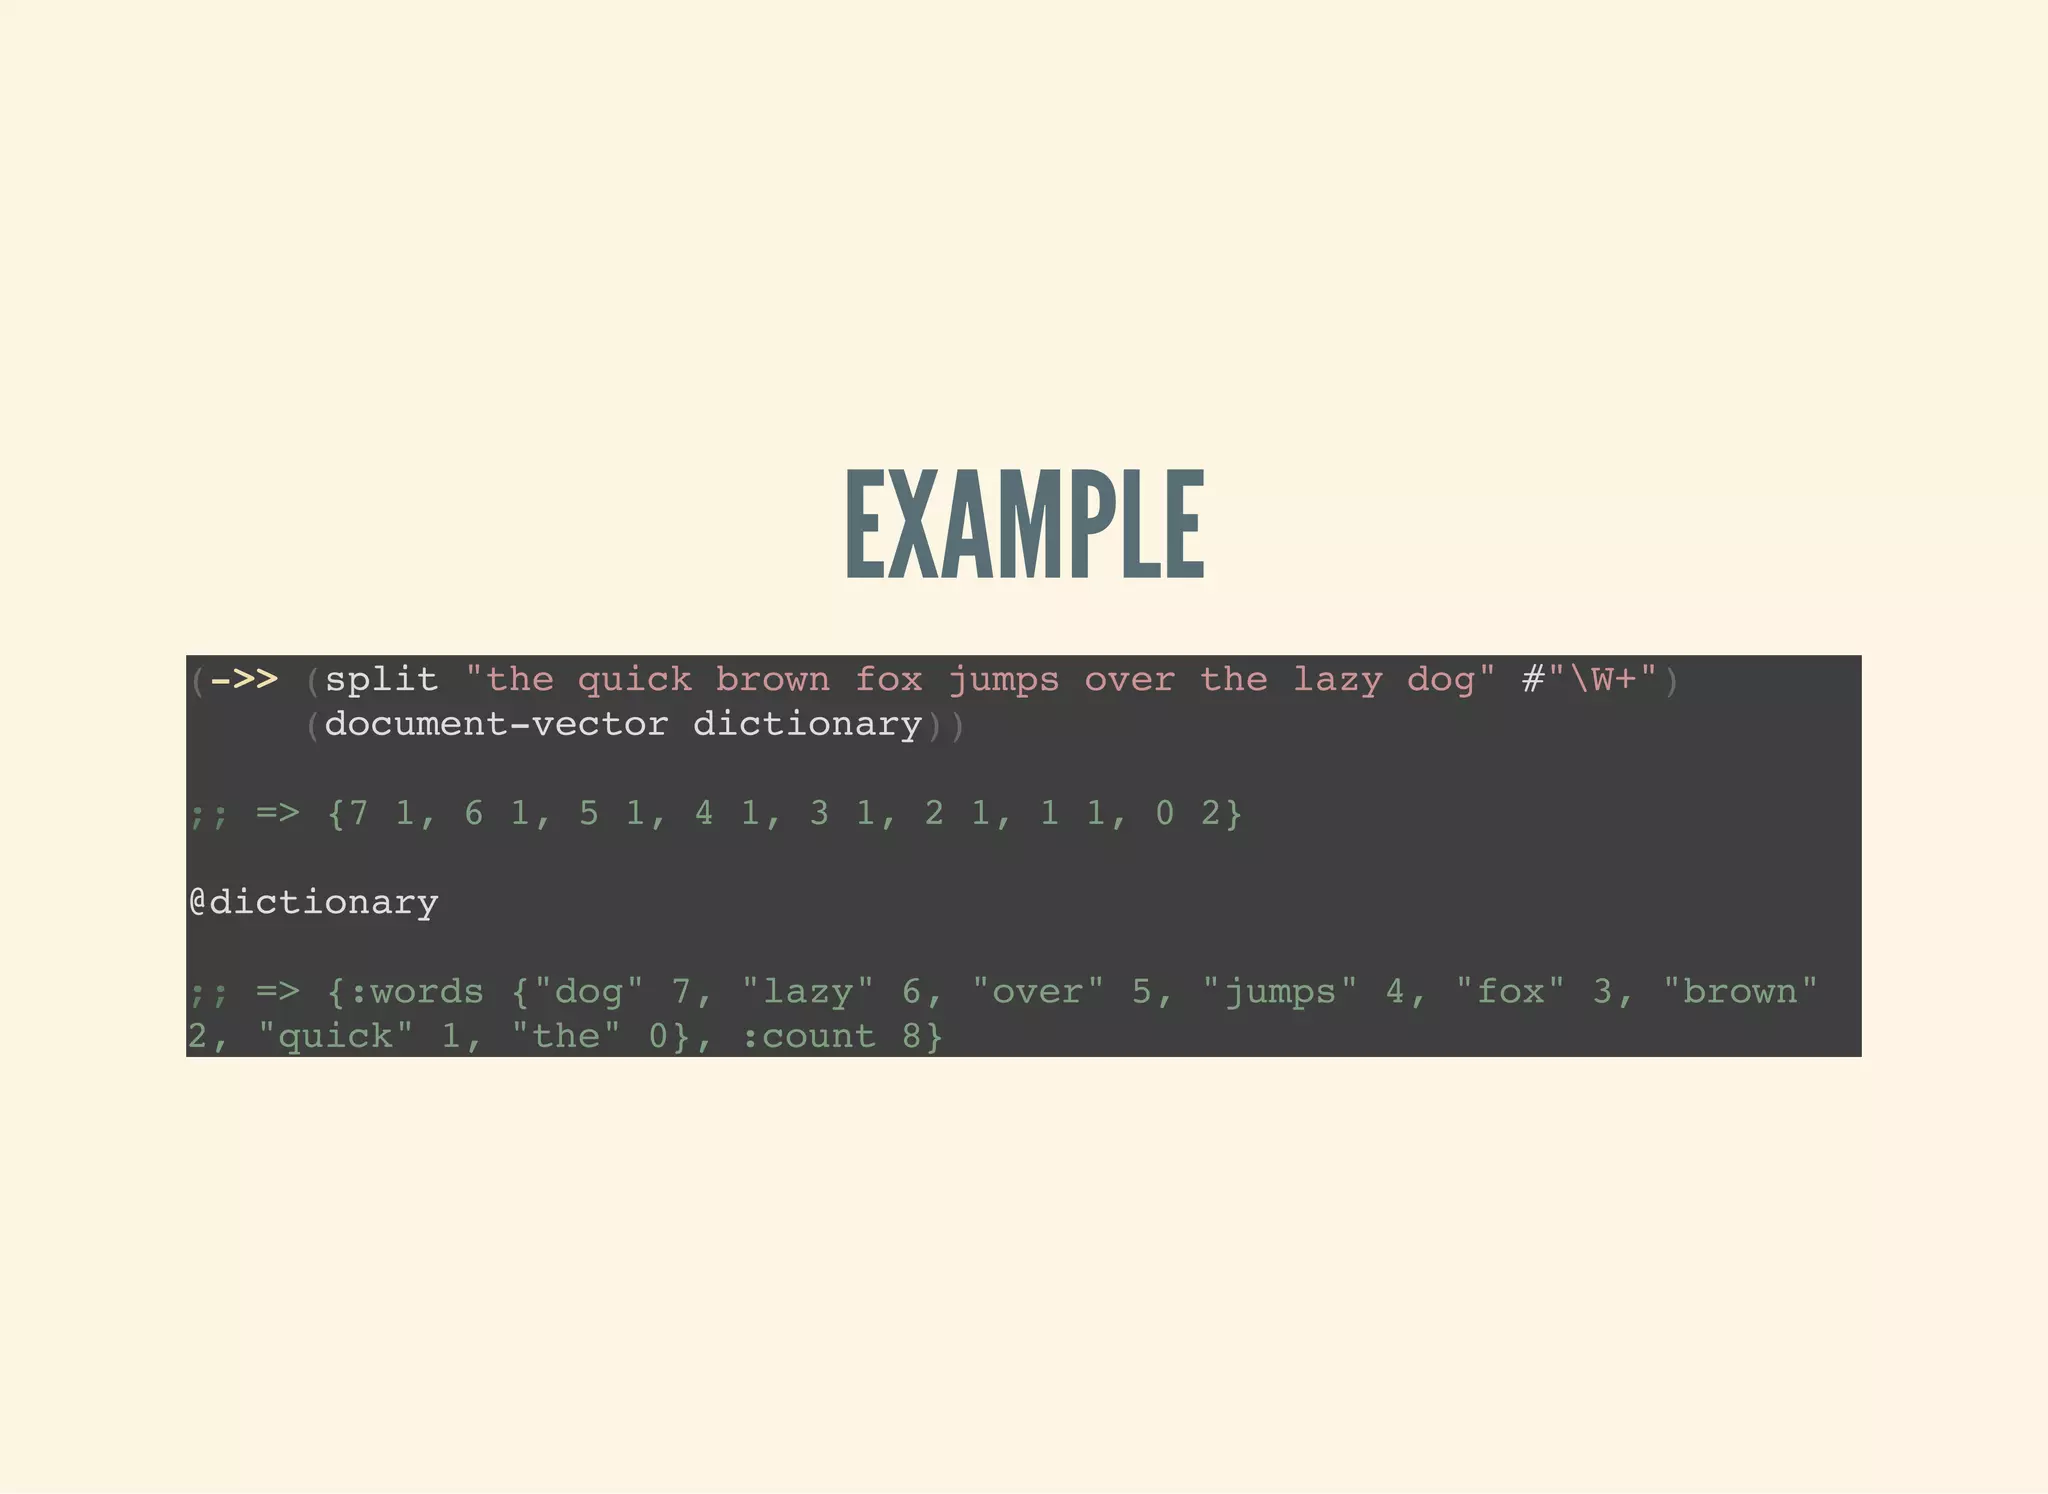
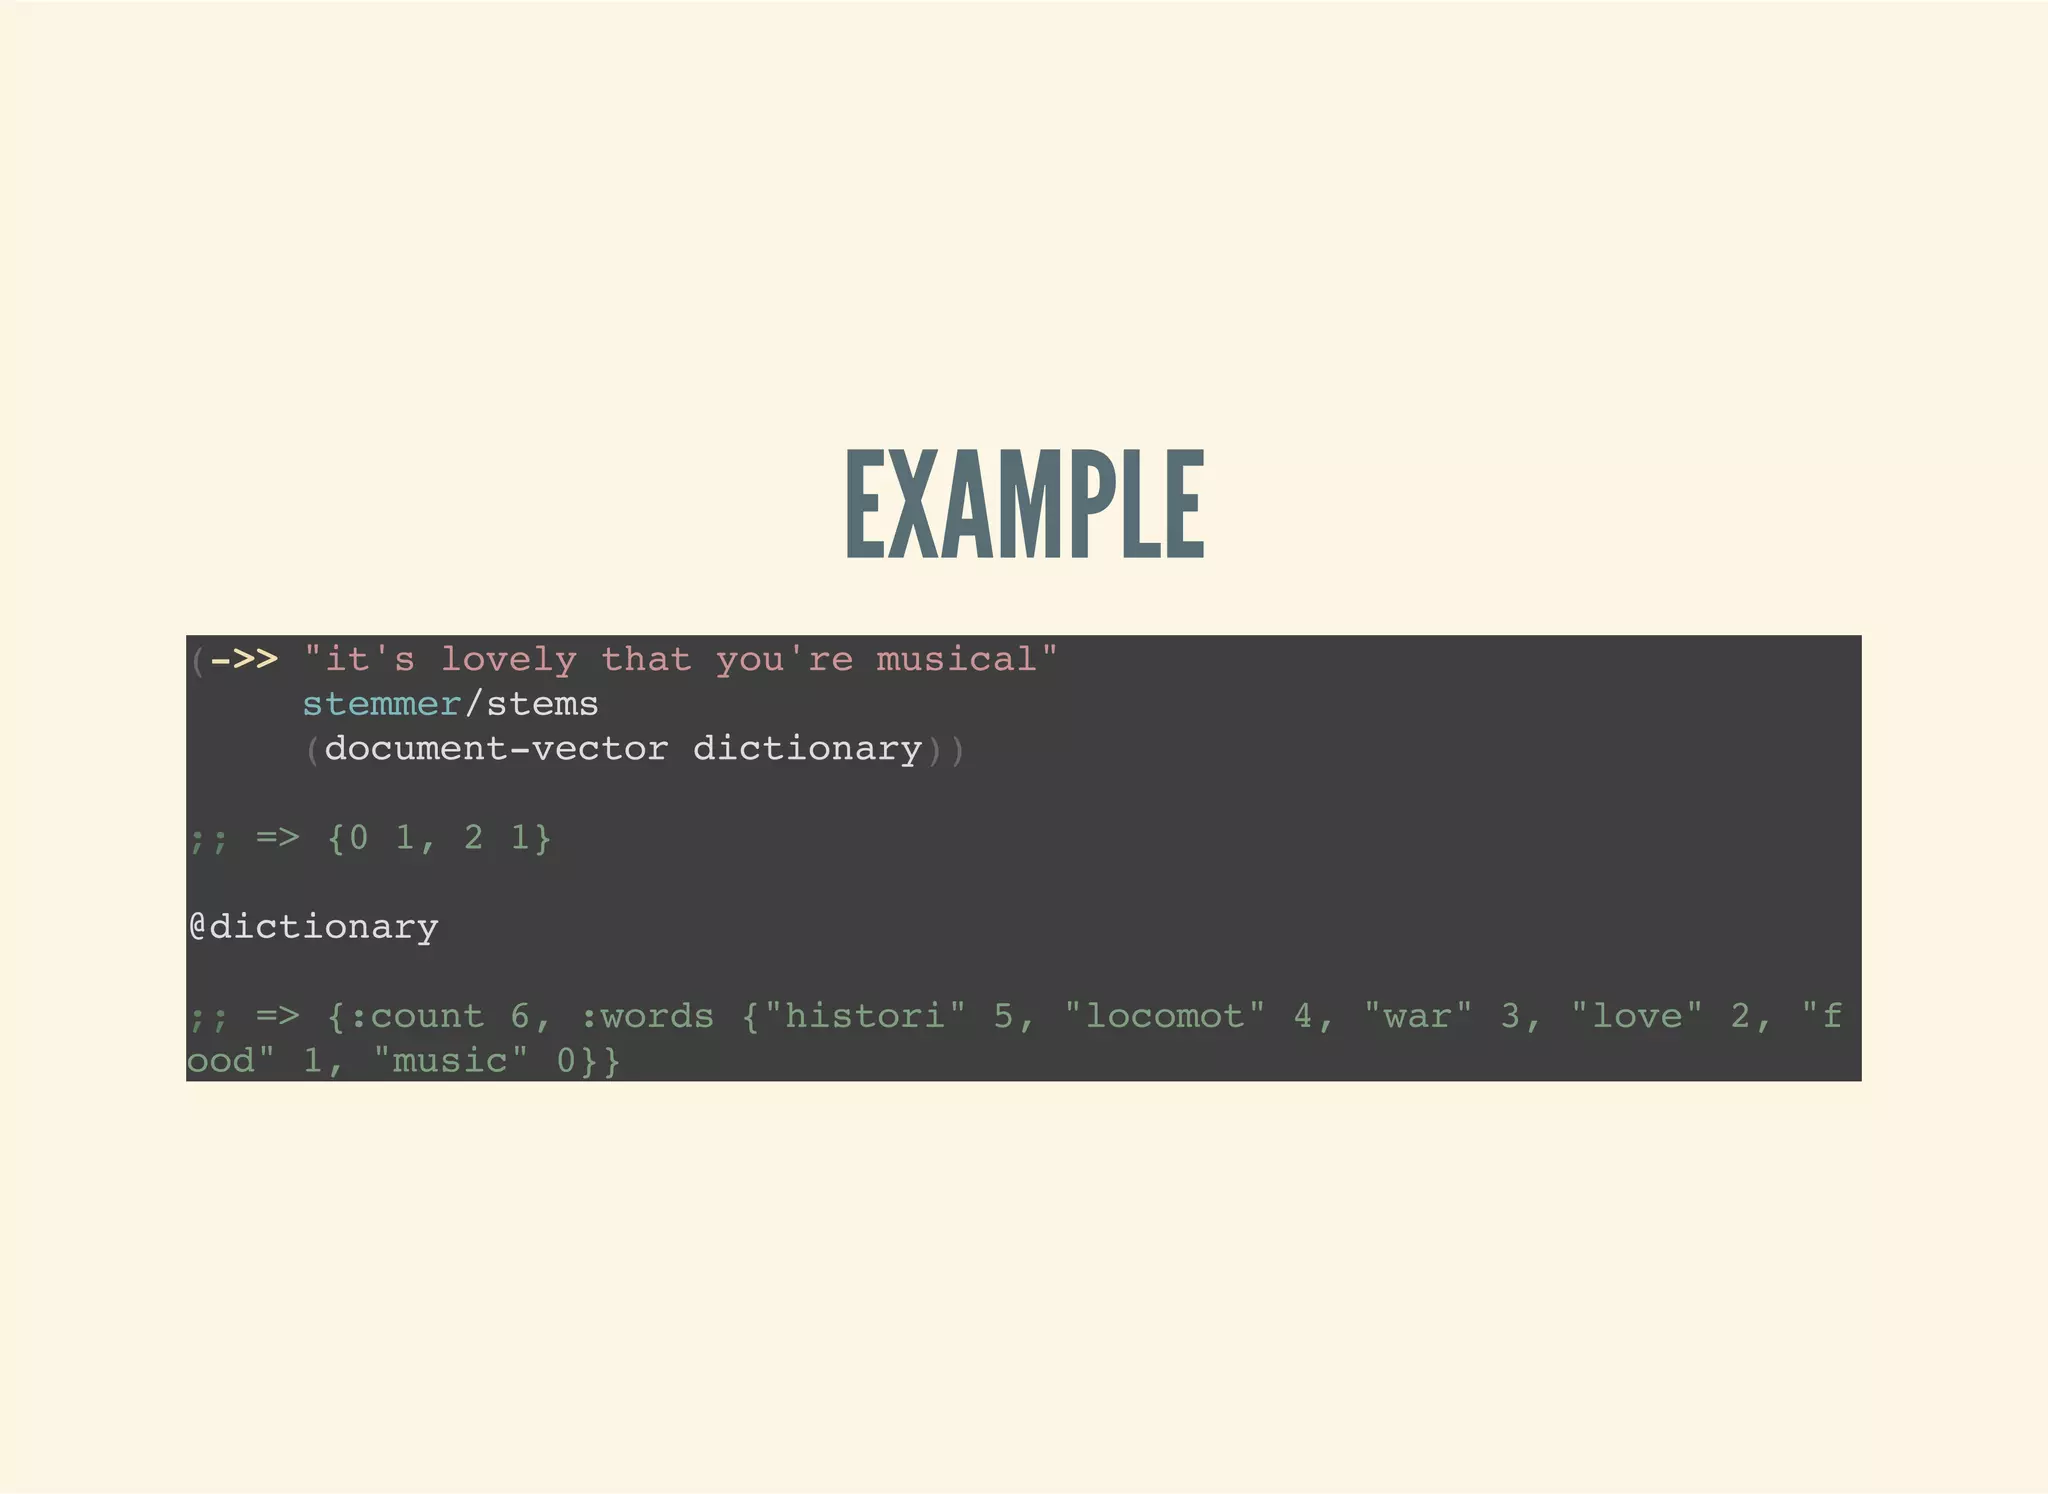
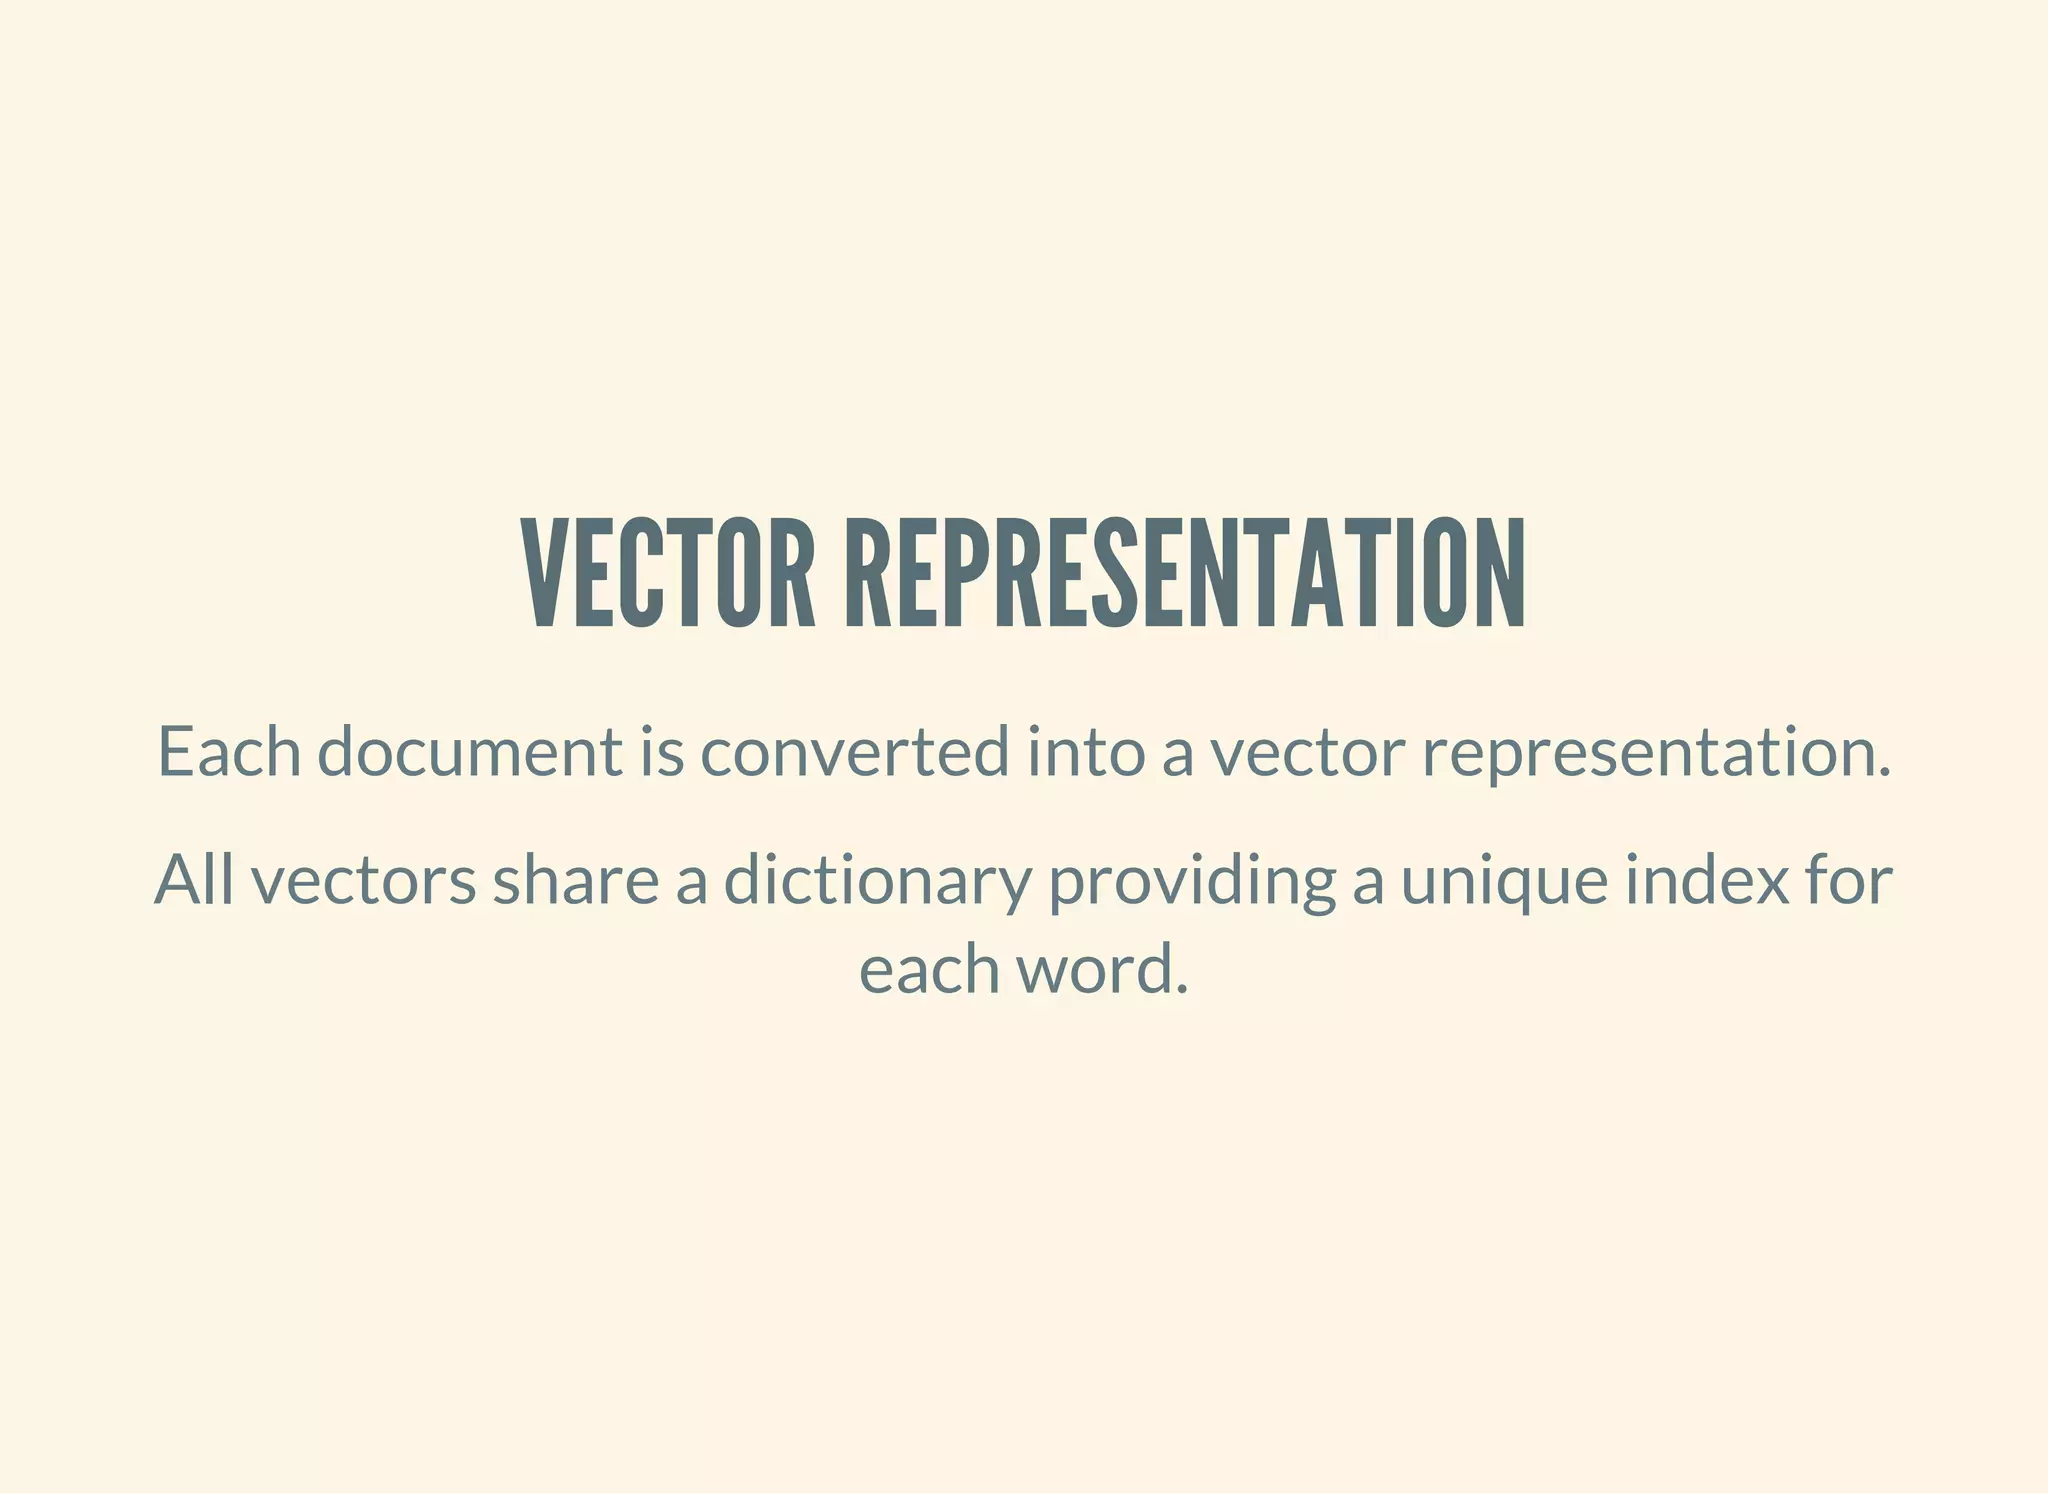
![CREATING SPARSE VECTORS
(def dictionary
(atom {:count 0
:words {}}))
(defn add-word-to-dict [dict word]
(if (get-in dict [:words word])
dict
(-> dict
(update-in [:words] assoc word (get dict :count))
(update-in [:count] inc))))
(defn update-words [dict doc word]
(let [word-id (-> (swap! dict add-word-to-dict word)
(get-in [:words word]))]
(update-in doc [word-id] #(inc (or % 0)))))
(defn document-vector [dict ngrams]
(r/reduce (partial update-words dict) {} ngrams))](https://image.slidesharecdn.com/clojurefordatascience-150903135047-lva1-app6891/75/Clojure-for-Data-Science-122-2048.jpg)

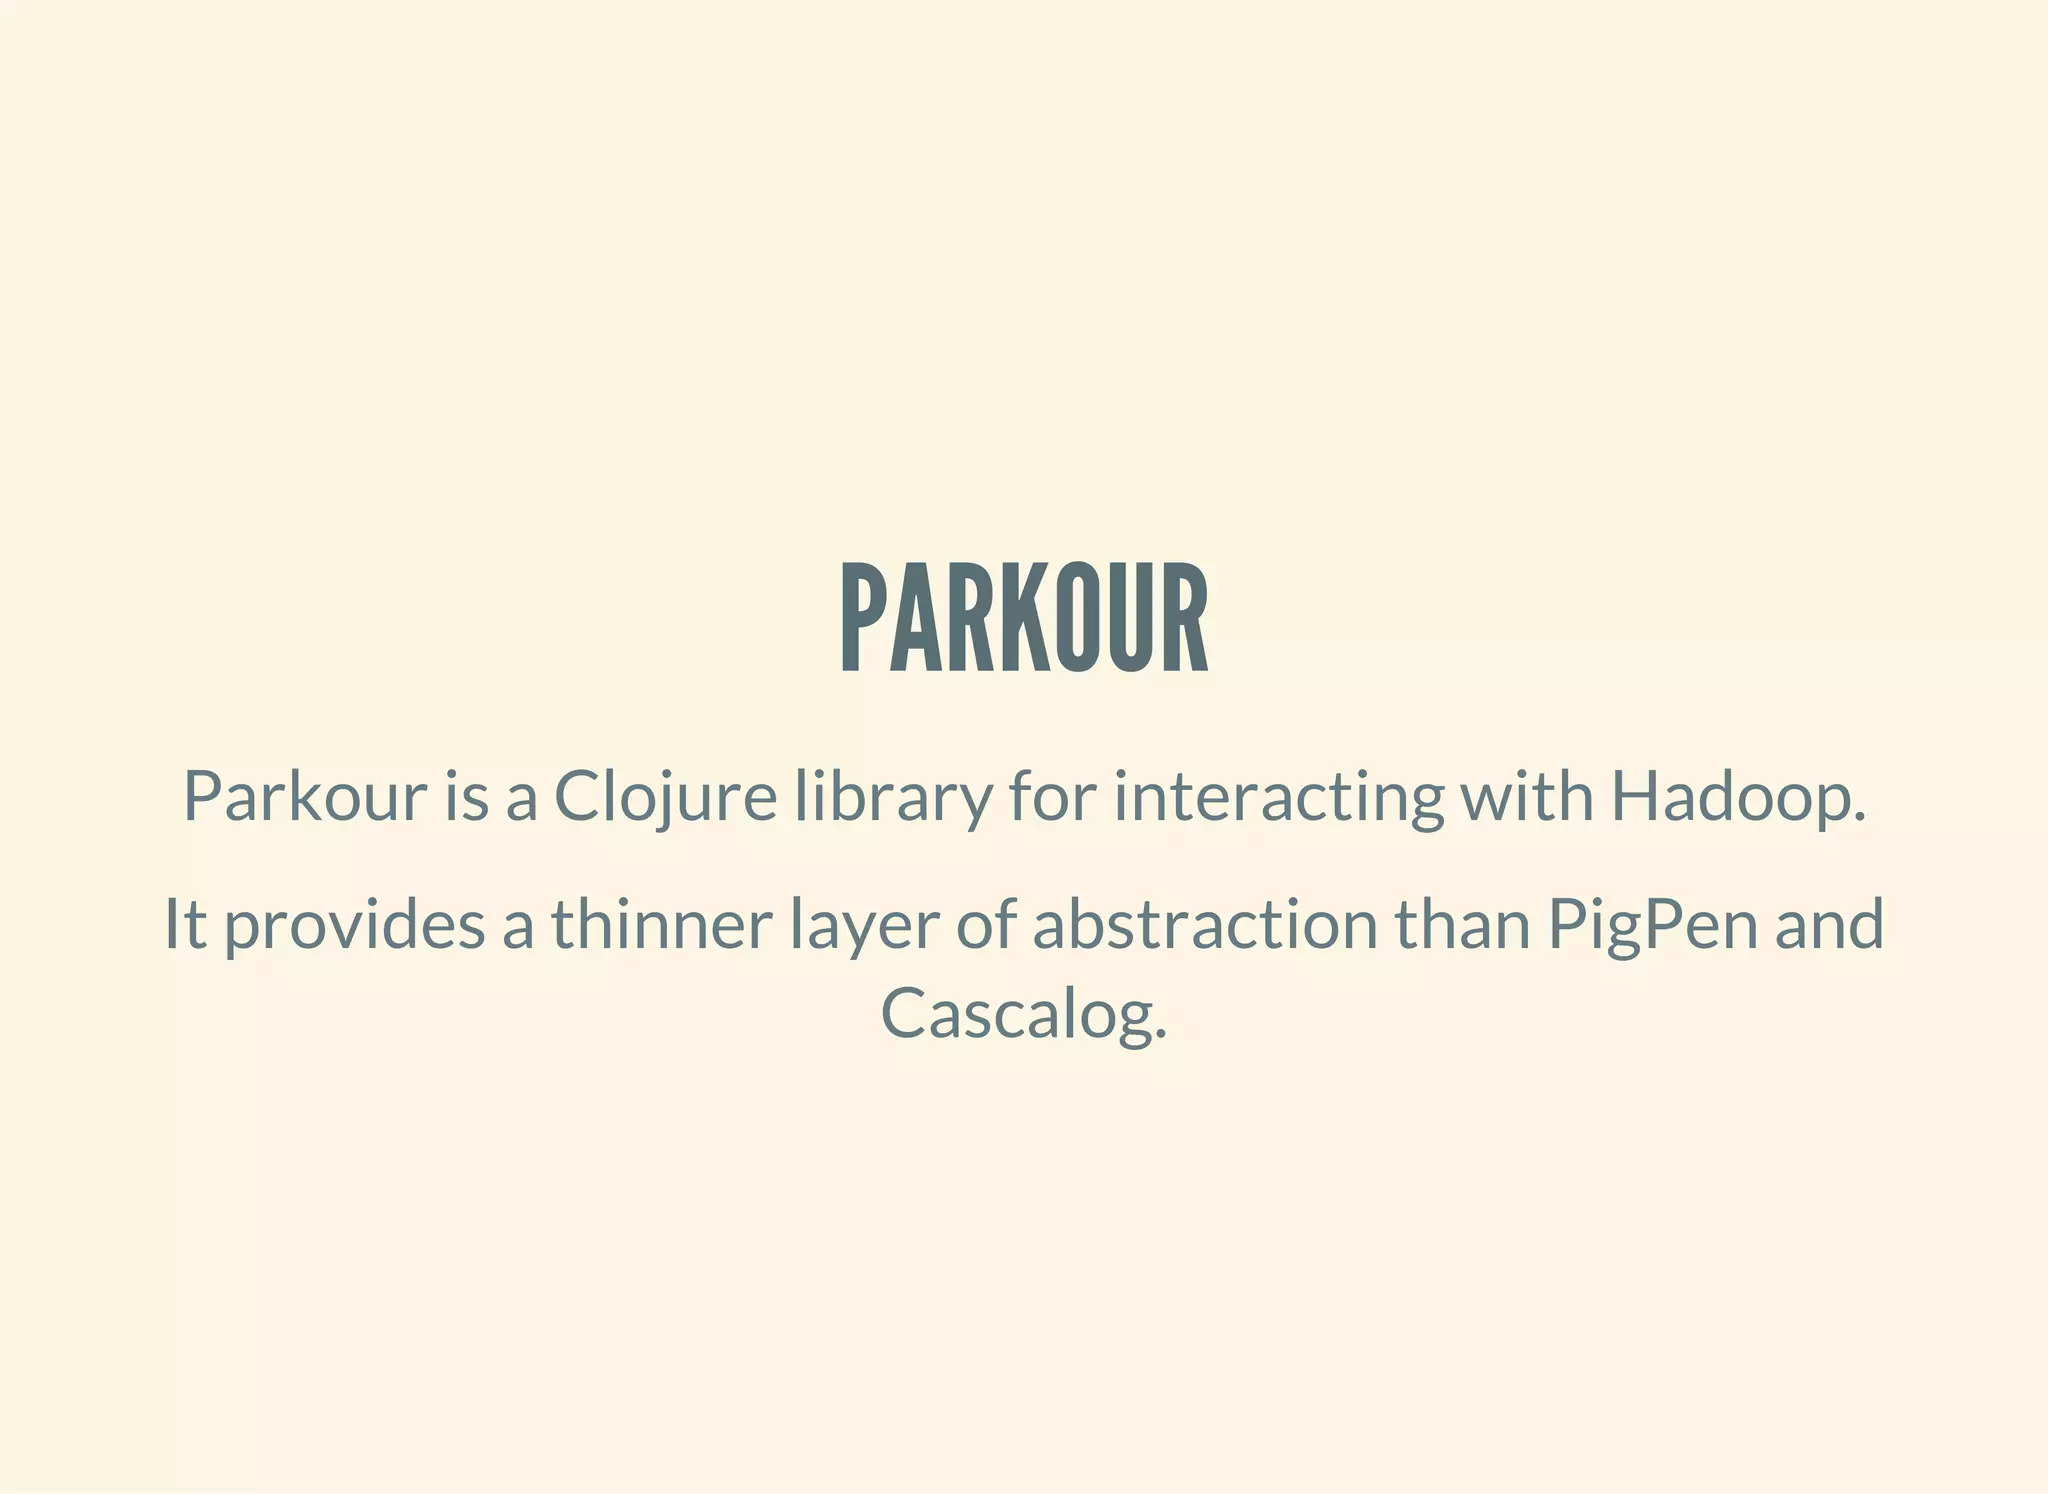
![PARKOUR MAPPING
(require '[clojure.core.reducers :as r]
'[parkour.mapreduce :as mr])
(defn document->terms [doc]
(clojure.string/split doc #"W+"))
(defn document-count-m
"Emits the unique words from each document"
{::mr/source-as :vals}
[documents]
(->> documents
(r/mapcat (comp distinct document->terms))
(r/map #(vector % 1))))](https://image.slidesharecdn.com/clojurefordatascience-150903135047-lva1-app6891/75/Clojure-for-Data-Science-134-2048.jpg)
![PLAIN OLD FUNCTIONS
(->> (document-count-m ["it's lovely that you're musical"
"music is the food of love"
"war is the locomotive of history"])
(into []))
;; => [["love" 1] ["music" 1] ["music" 1] ["food" 1] ["love" 1] ["war" 1
] ["locomot" 1] ["histori" 1]]](https://image.slidesharecdn.com/clojurefordatascience-150903135047-lva1-app6891/75/Clojure-for-Data-Science-136-2048.jpg)
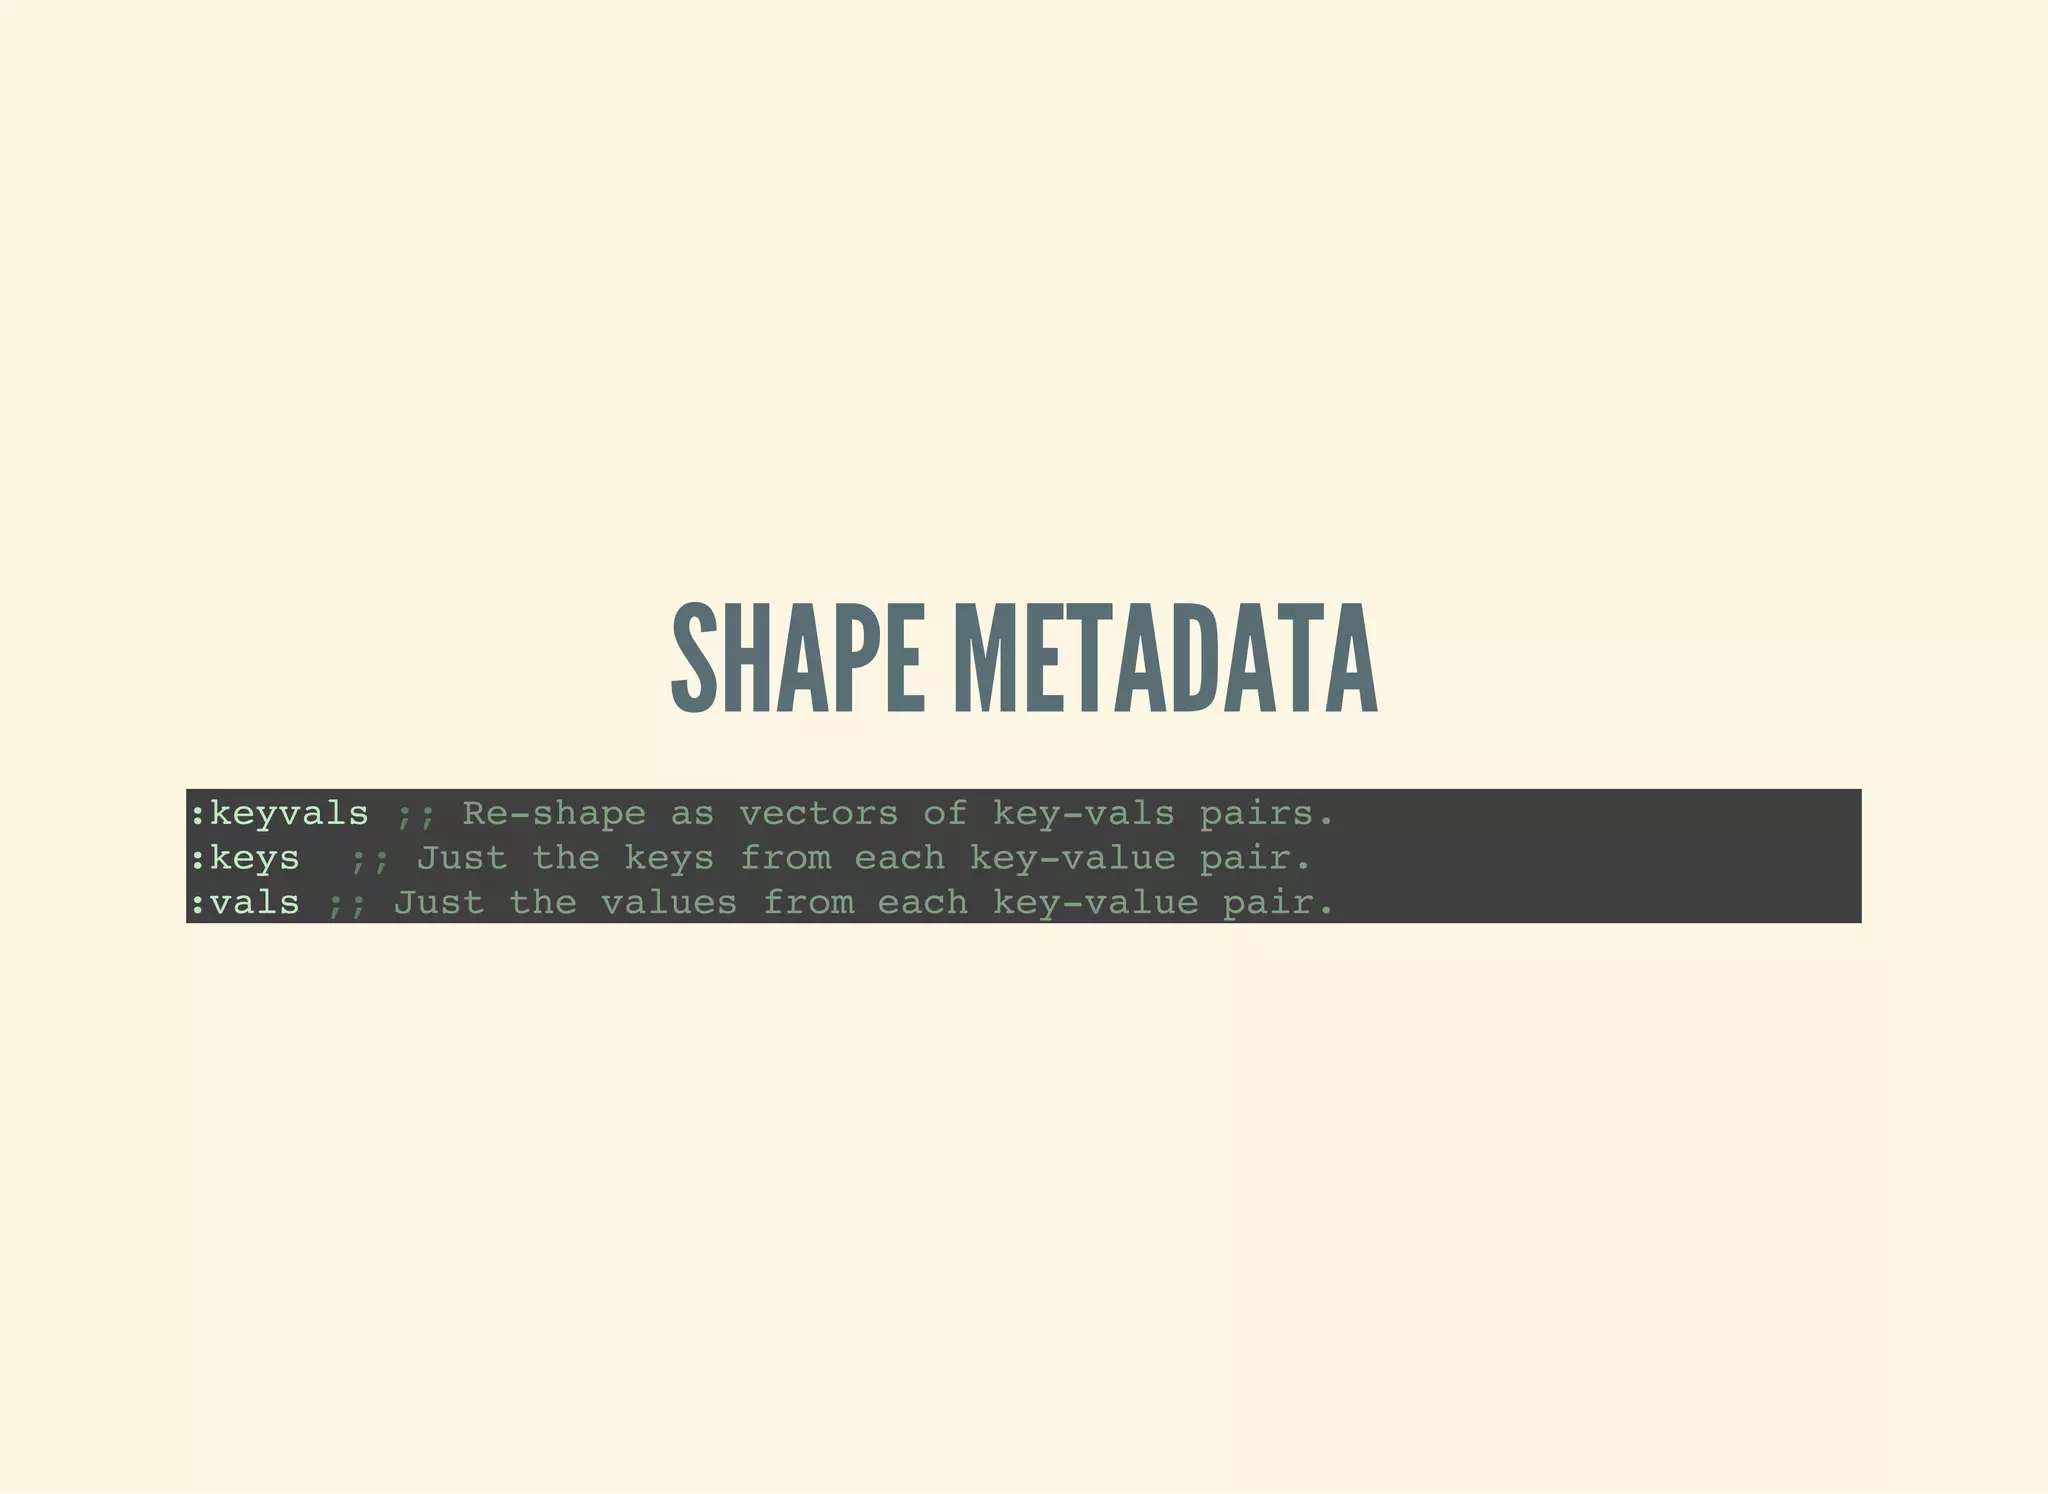
![AND REDUCING…
(require '[parkour.io.dux :as dux]
'[transduce.reducers :as tr])
(defn unique-index-r
{::mr/source-as :keyvalgroups, ::mr/sink-as dux/named-keyvals}
[coll]
(let [global-offset (conf/get-long mr/*context* "mapred.task.partition
" -1)]
(tr/mapcat-state
(fn [local-offset [word counts]]
[(inc local-offset)
(if (identical? ::finished word)
[[:counts [global-offset local-offset]]]
[[:data [word [[global-offset local-offset] (apply + counts)]]
]])])
0 (r/mapcat identity [coll [[::finished nil]]]))))](https://image.slidesharecdn.com/clojurefordatascience-150903135047-lva1-app6891/75/Clojure-for-Data-Science-137-2048.jpg)
![CREATING A JOB
(require '[parkour.graph :as pg]
'[parkour.avro :as mra]
'[abracad.avro :as avro])
(def long-pair (avro/tuple-schema [:long :long]))
(def index-value (avro/tuple-schema [long-pair :long]))
(defn df-j [dseq]
(-> (pg/input dseq)
(pg/map #'document-count-m)
(pg/partition (mra/shuffle [:string :long]))
(pg/reduce #'unique-index-r)
(pg/output :data (mra/dsink [:string index-value])
:counts (mra/dsink [:long :long]))))](https://image.slidesharecdn.com/clojurefordatascience-150903135047-lva1-app6891/75/Clojure-for-Data-Science-138-2048.jpg)
![WRITING TO DISTRIBUTED CACHE
(require '[parkour.io.dval :as dval])
(defn calculate-offsets
"Build map of offsets from dseq of counts."
[dseq]
(->> dseq
(into [])
(sort-by first)
(reductions (fn [[_ t] [i n]]
[(inc i) (+ t n)])
[0 0])
(into {})))
(defn df-execute [conf dseq]
(let [[df-data df-counts] (pg/execute (df-j dseq) conf `df)
offsets-dval (dval/edn-dval (calculate-offsets df-counts))]
...))](https://image.slidesharecdn.com/clojurefordatascience-150903135047-lva1-app6891/75/Clojure-for-Data-Science-139-2048.jpg)
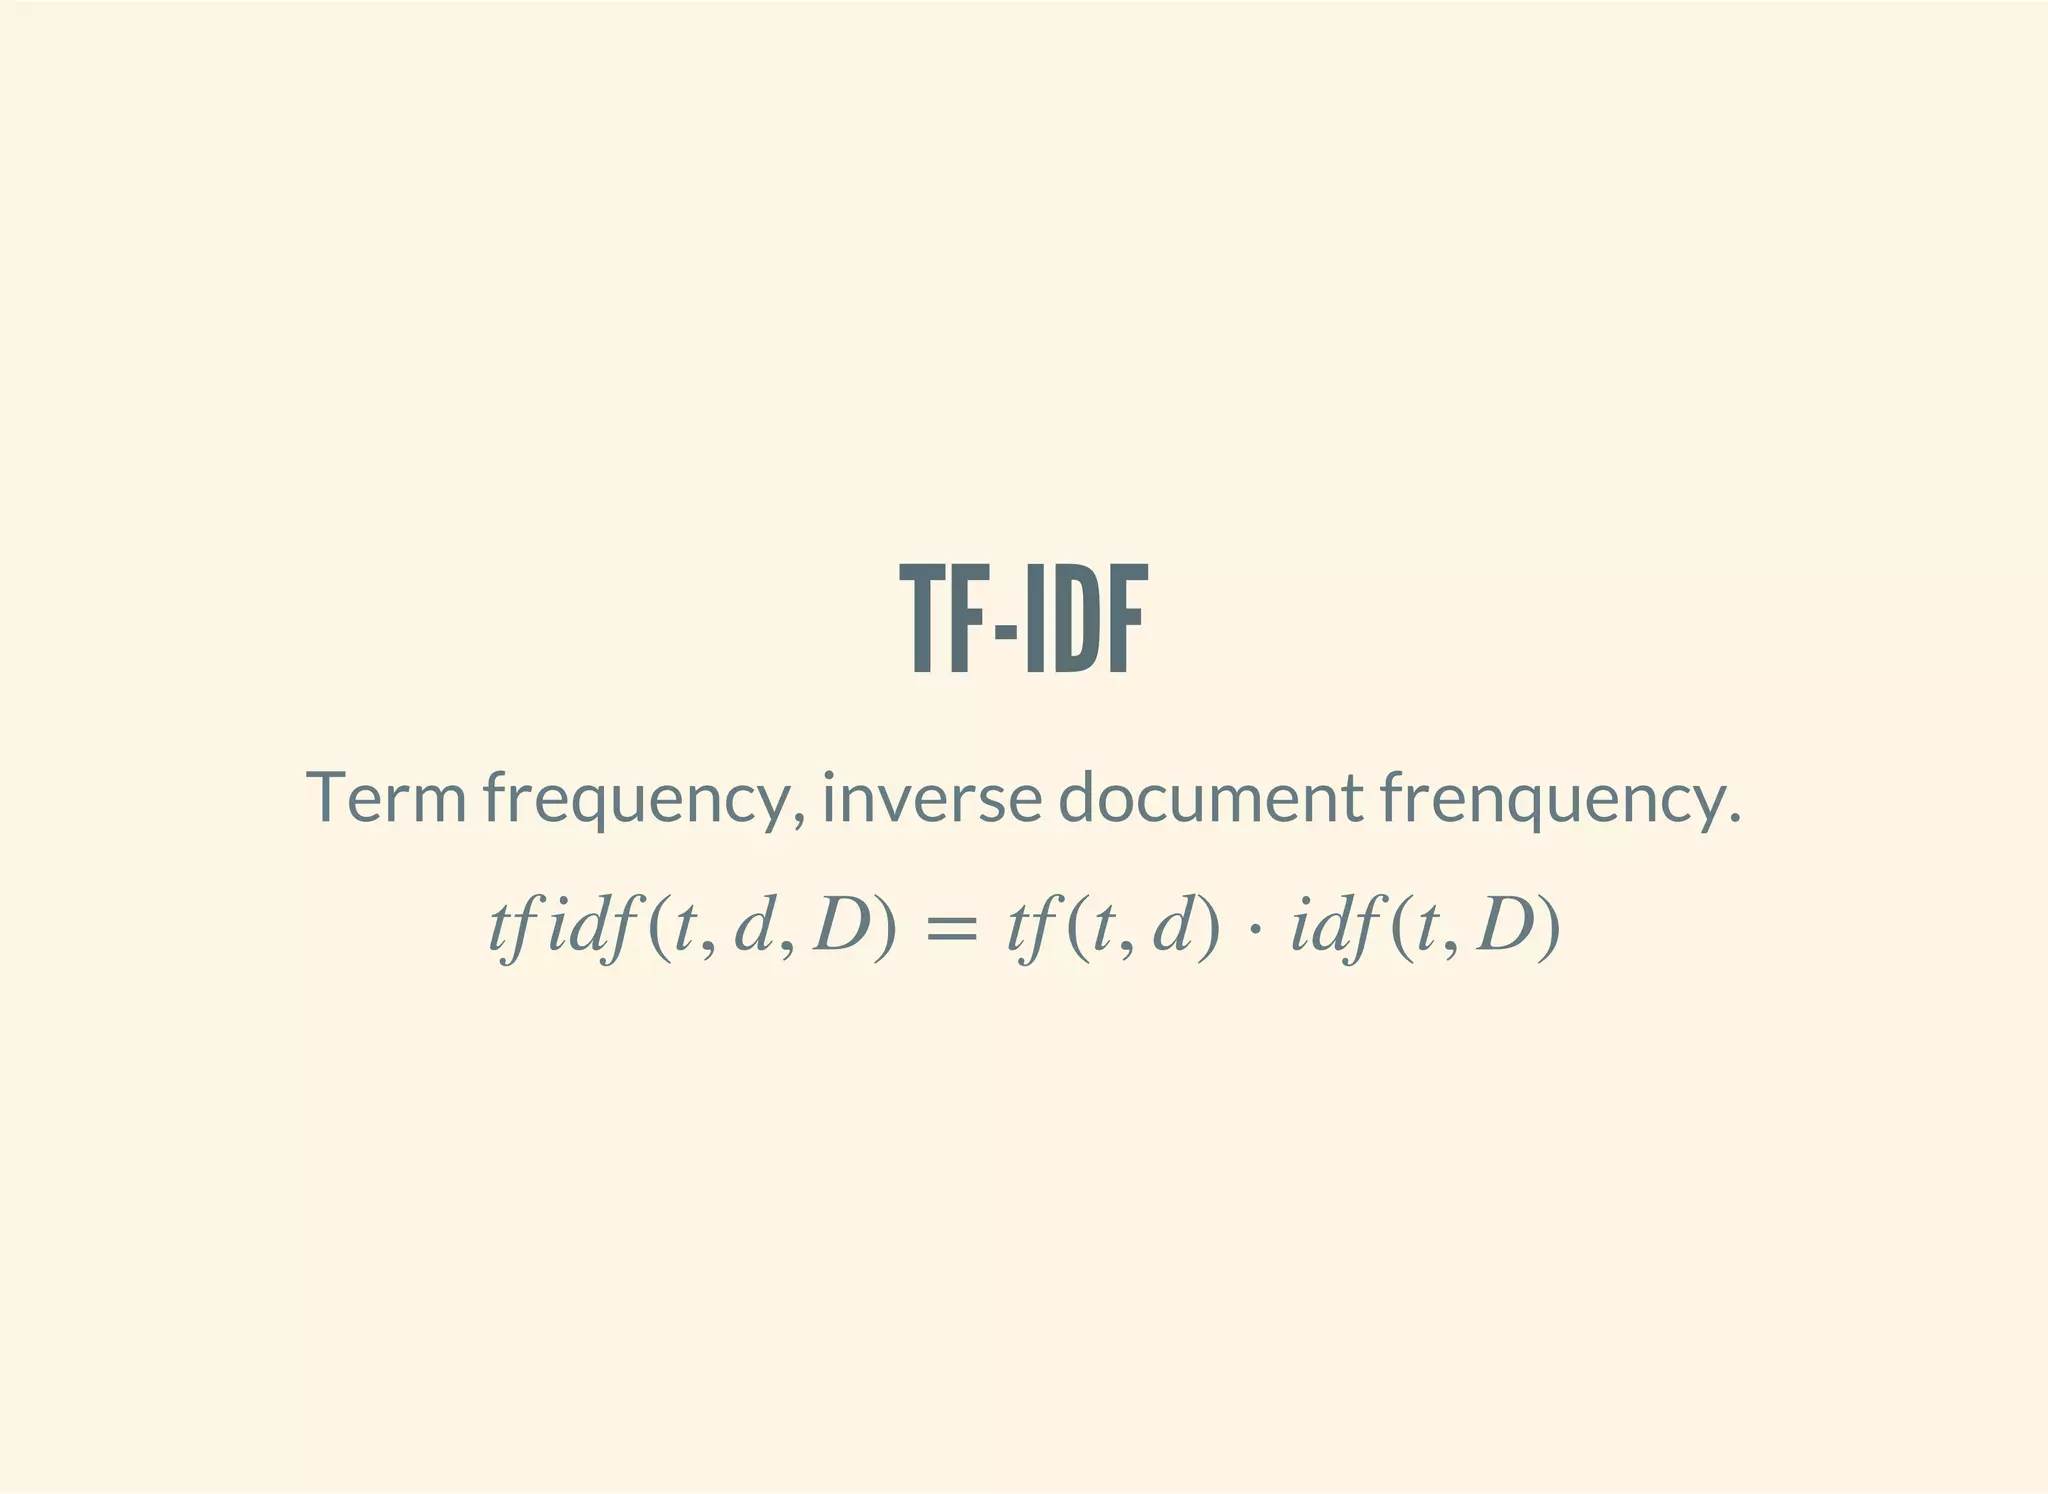
![READING FROM DISTRIBUTED CACHE
(defn global-id
"Use offsets to calculate unique id from global and local offset"
[offsets [global-offset local-offset]]
(+ local-offset (get offsets global-offset)))
(defn words-idf-m
"Calculate the unique id and inverse document frequency for each word"
{::mr/sink-as :keys}
[offsets-dval n coll]
(let [offsets @offsets-dval]
(r/map
(fn [[word [word-offset df]]]
[word (global-id offsets word-offset) (Math/log (/ n df))])
coll)))
(defn make-dictionary [conf df-data df-counts doc-count]
(let [offsets-dval (dval/edn-dval (calculate-offsets df-counts))]
(-> (pg/input df-data)
(pg/map #'words-idf-m offsets-dval doc-count)
(pg/output (mra/dsink [words]))
(pg/fexecute conf `idf)
(->> (r/map parse-idf)
(into {}))
(dval/edn-dval))))](https://image.slidesharecdn.com/clojurefordatascience-150903135047-lva1-app6891/75/Clojure-for-Data-Science-140-2048.jpg)
![CREATING TEXT VECTORS
(import '[org.apache.mahout.math RandomAccessSparseVector])
(defn create-sparse-vector [dictionary [id doc]]
(let [vector (RandomAccessSparseVector. (count dictionary))]
(doseq [[term freq] (-> doc document->terms frequencies)]
(let [term-info (get dictionary term)]
(.setQuick vector (:id term-info) (* freq (:idf term-info)))))
[id vector]))
(defn create-vectors-m [dictionary coll]
(let [dictionary @dictionary]
(r/map #(create-sparse-vector dictionary %) coll)))](https://image.slidesharecdn.com/clojurefordatascience-150903135047-lva1-app6891/75/Clojure-for-Data-Science-141-2048.jpg)
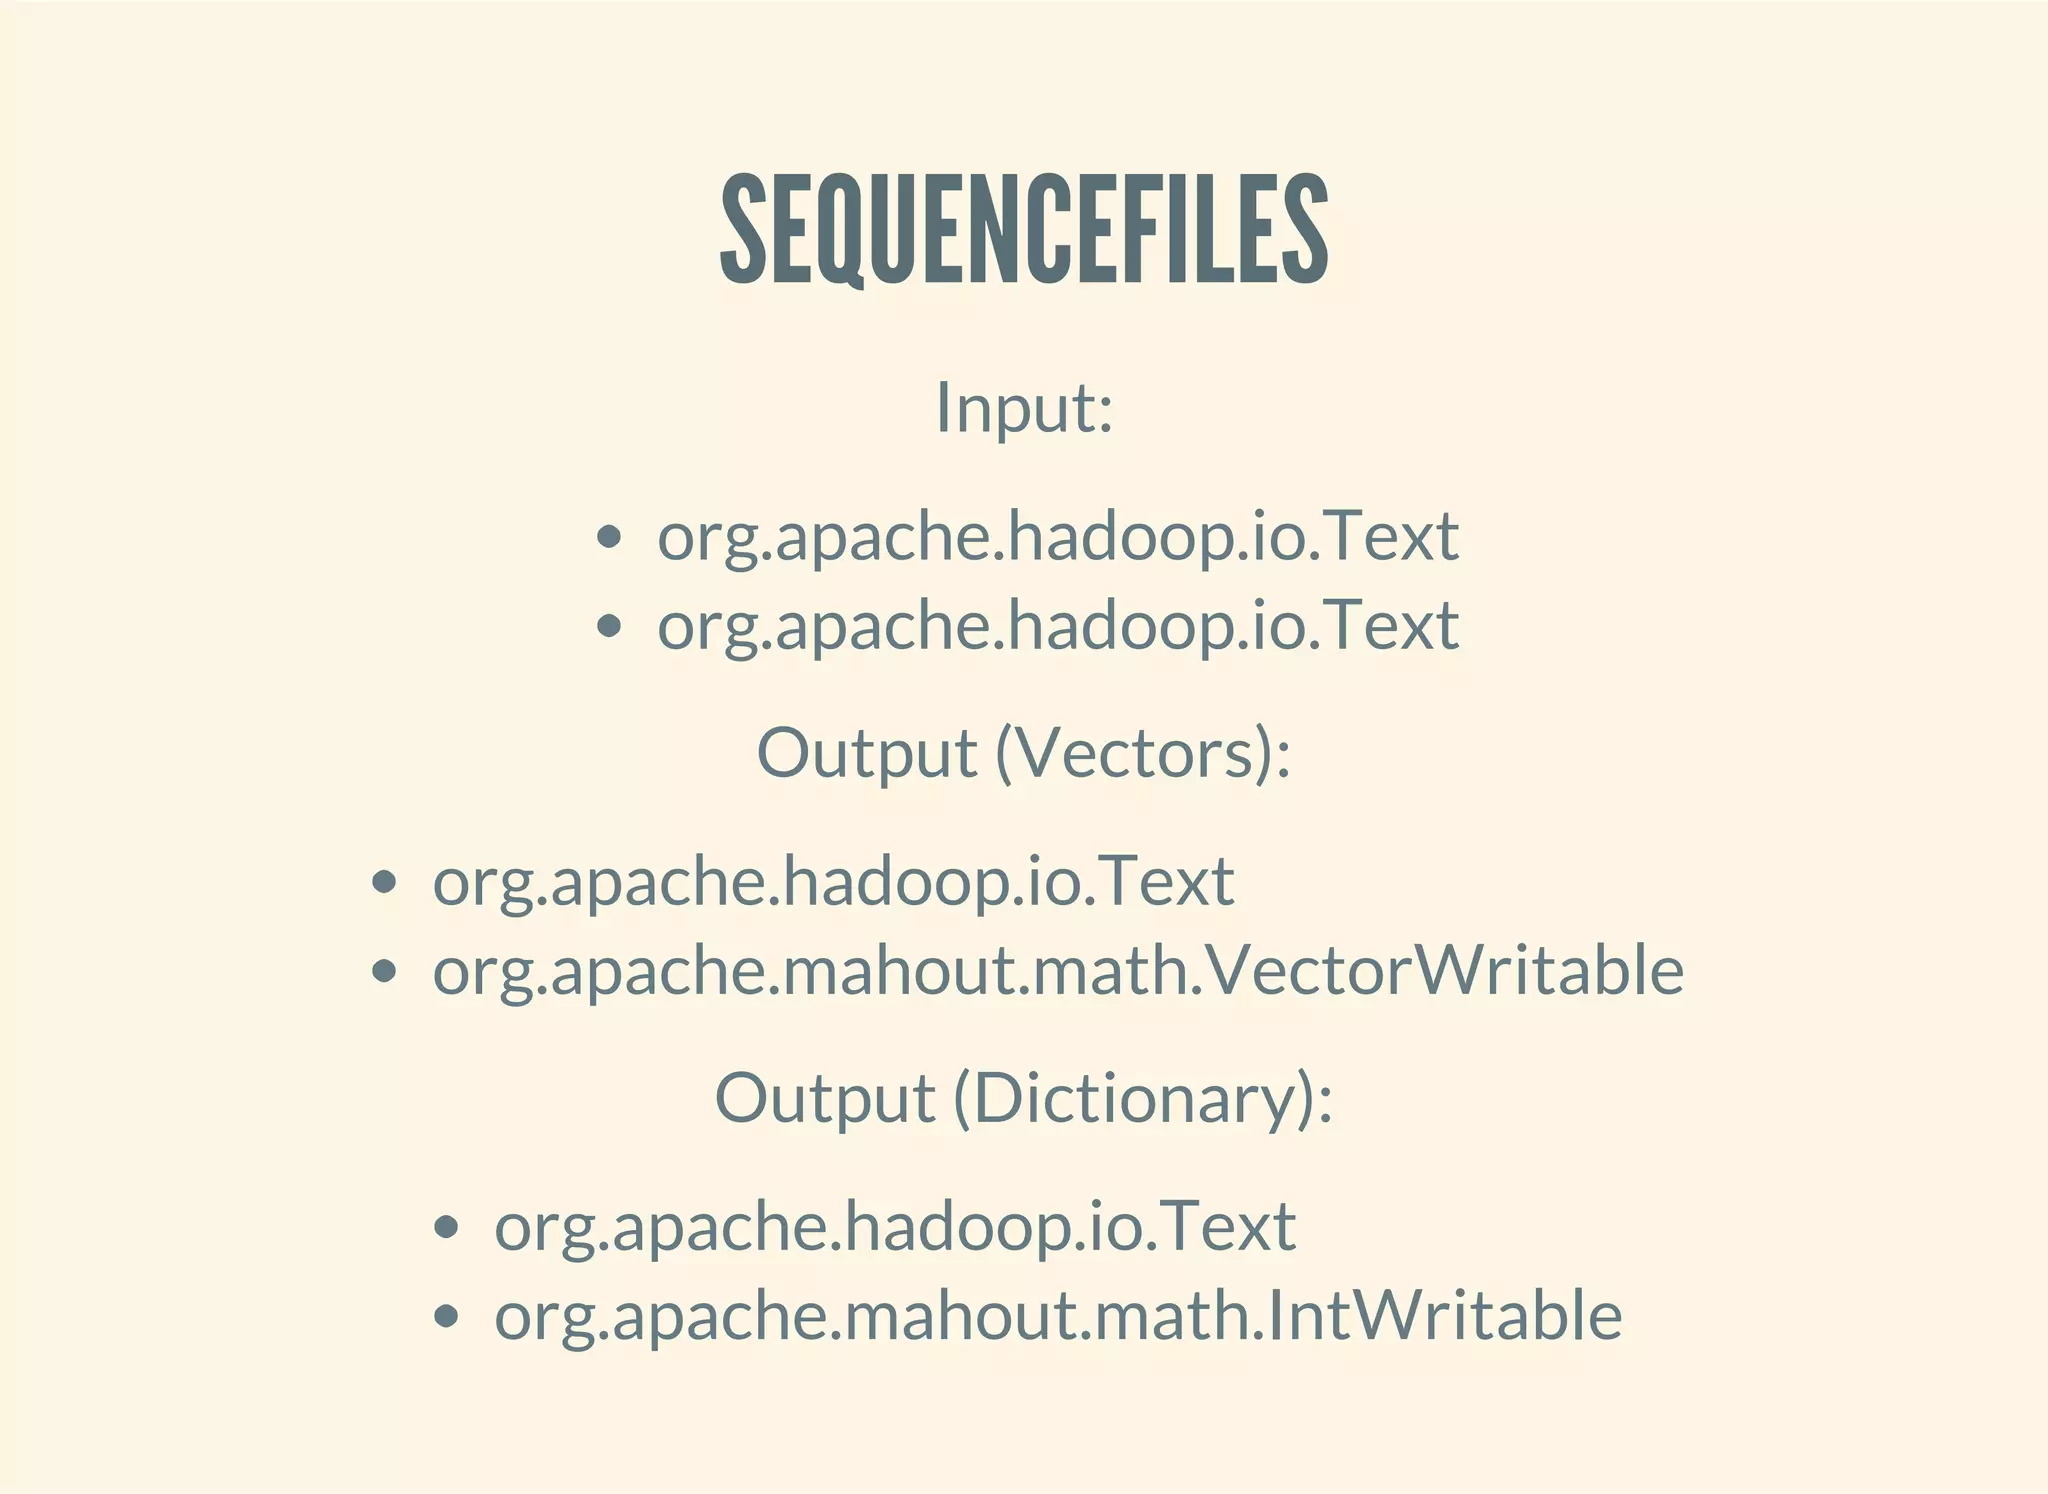
![THE FINISHED JOB
(import '[org.apache.hadoop.io Text]
'[org.apache.mahout.math VectorWritable])
(defn tfidf [conf dseq dictionary-path vector-path]
(let [doc-count (->> dseq (into []) count)
[df-data df-counts] (pg/execute (df-j dseq) conf `df)
dictionary-dval (make-dictionary conf df-data df-counts doc-coun
t)]
(write-dictionary dictionary-path dictionary-dval)
(-> (pg/input dseq)
(pg/map #'create-vectors-m dictionary-dval)
(pg/output (seqf/dsink [Text VectorWritable] vector-path))
(pg/fexecute conf `vectorize))))
(defn tool [conf input output]
(let [dseq (seqf/dseq input)
dictionary-path (doto (str output "/dictionary") fs/path-delete)
vector-path (doto (str output "/vectors") fs/path-delete)]
(tfidf conf dseq dictionary-path vector-path)))
(defn -main [& args]
(System/exit (tool/run tool args)))](https://image.slidesharecdn.com/clojurefordatascience-150903135047-lva1-app6891/75/Clojure-for-Data-Science-142-2048.jpg)
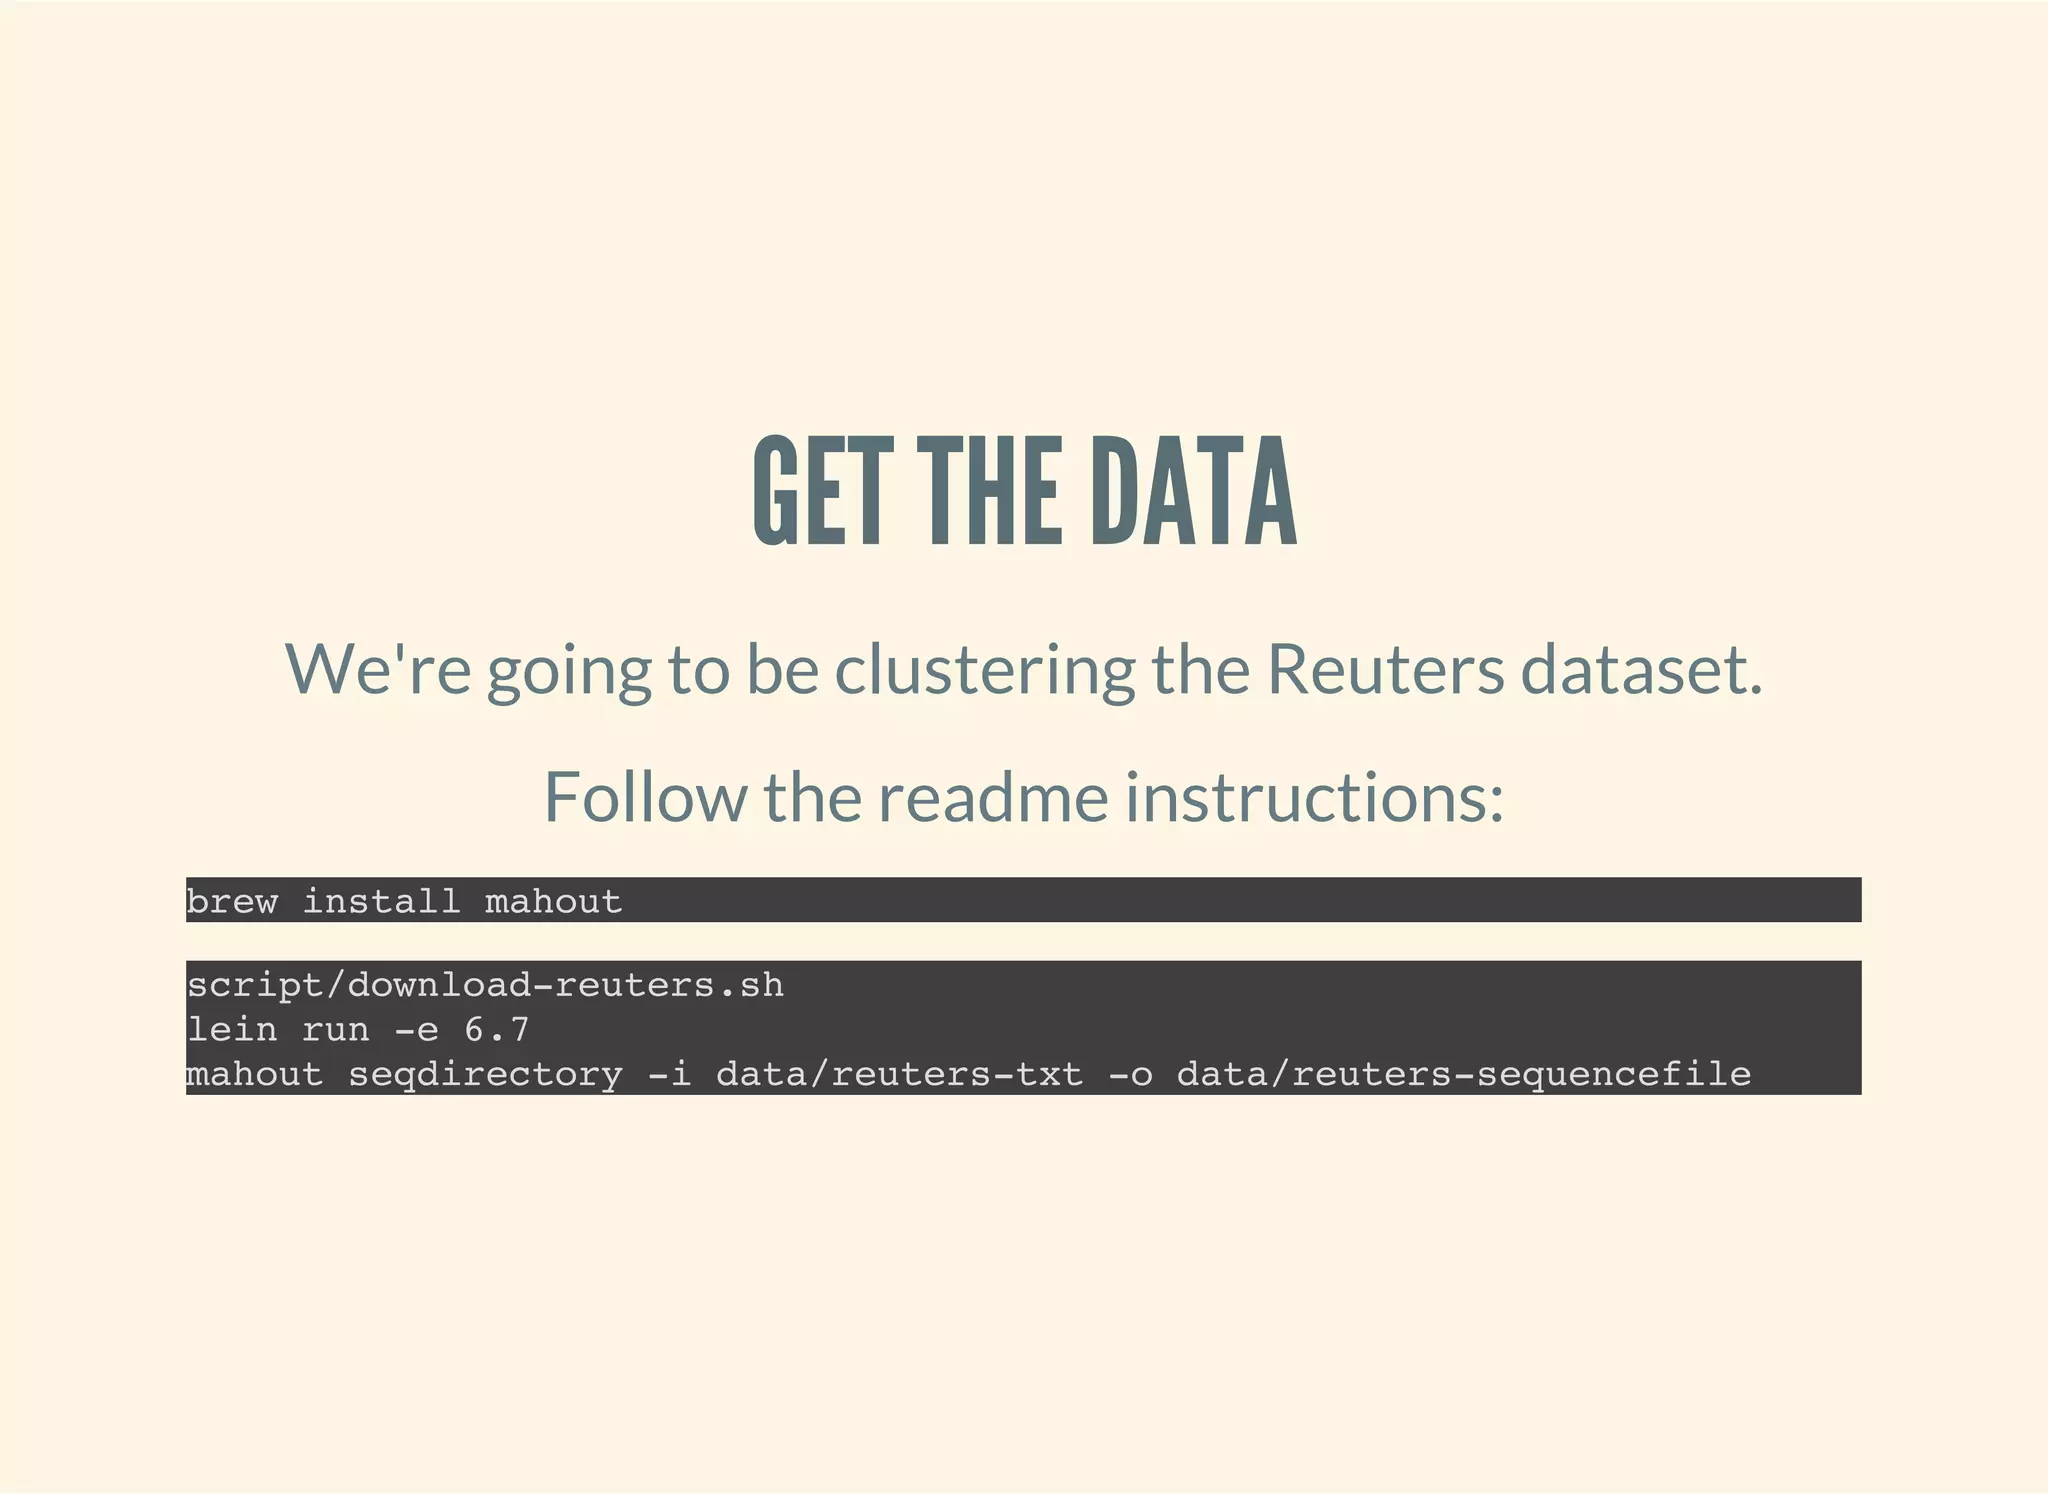
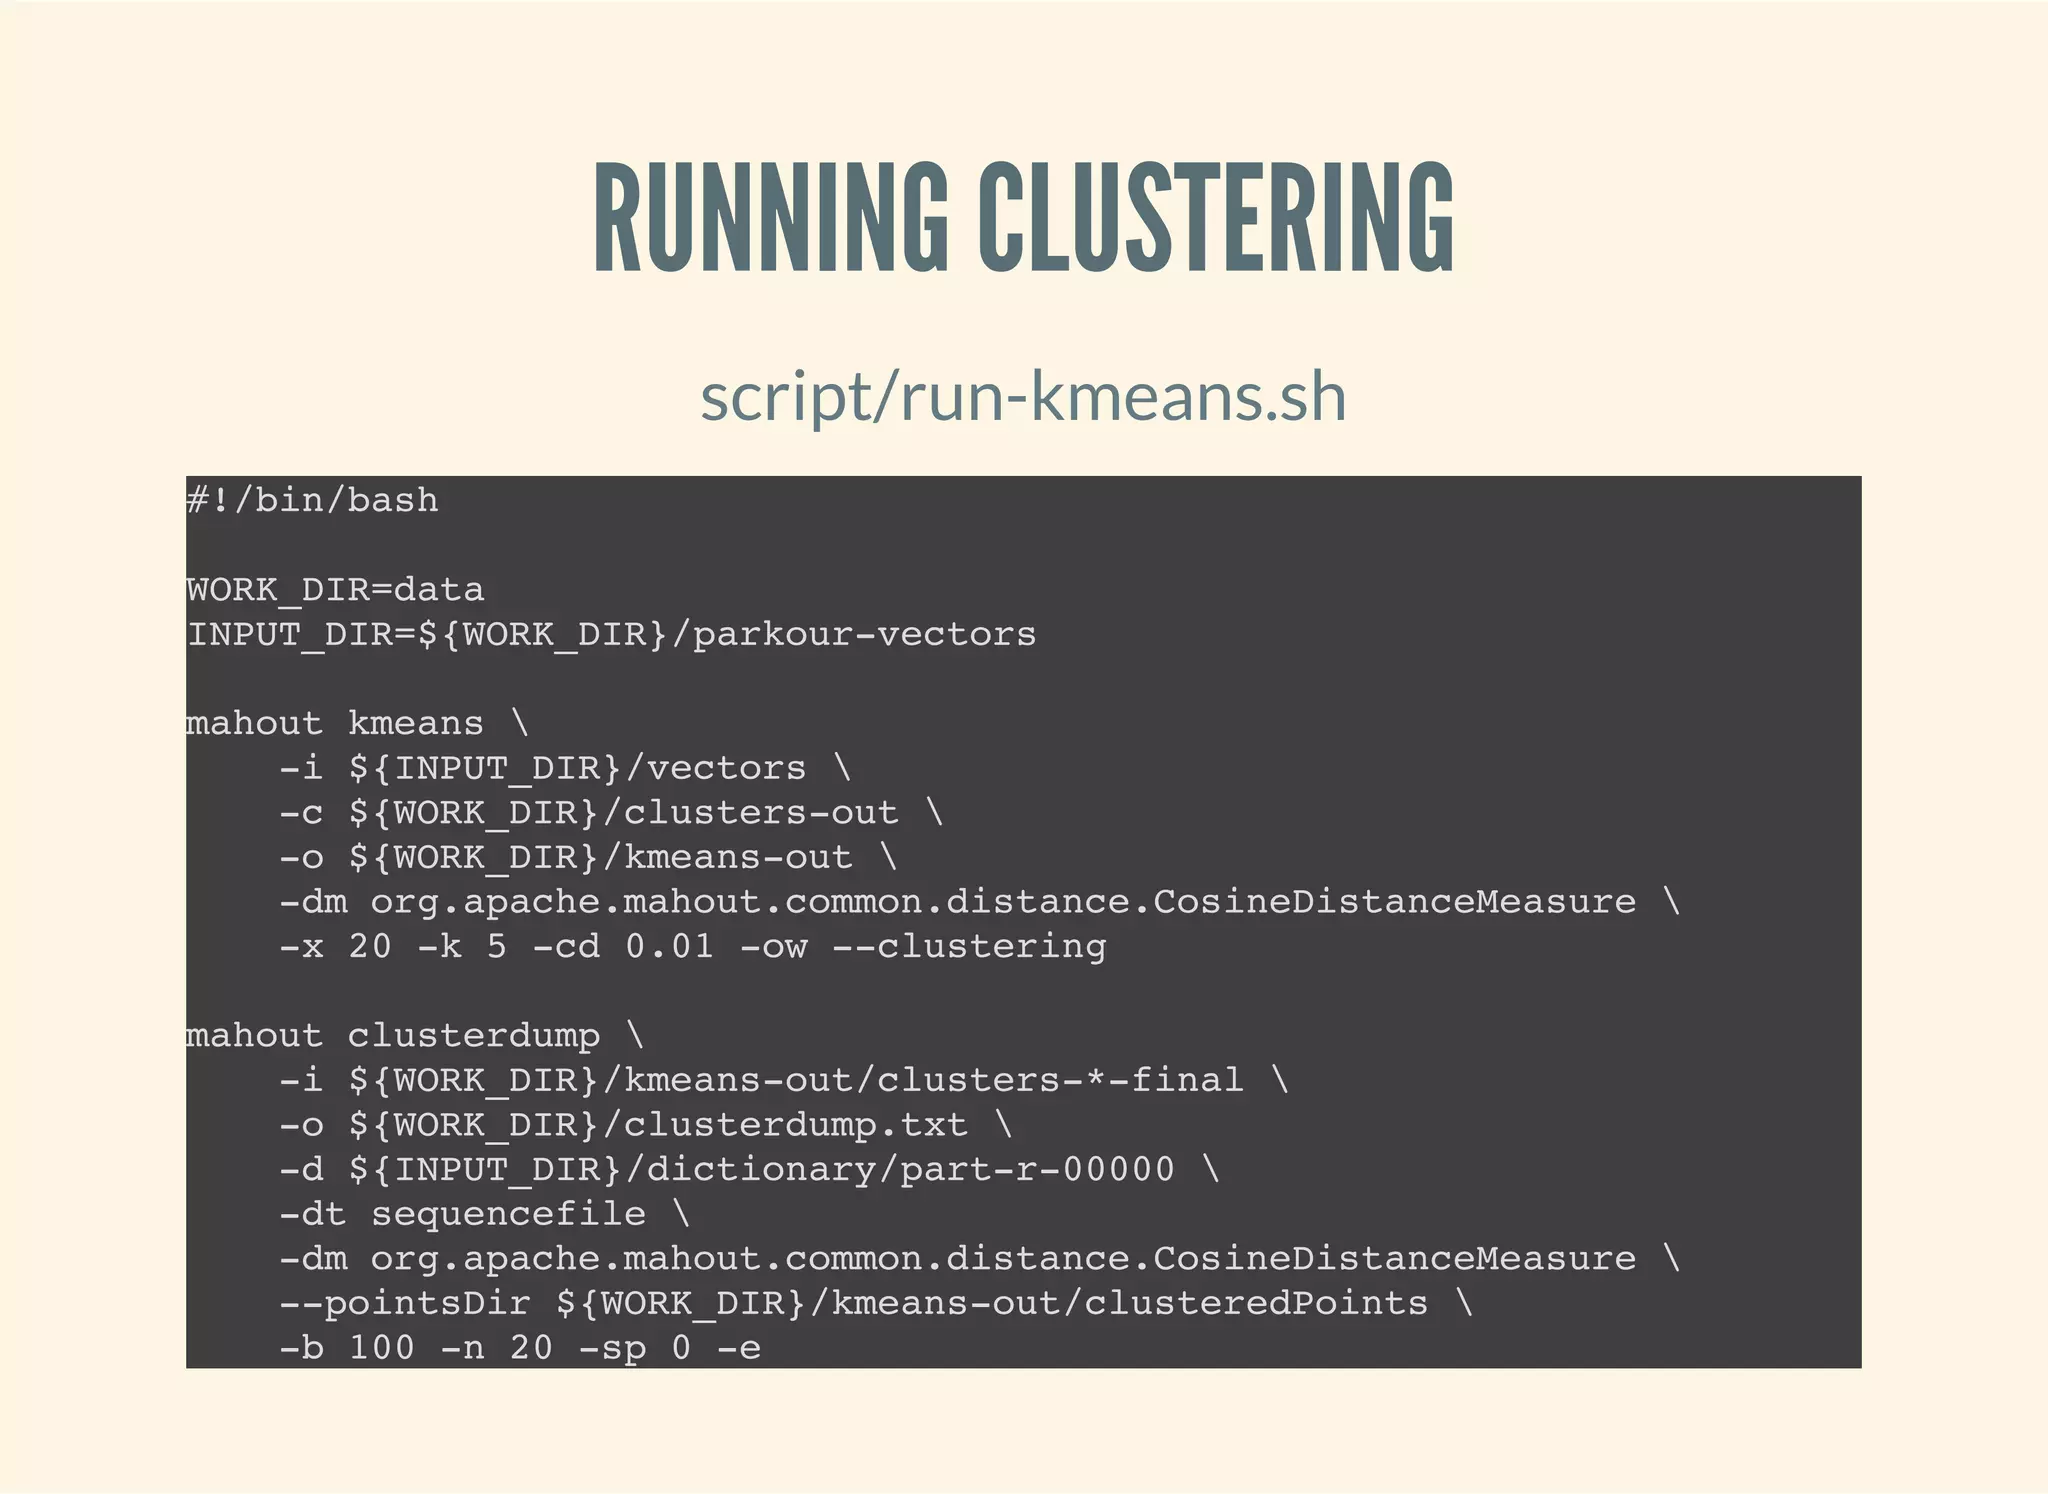
![RUN THE JOB
(defn ex-6-14 []
(let [input "data/reuters-sequencefile"
output "data/parkour-vectors"]
(tool/run vectorizer/tool [input output])))](https://image.slidesharecdn.com/clojurefordatascience-150903135047-lva1-app6891/75/Clojure-for-Data-Science-143-2048.jpg)


![[1062BPY12001] Data analysis with R / week 2](https://cdn.slidesharecdn.com/ss_thumbnails/dataanalyzer01-180307063046-thumbnail.jpg?width=640&height=640&fit=bounds)