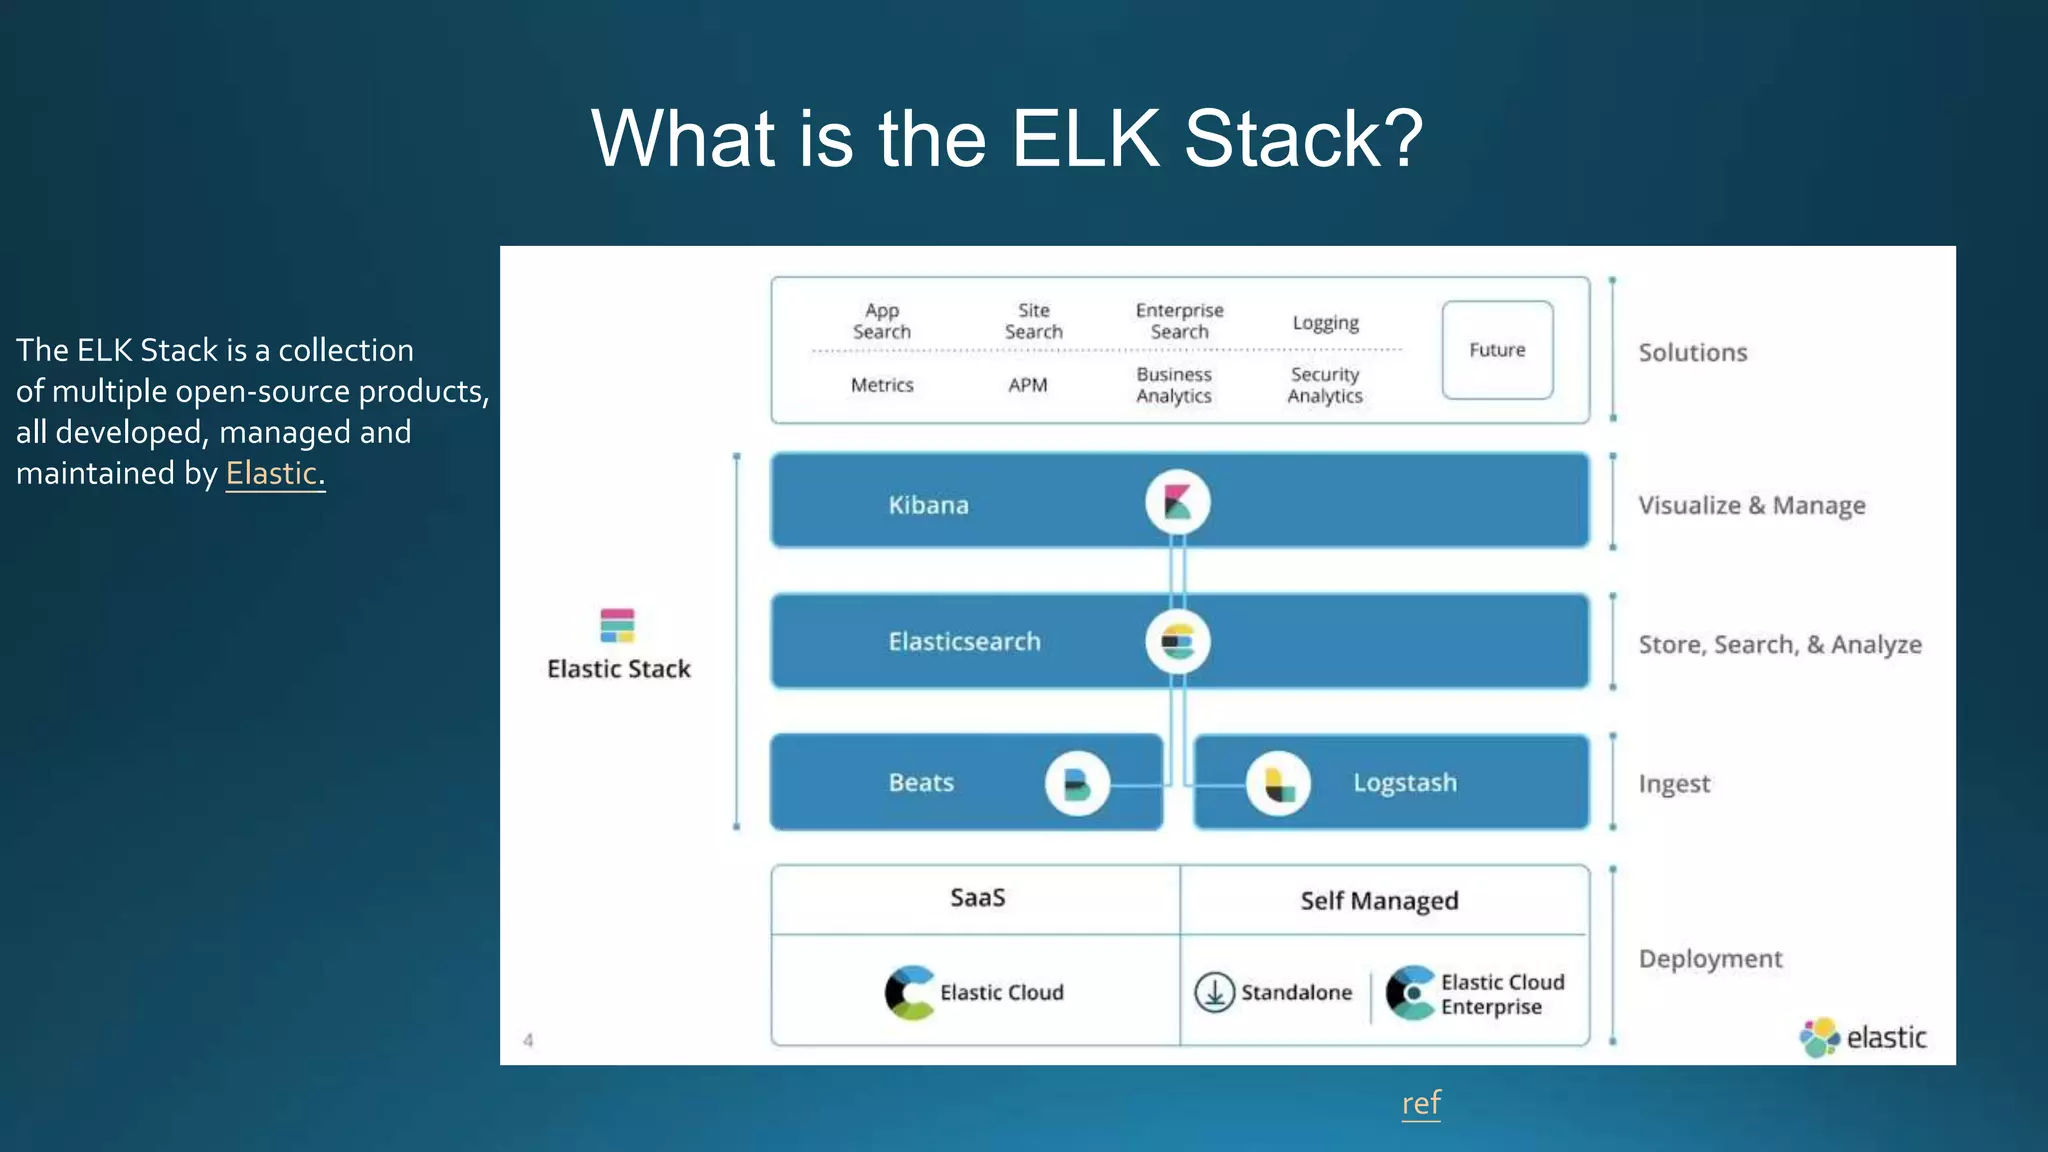
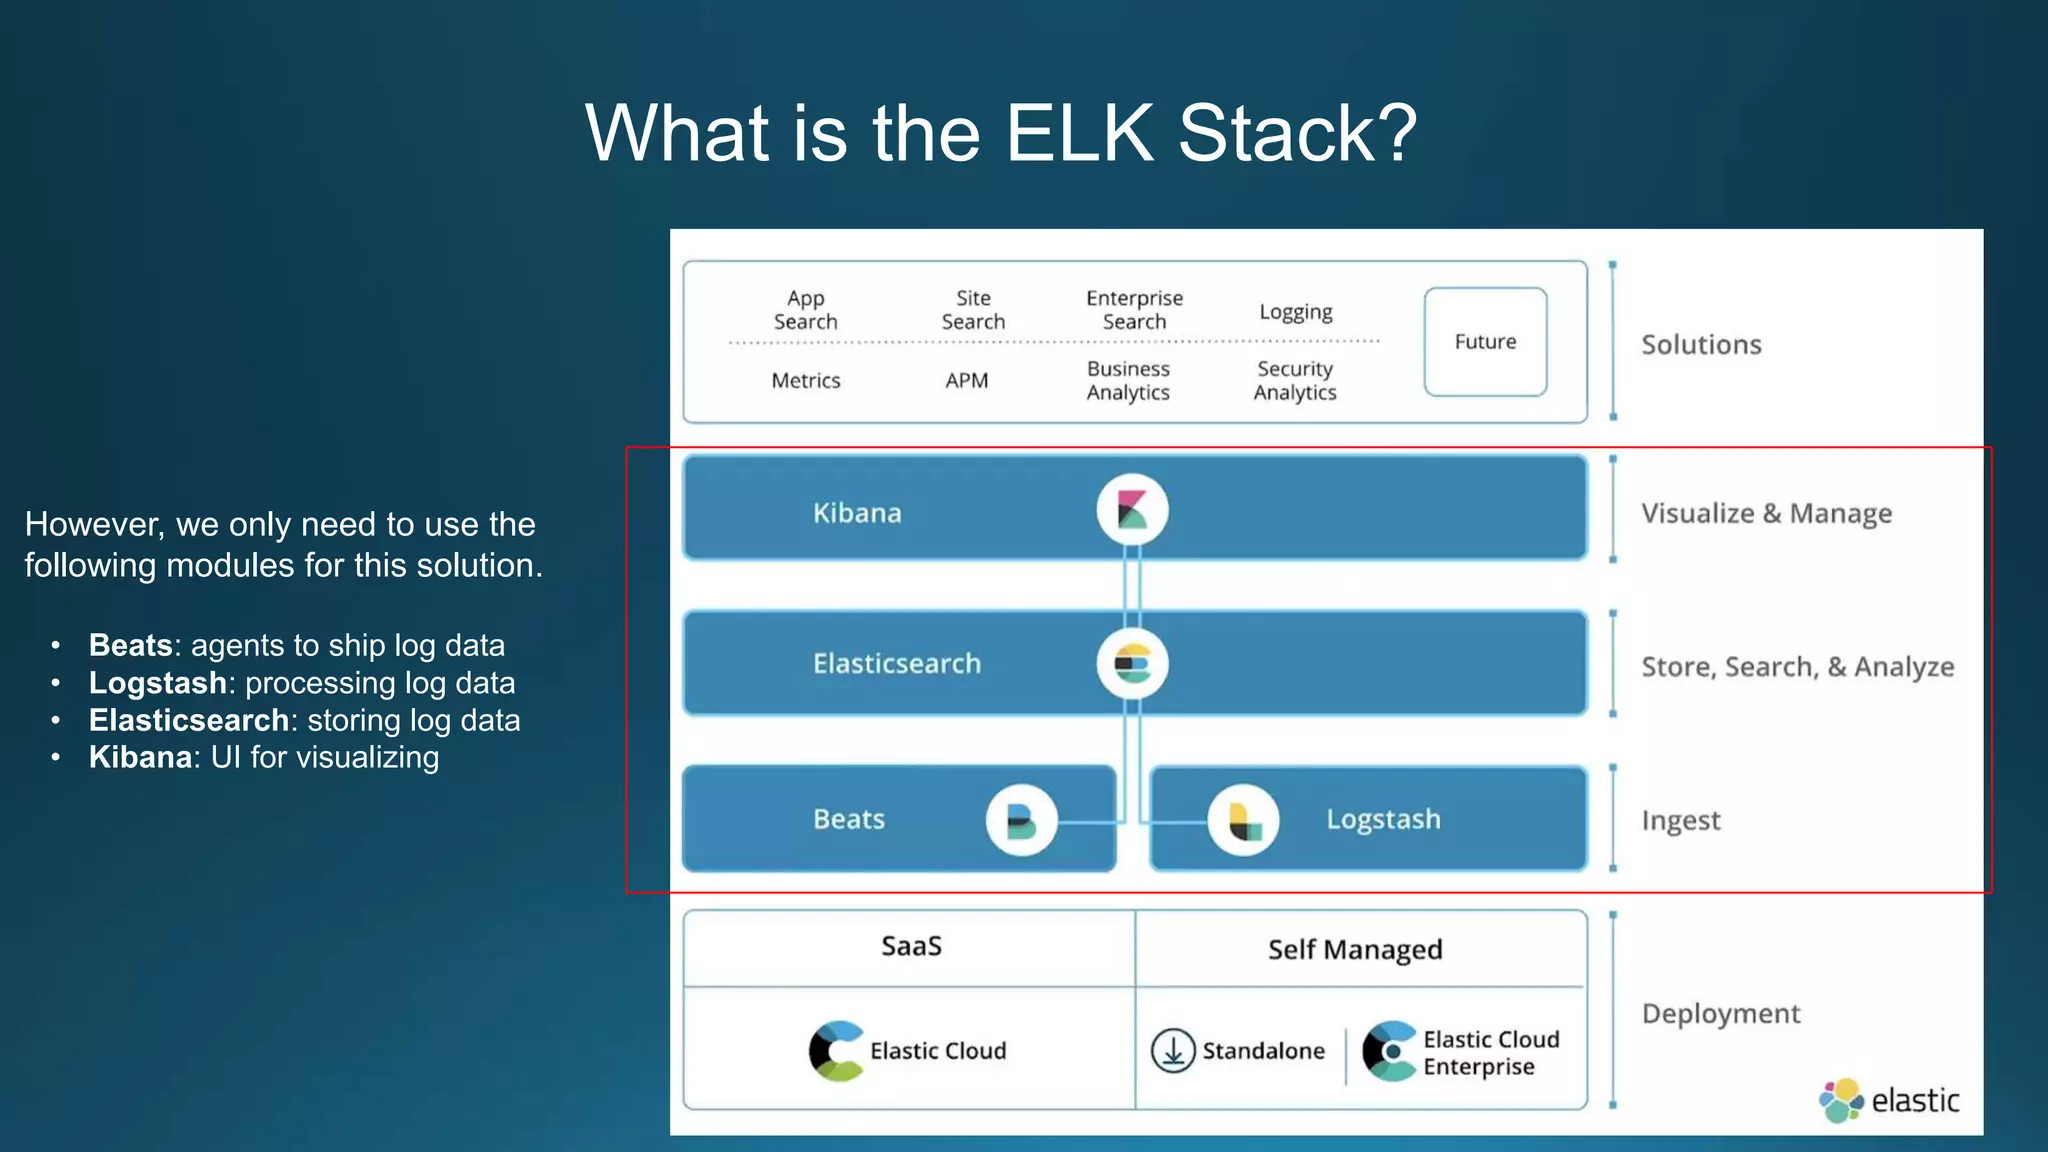
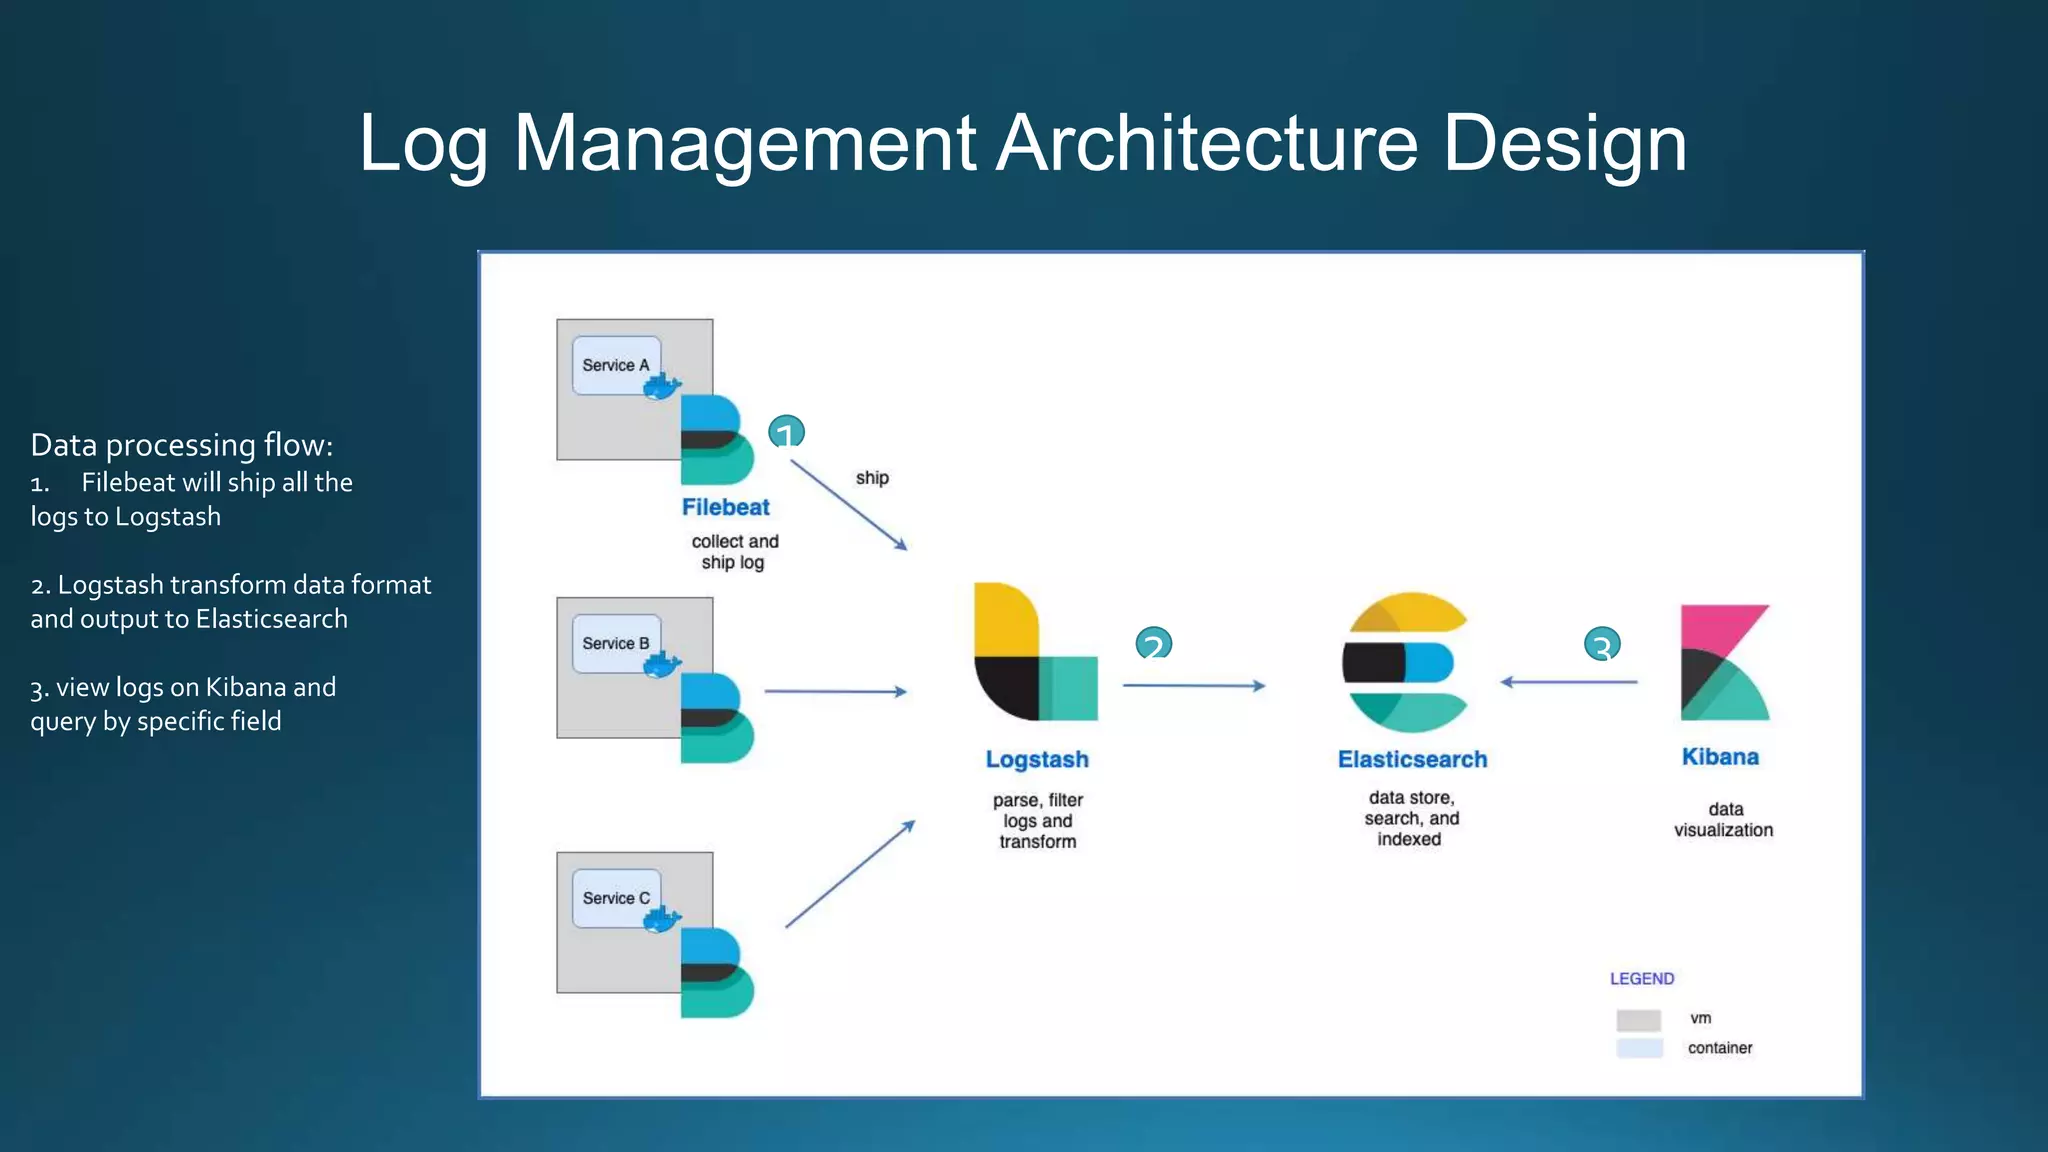
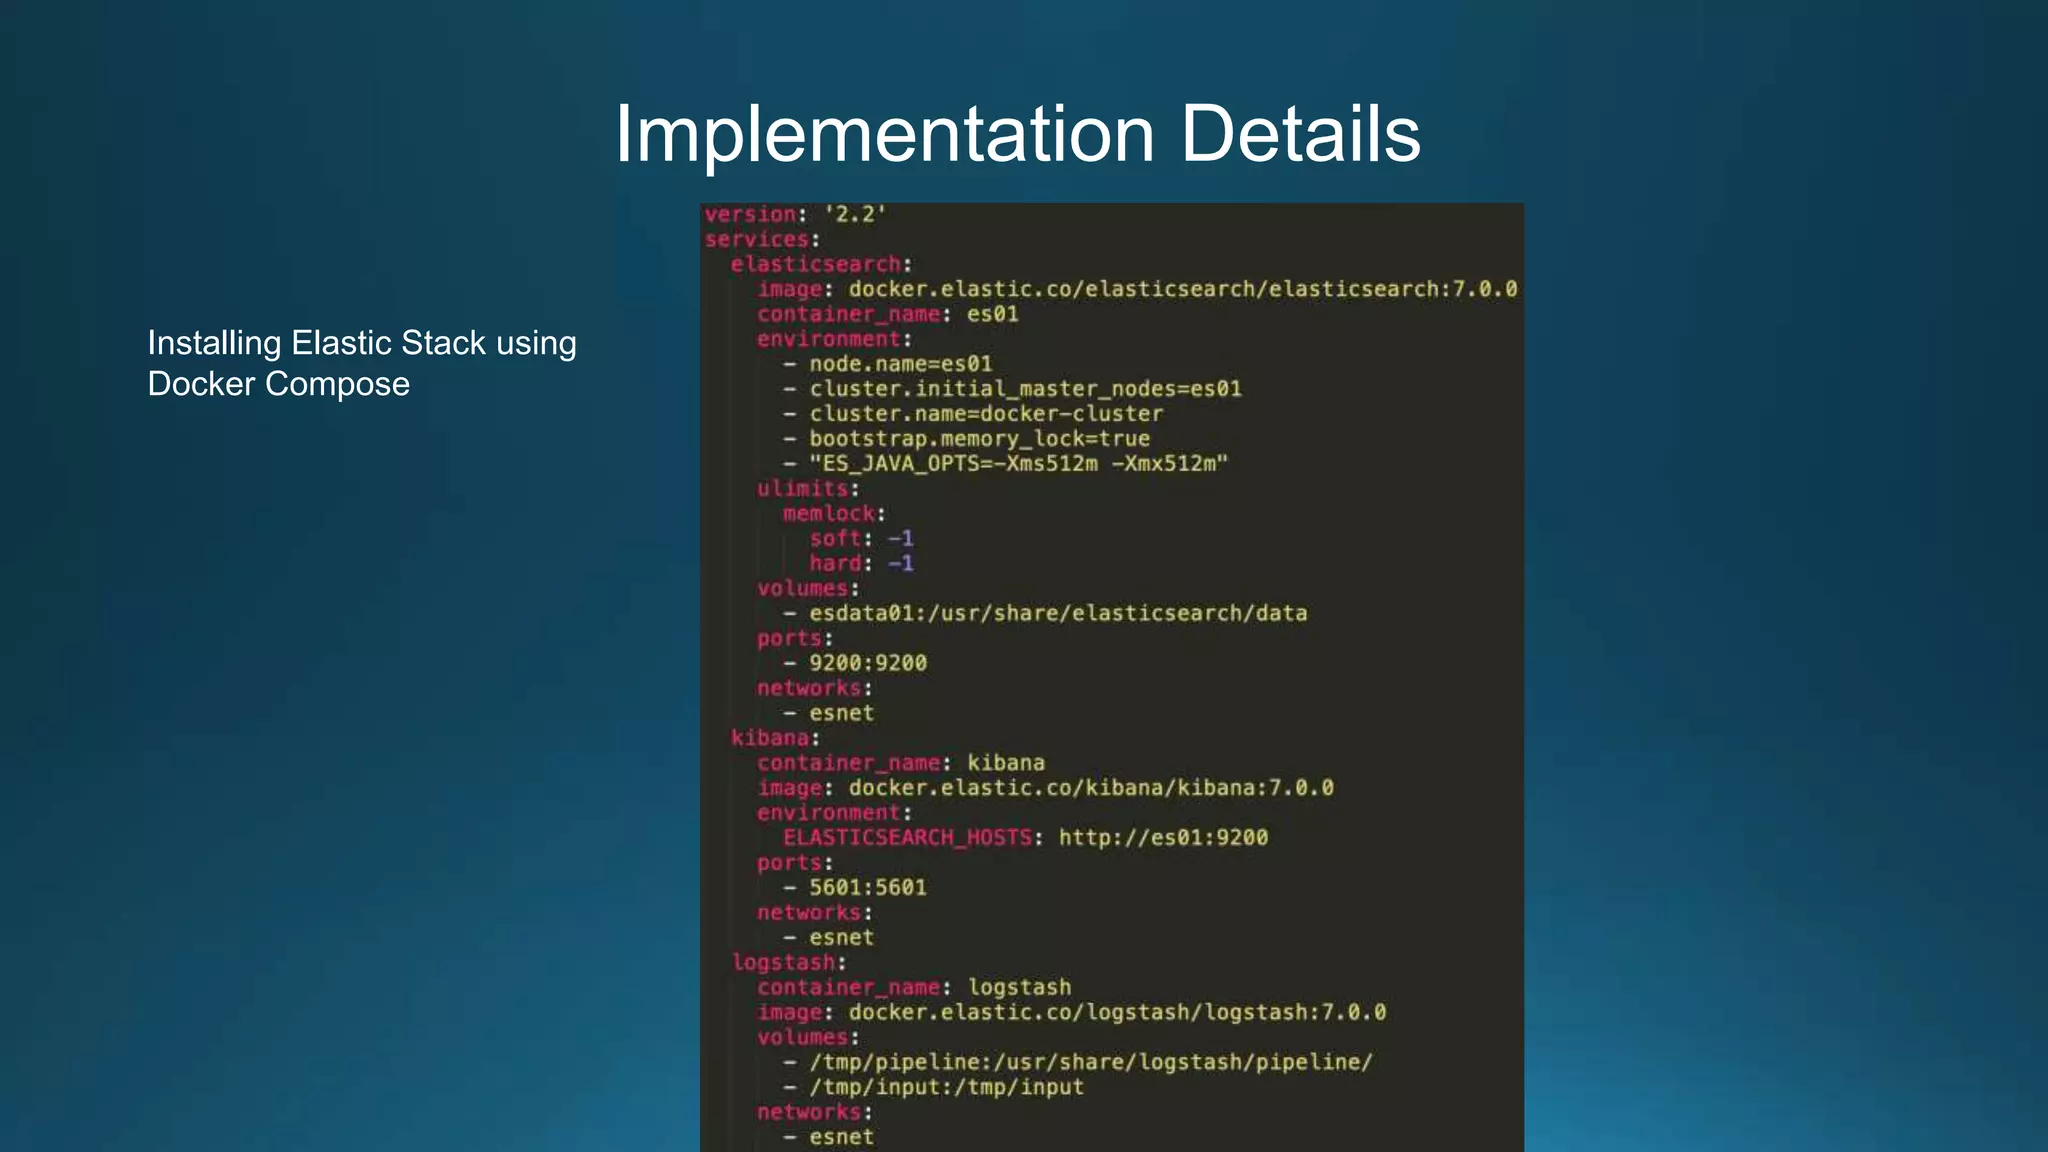
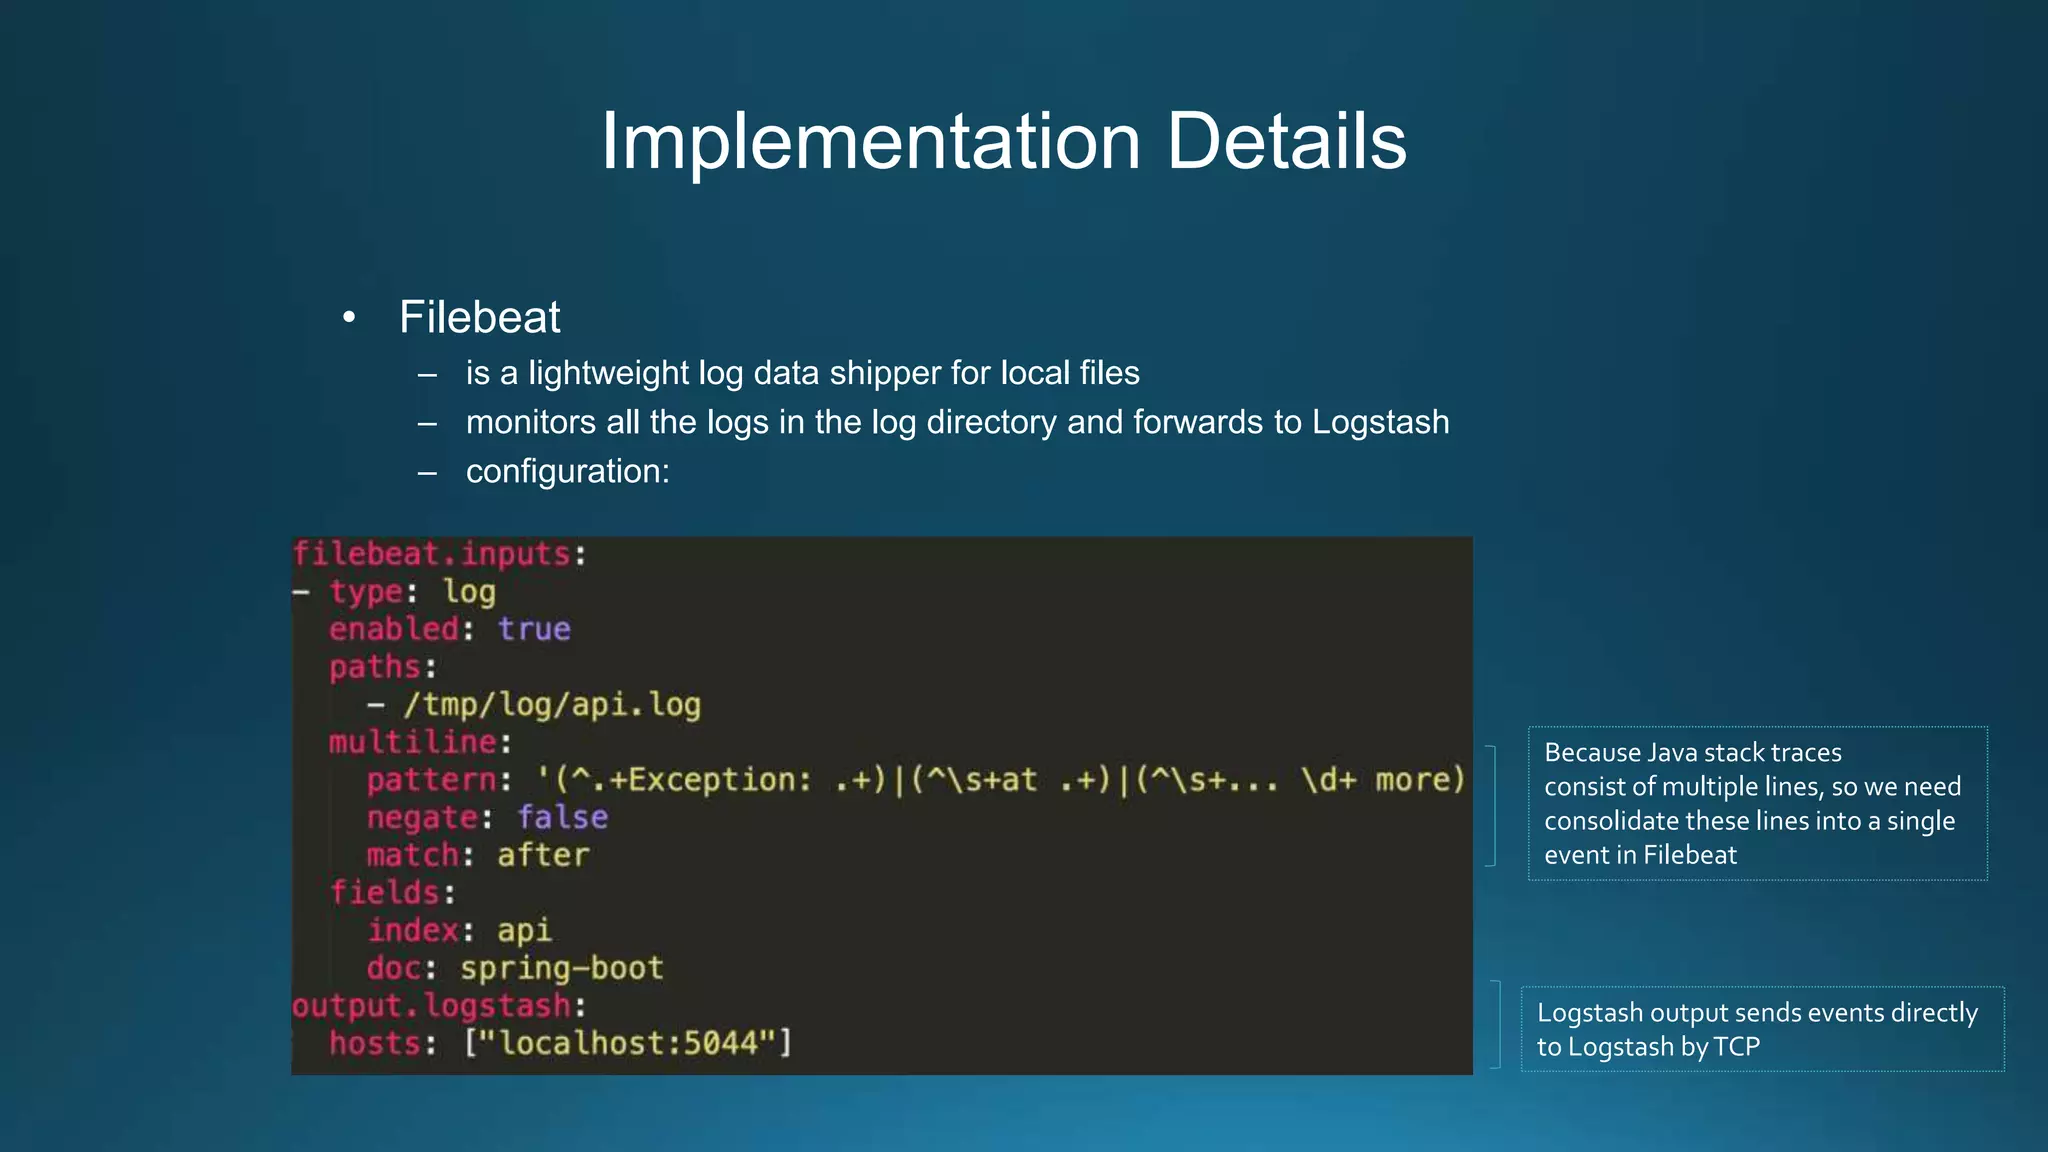
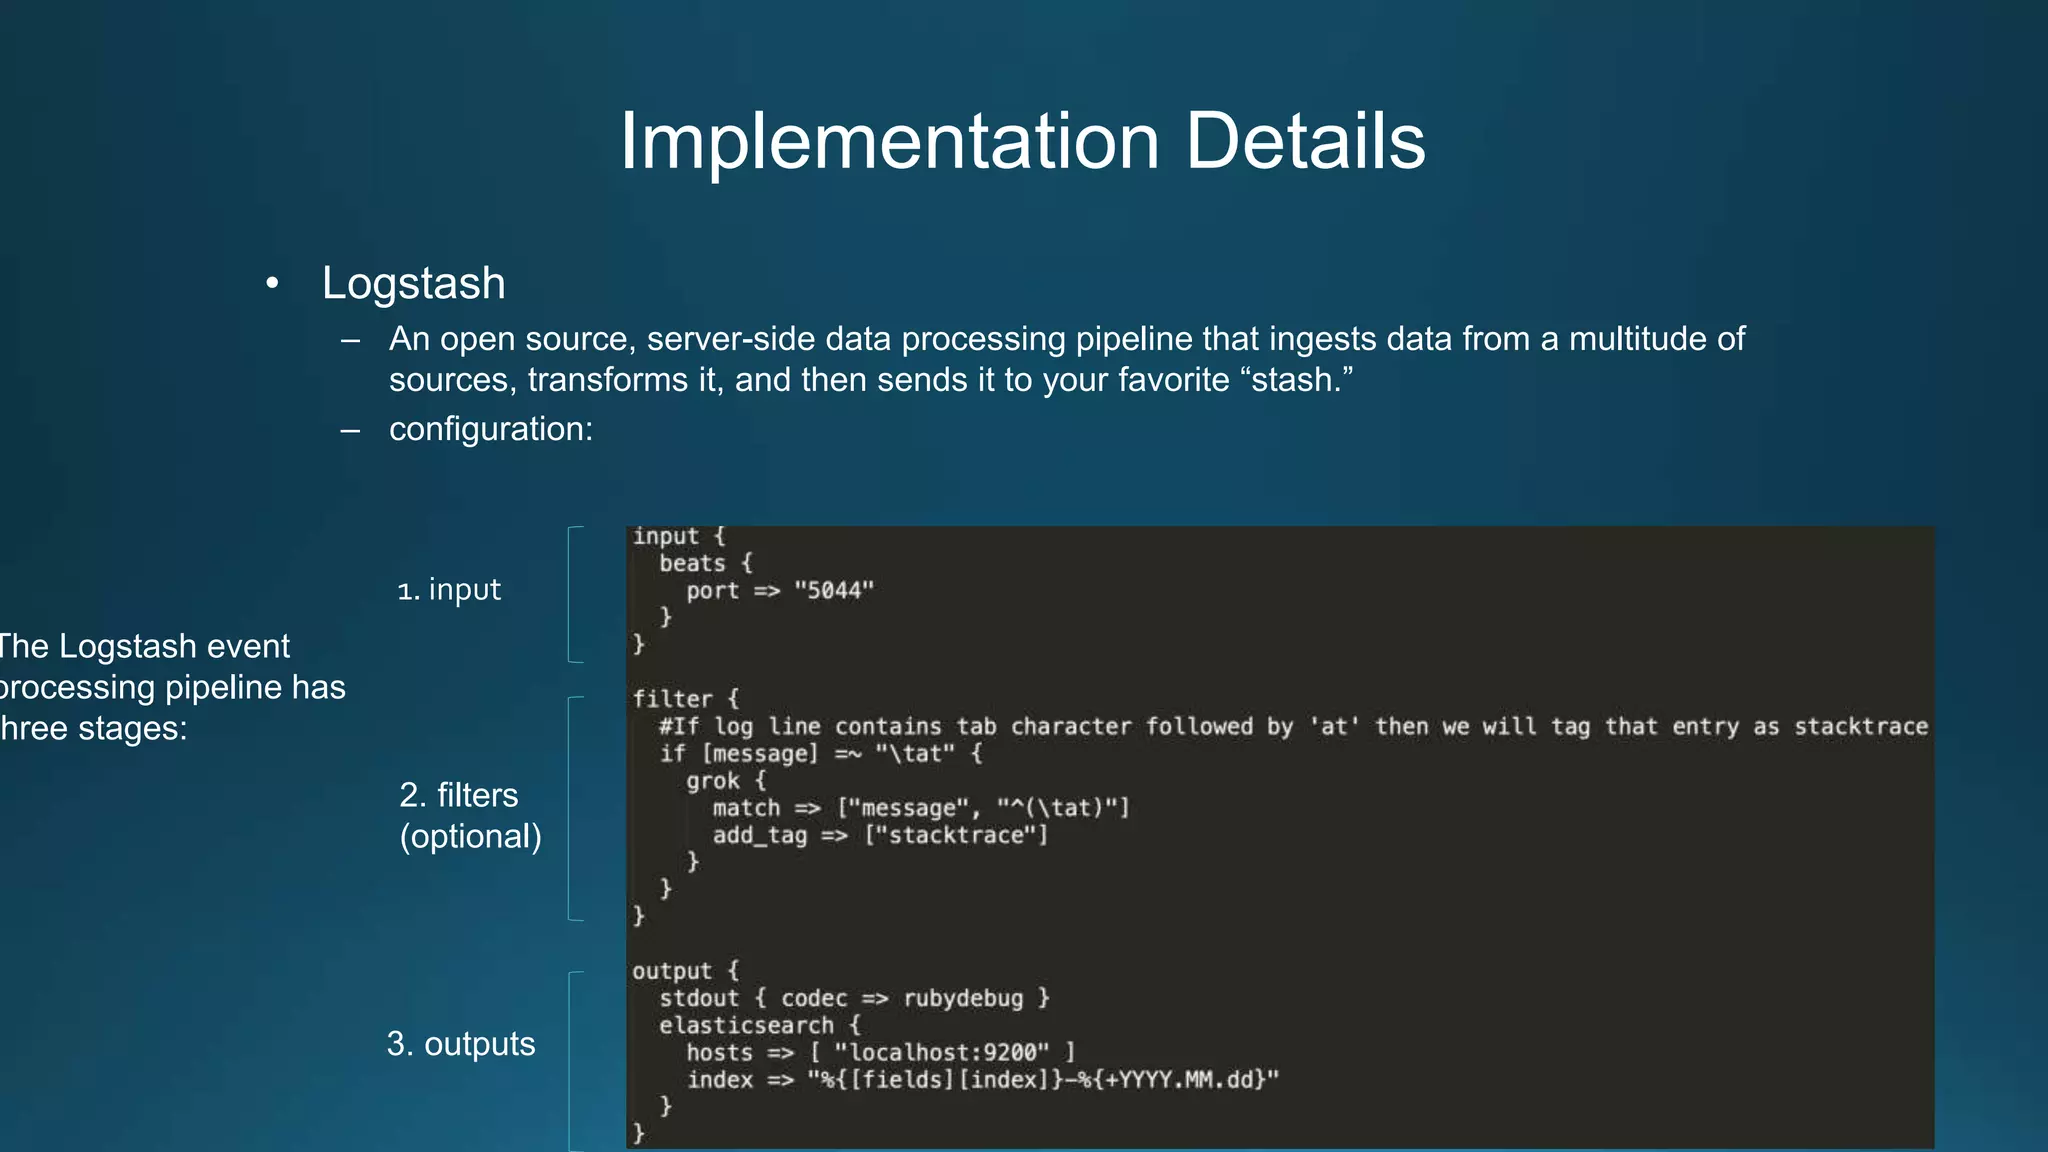
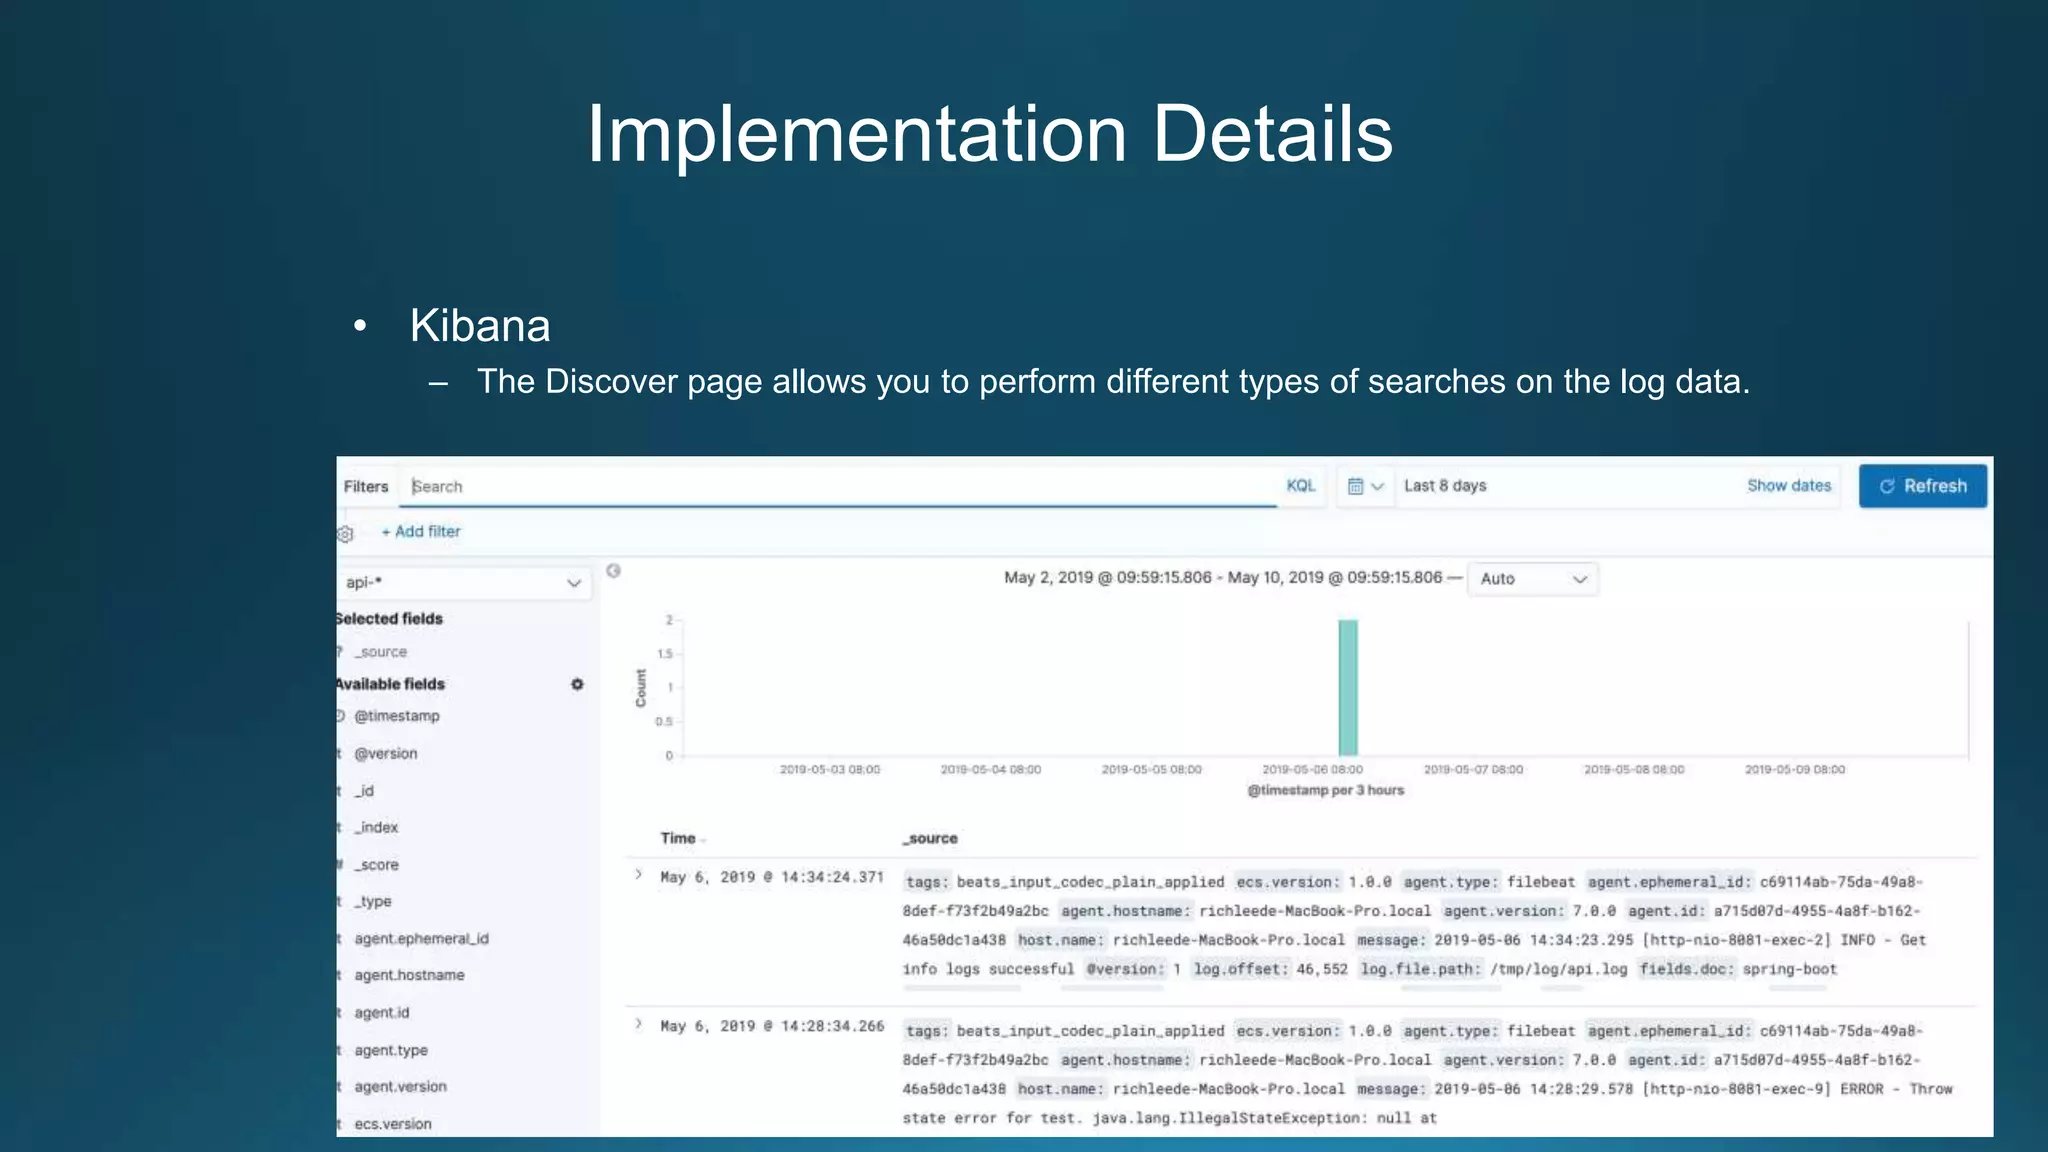
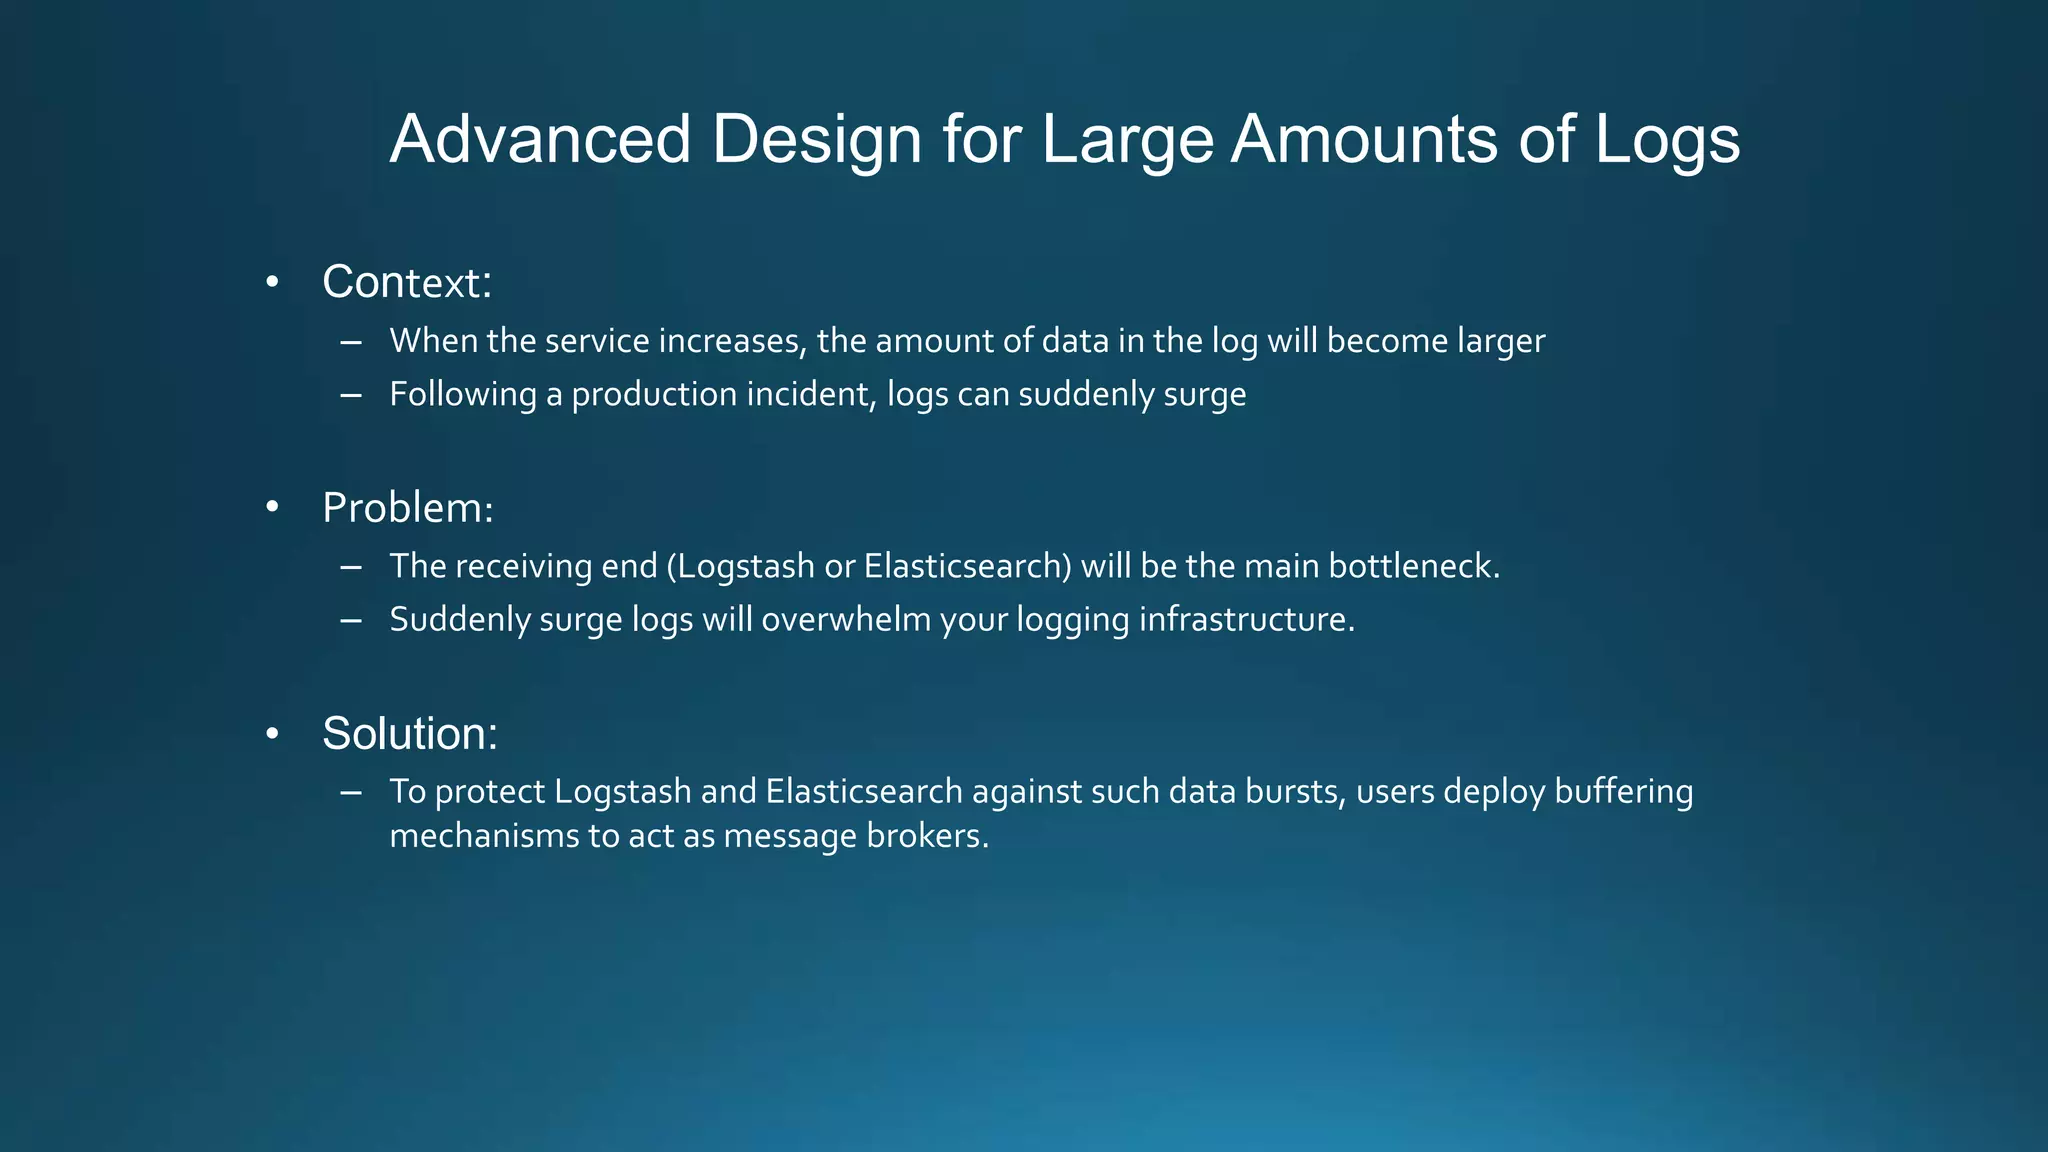
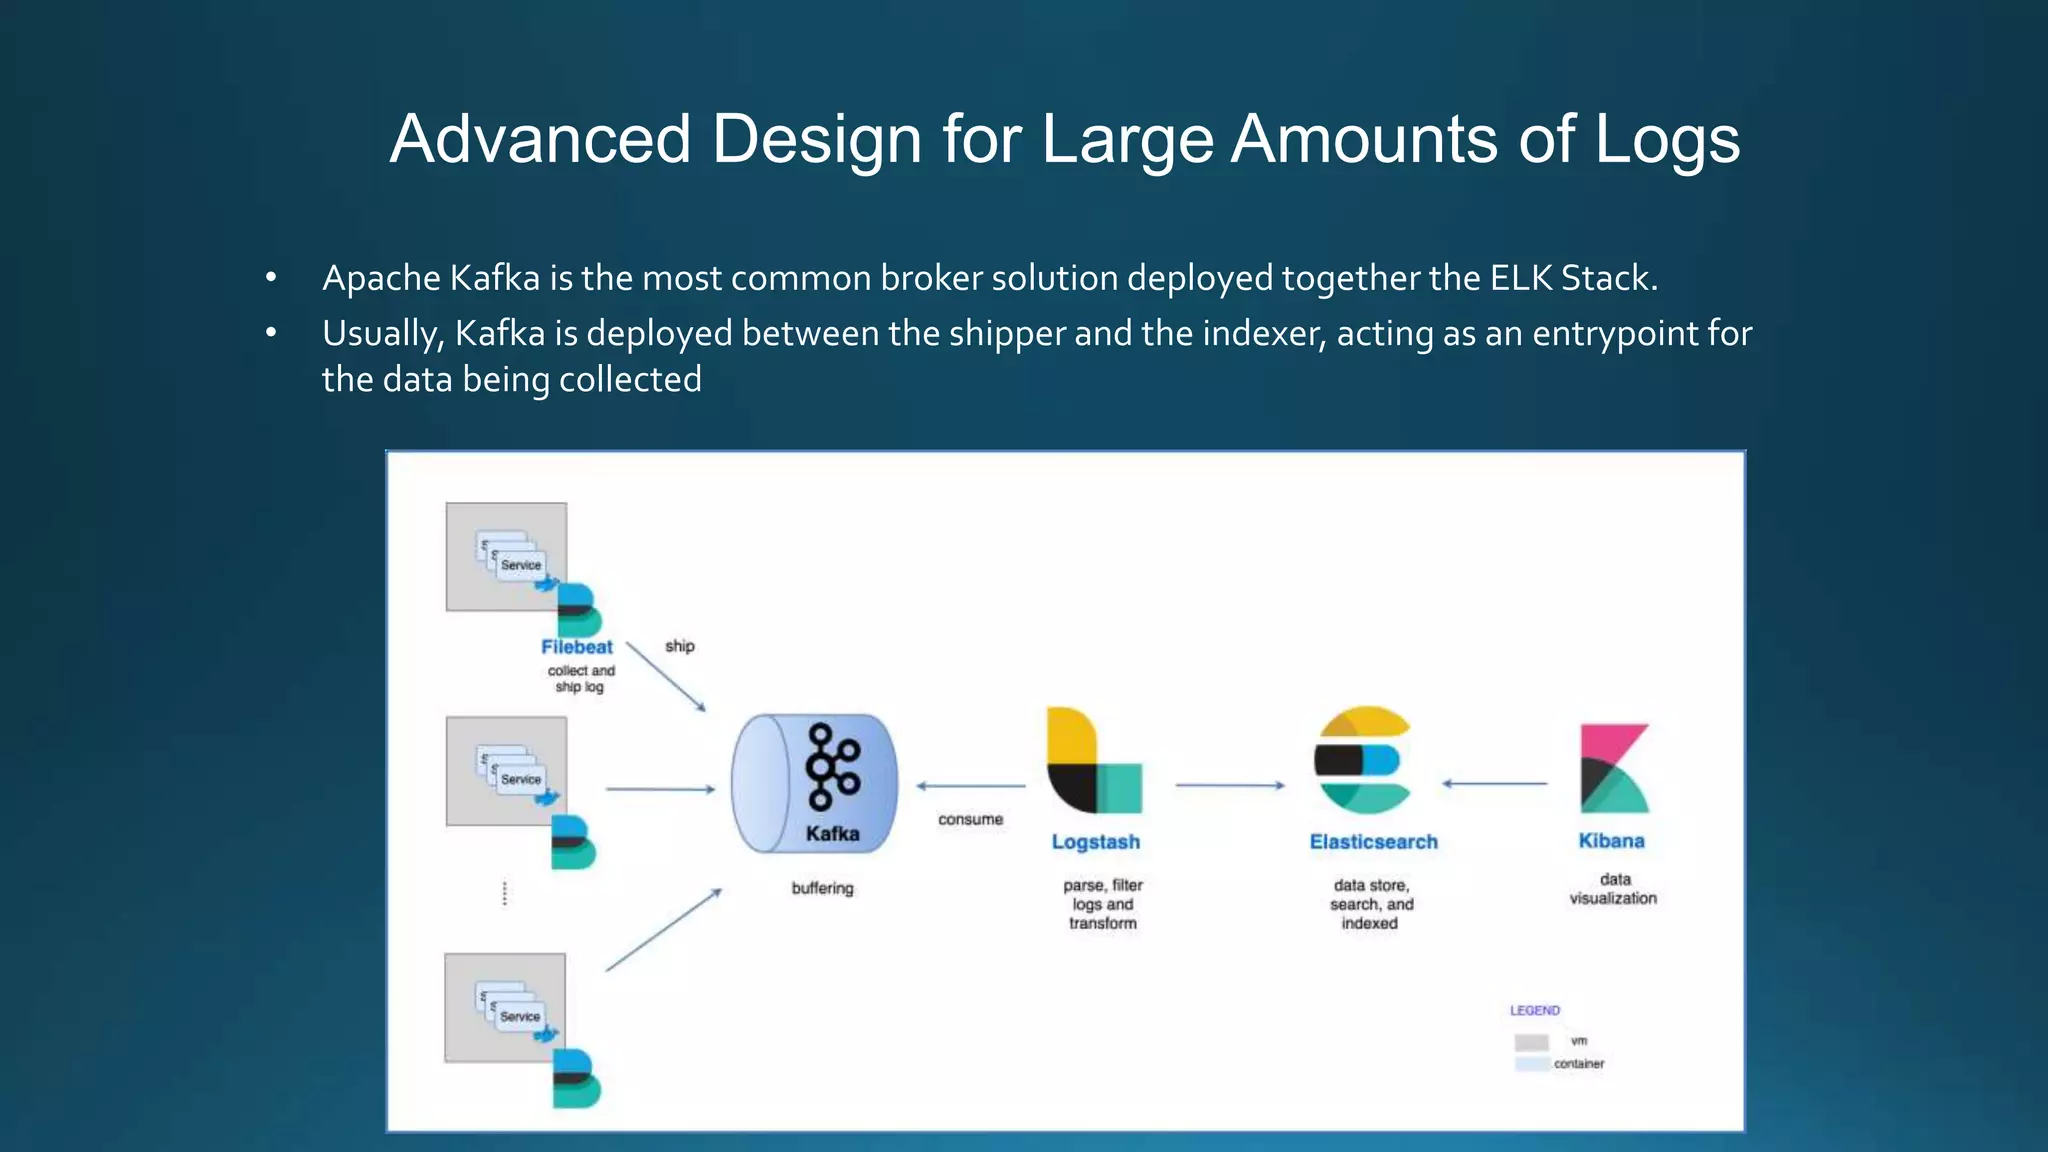
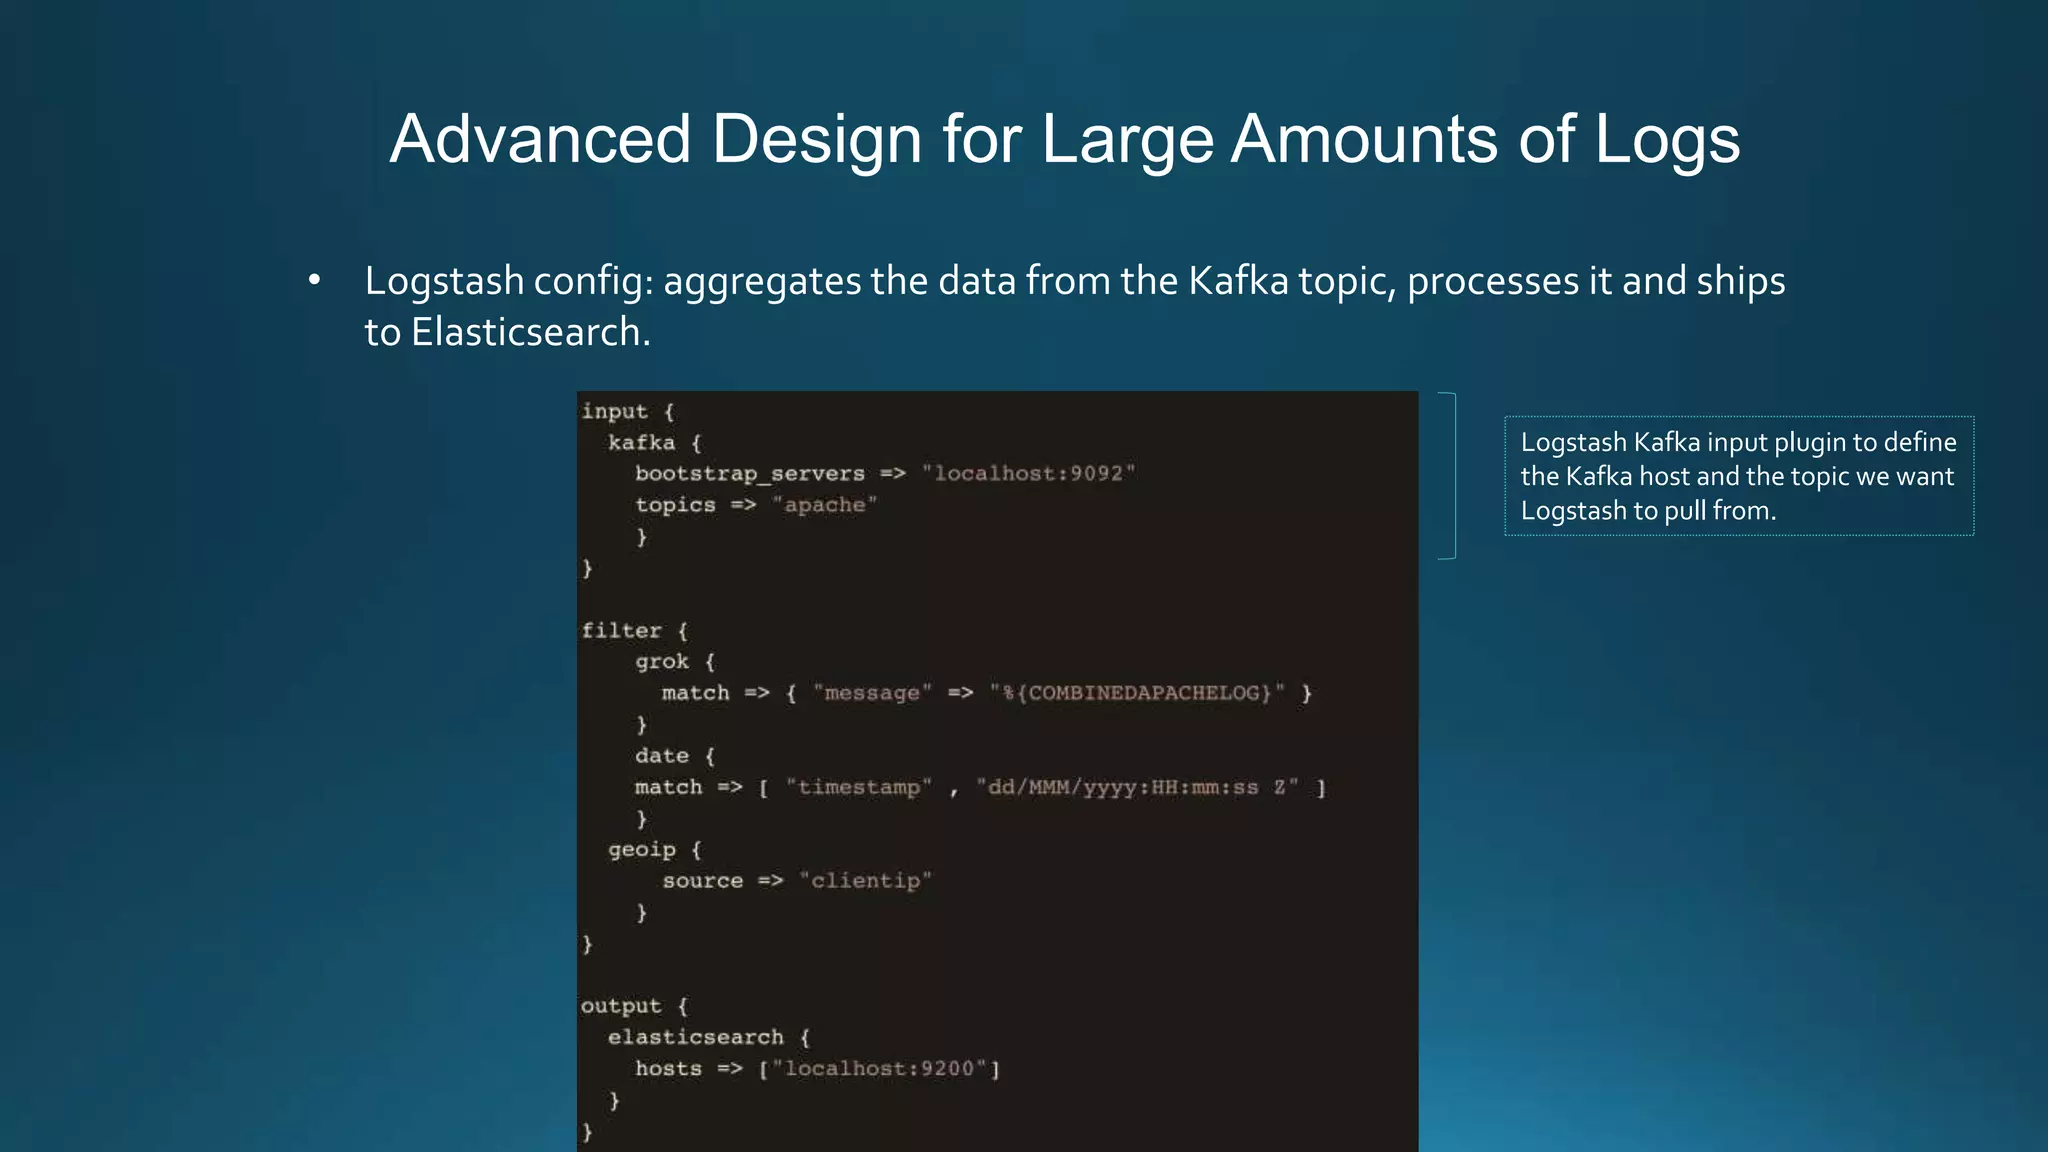
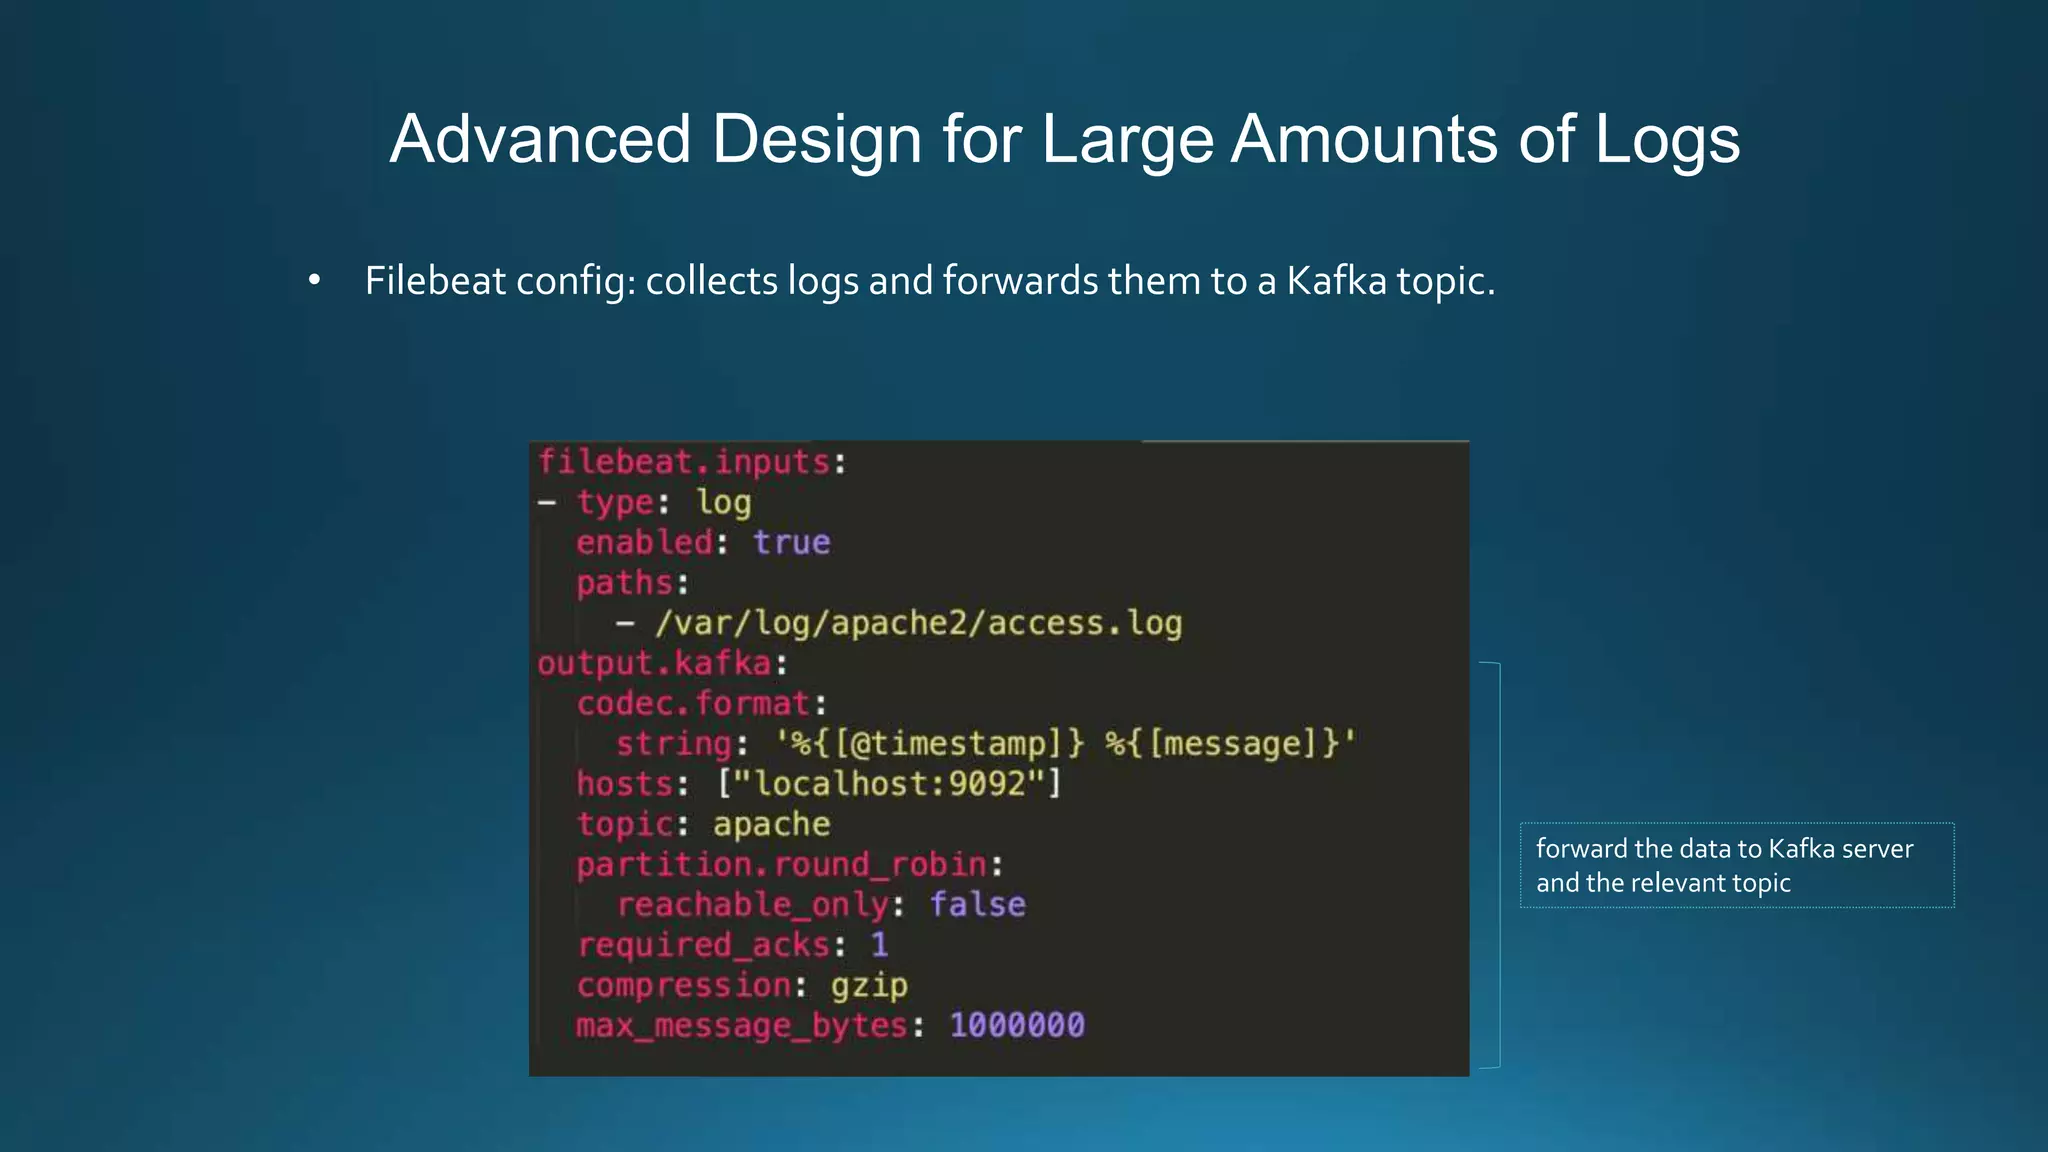
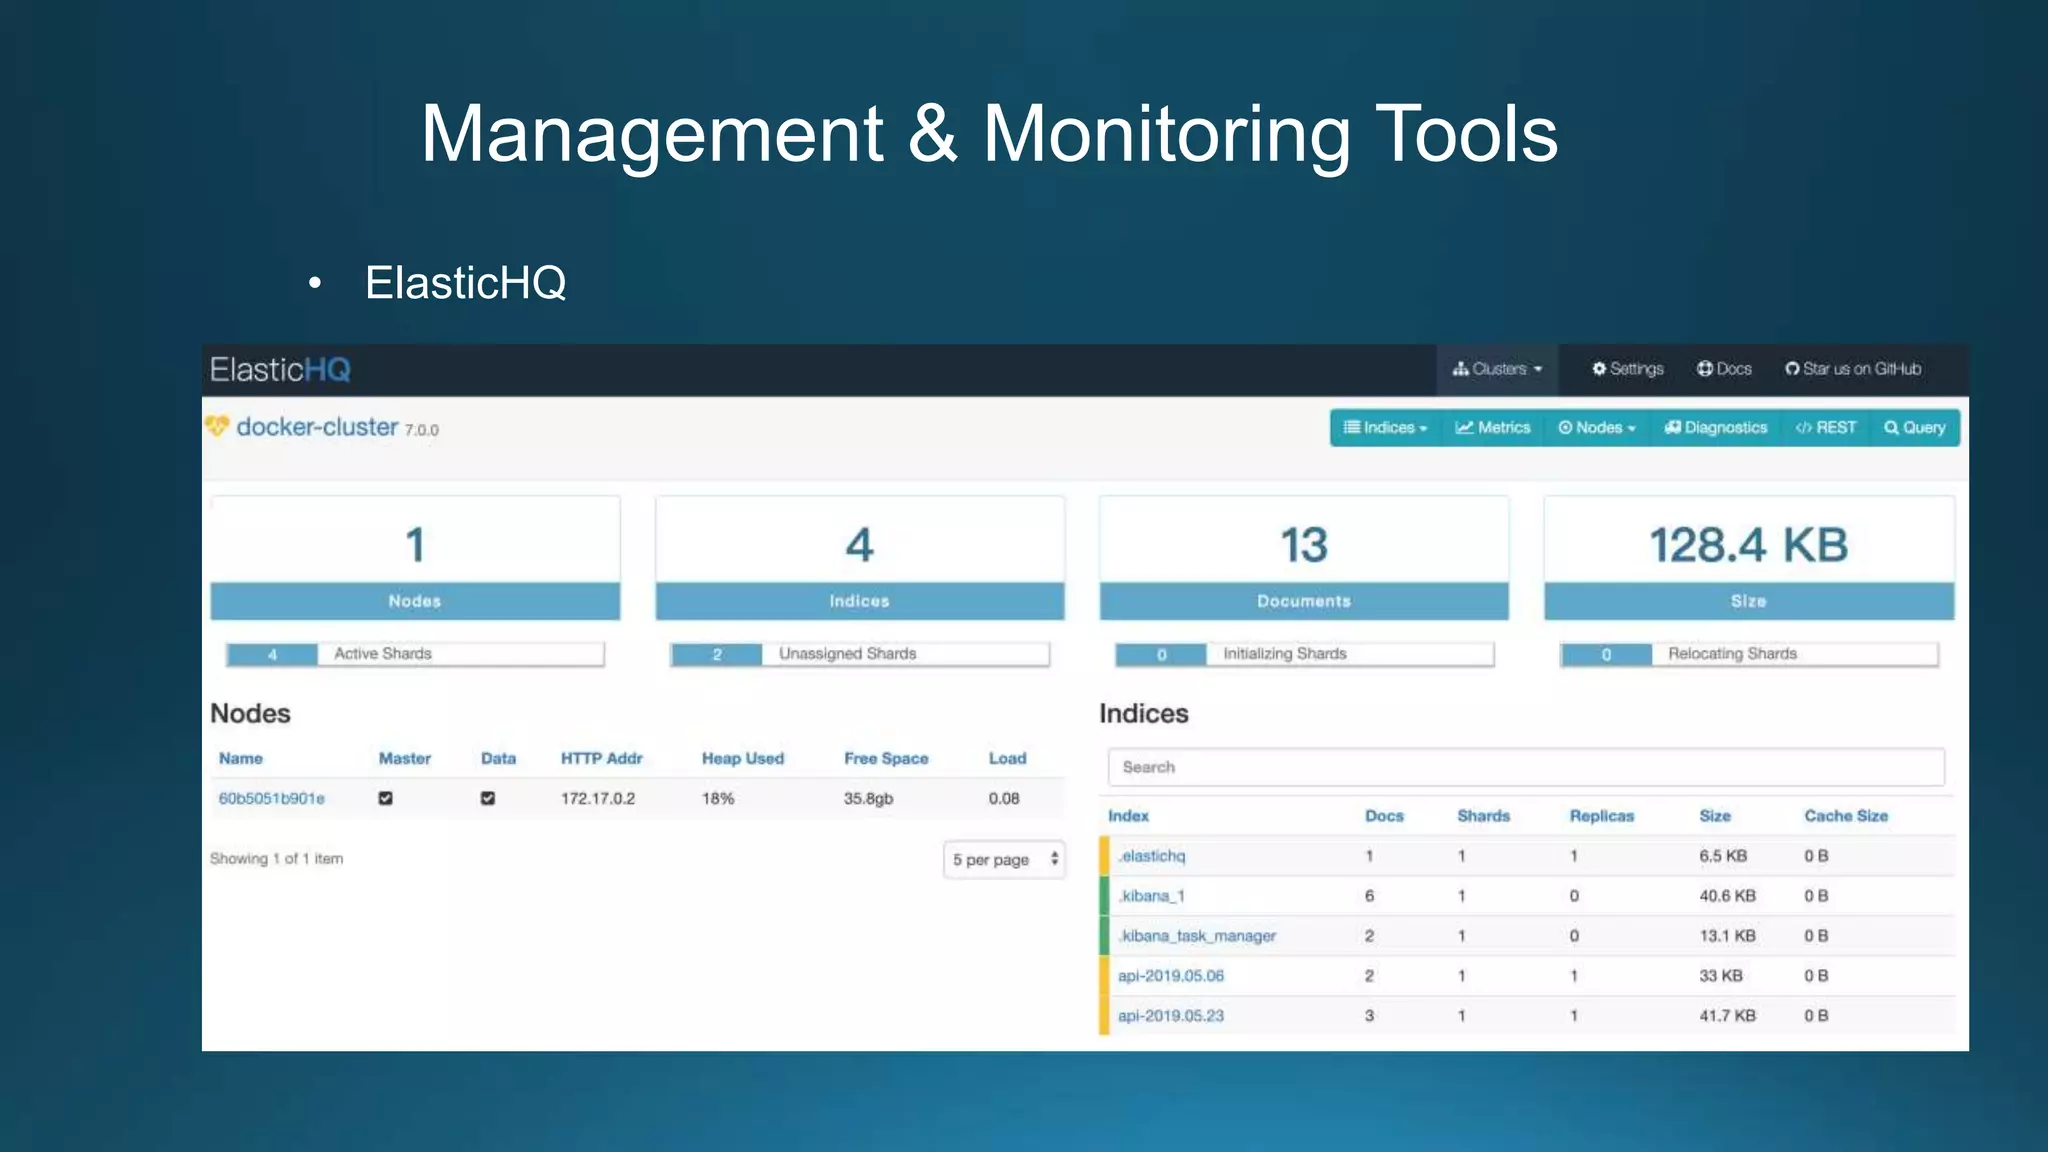
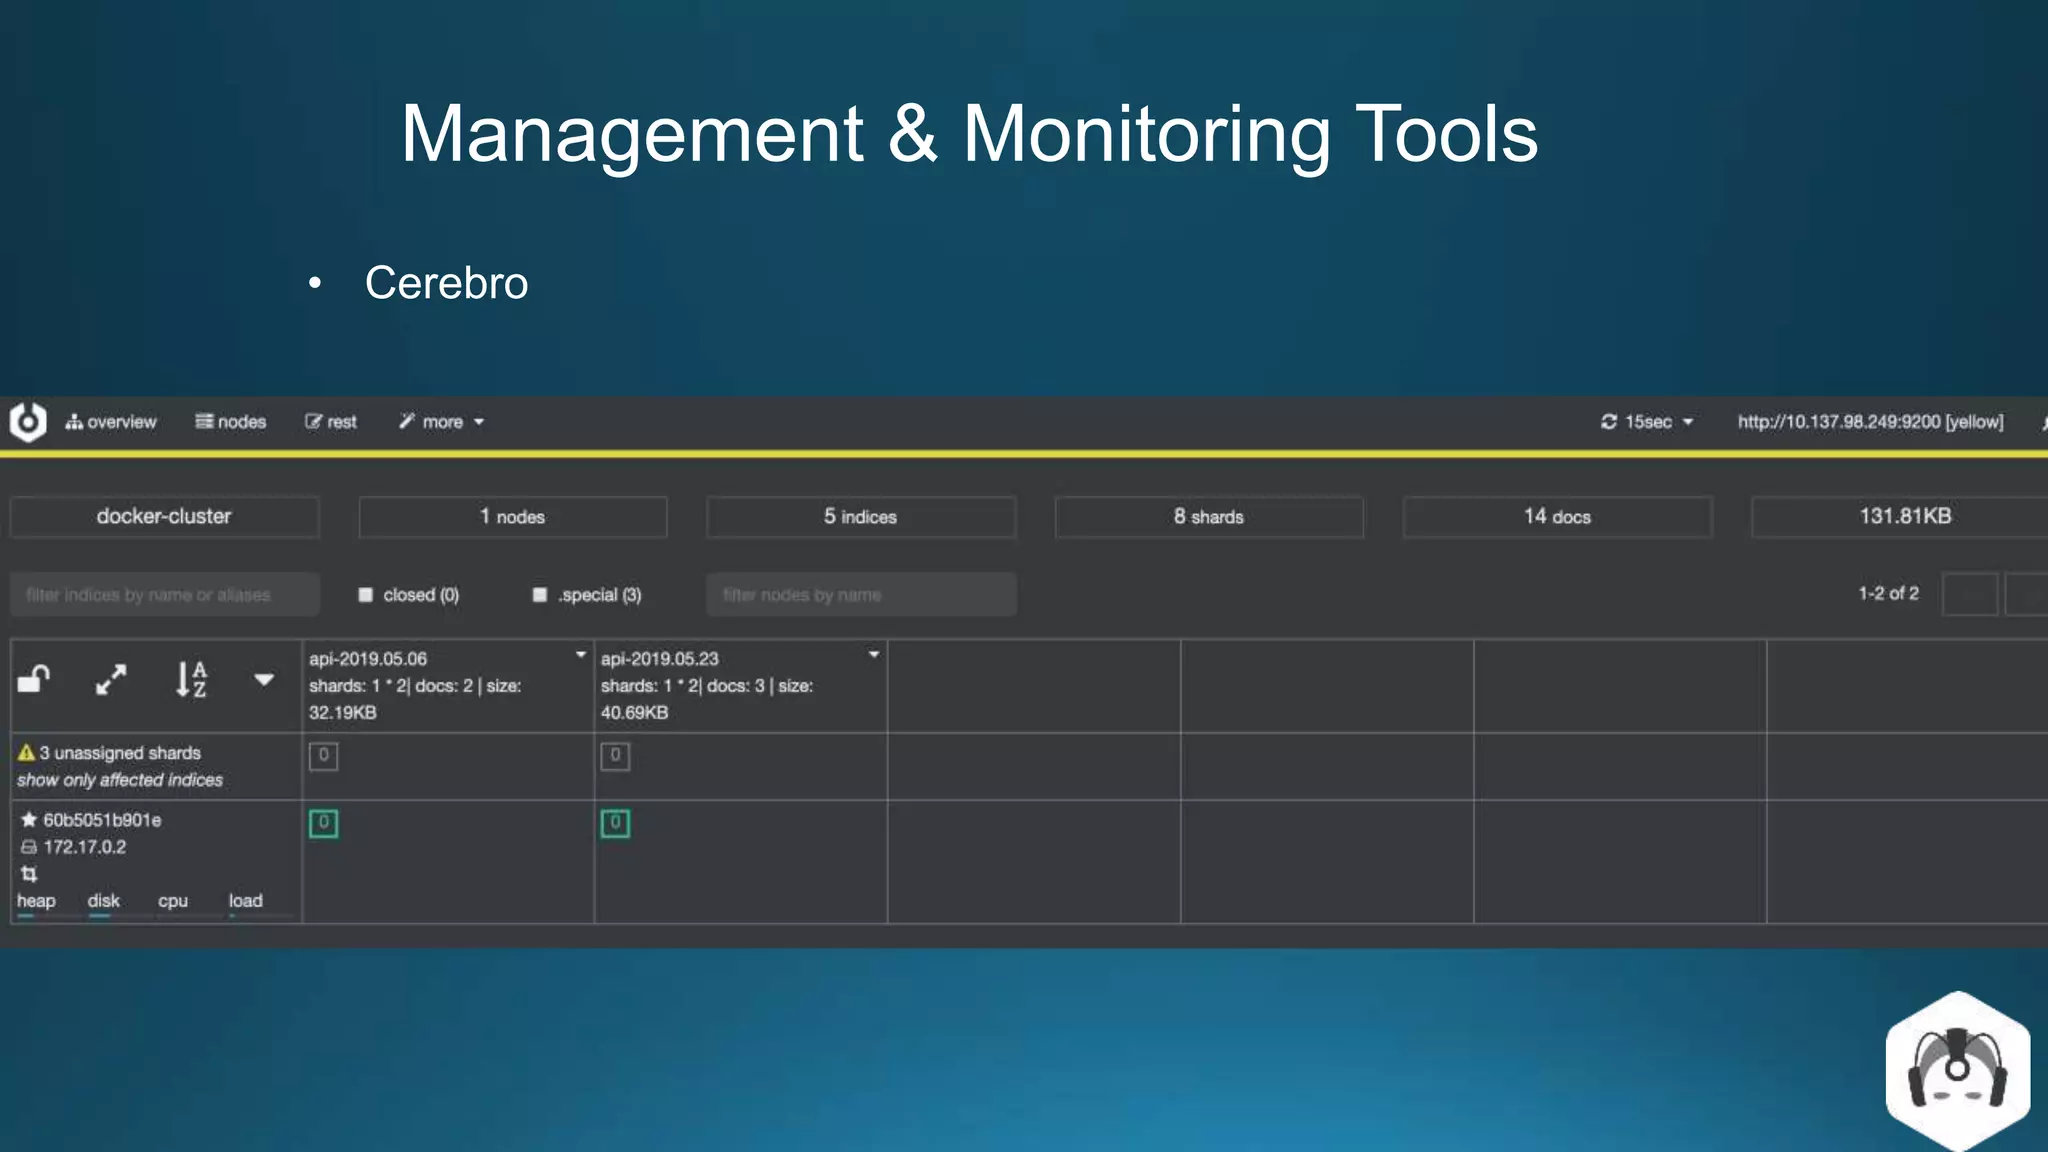
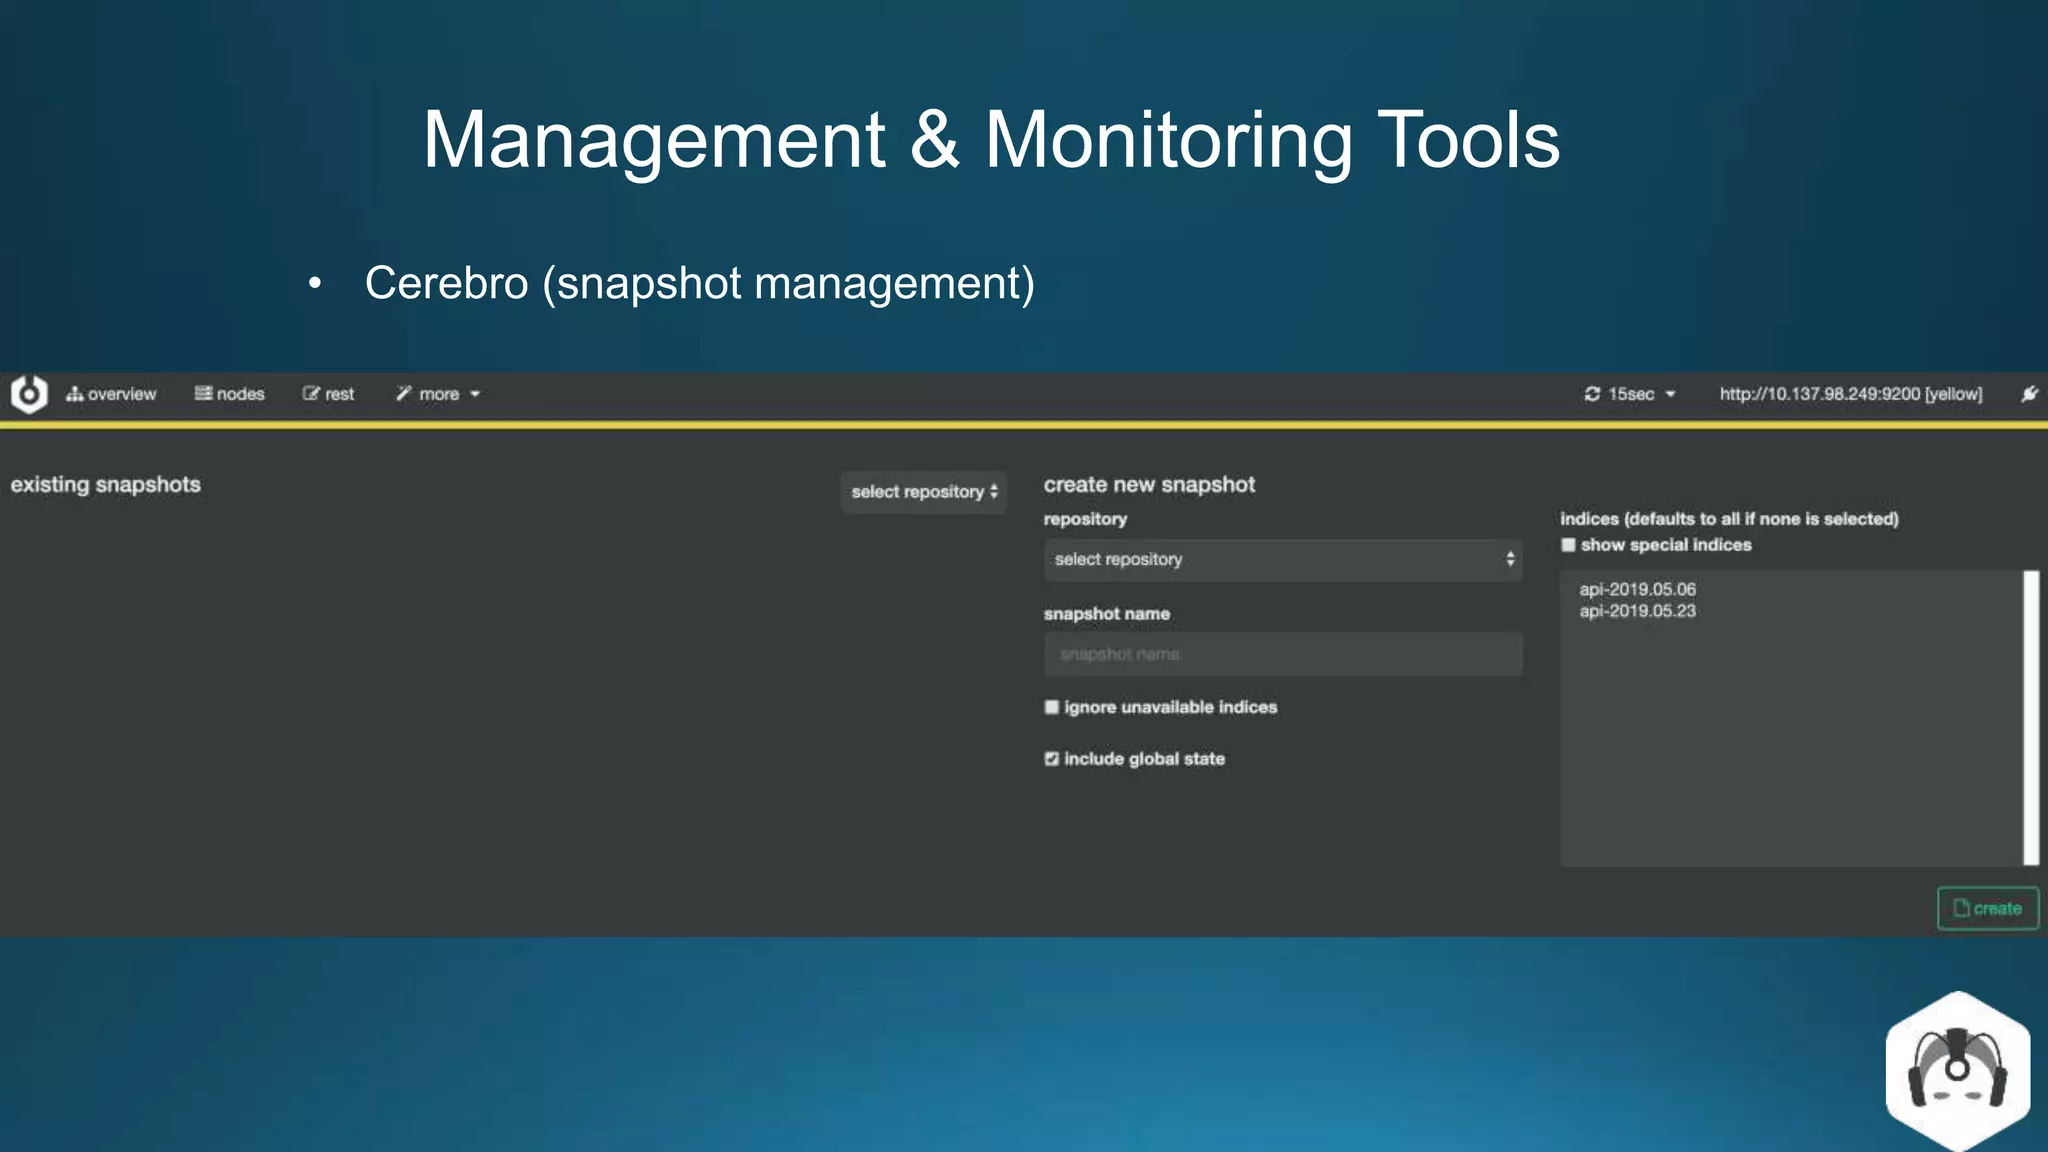
Centralized log management is implemented using the Elastic Stack including Filebeat, Logstash, Elasticsearch, and Kibana. Filebeat ships logs to Logstash which transforms and indexes the data into Elasticsearch. Logs can then be queried and visualized in Kibana. For large volumes of logs, Kafka may be used as a buffer between the shipper and indexer. Backups are performed using Elasticsearch snapshots to a shared file system or cloud storage. Logs are indexed into time-based indices and a cron job deletes old indices to control storage usage.

![Backing Up Data
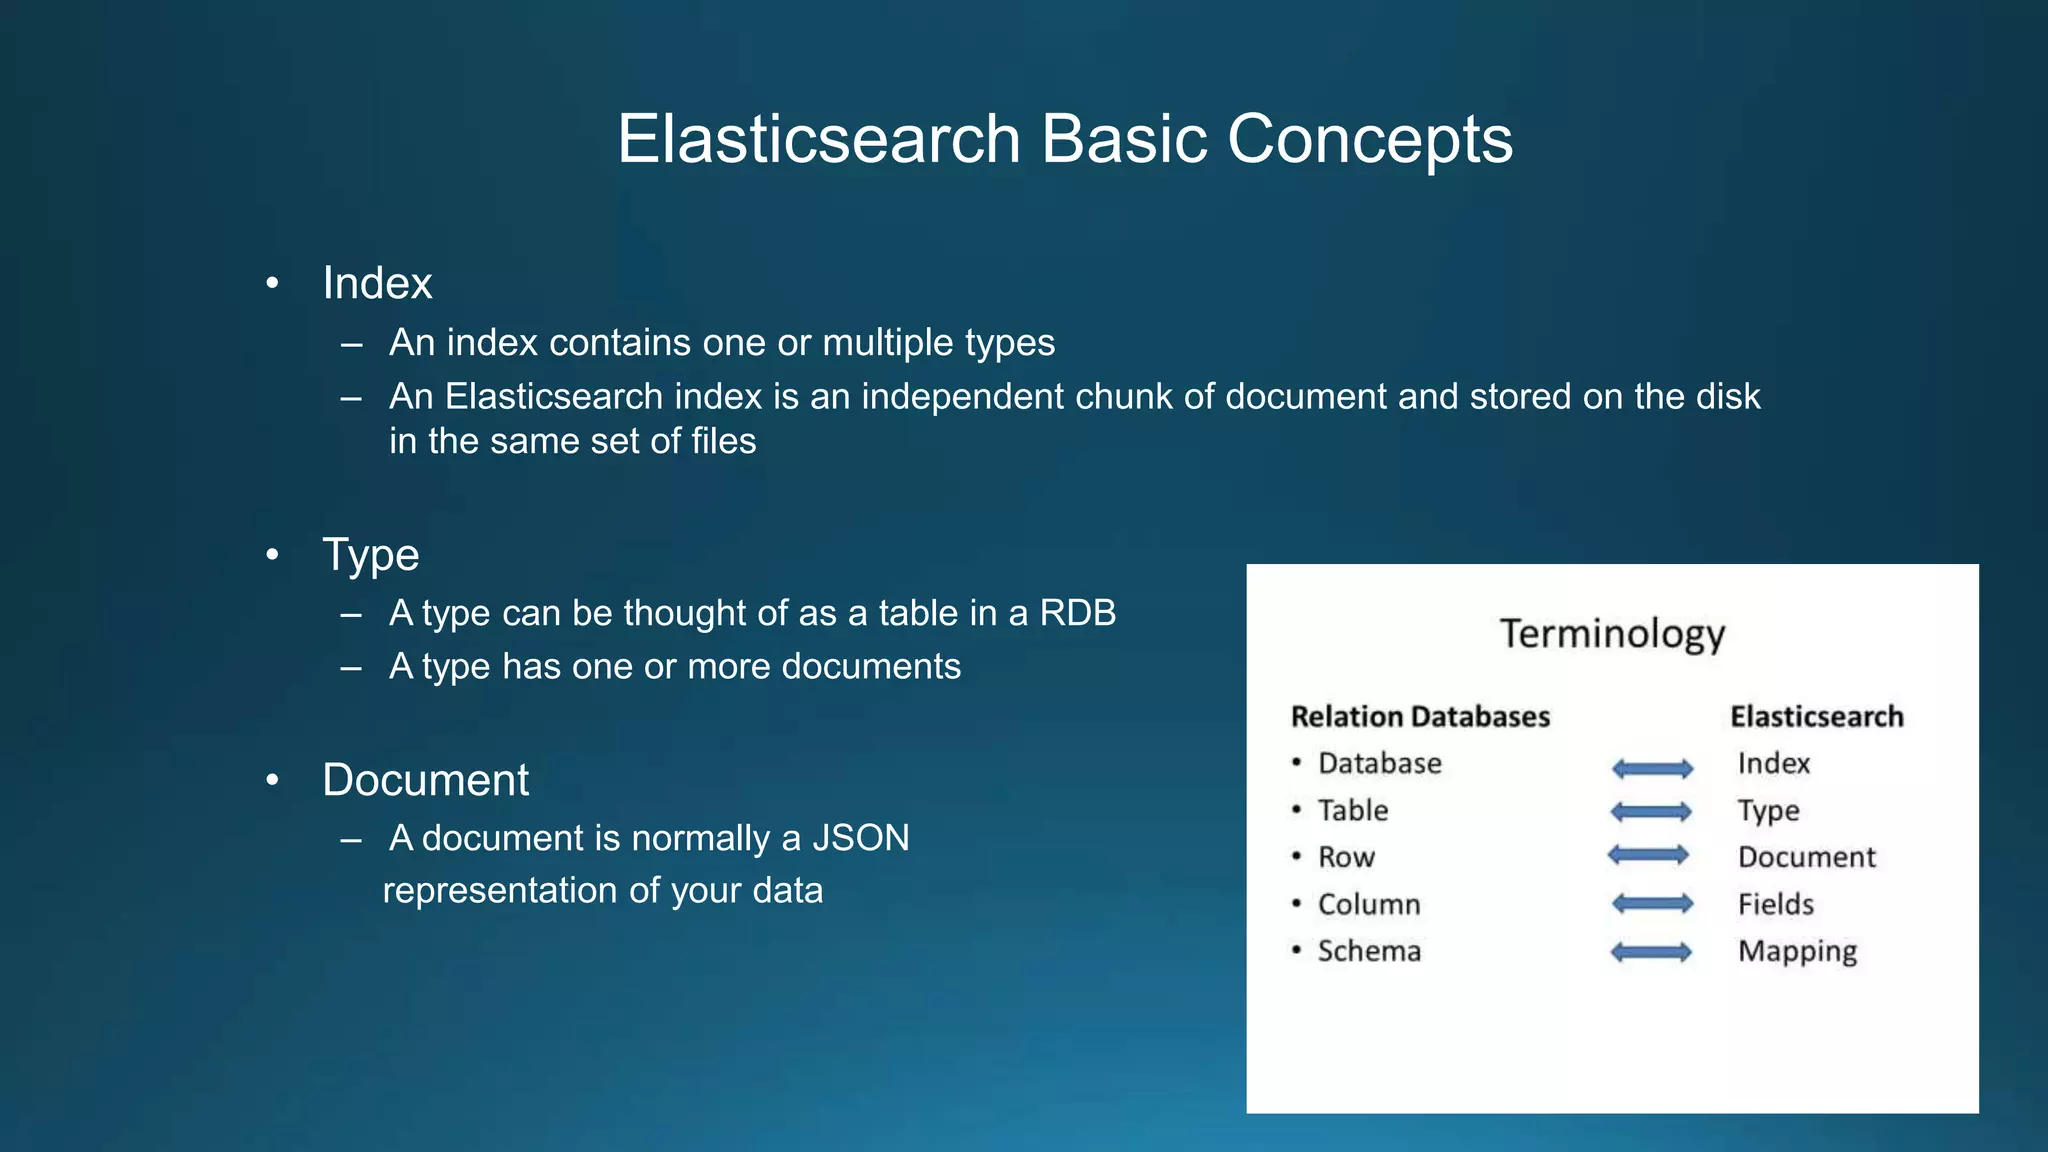
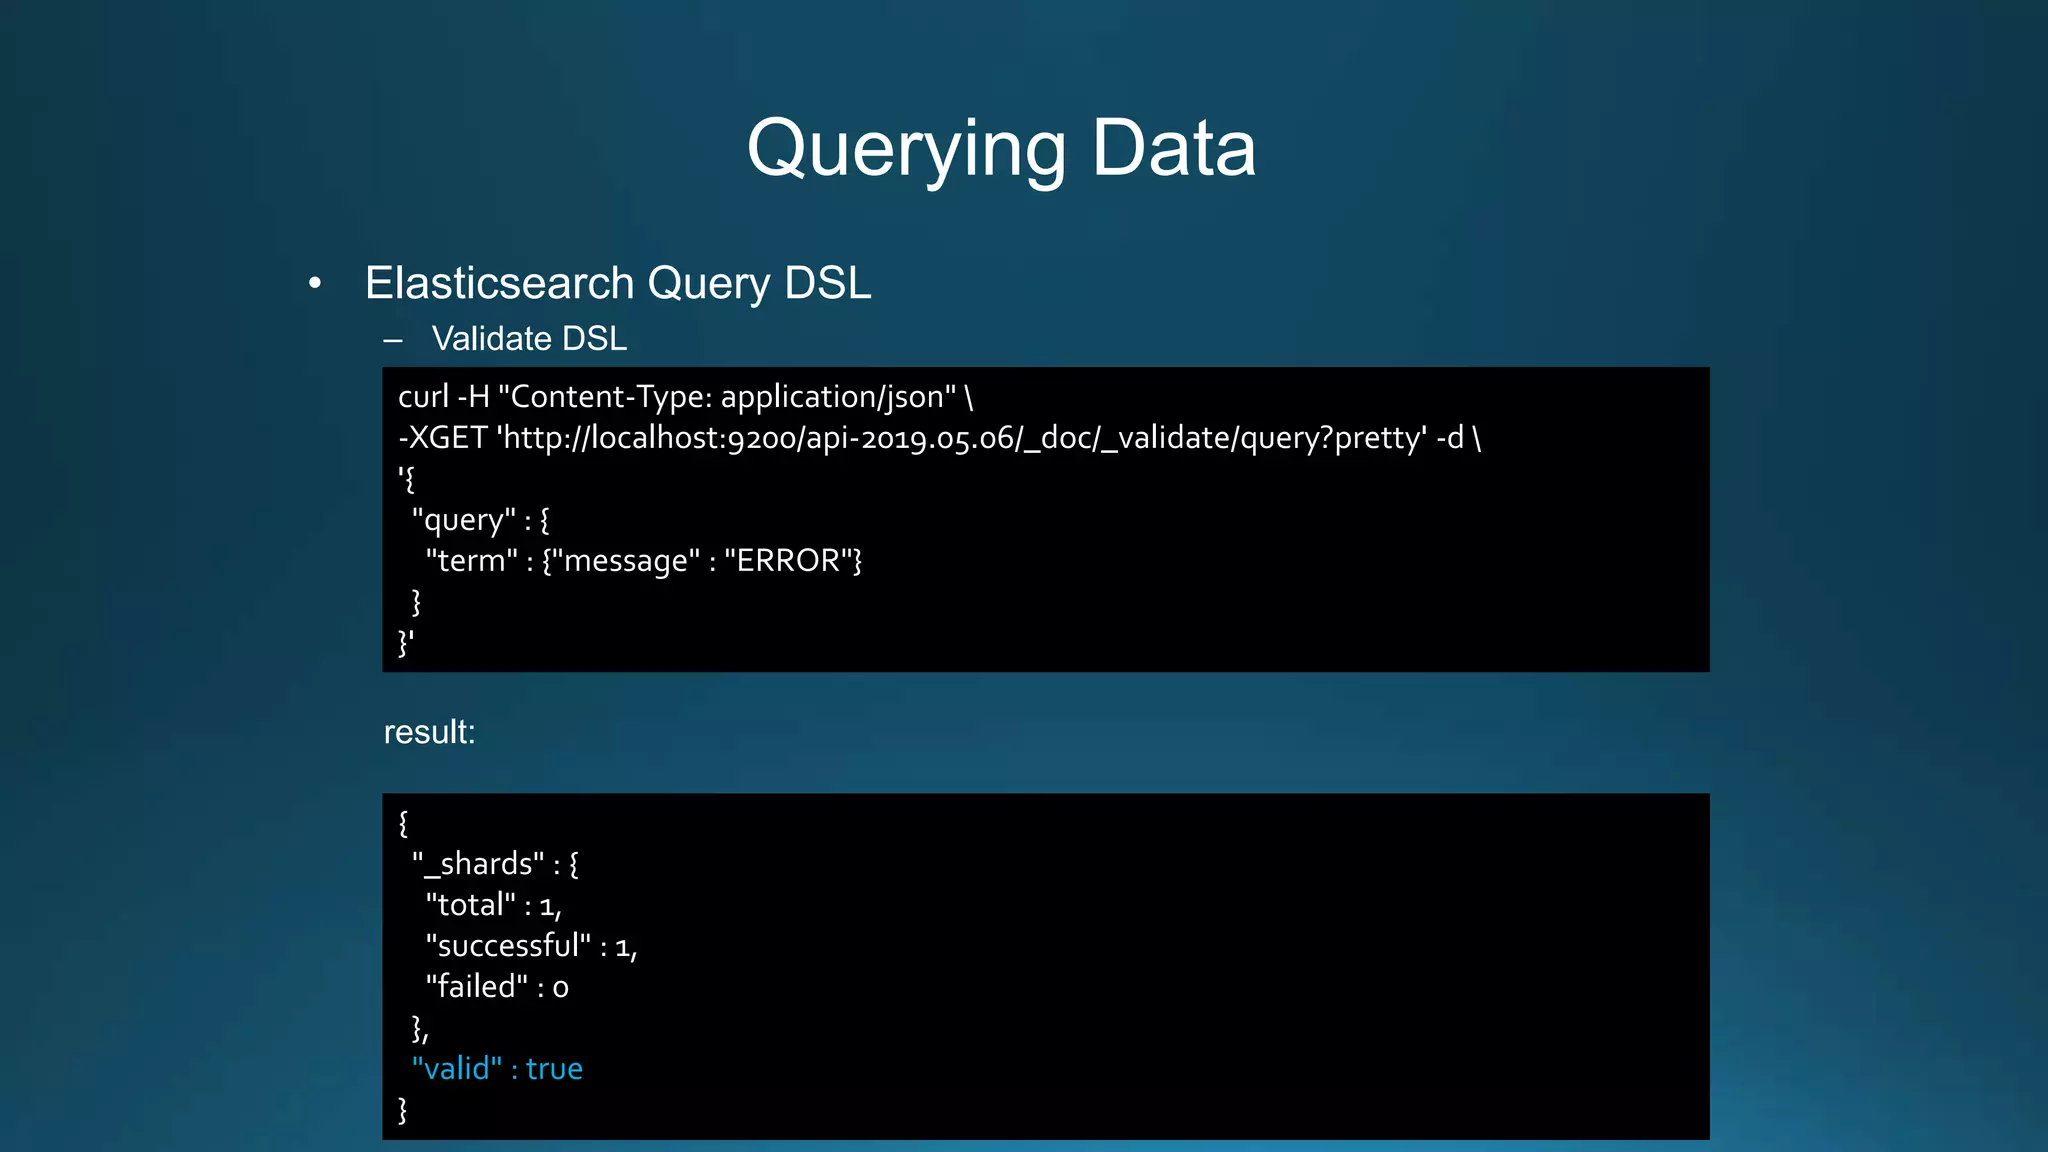
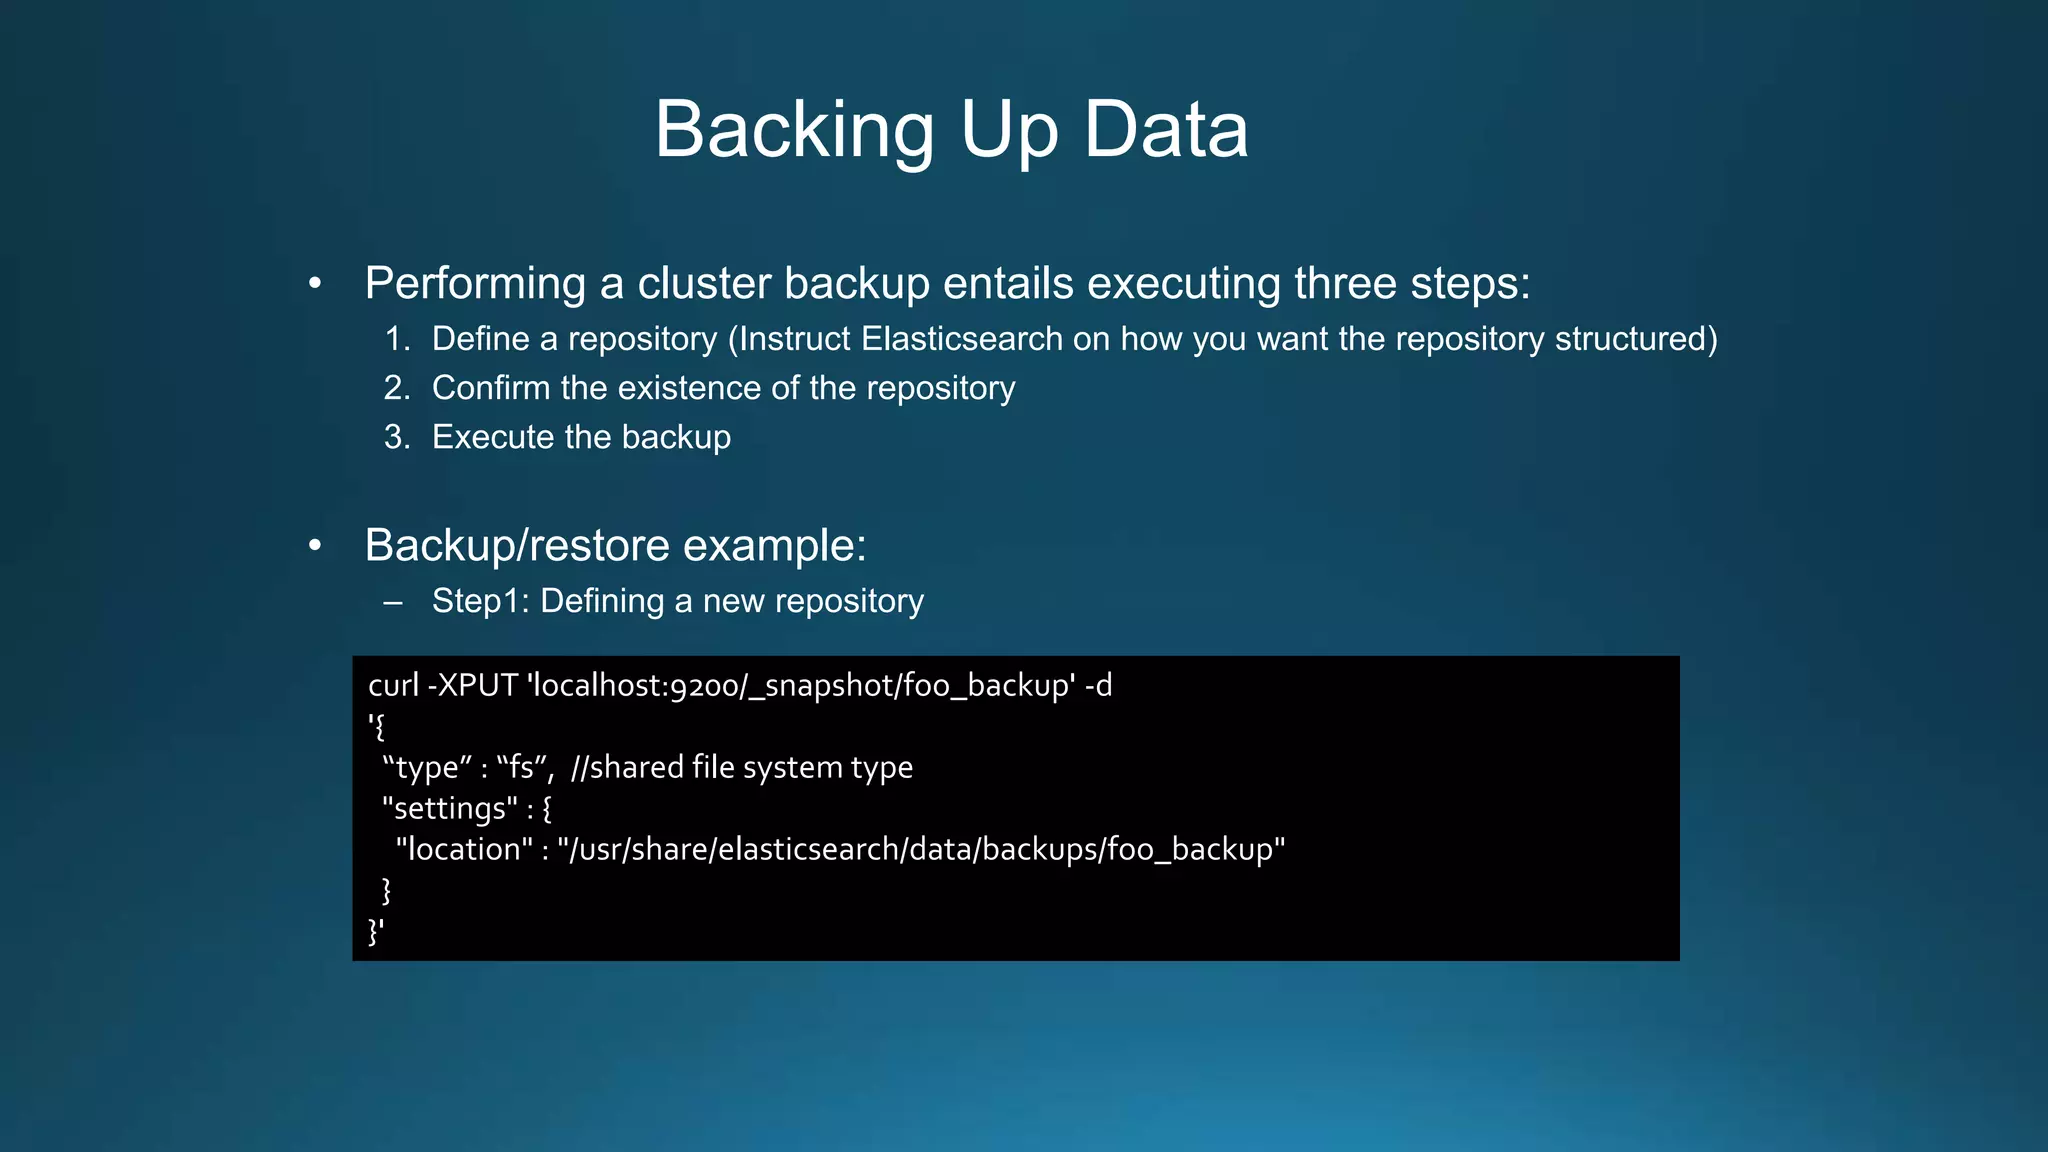
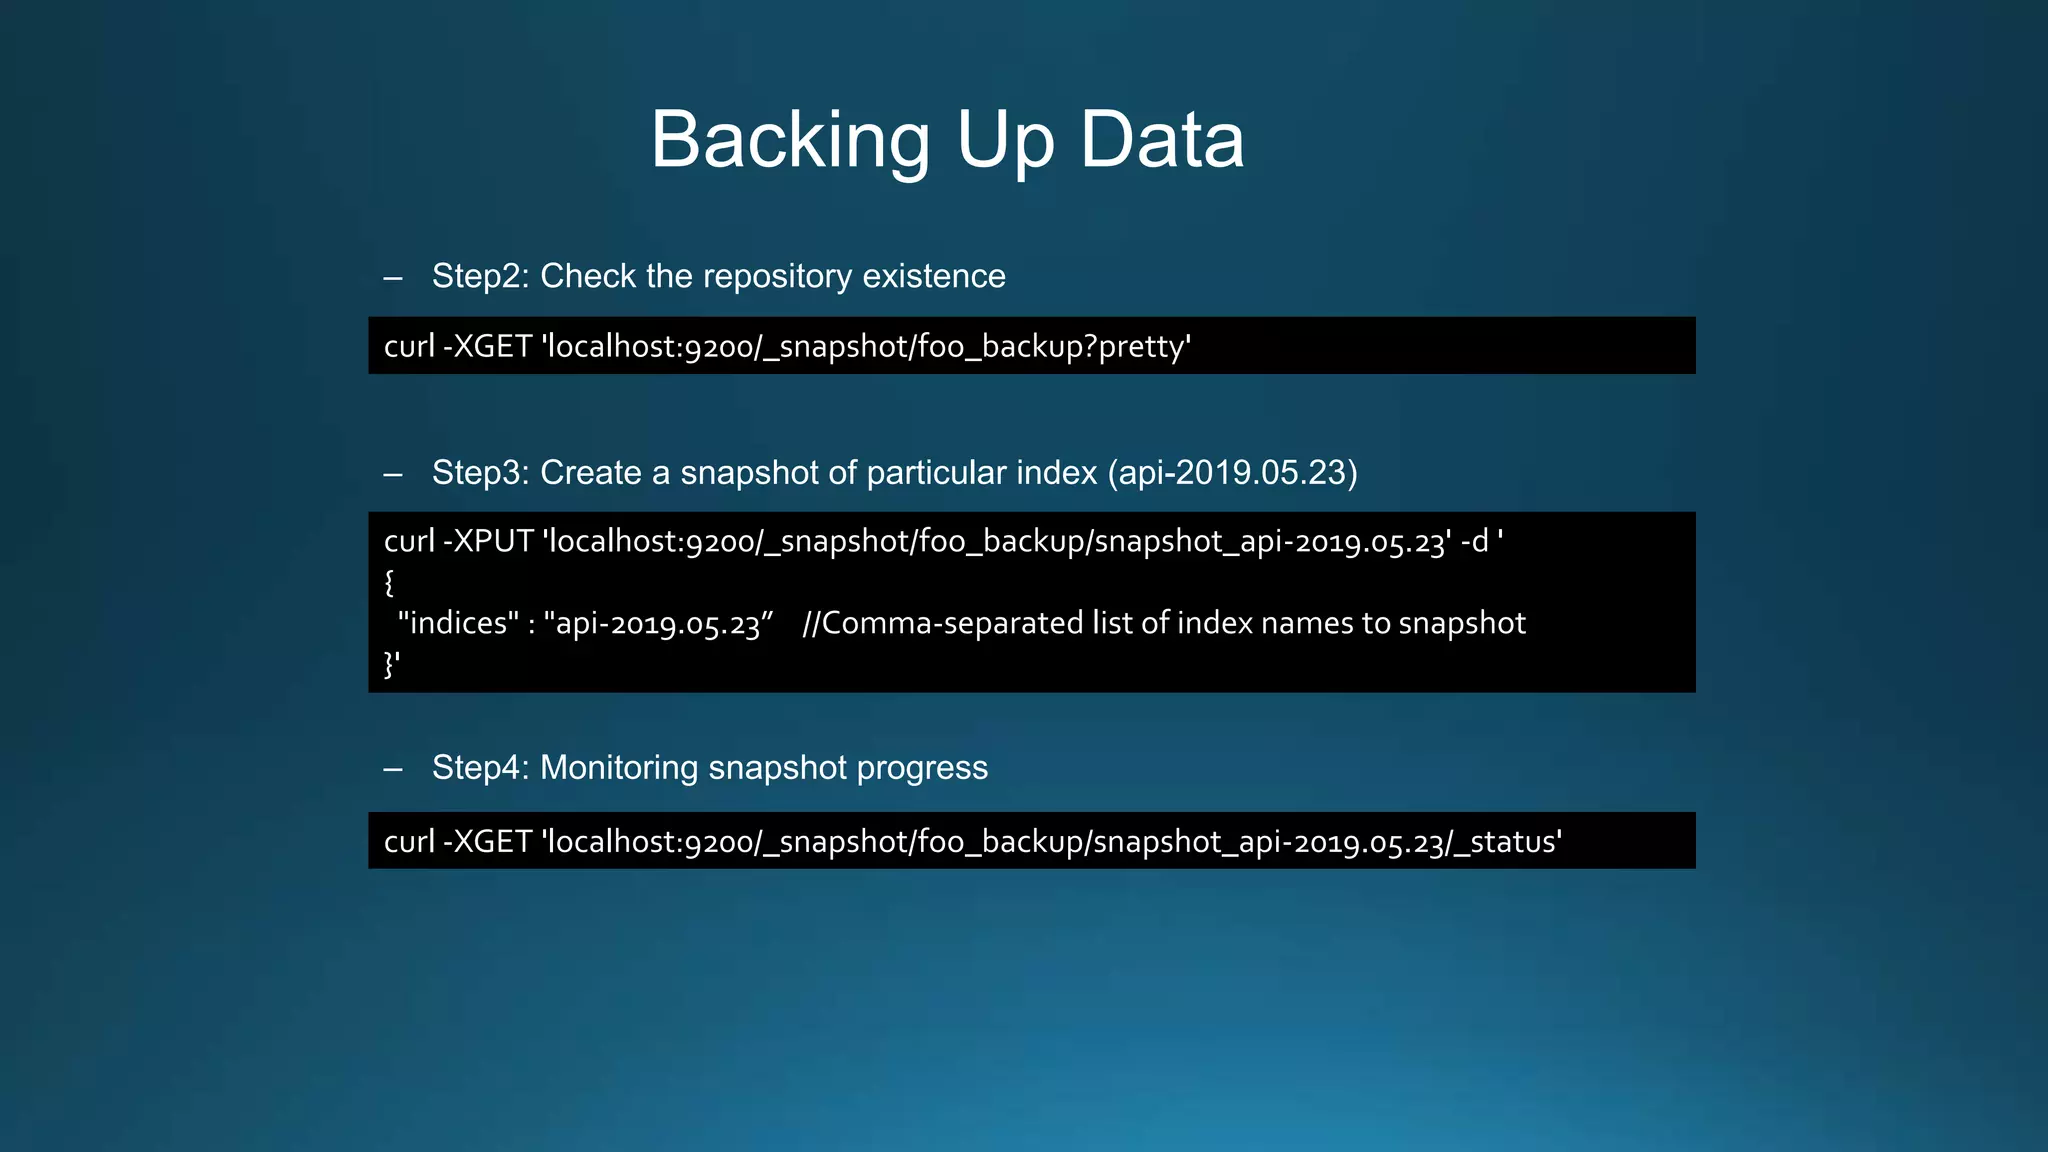
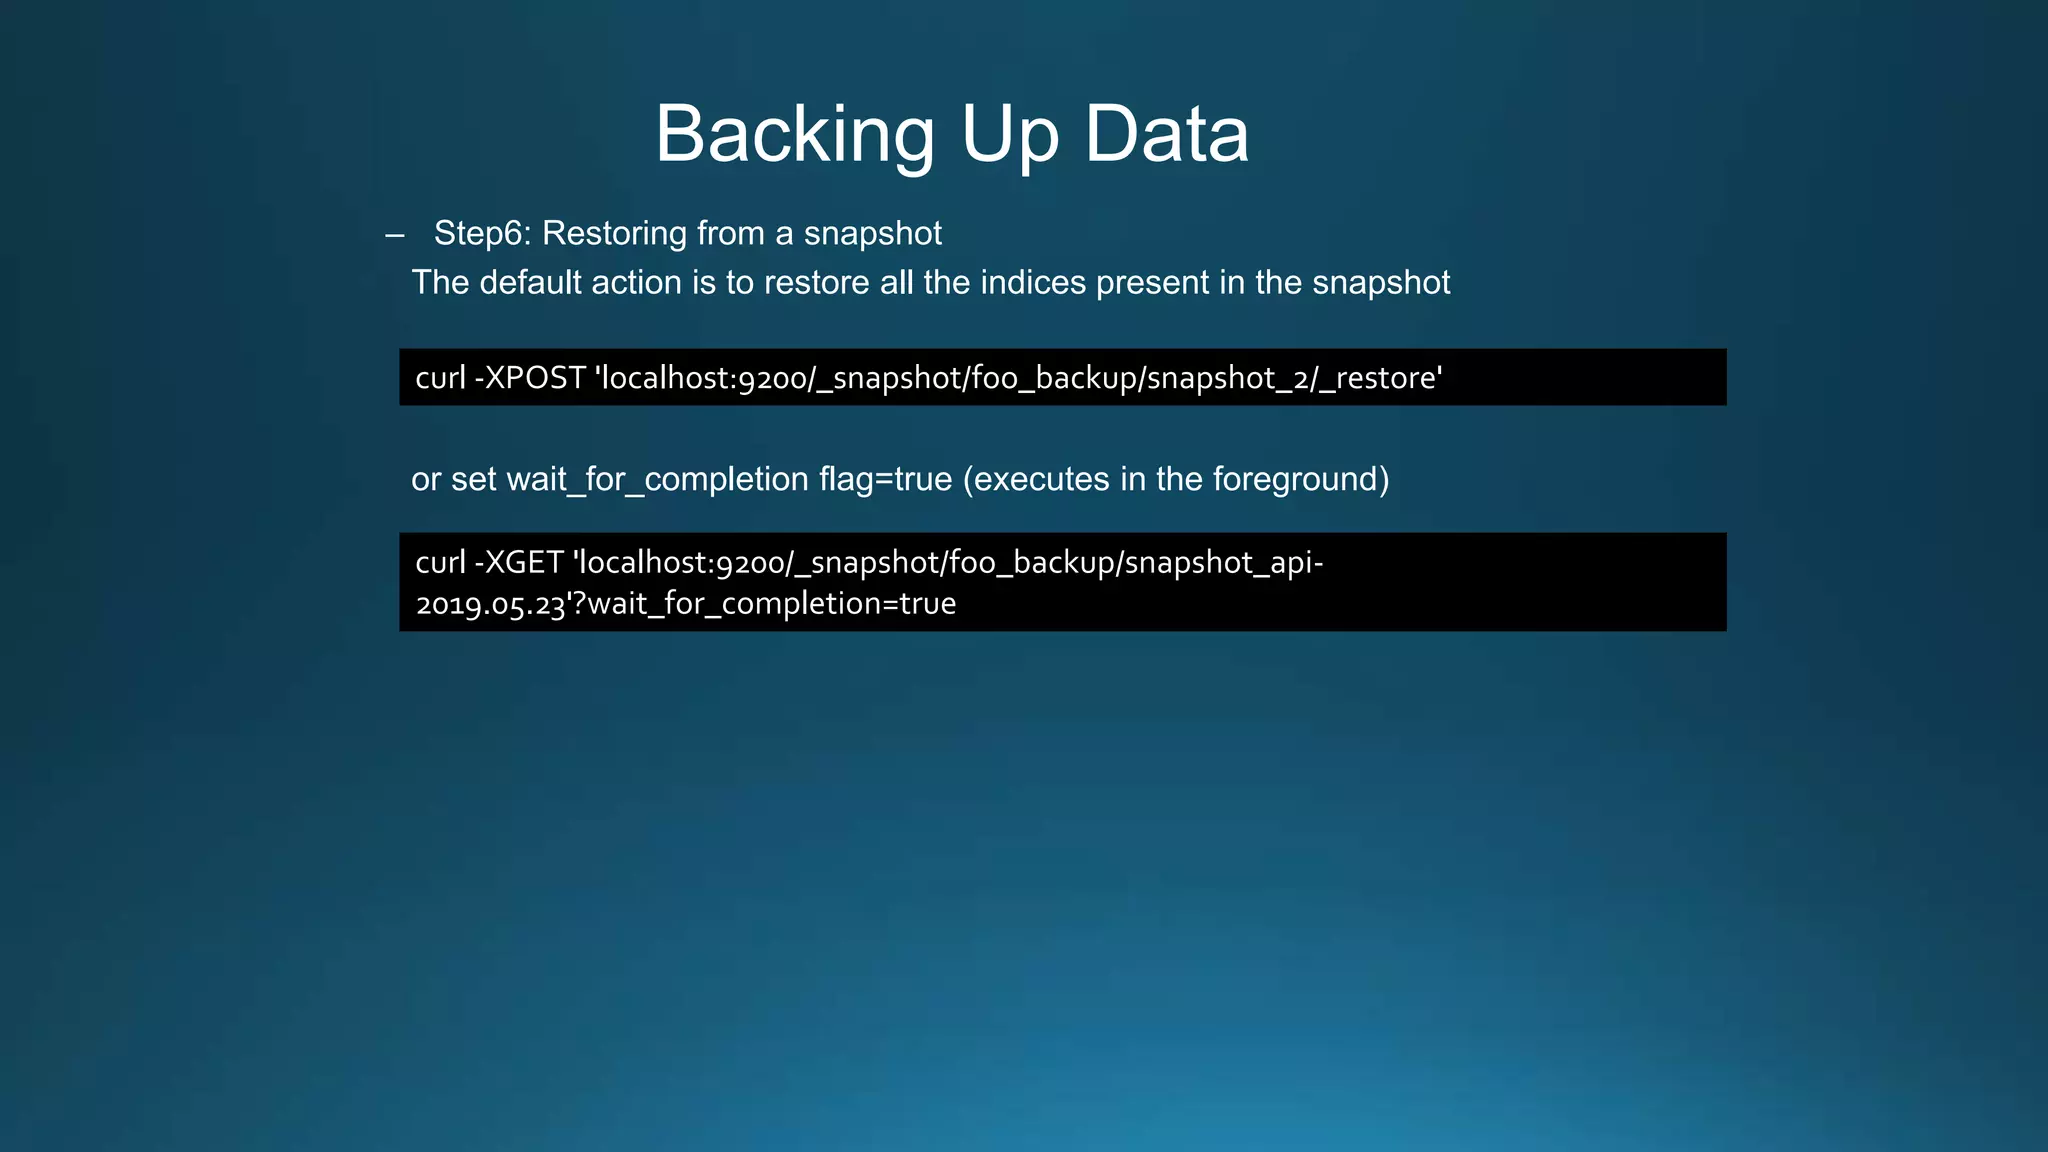
– Step5: Retrieving information on the state of a given snapshot
response:
curl -XGET 'localhost:9200/_snapshot/foo_backup/snapshot_api-2019.05.23'
{
"snapshots": [
{
"snapshot": "napshot_api-2019.05.23",
"uuid": "knM5TEZrRxKhIqvpPQO74w",
"version_id": 7000099,
"version": "7.0.0",
"indices": [“api-2019.05.23"],
"include_global_state": true,
"state": "SUCCESS",
"start_time": "2019-05-24T06:30:11.737Z",
"start_time_in_millis": 1558679411737,
"end_time": "2019-05-24T06:30:11.791Z",
"end_time_in_millis": 1558679411791,
"duration_in_millis": 54,
"failures": [],
"shards": {
"total": 1,
"failed": 0,
"successful": 1
}
}
]
}](https://image.slidesharecdn.com/centralized-log-management-with-elastic-stack-190628014419/75/Centralized-log-management-with-elastic-stack-28-2048.jpg)
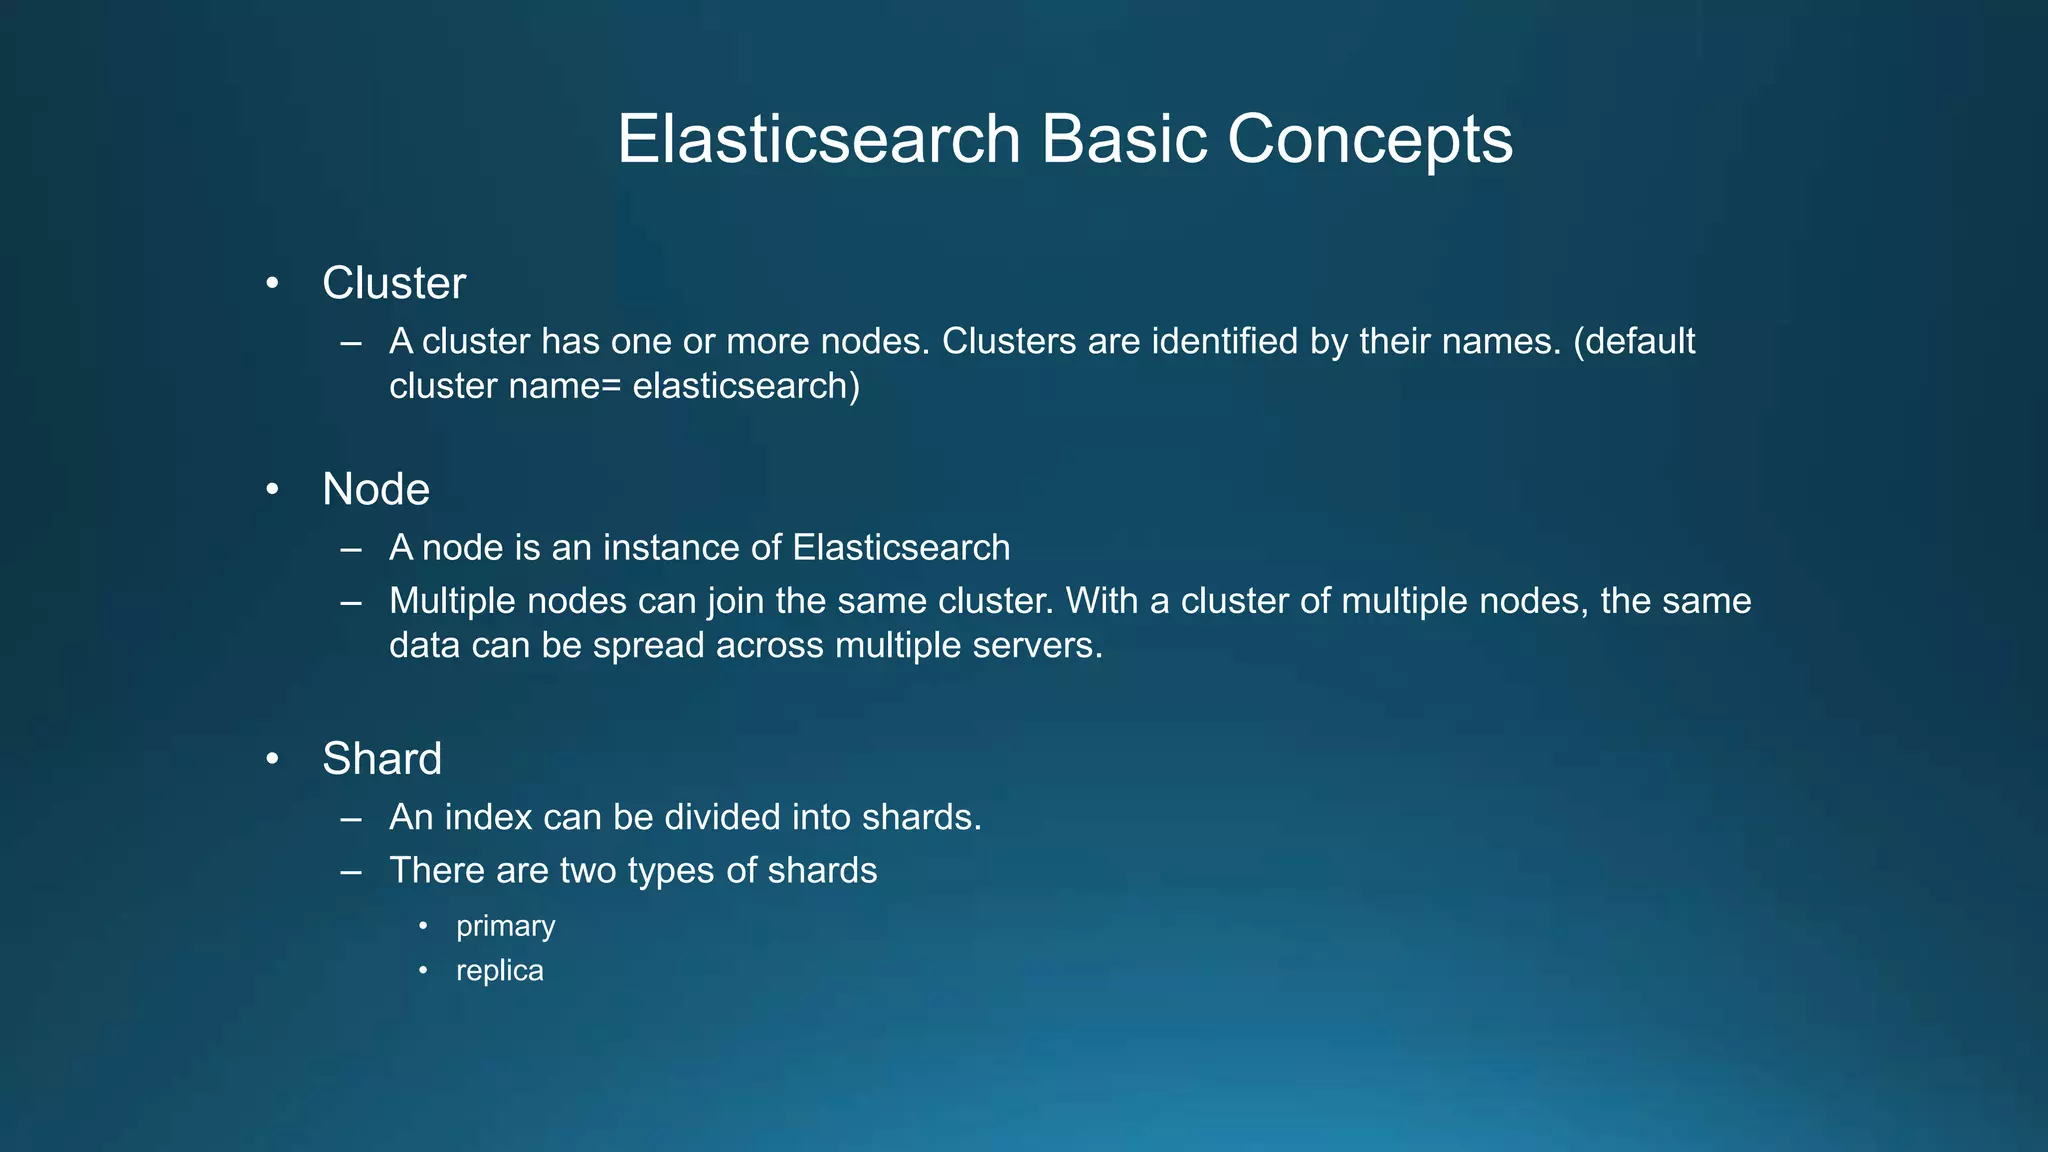
![Housekeeping Strategy
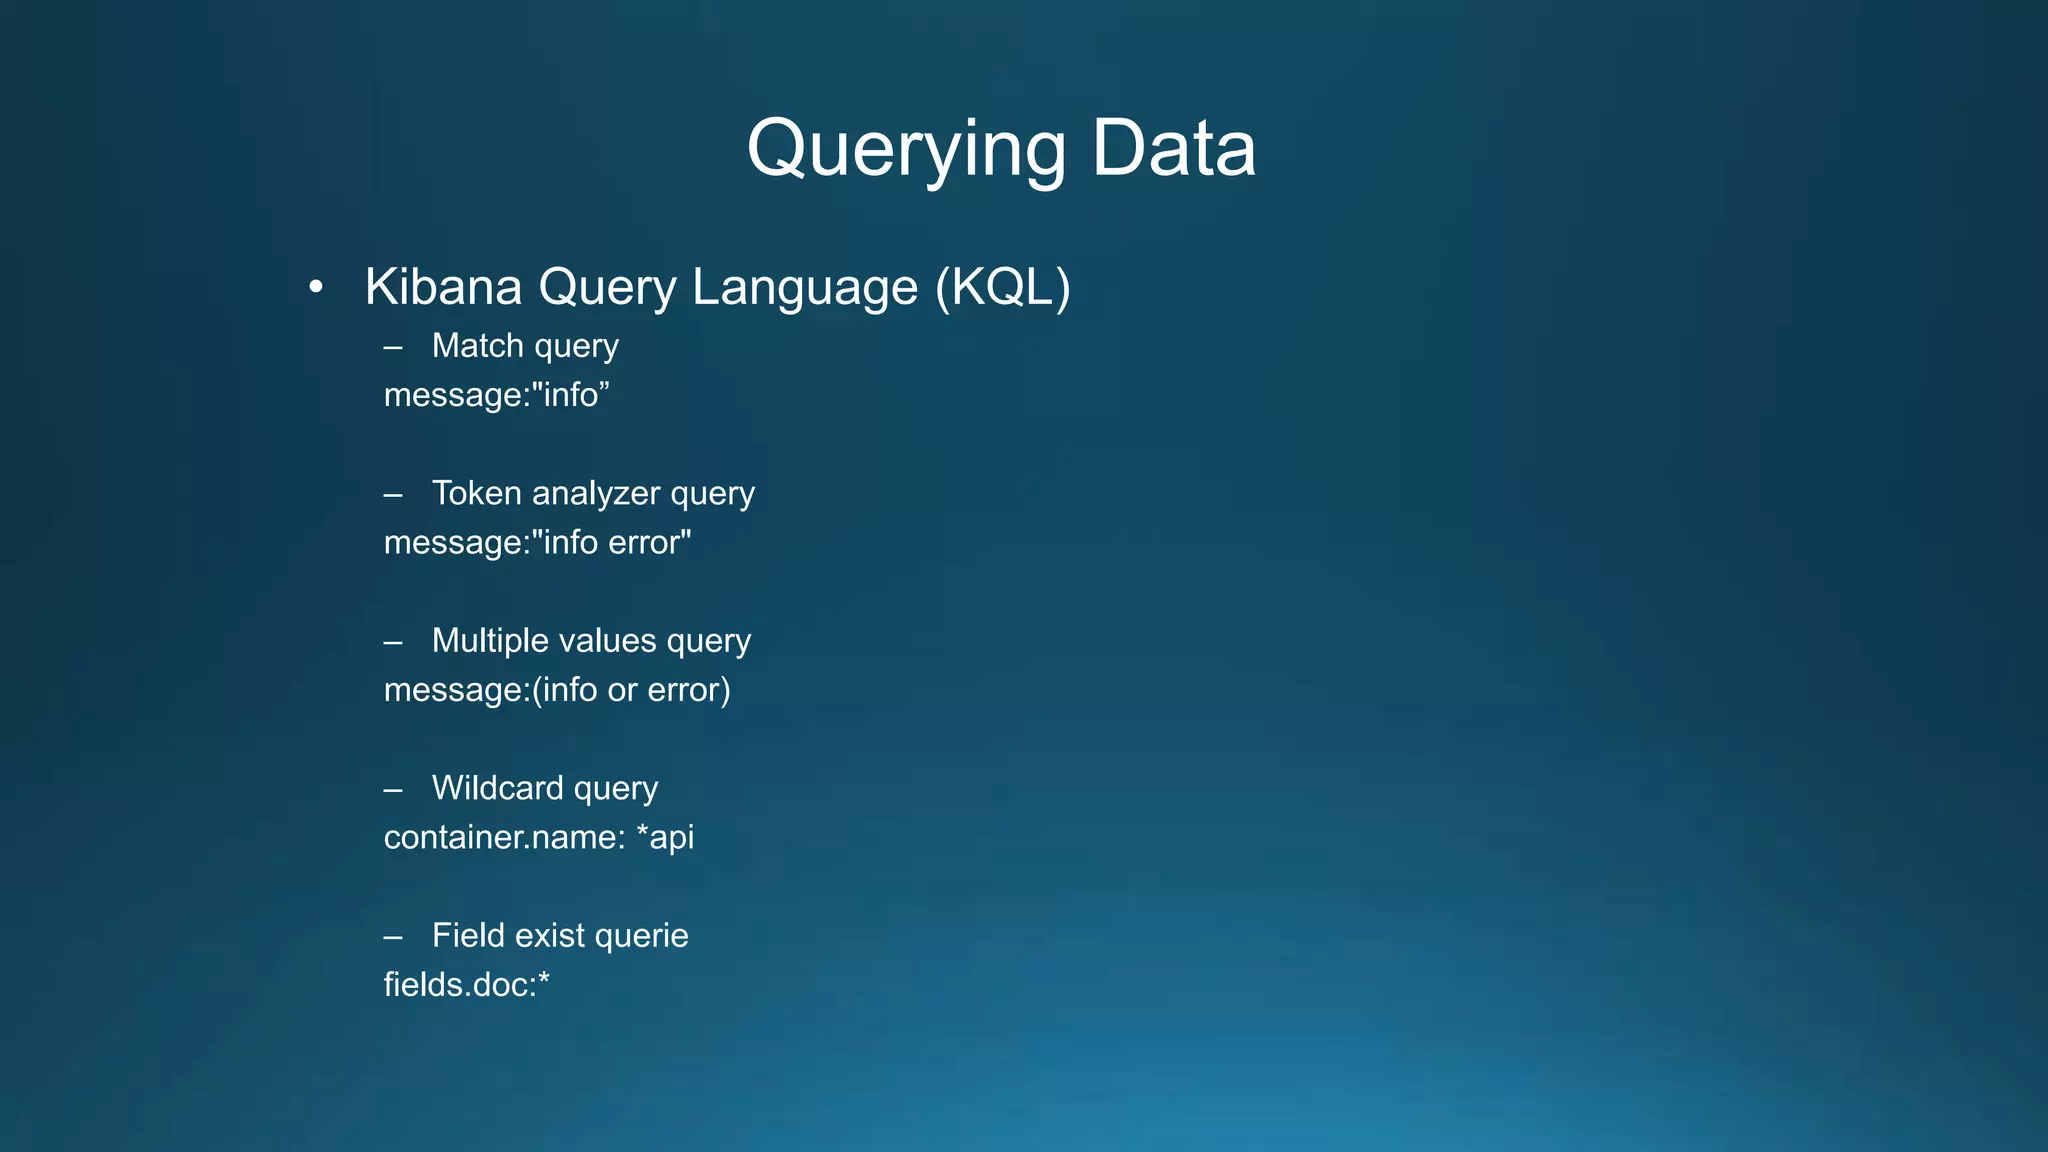
• Time-based indices
– Index name pattern: <index_name>.yyyy.MM.dd
– faster and reduces to remove documents and reduces memory CPU and overhead (delete by
index directly)
– large amounts of bulk deletions can result in large Lucene index segments
• Cron Job: delete the index seven days before every AM 2:oo
For example: if housekeeping is 7 days and today is 2019/06/08, then delete 6/01 index
Indices: [
“api-2019.06.01”, (deleted)
“api-2019.06.02”,
“api-2019.06.03”,
“api-2019.06.04”,
“api-2019.06.05”,
“api-2019.06.06”,
“api-2019.06.07”,
“api-2019.06.08”
]
keep 7 days](https://image.slidesharecdn.com/centralized-log-management-with-elastic-stack-190628014419/75/Centralized-log-management-with-elastic-stack-30-2048.jpg)


![Coded Agents – with UiPath SDK + LangGraph [Virtual Hands-on Workshop]](https://cdn.slidesharecdn.com/ss_thumbnails/codedagentsdeck-251215155422-5497c599-thumbnail.jpg?width=640&height=640&fit=bounds)

