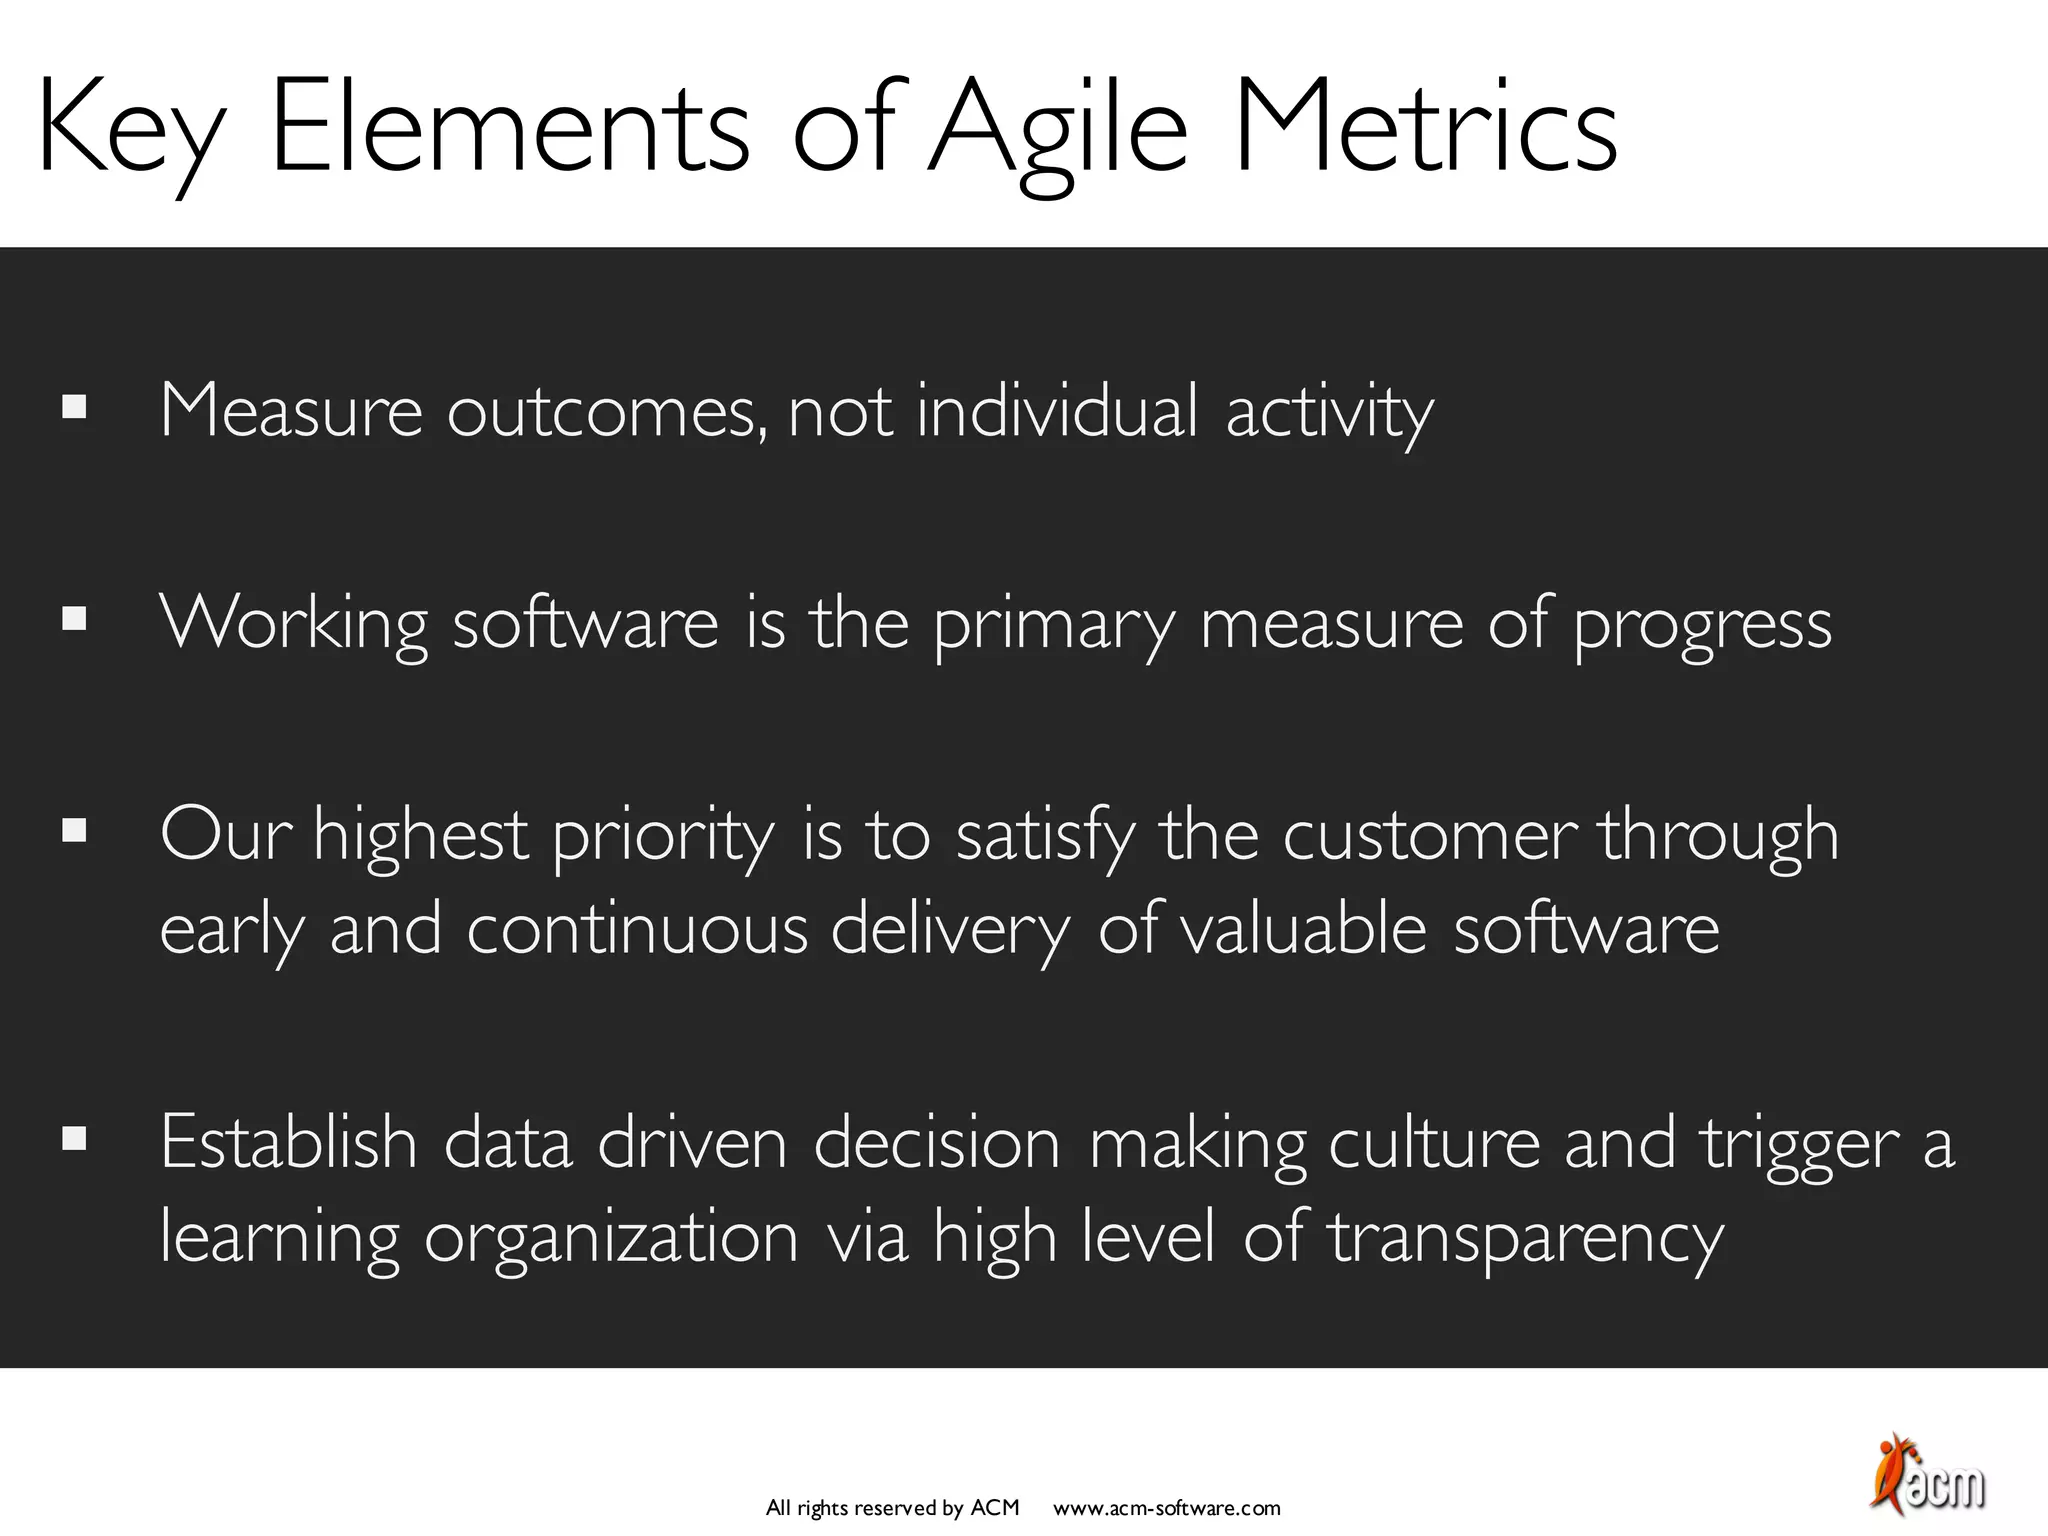
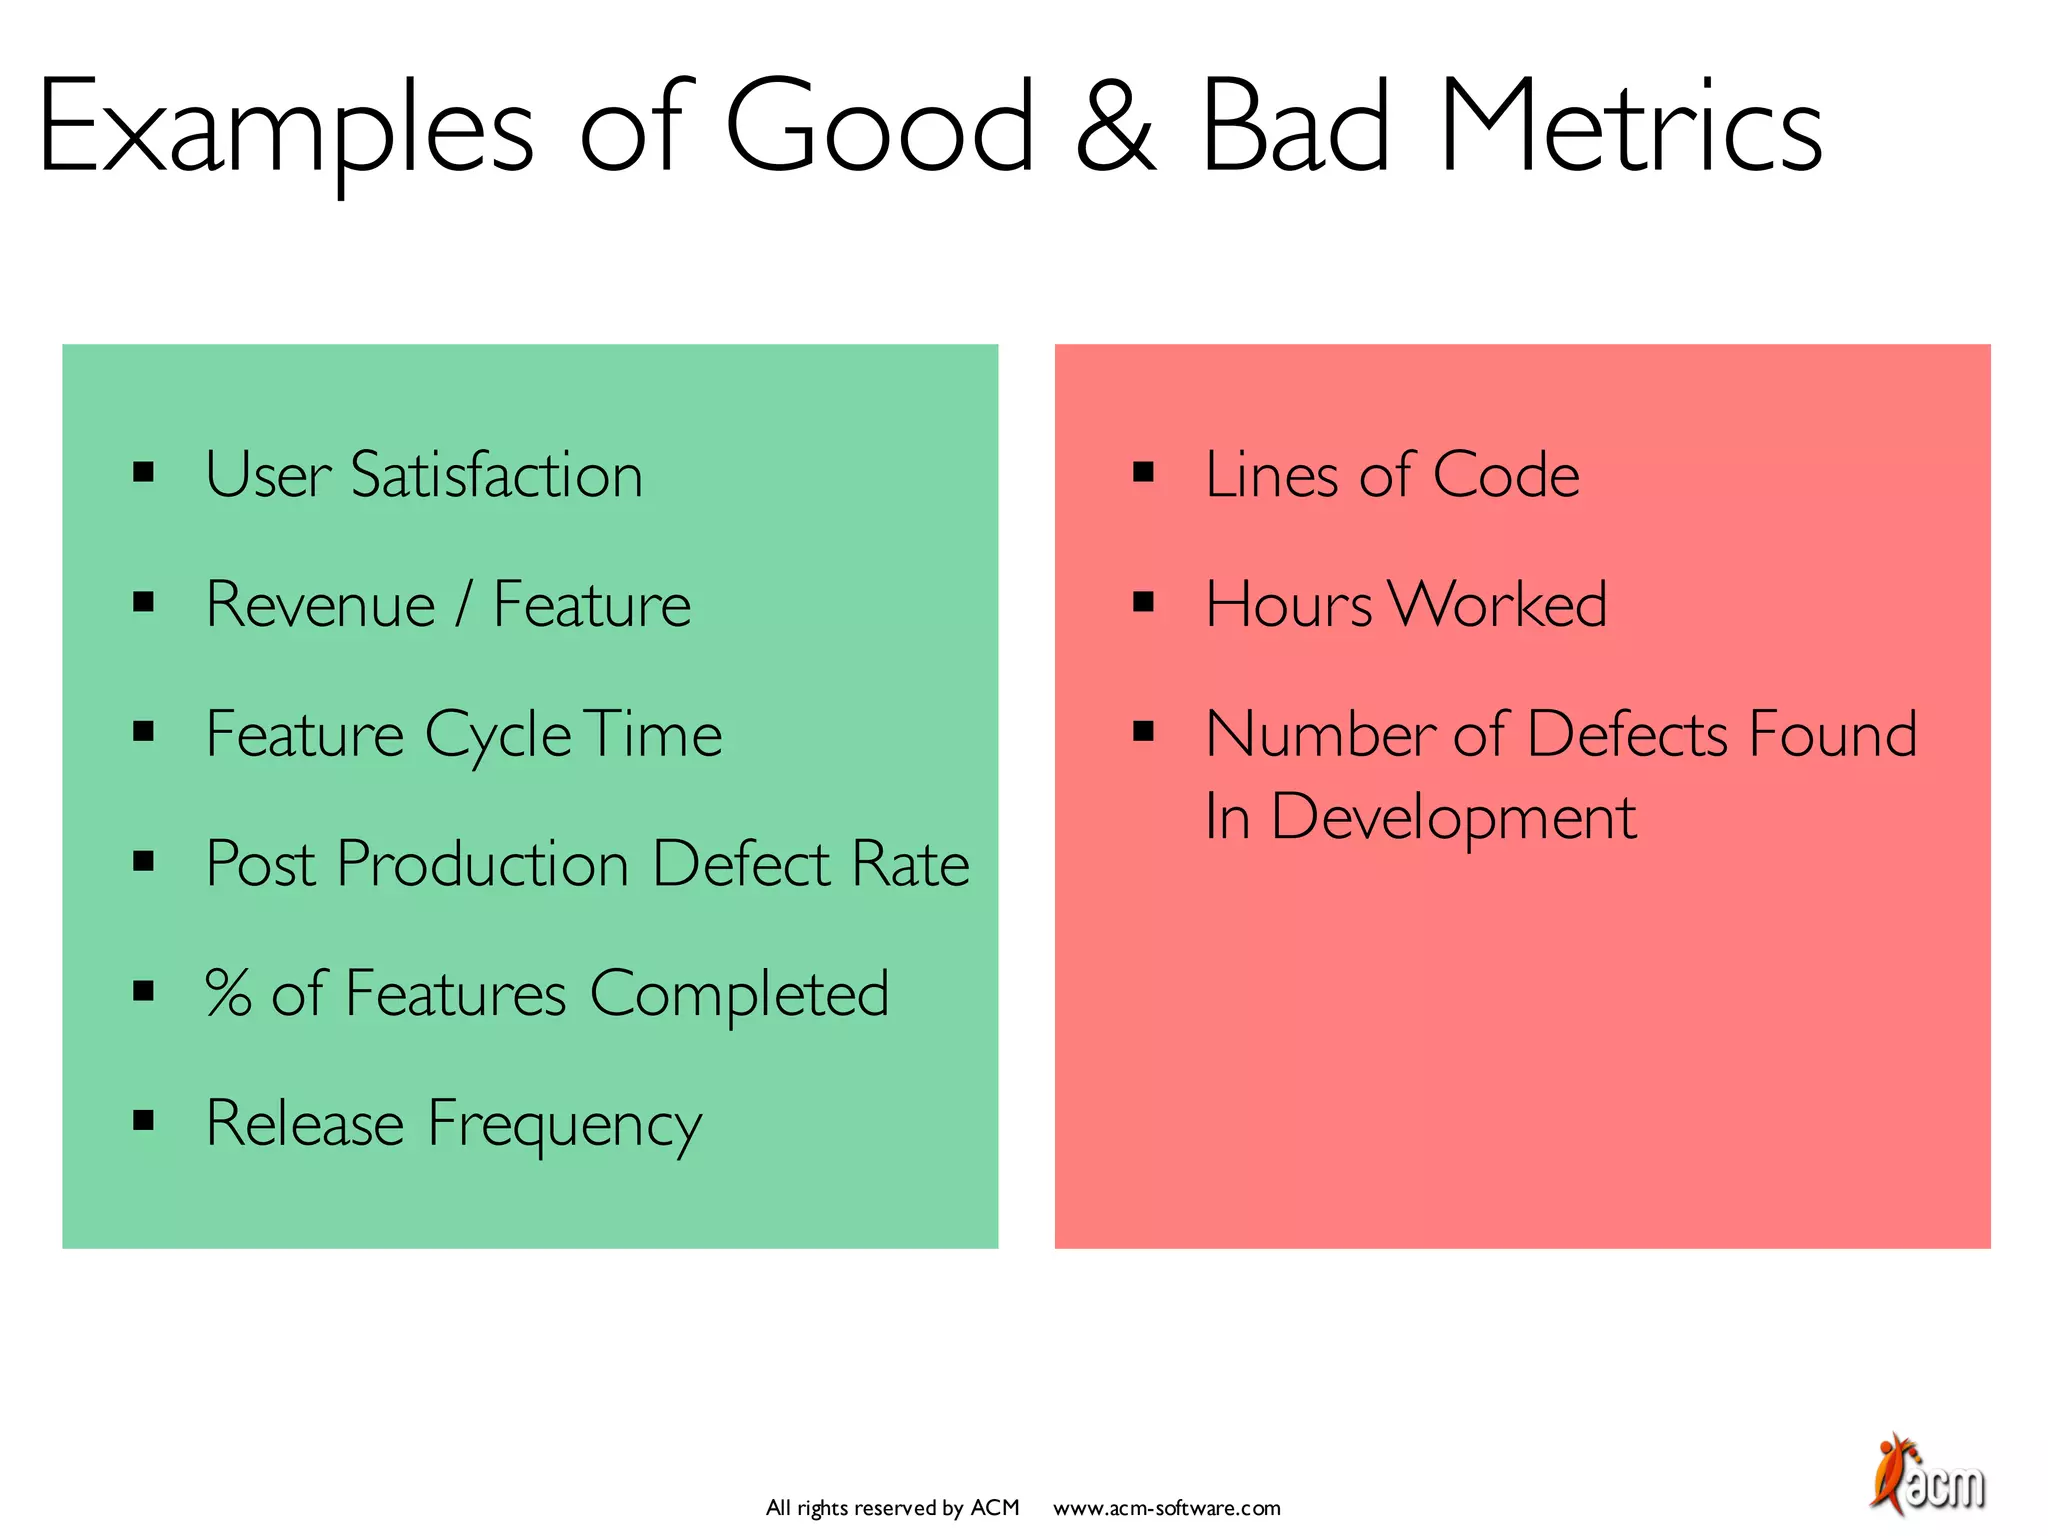
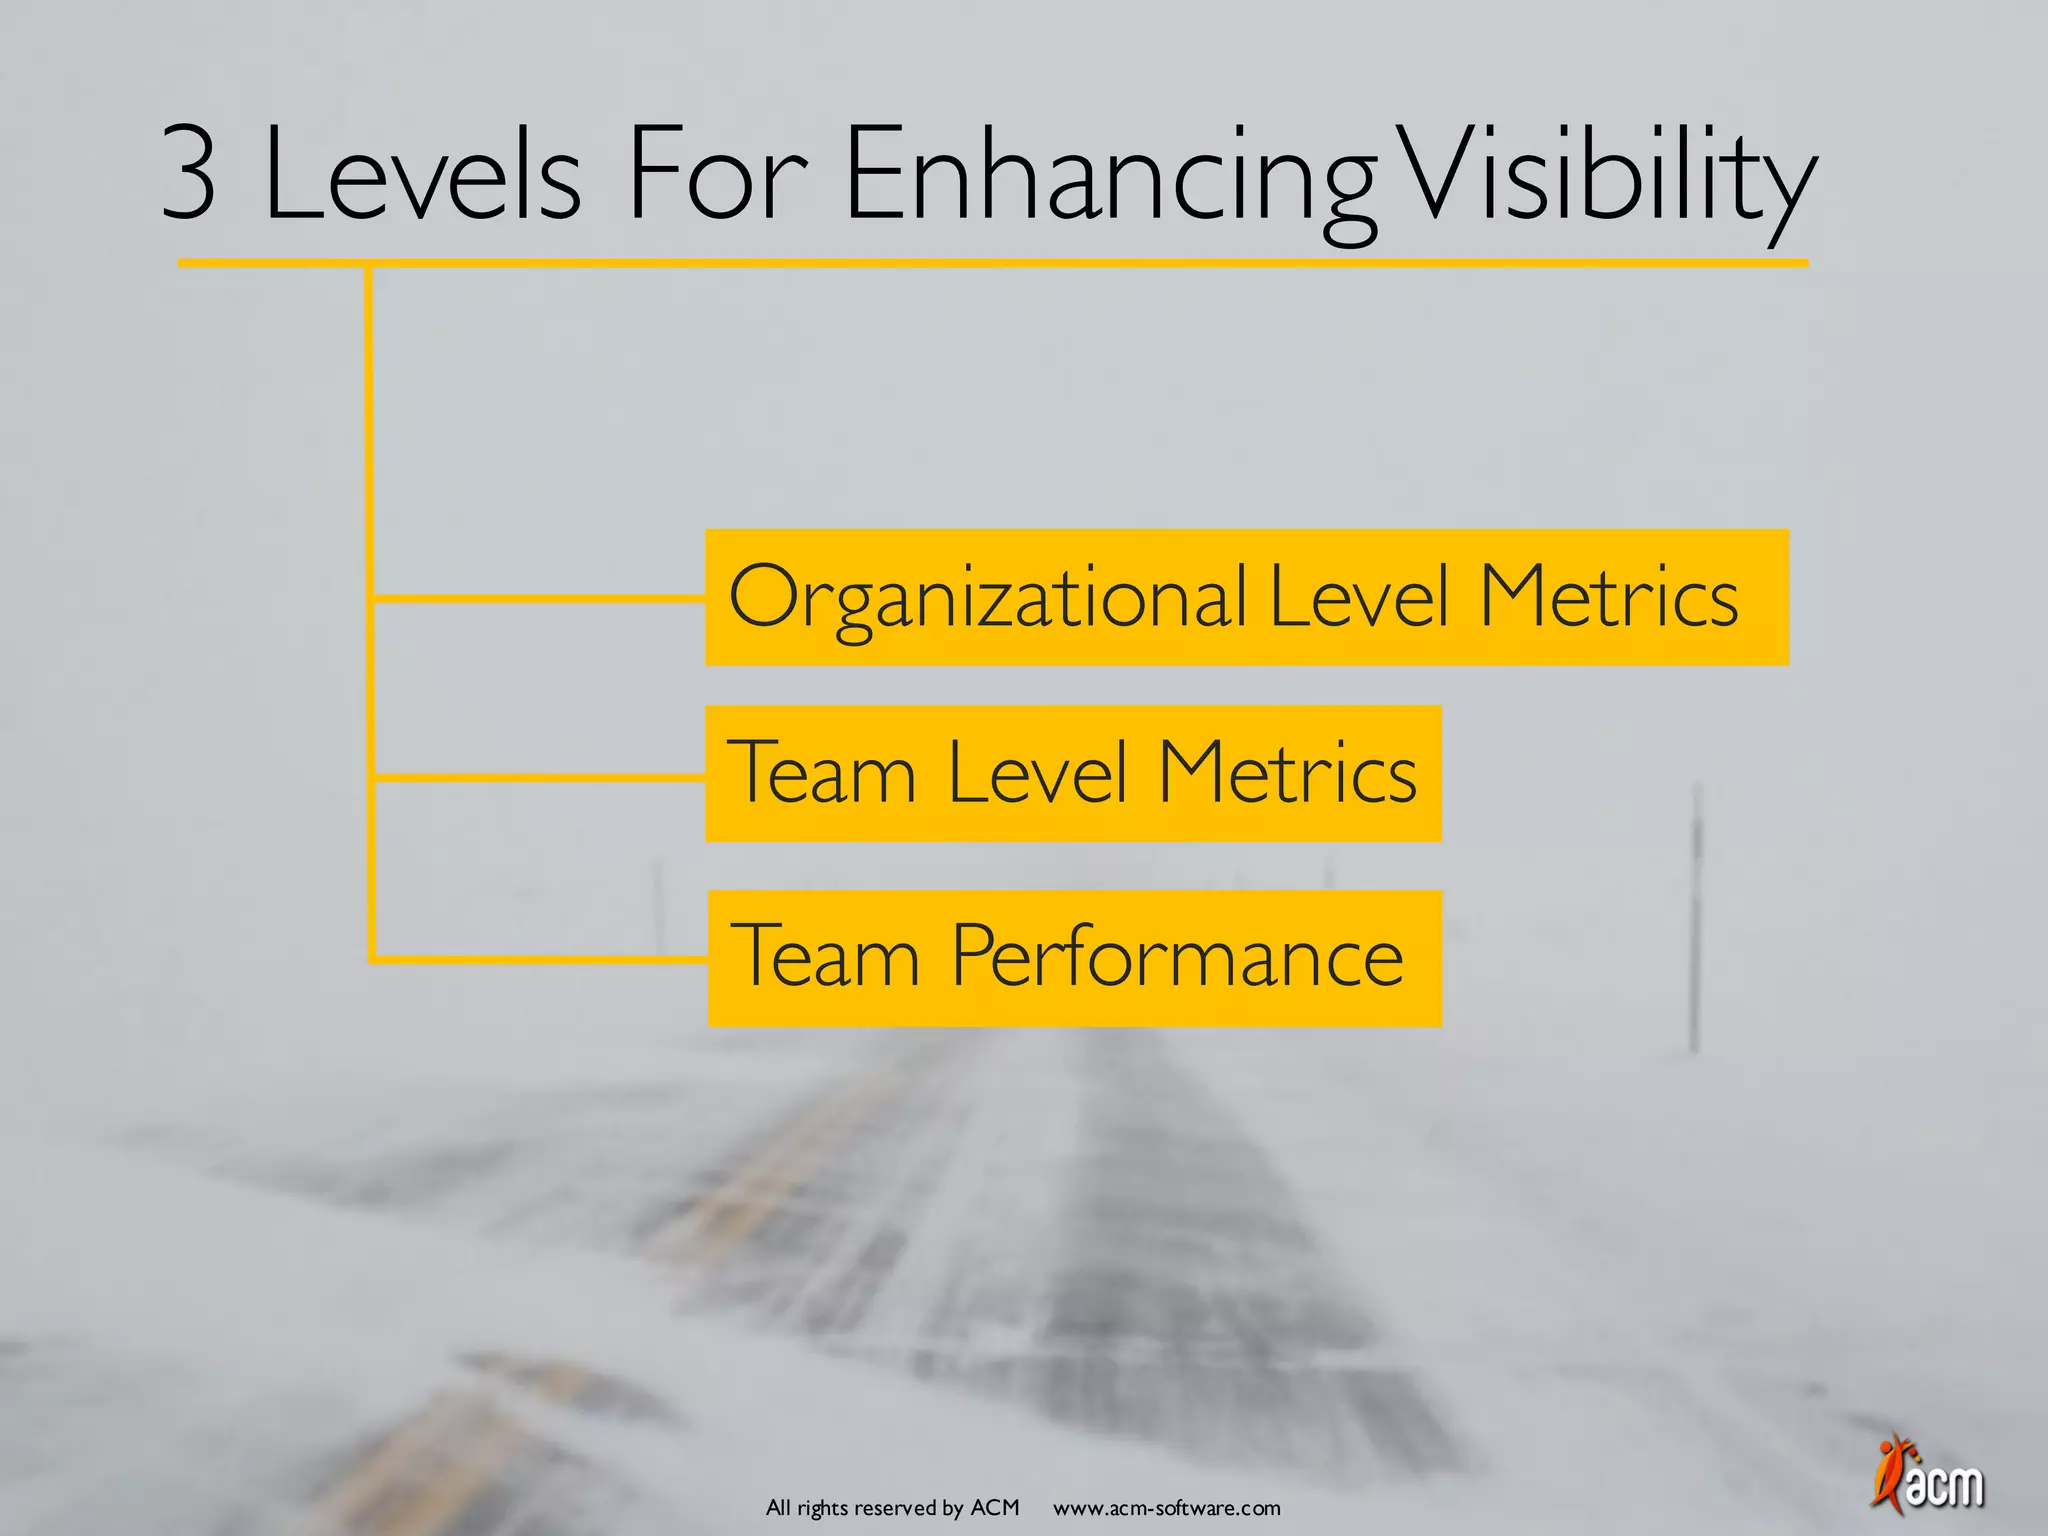
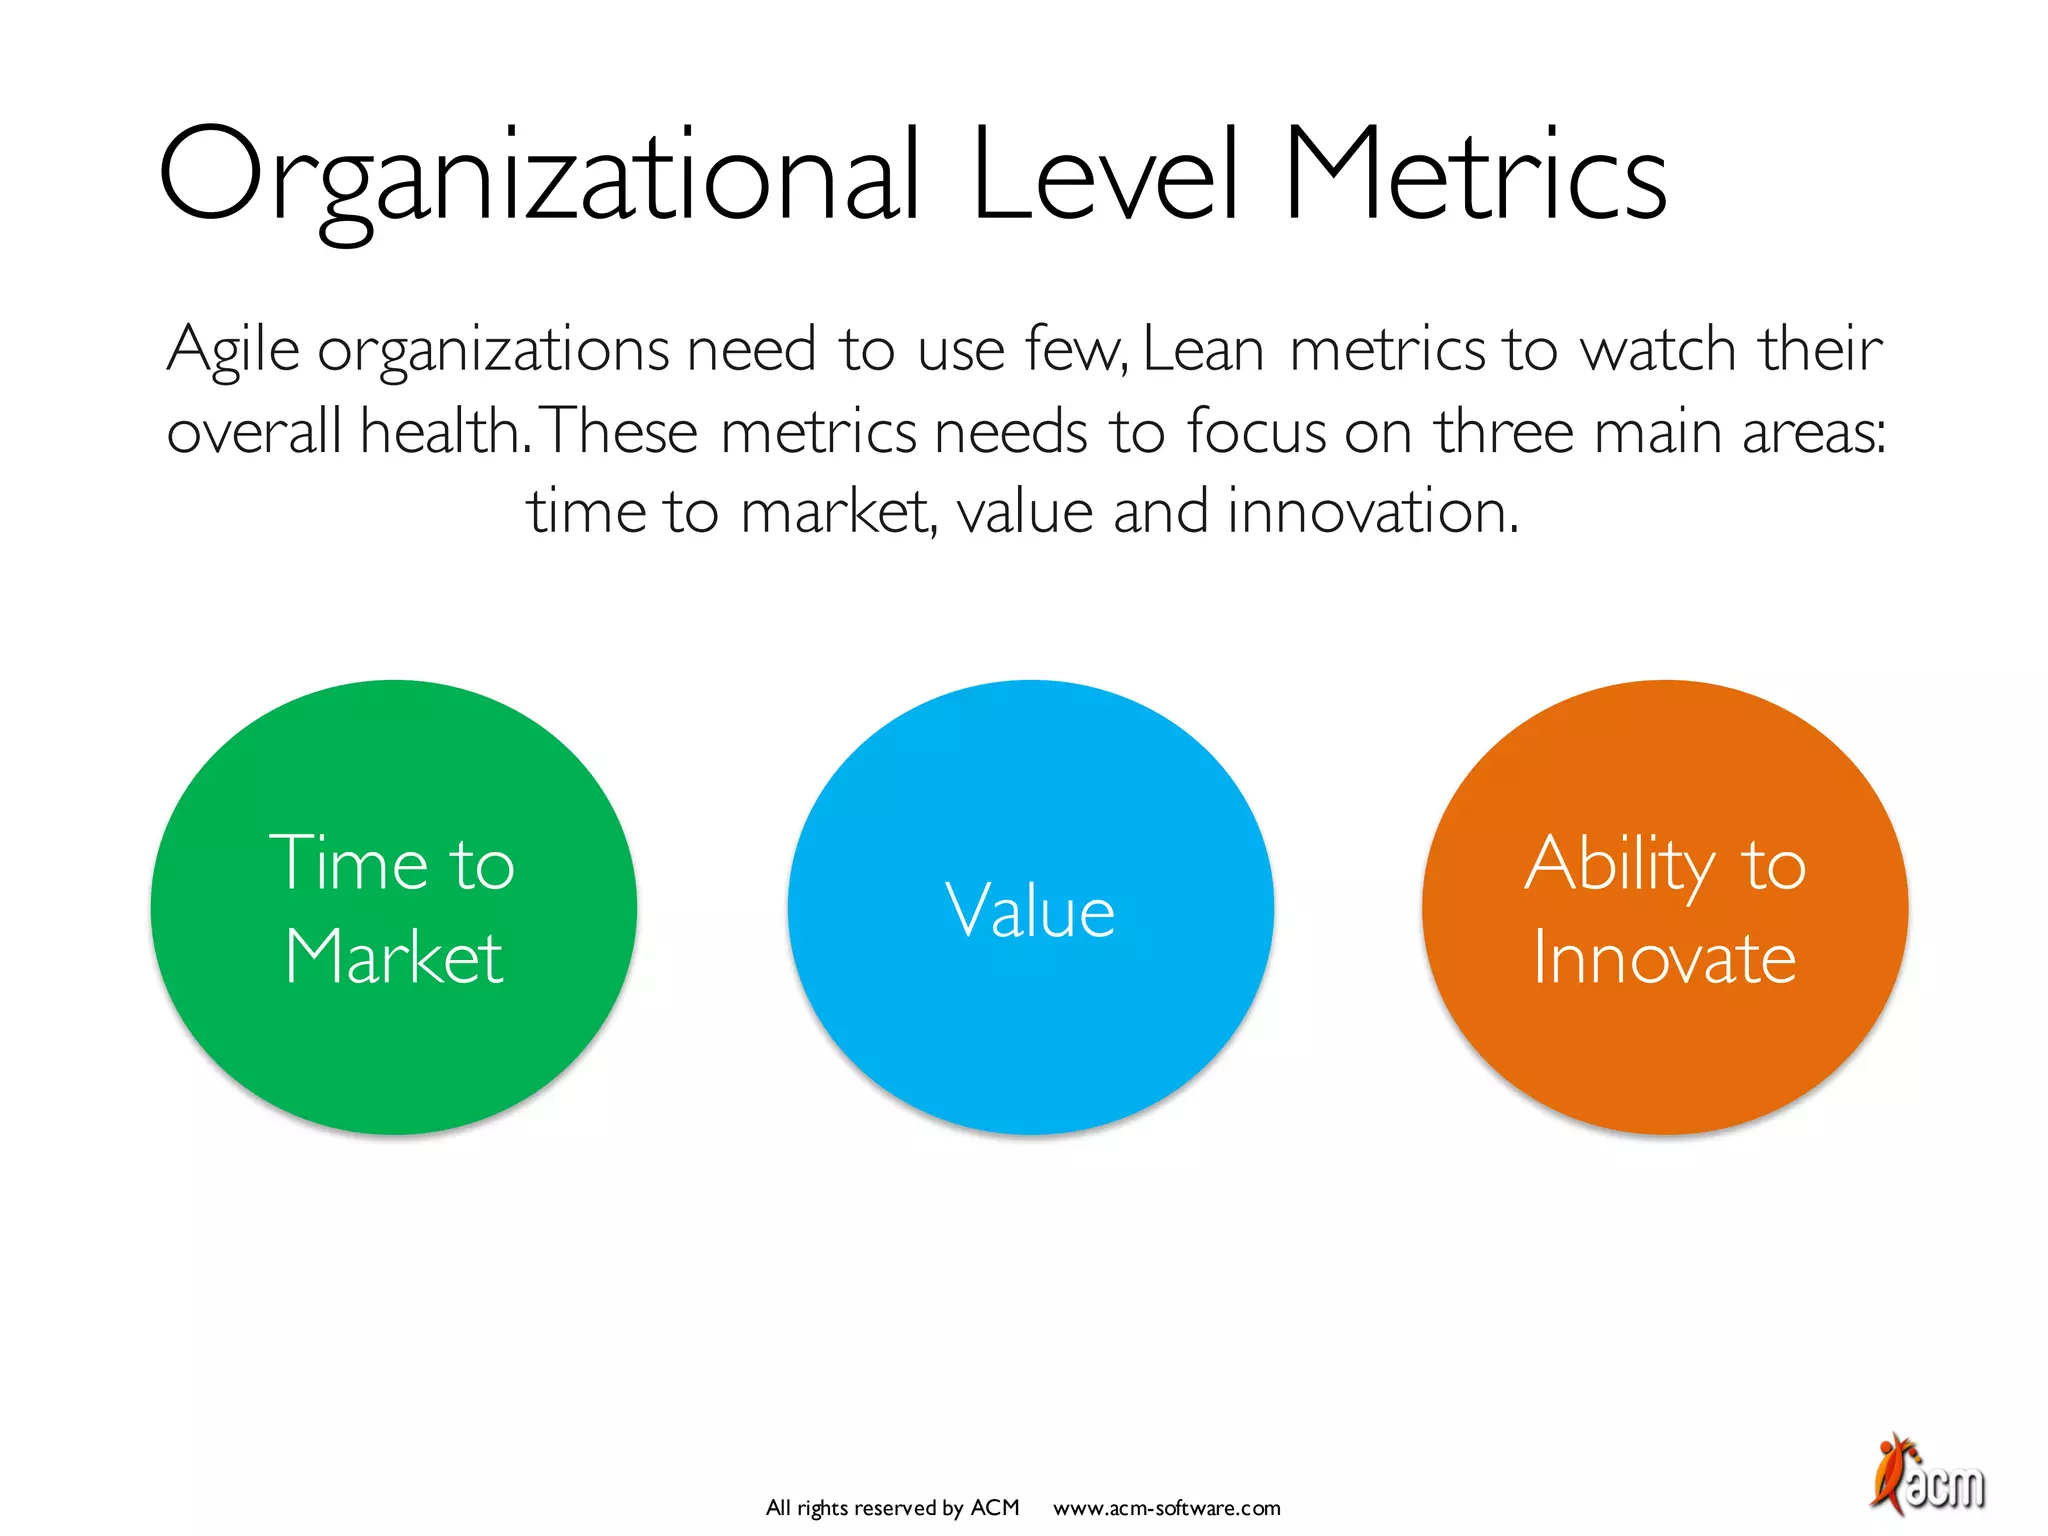
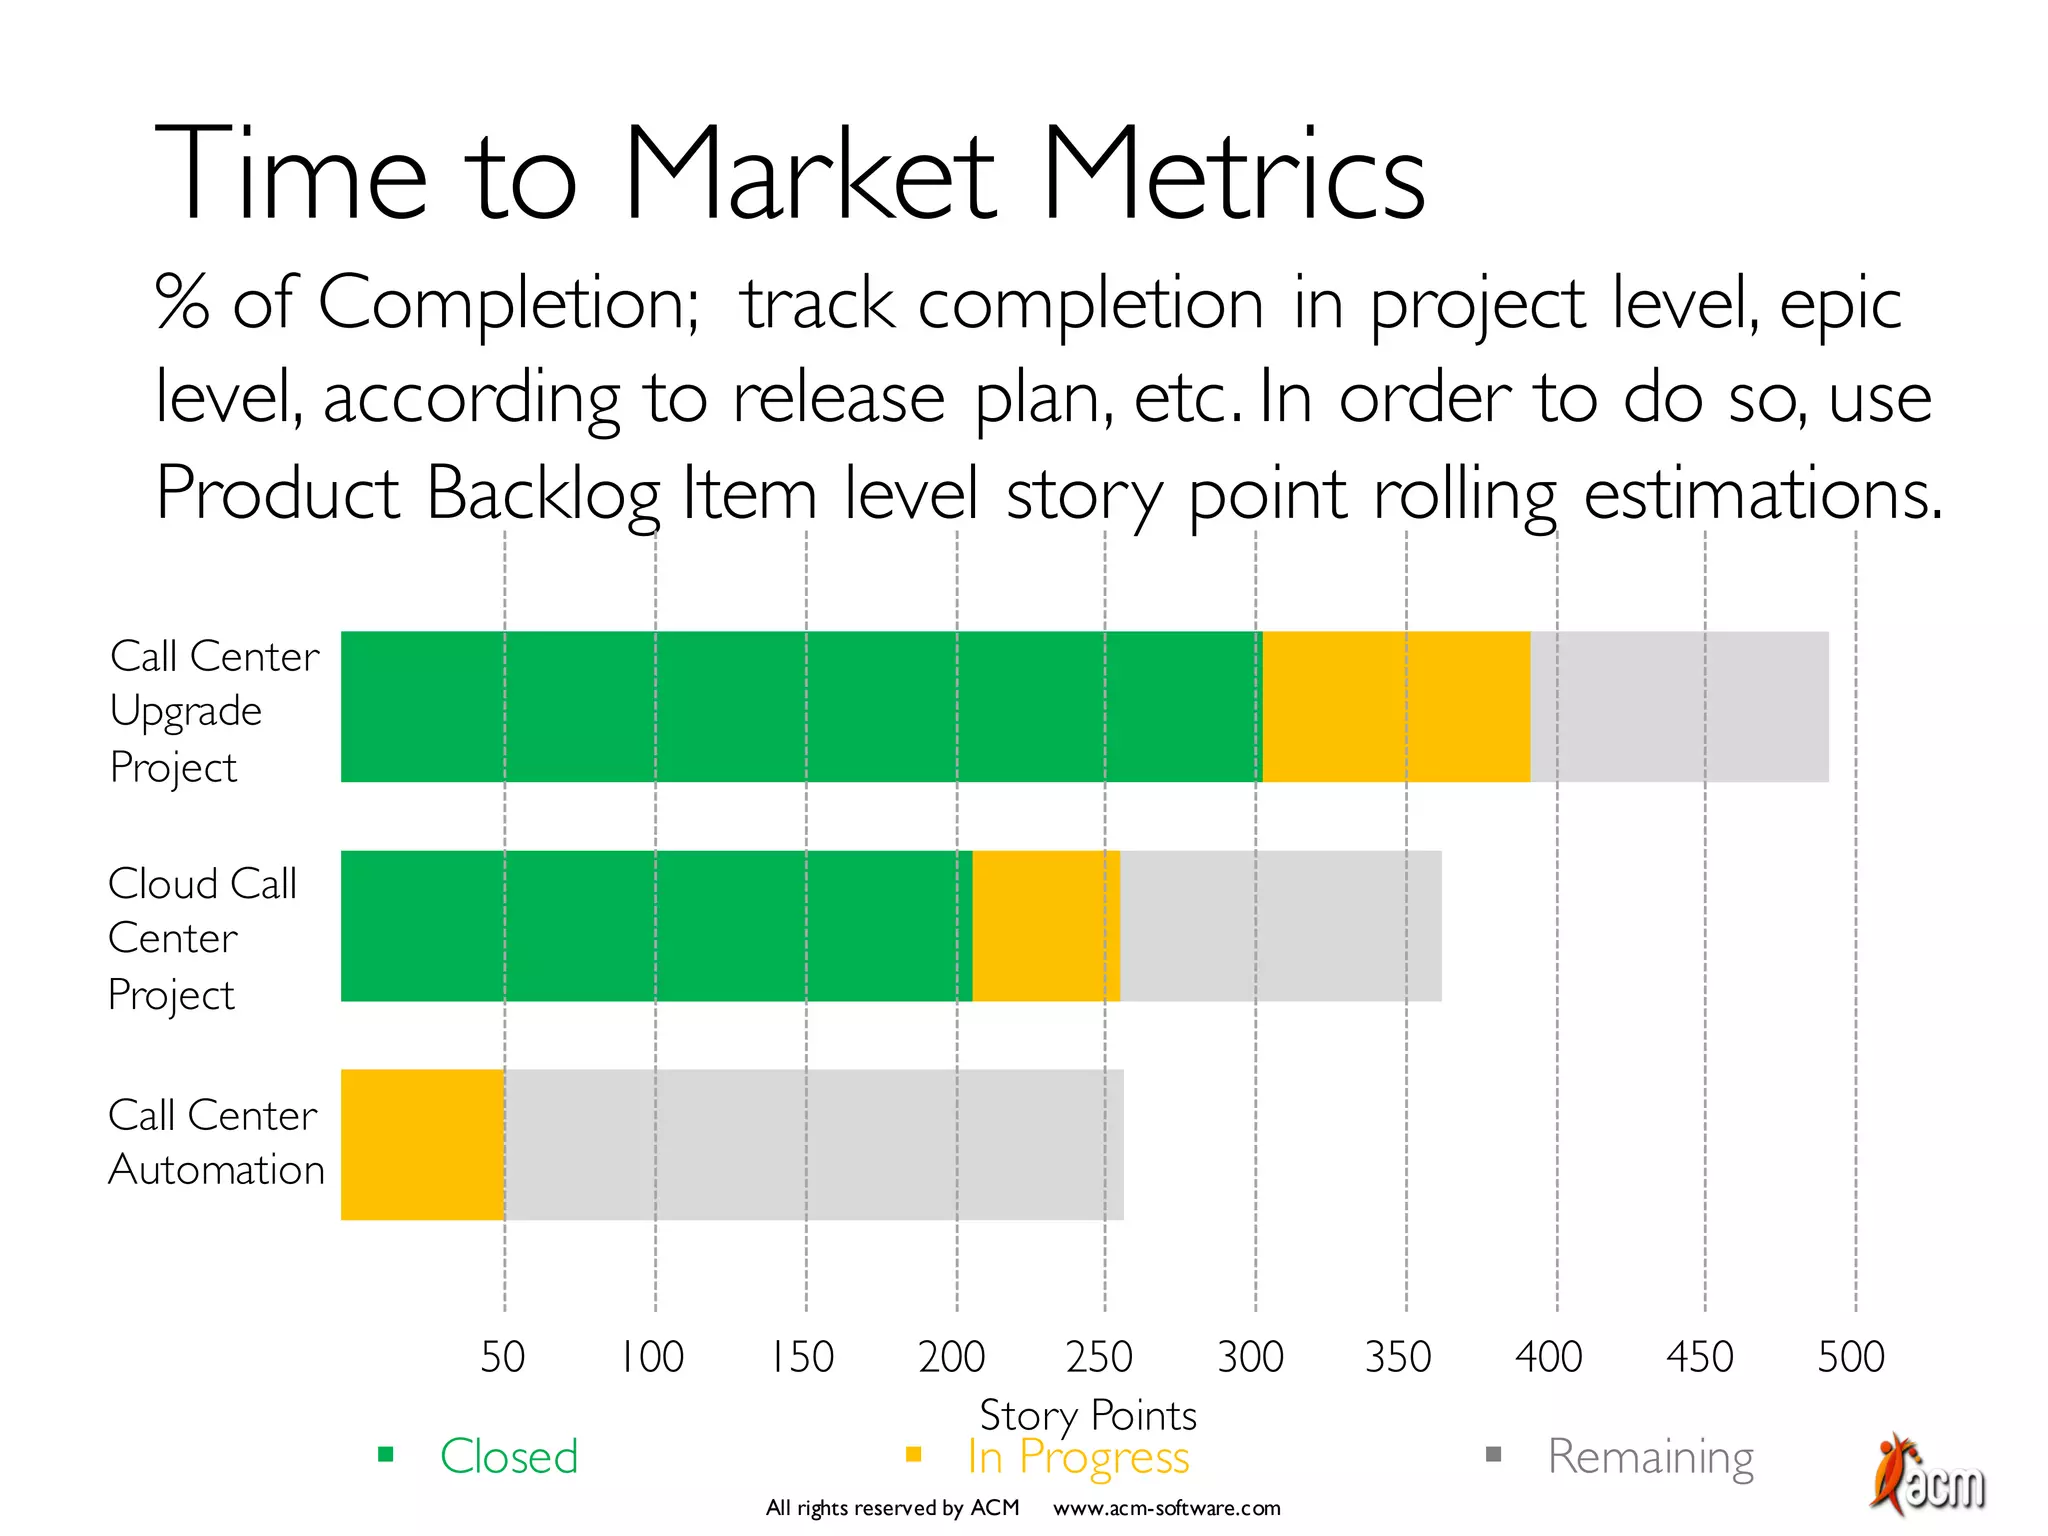
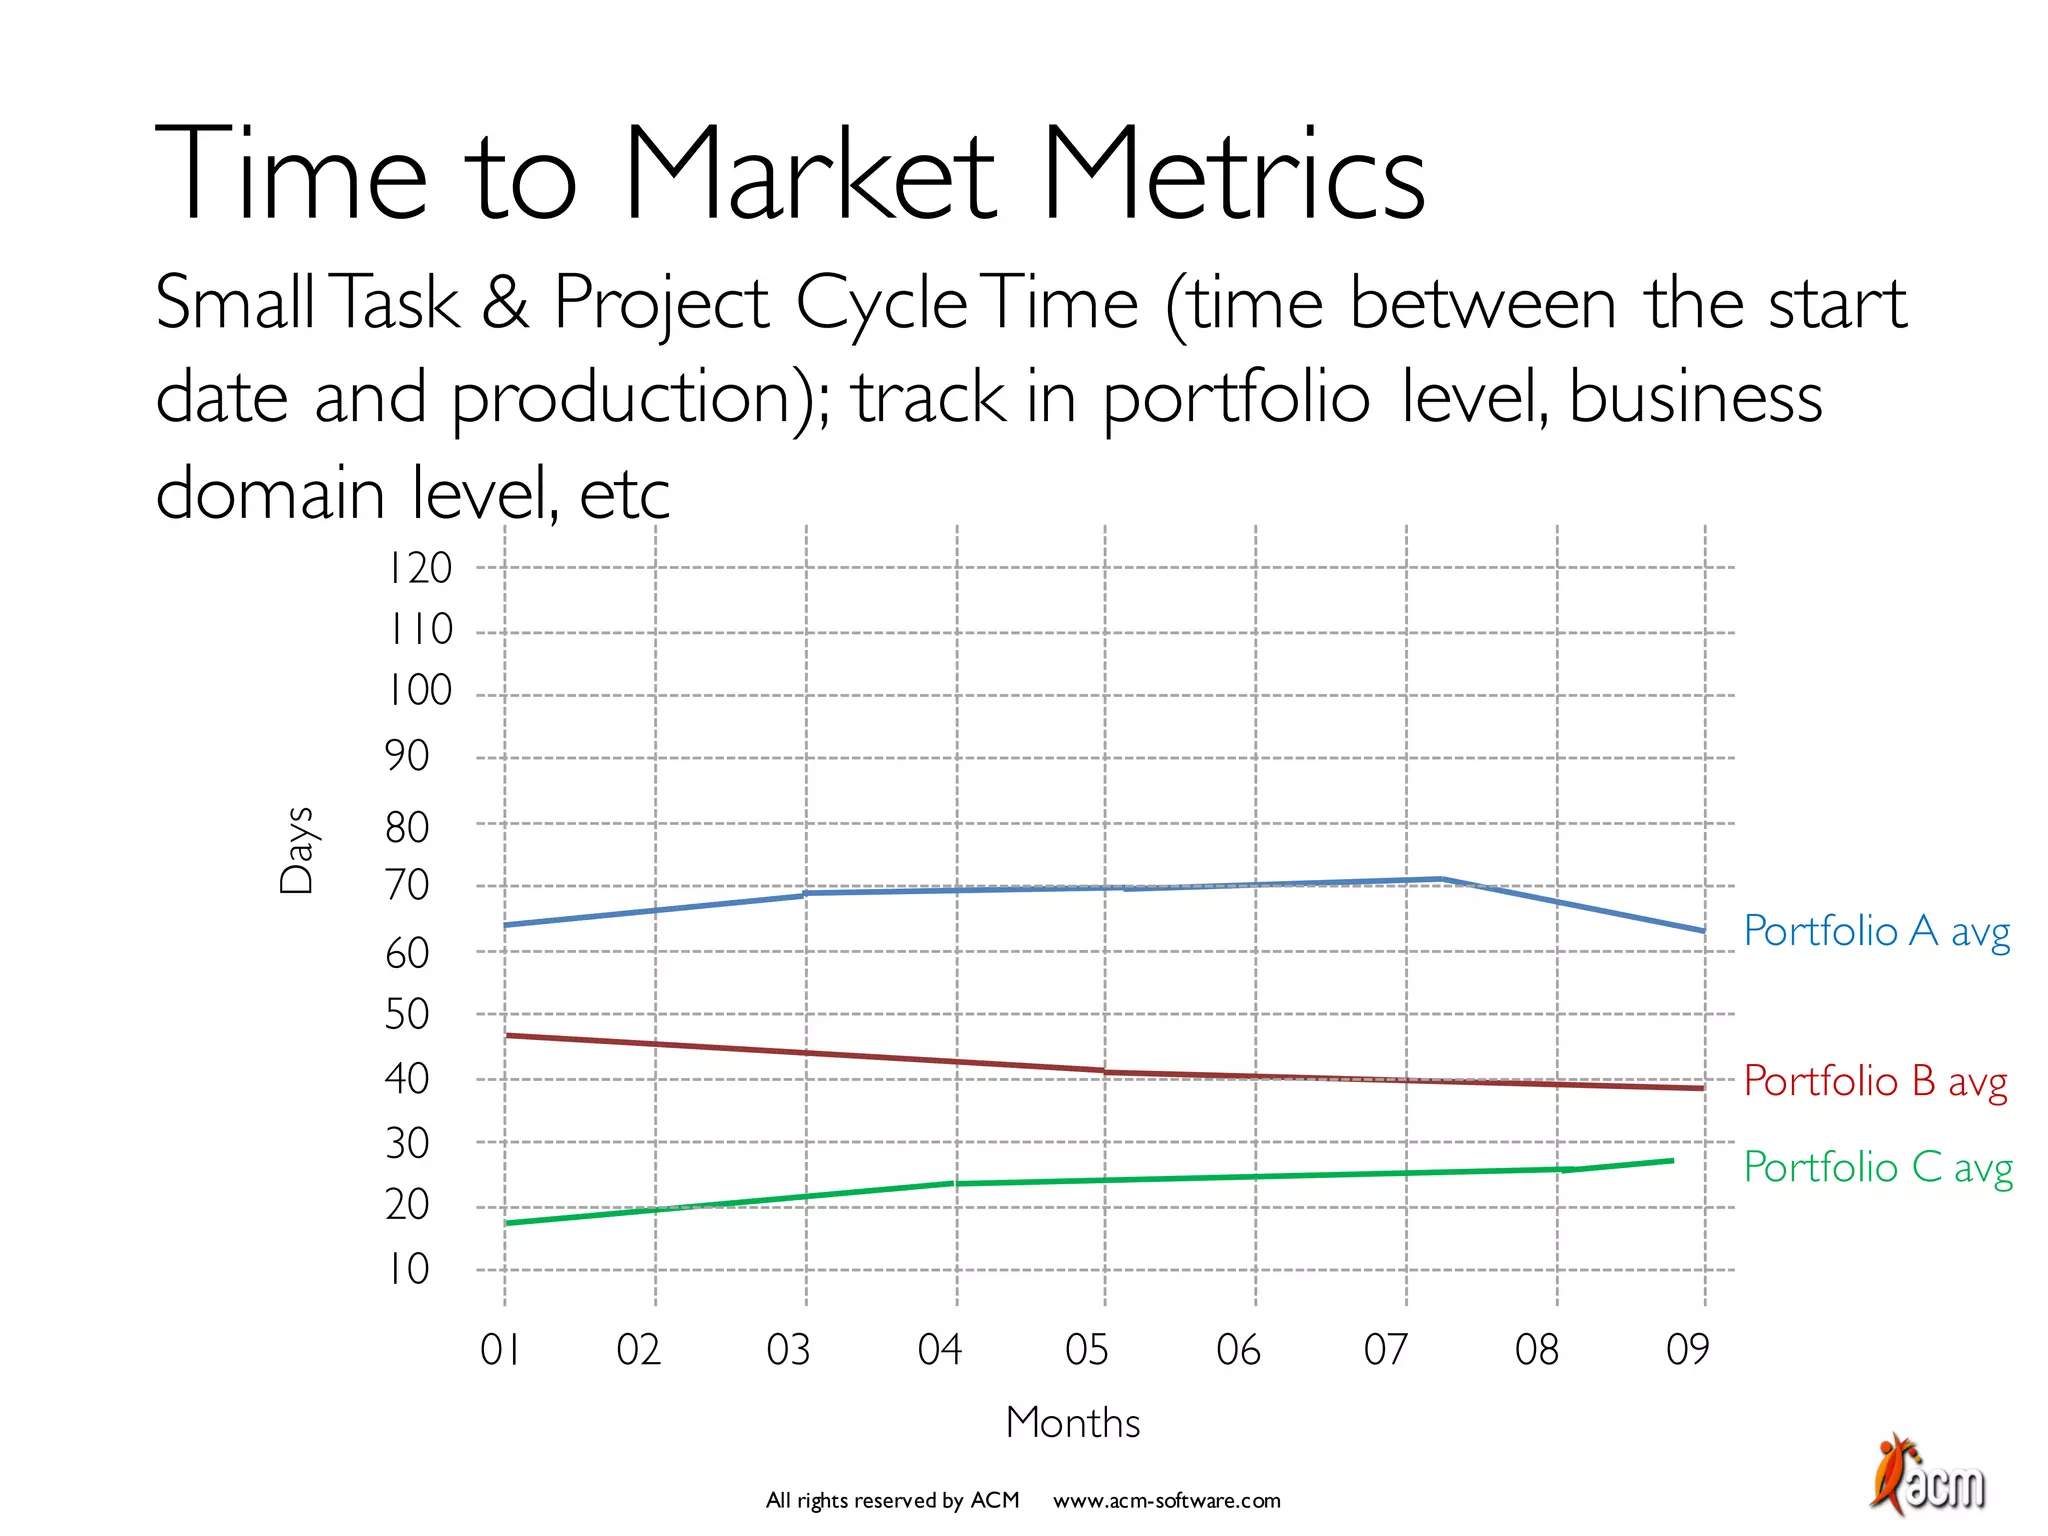
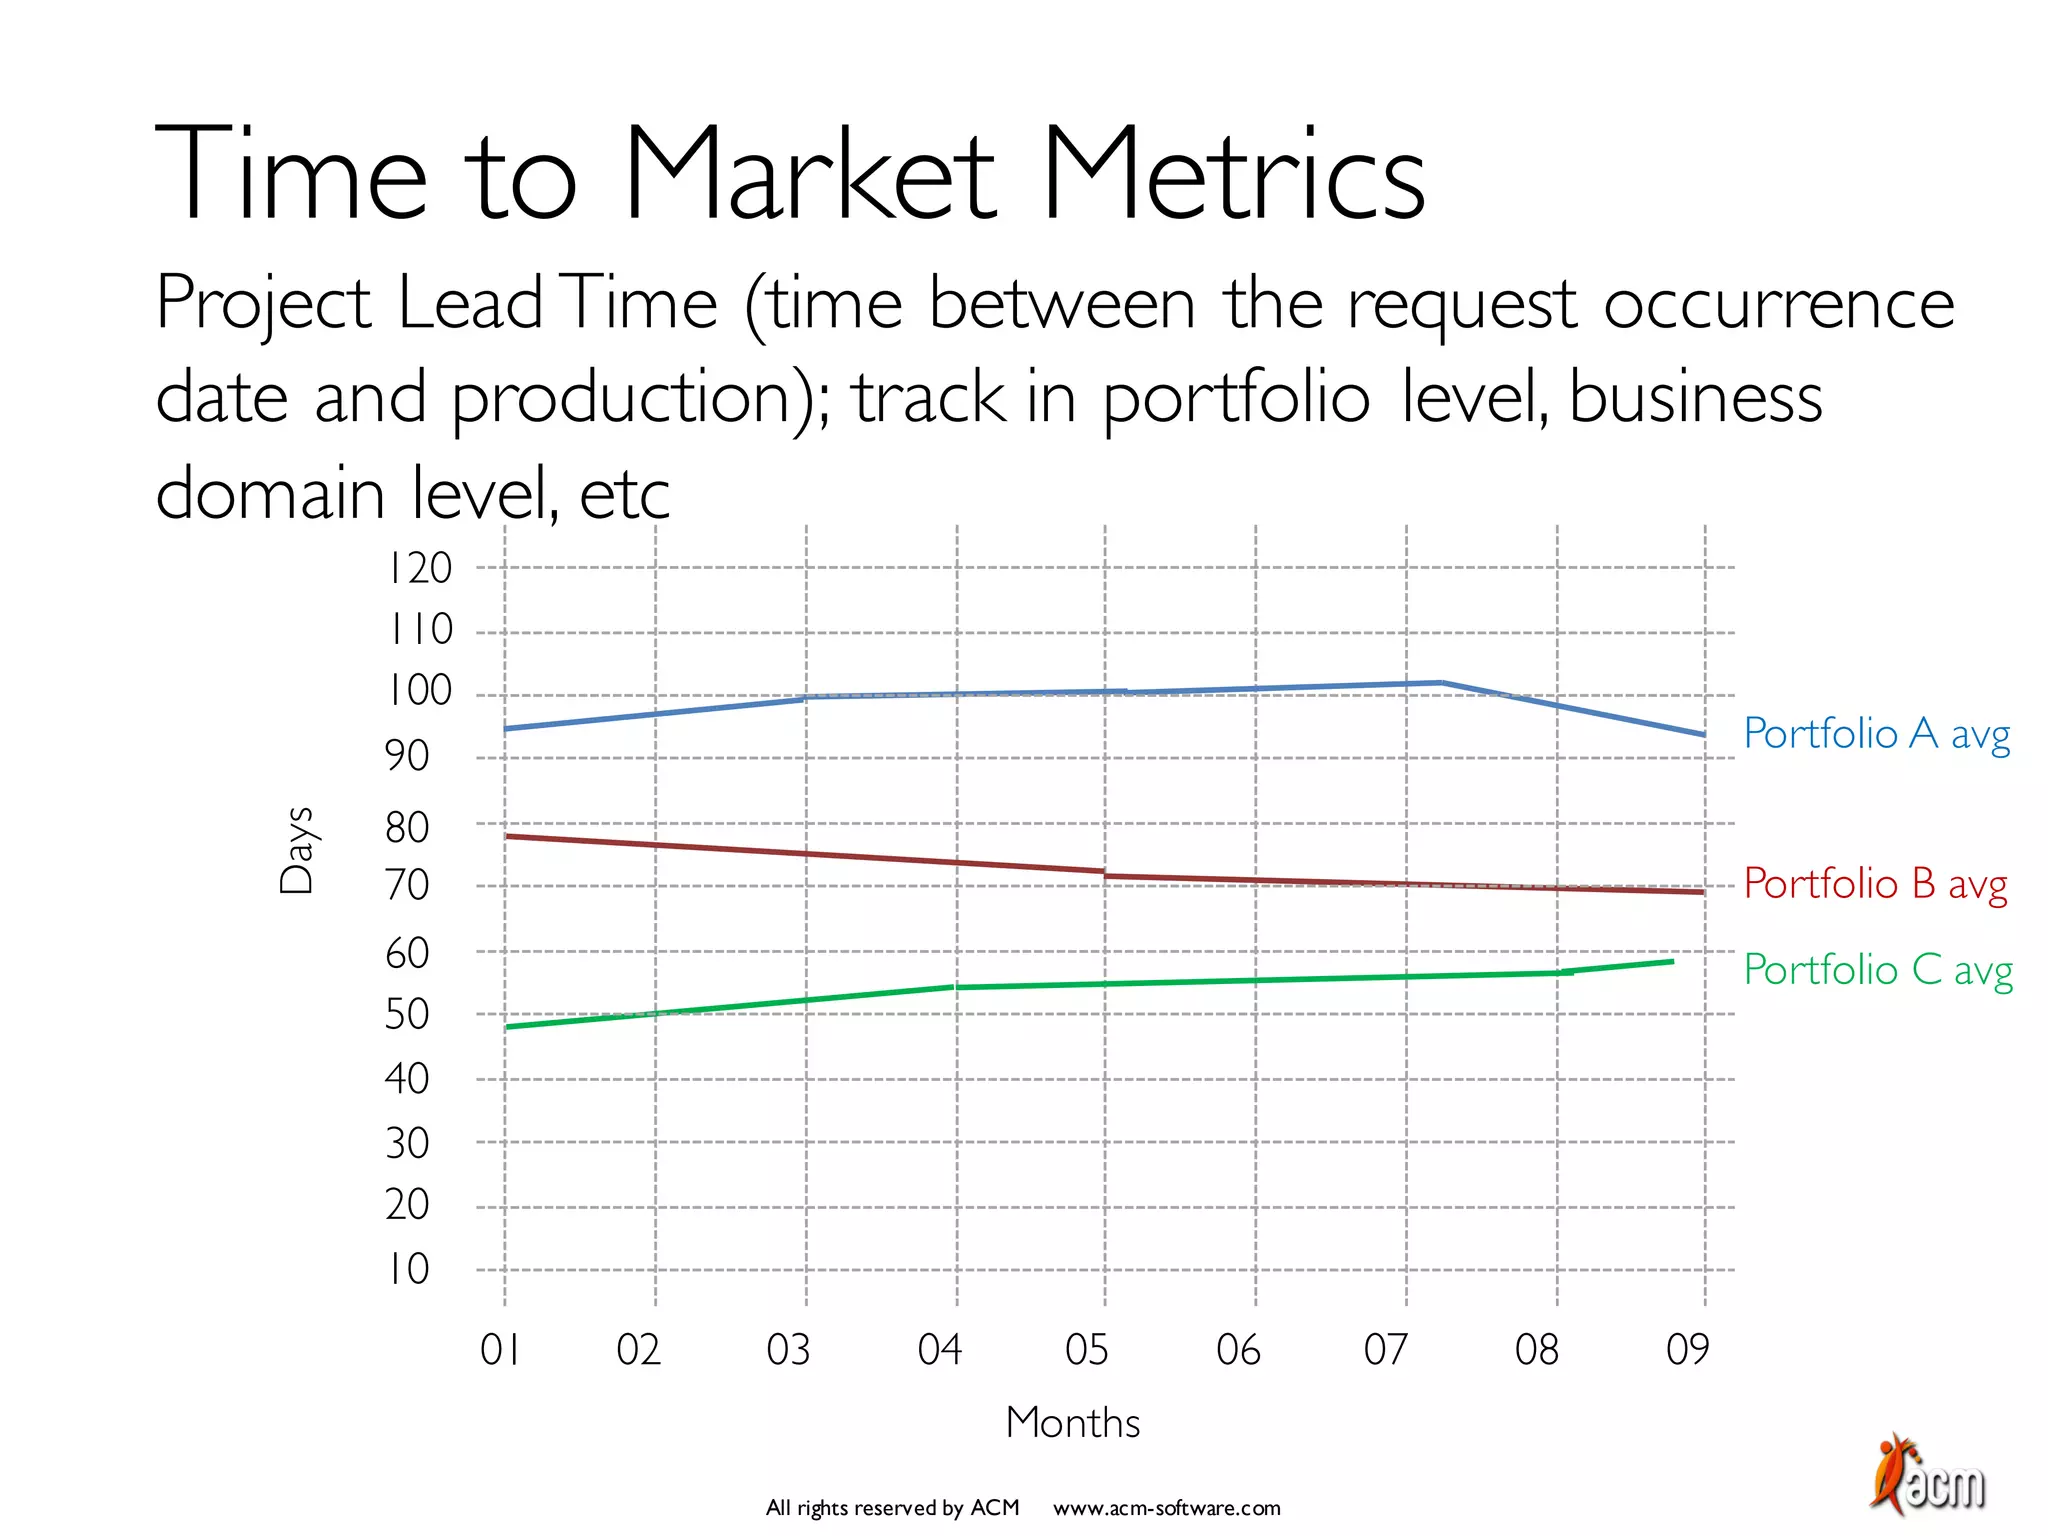
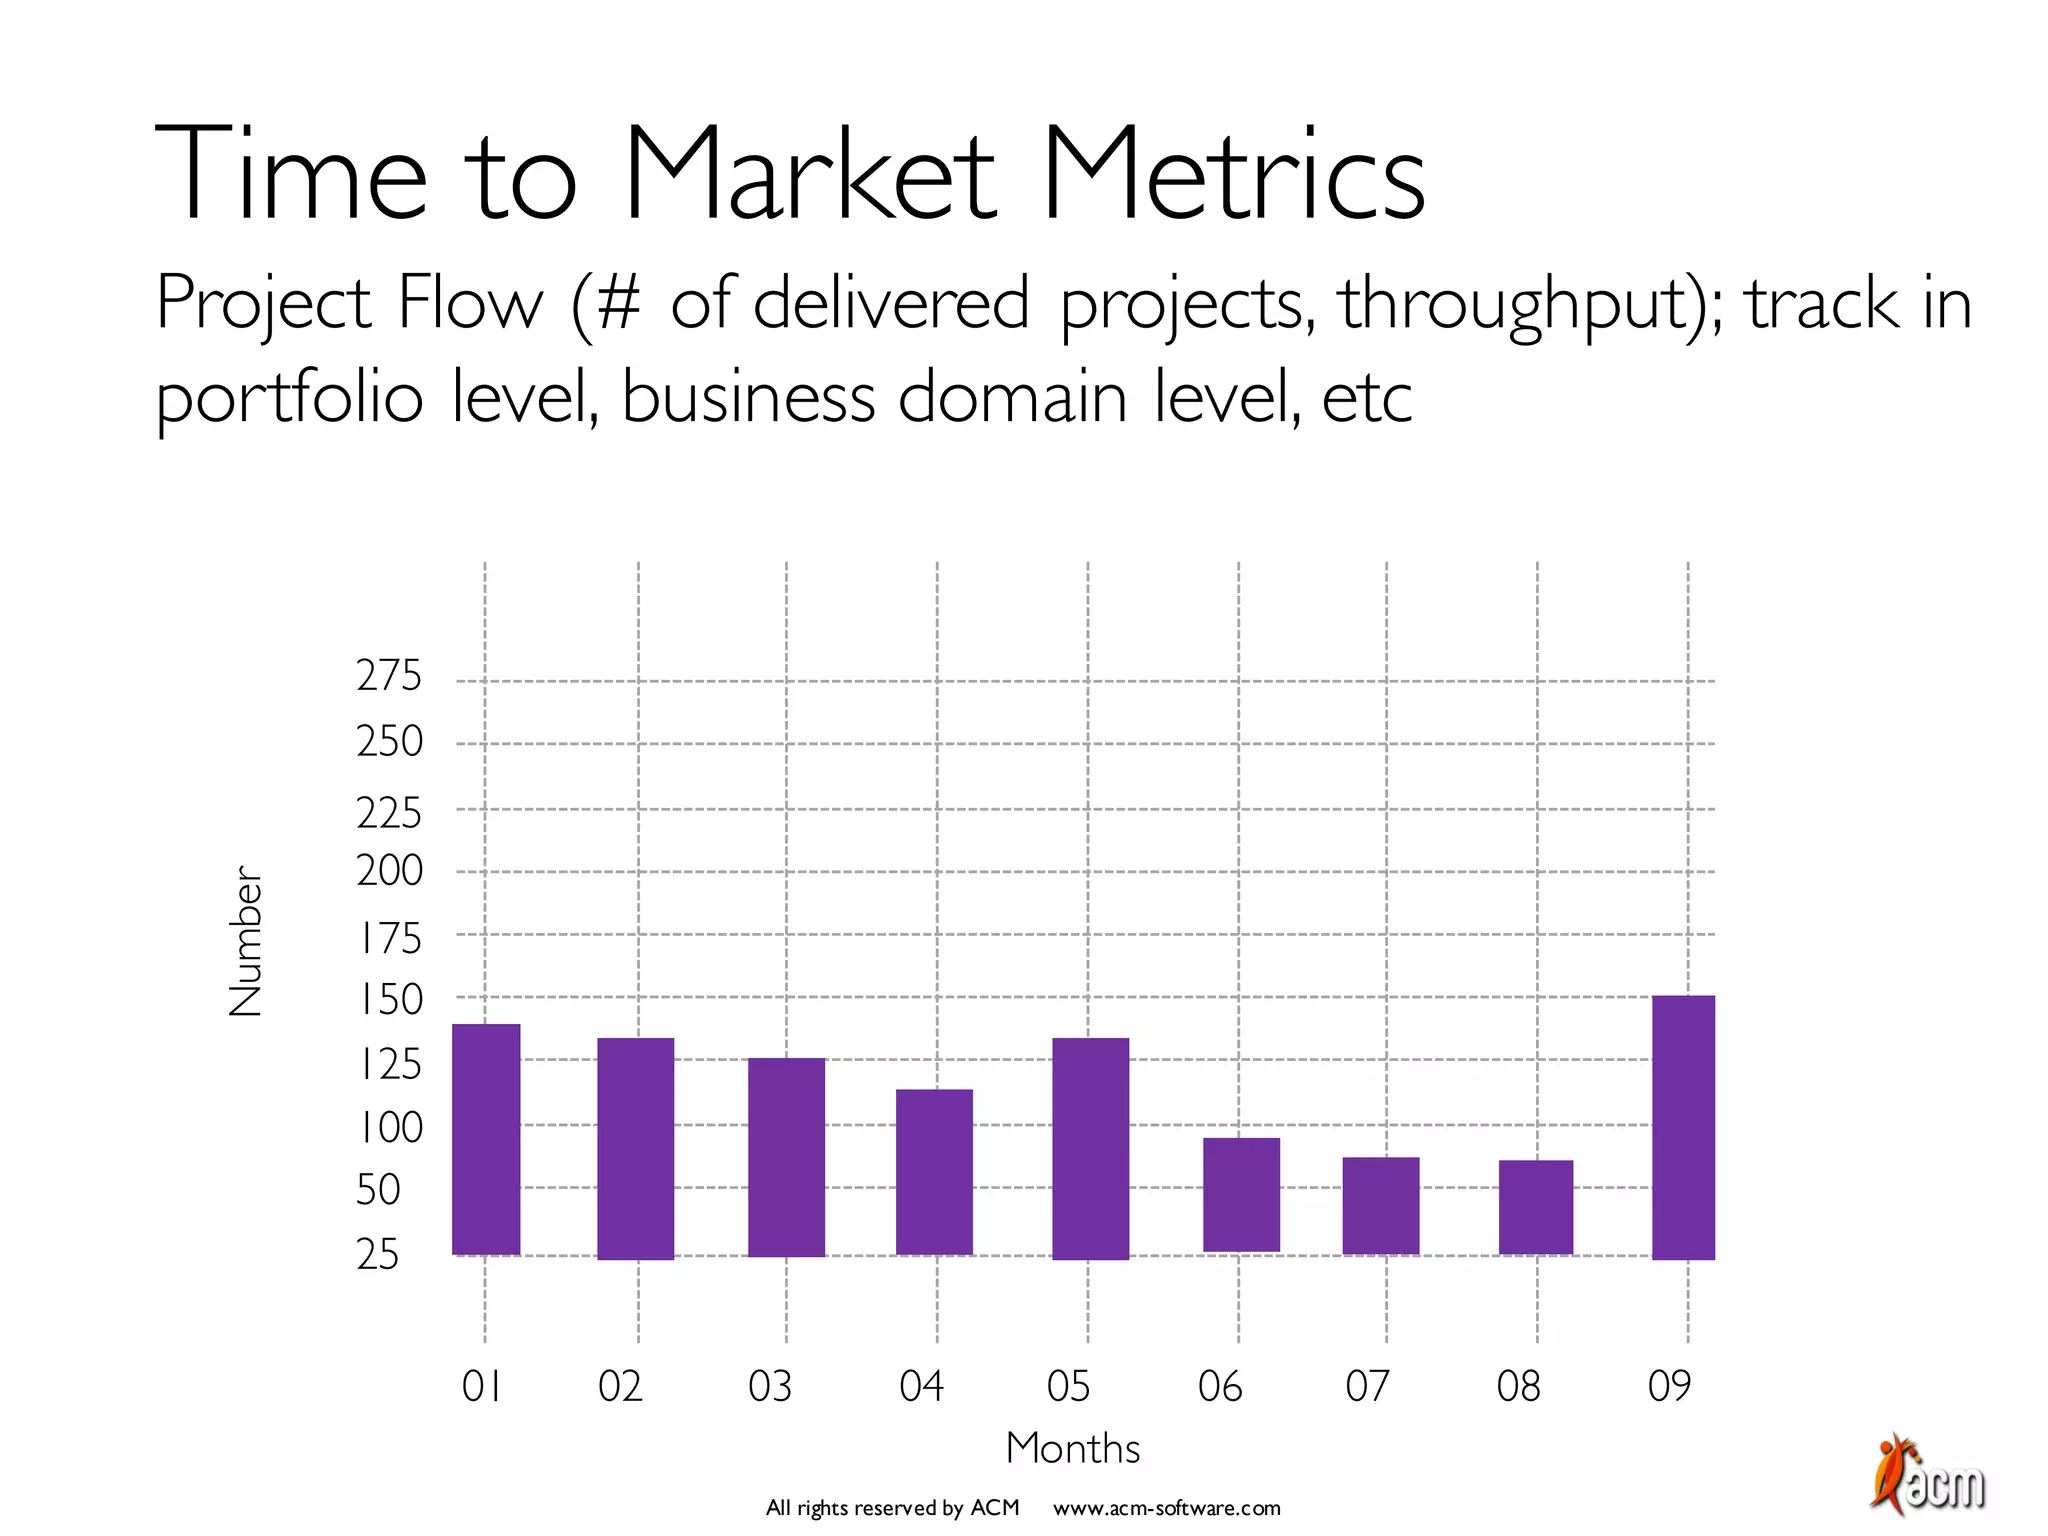
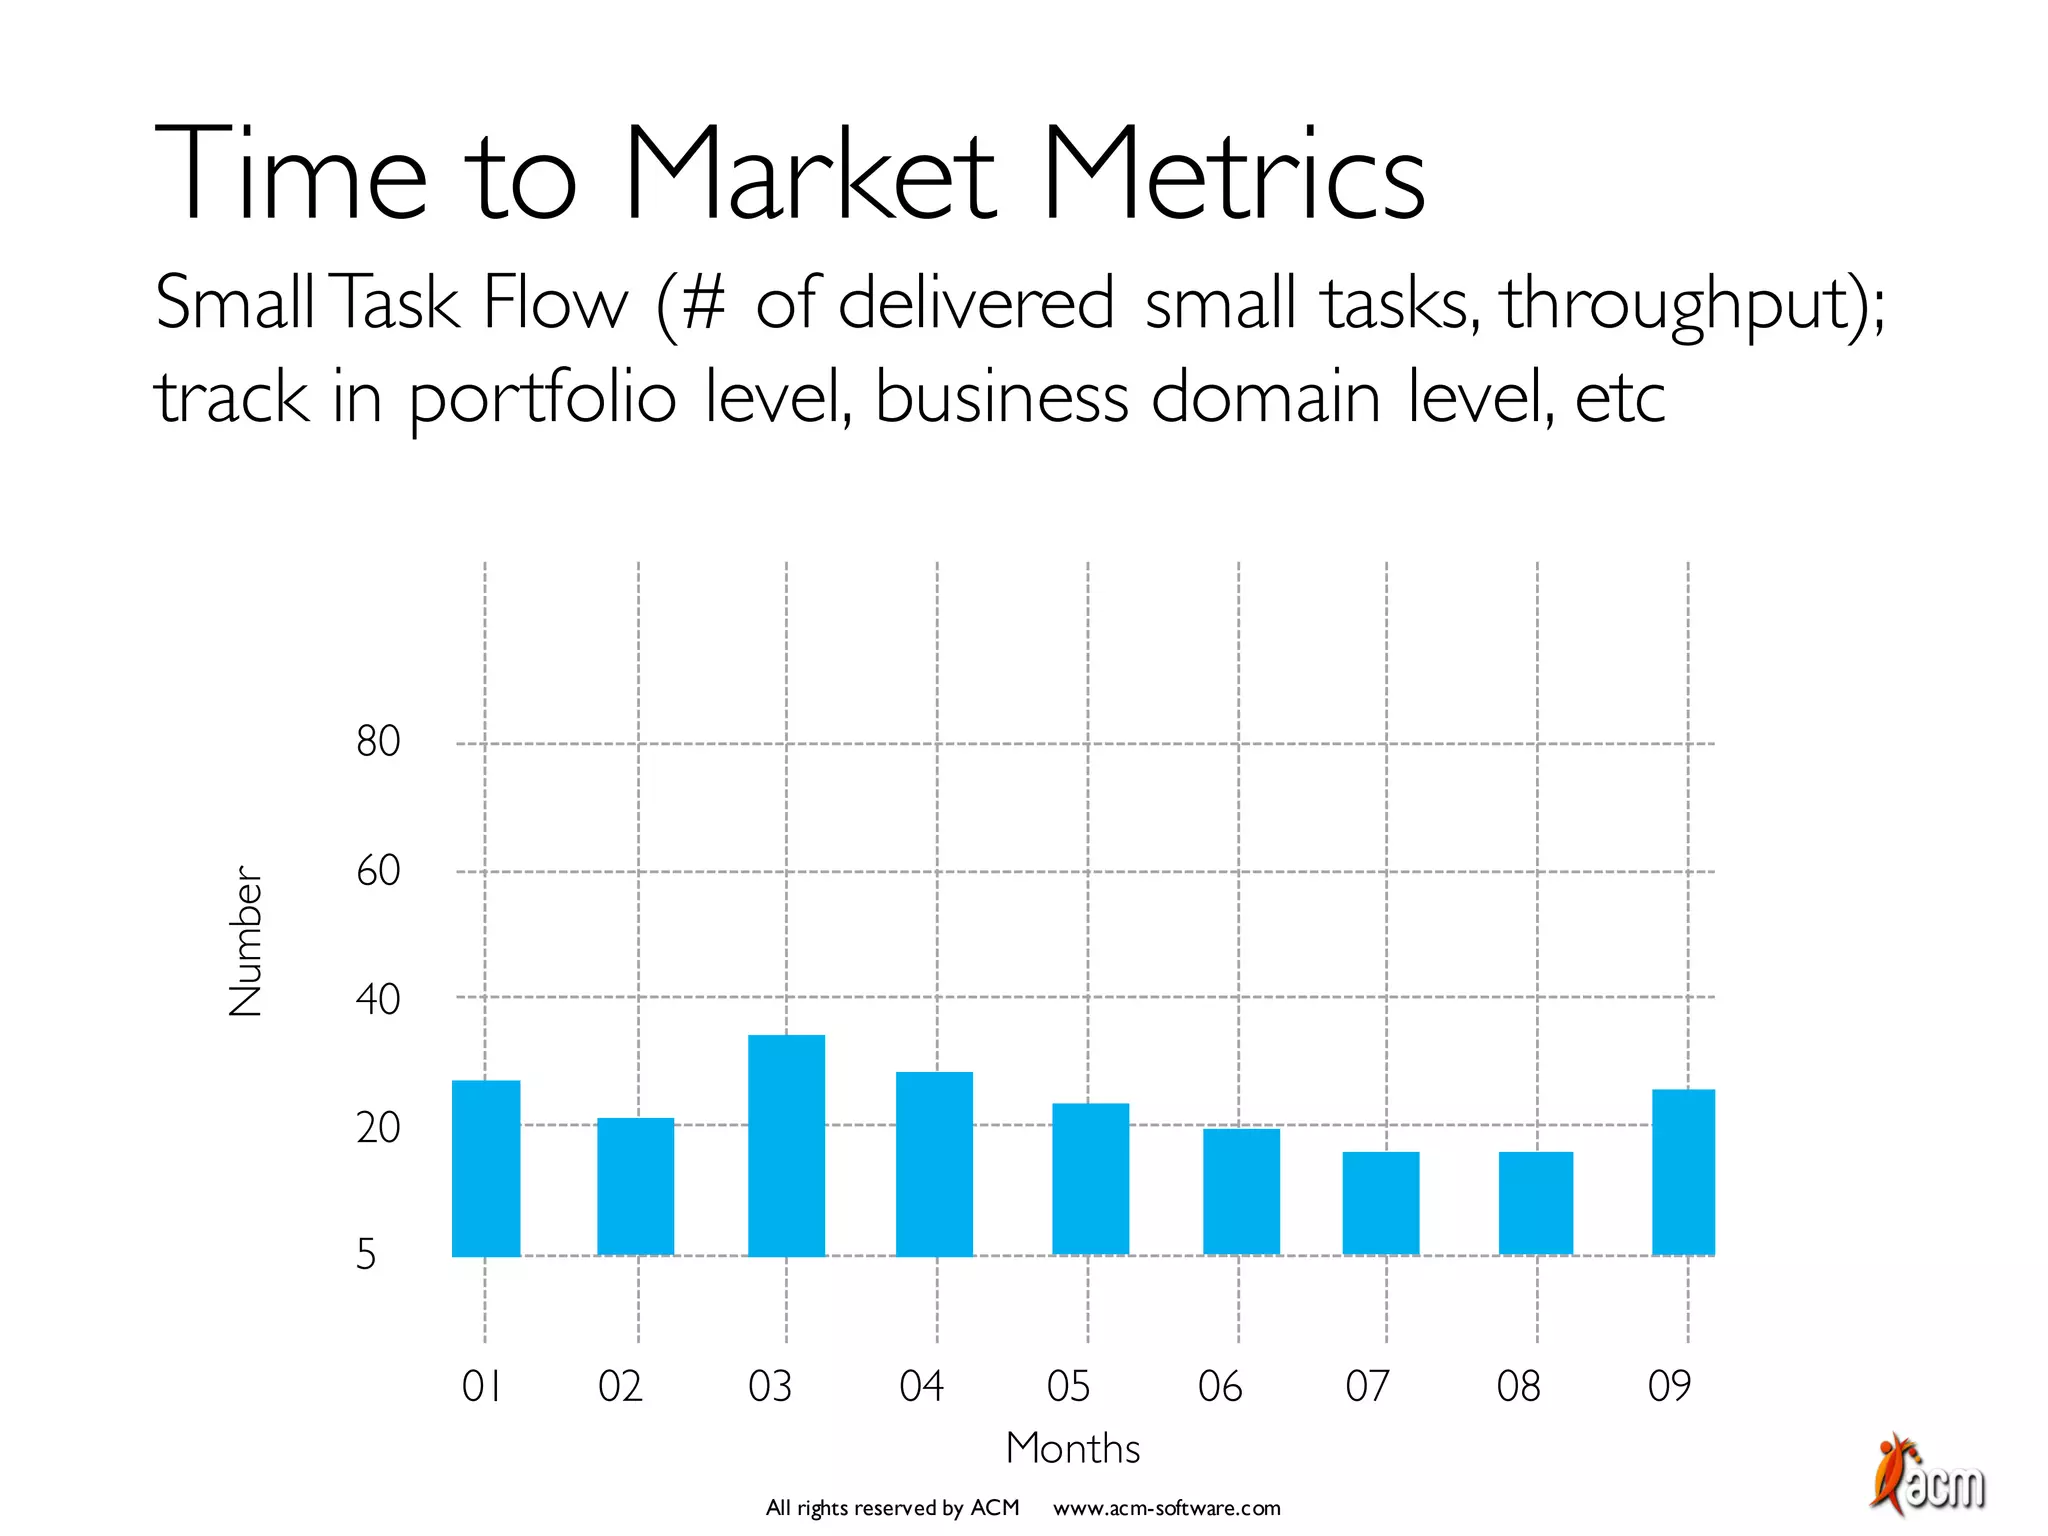
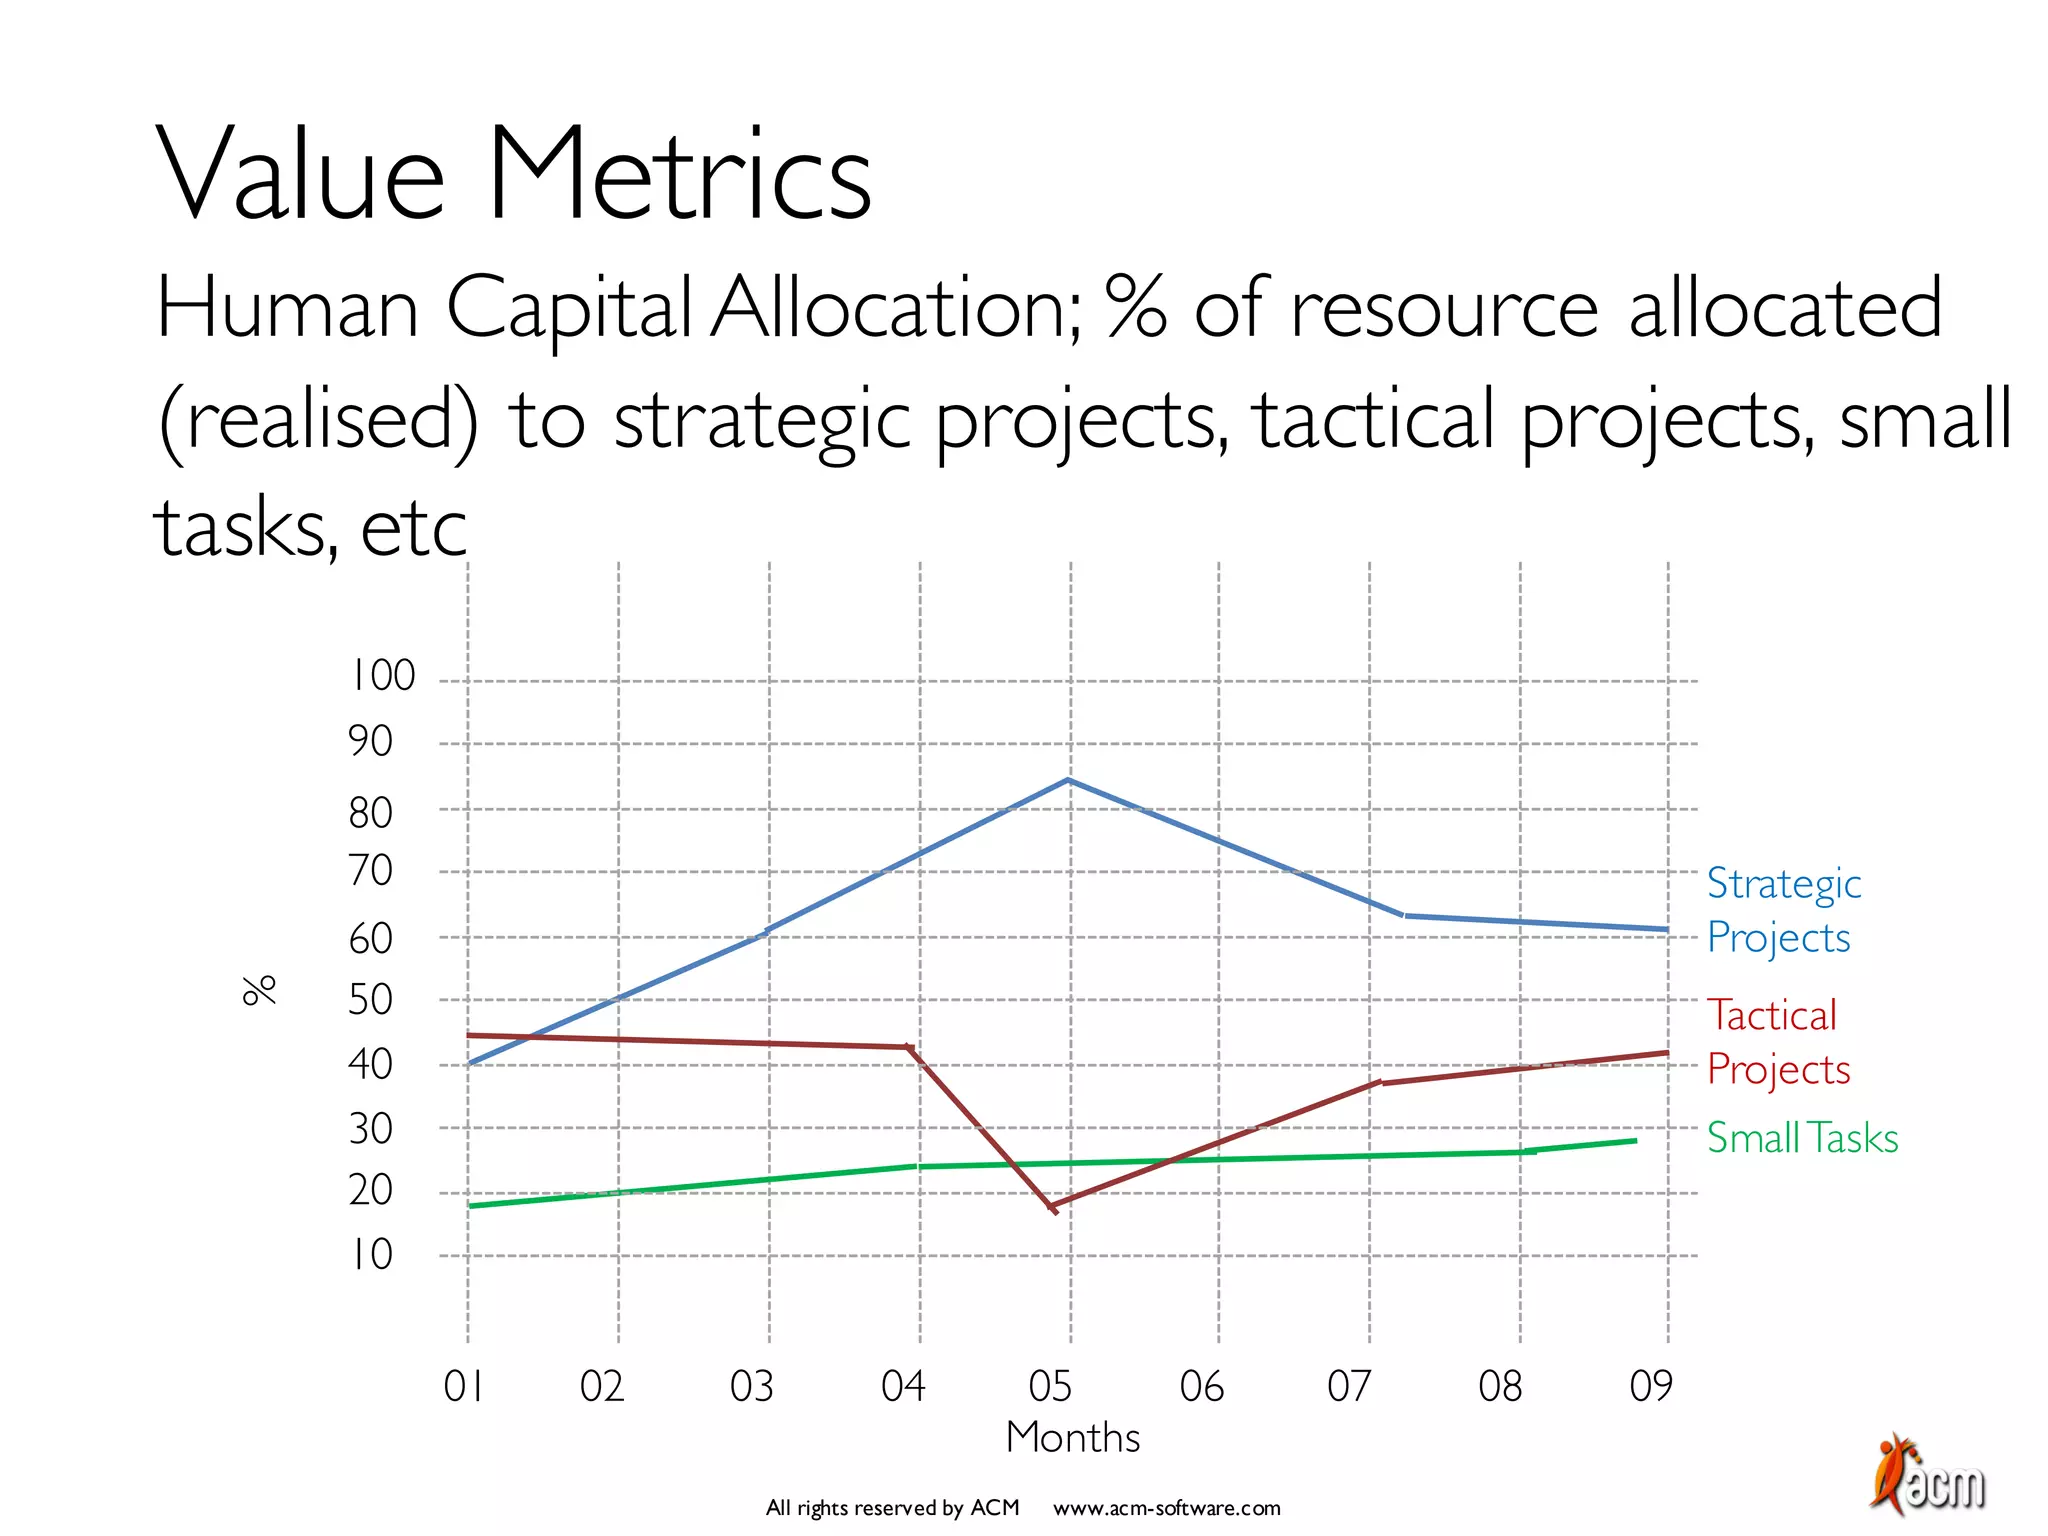
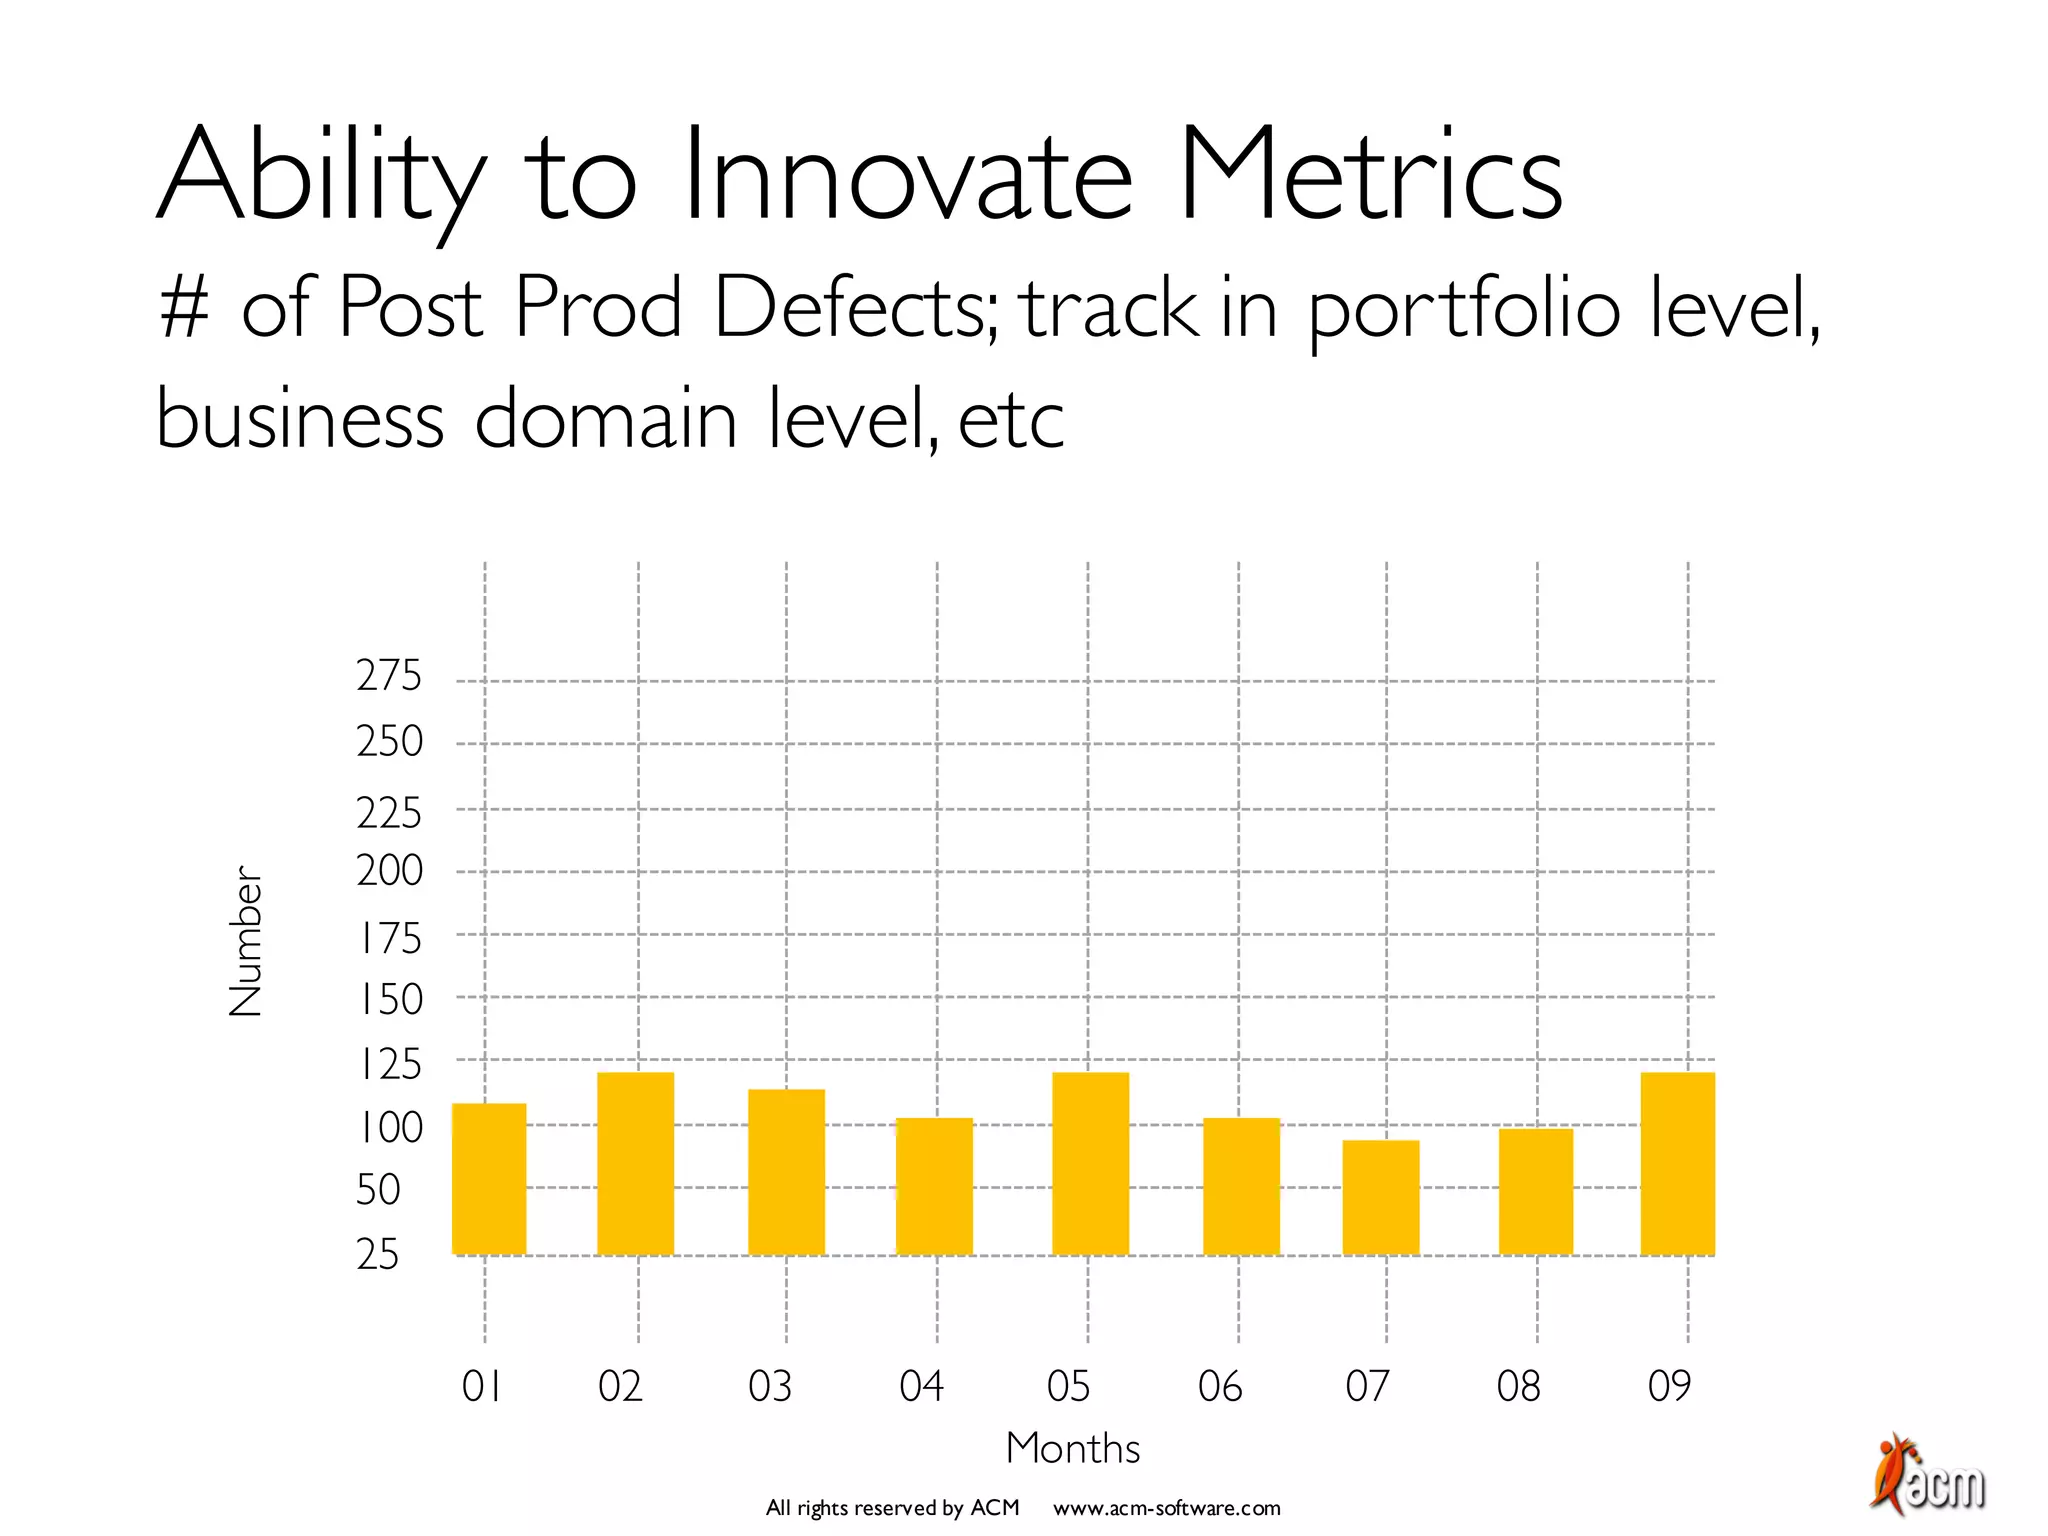
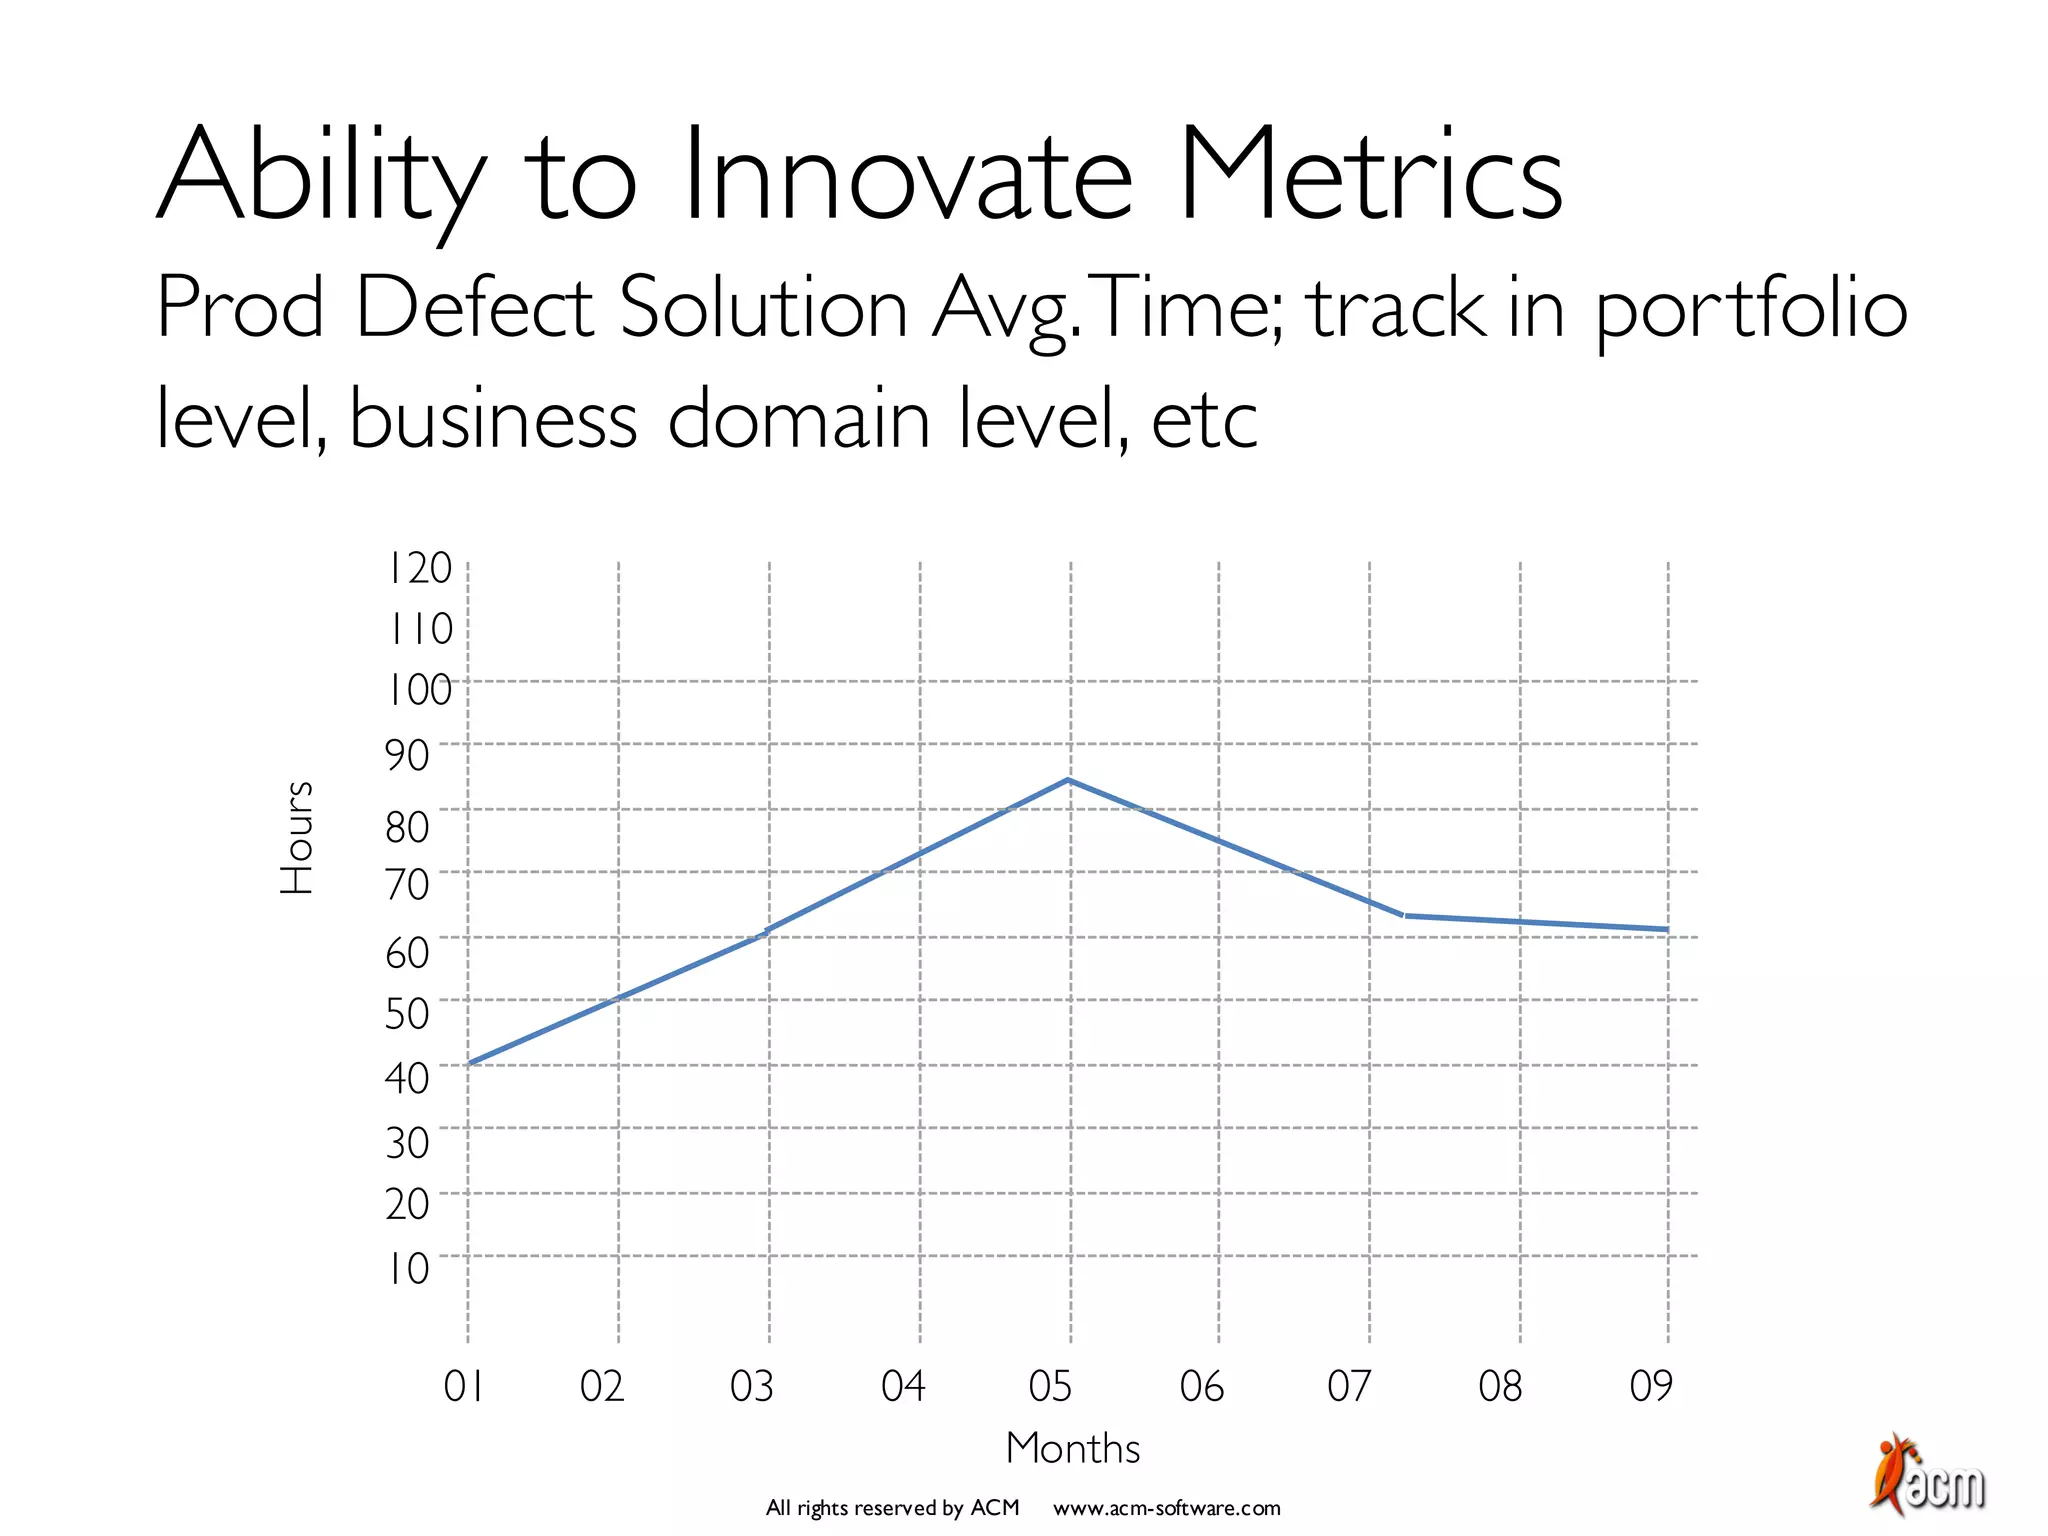
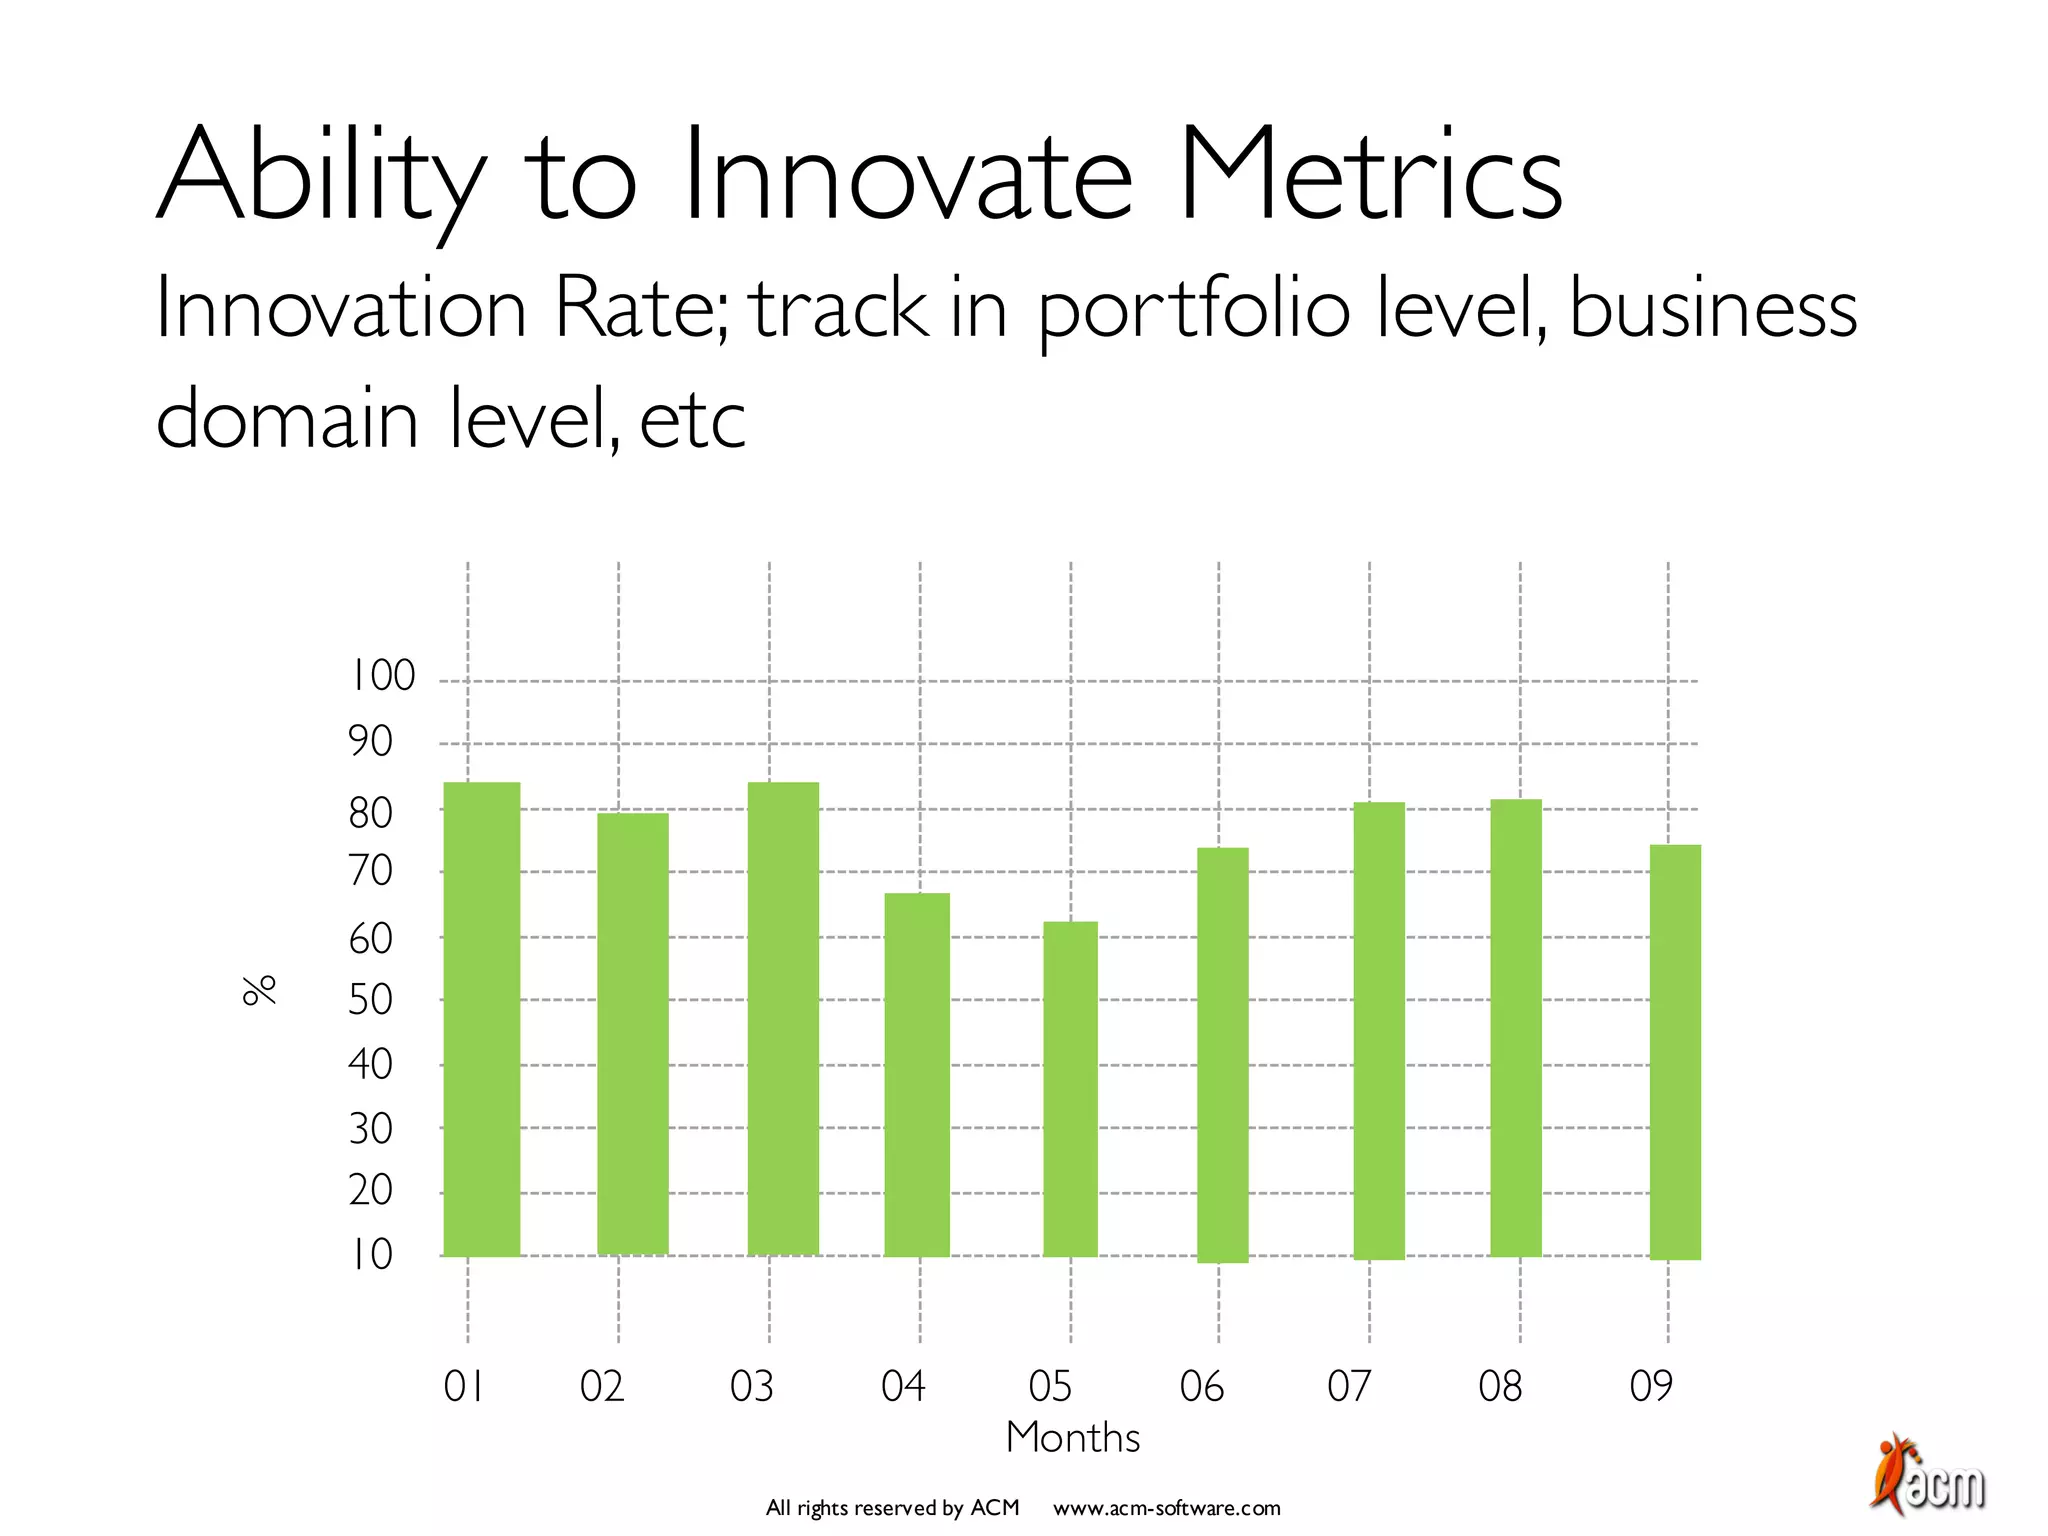
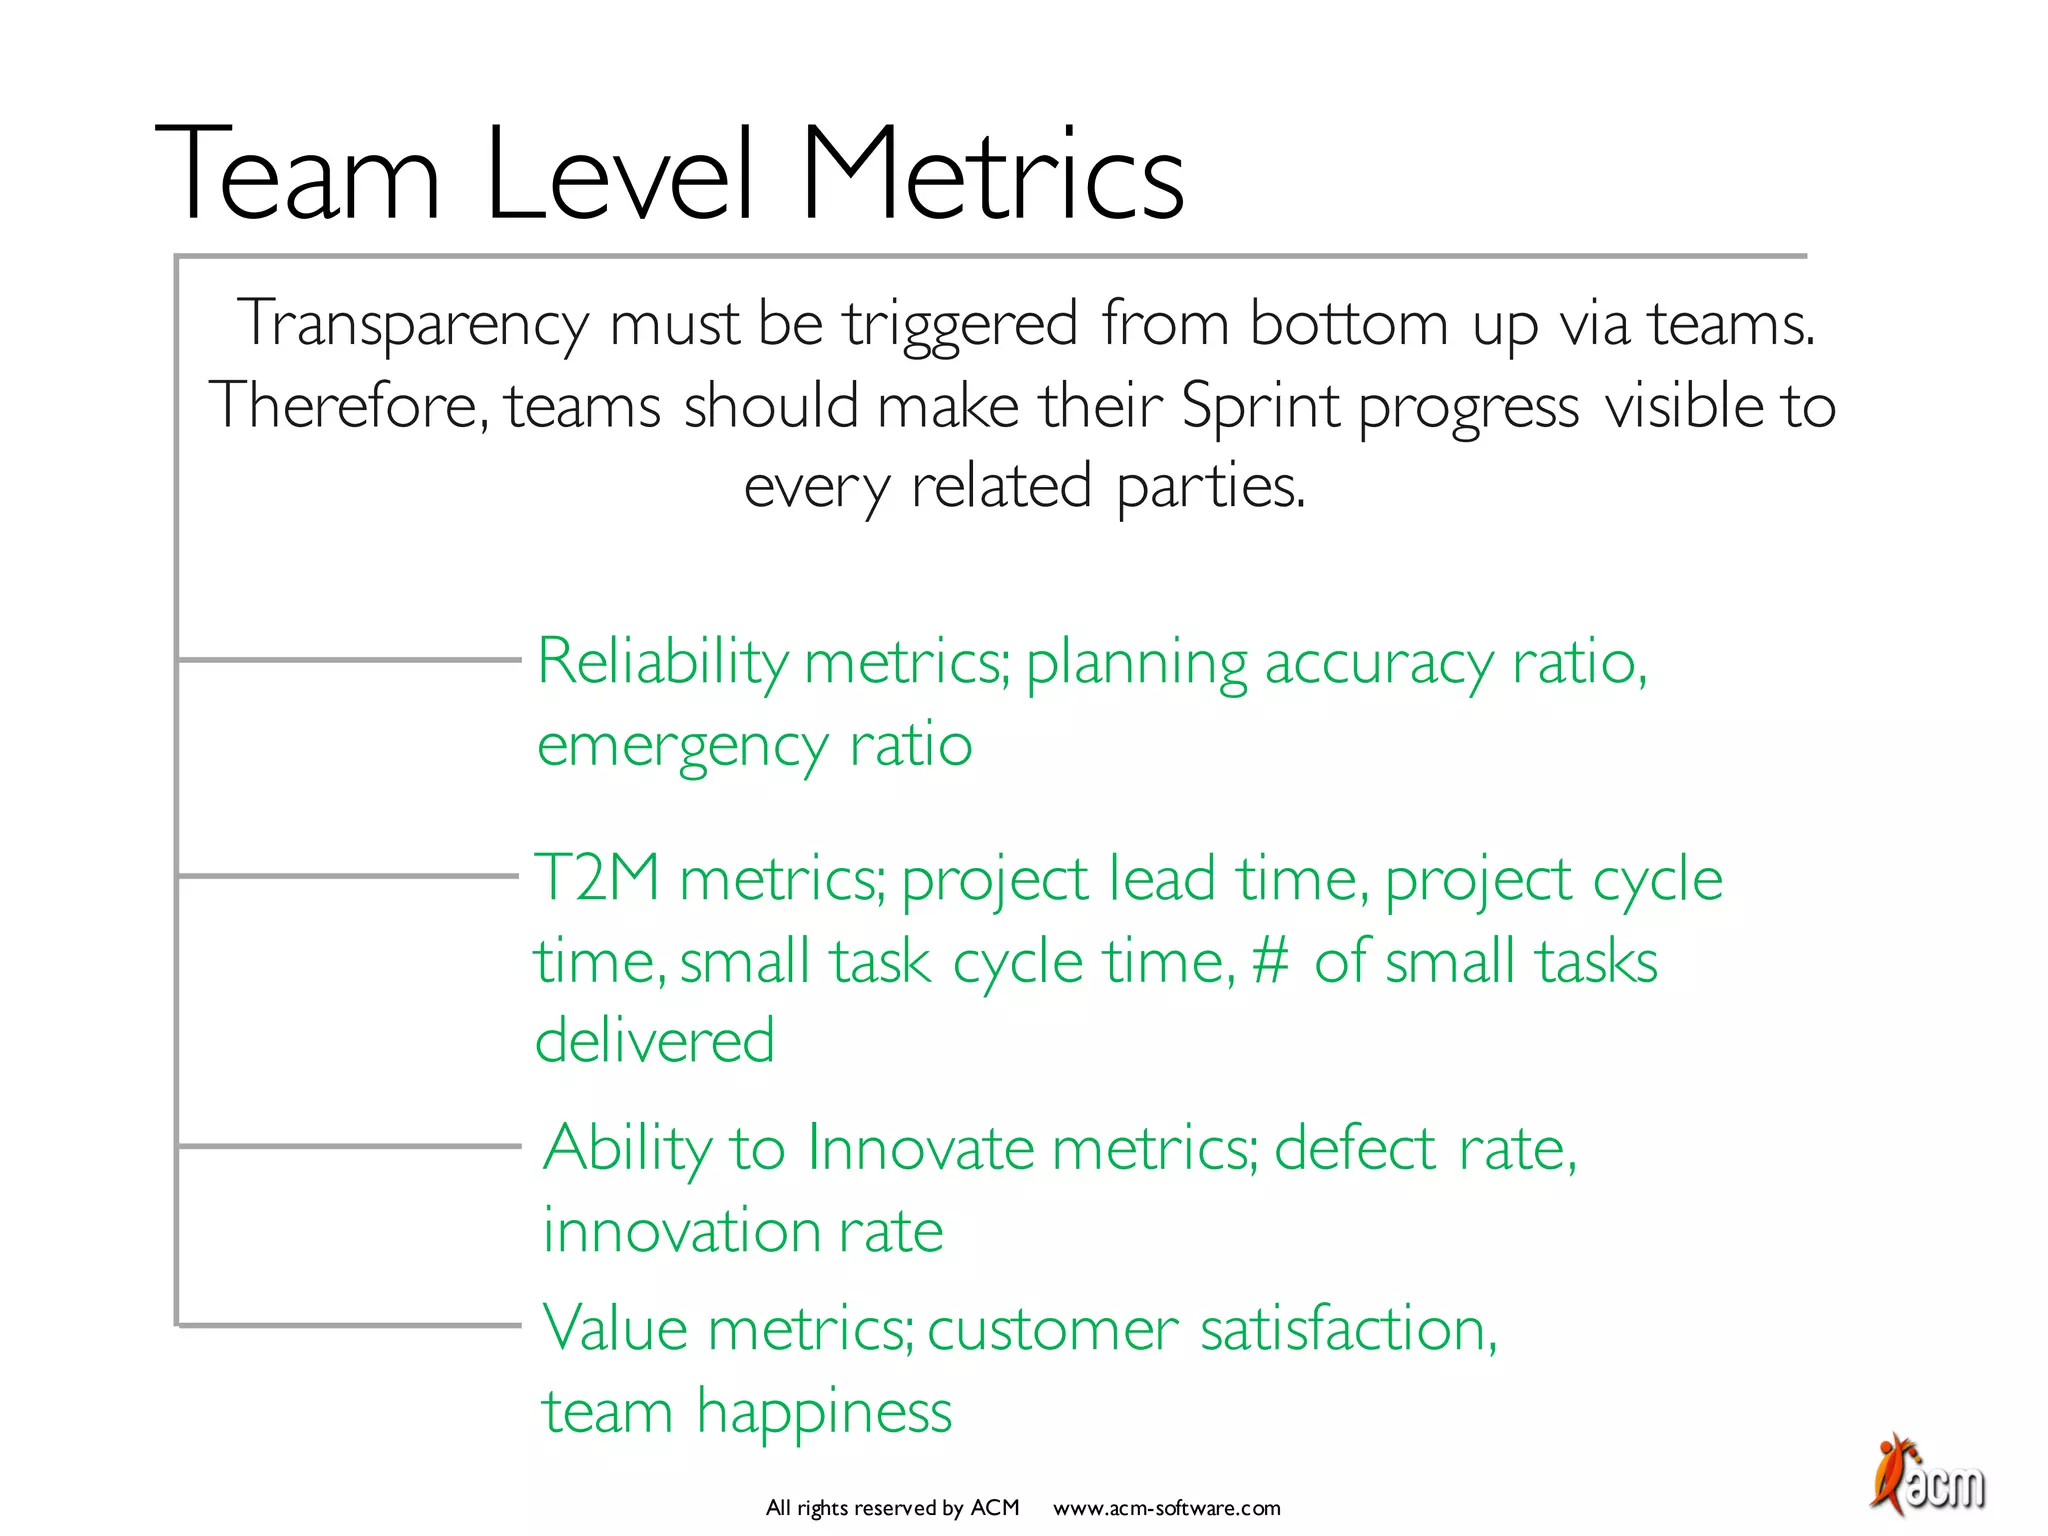
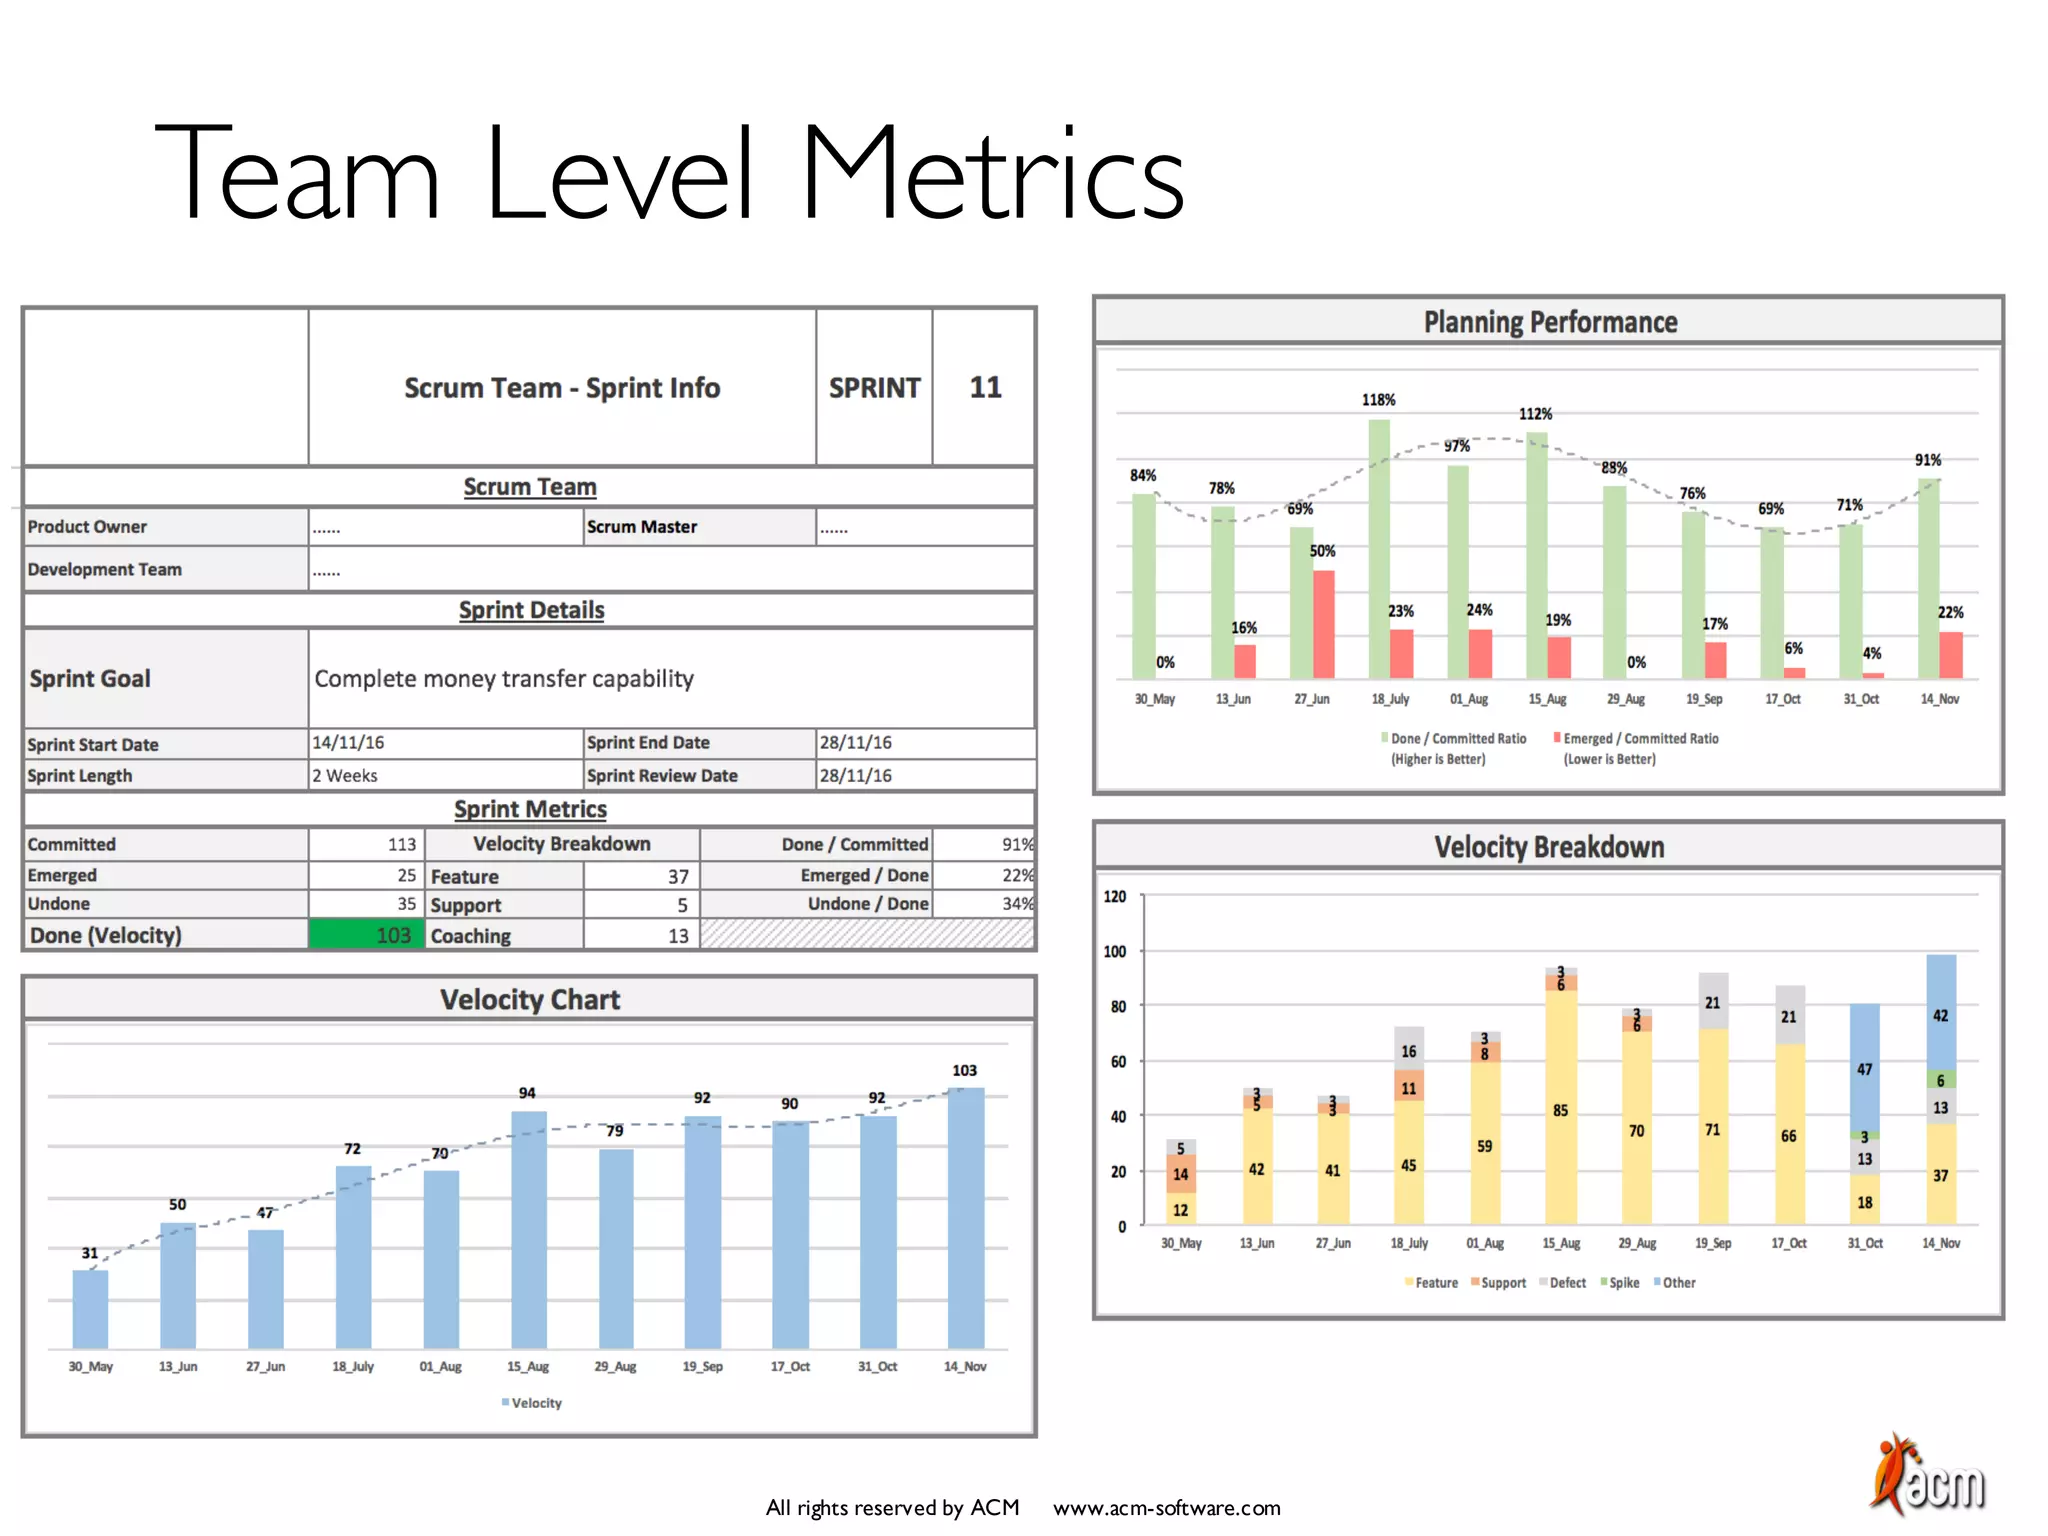
ORGANIZATIONAL AGILE METRICS
All rights reserved by ACM www.acm-software.com
www.acm-software.com
Agility Services Company
Not everything that counts can
be counted, and not everything
can be counted counts.
Albert Einstein
All rights reserved by ACM www.acm-software.com
Key Elements of Agile Metrics
§ Measure outcomes, not individual activity
§ Working software is the primary measure of progress
§ Our highest priority is to satisfy the customer through
early and continuous delivery of valuable software
§ Establish data driven decision making culture and trigger a
learning organization via high level of transparency
All rights reserved by ACM www.acm-software.com
Examples of Good & Bad Metrics
§ User Satisfaction
§ Revenue / Feature
§ Feature CycleTime
§ Post Production Defect Rate
§ % of Features Completed
§ Release Frequency
§ Lines of Code
§ Hours Worked
§ Number of Defects Found
In Development
All rights reserved by ACM www.acm-software.com
3 Levels For EnhancingVisibility
Organizational Level Metrics
Team Level Metrics
Team Performance
All rights reserved by ACM www.acm-software.com
Agile organizations need to use few, Lean metrics to watch their
overall health.These metrics needs to focus on three main areas:
time to market, value and innovation.
Organizational Level Metrics
Time to
Market
Ability to
Innovate
Value
All rights reserved by ACM www.acm-software.com
Time to Market Metrics
% of Completion; track completion in project level, epic
level, according to release plan, etc. In order to do so, use
Product Backlog Item level story point rolling estimations.
§ Closed § In Progress § Remaining
50 100 150 200 250 300 350 400 450 500
Call Center
Upgrade
Project
Cloud Call
Center
Project
Call Center
Automation
Story Points
All rights reserved by ACM www.acm-software.com
Time to Market Metrics
SmallTask & Project CycleTime (time between the start
date and production); track in portfolio level, business
domain level, etc
01 02 03 04 05 06 07 08 09
Months
Portfolio A avg
Portfolio B avg
Portfolio C avg
10
20
30
40
50
60
70
80
90
100
110
120
Days
All rights reserved by ACM www.acm-software.com
Time to Market Metrics
Project Lead Time (time between the request occurrence
date and production); track in portfolio level, business
domain level, etc
01 02 03 04 05 06 07 08 09
Months
Portfolio A avg
Portfolio B avg
Portfolio C avg
10
20
30
40
50
60
70
80
90
100
110
120
Days
All rights reserved by ACM www.acm-software.com
Time to Market Metrics
Project Flow (# of delivered projects, throughput); track in
portfolio level, business domain level, etc
01 02 03 04 05 06 07 08 09
25
50
100
125
150
175
200
225
250
275
Number
Months
All rights reserved by ACM www.acm-software.com
Time to Market Metrics
SmallTask Flow (# of delivered small tasks, throughput);
track in portfolio level, business domain level, etc
01 02 03 04 05 06 07 08 09
5
20
40
60
80
Number
Months
All rights reserved by ACM www.acm-software.com
Value Metrics
Human Capital Allocation; % of resource allocated
(realised) to strategic projects, tactical projects, small
tasks, etc
01 02 03 04 05 06 07 08 09
Strategic
Projects
Tactical
Projects
SmallTasks
10
20
30
40
50
60
70
80
90
100
%
Months
All rights reserved by ACM www.acm-software.com
Ability to Innovate Metrics
# of Post Prod Defects; track in portfolio level,
business domain level, etc
01 02 03 04 05 06 07 08 09
25
50
100
125
150
175
200
225
250
275
Number
Months
All rights reserved by ACM www.acm-software.com
Ability to Innovate Metrics
Prod Defect Solution Avg.Time; track in portfolio
level, business domain level, etc
Months
01 02 03 04 05 06 07 08 09
10
20
30
40
50
60
70
80
90
100
110
120
Hours
All rights reserved by ACM www.acm-software.com
Ability to Innovate Metrics
Innovation Rate; track in portfolio level, business
domain level, etc
01 02 03 04 05 06 07 08 09
10
20
30
40
50
60
70
80
90
%
Months
100
All rights reserved by ACM www.acm-software.com
Transparency must be triggered from bottom up via teams.
Therefore, teams should make their Sprint progress visible to
every related parties.
Team Level Metrics
Reliability metrics; planning accuracy ratio,
emergency ratio
Ability to Innovate metrics; defect rate,
innovation rate
Value metrics; customer satisfaction,
team happiness
T2M metrics; project lead time, project cycle
time, small task cycle time, # of small tasks
delivered
All rights reserved by ACM www.acm-software.com
Team Level Metrics
All rights reserved by ACM www.acm-software.com
Team PerformanceVisibility
Agile performance evaluation tends to enhance KAIZEN and
learning.Therefore, a team oriented performance enhancement
model should be developed that increases the transparency inside
the team and leads to a learning organization.
Method Weight Frequency Owner Supporter
Delivery Success
Component
Quantitative
Metrics 45% Bi Annually Team
Group Product
Leader
Teamwork Component
Kaizen
Achievement 15% Quarterly Team
Group Product
Leader
Self Development
Component
360 Degree
Feedback 20% Quarterly Team Agile Studio
Direct Report
Feedback 20% Bi Annually Team
Group Product
Leader
All rights reserved by ACM www.acm-software.com
BE AGILE,
STAY LEAN
www.acm-software.com
All rights reserved by ACM www.acm-software.com

Agile Performance Metrics

  • 1.
    ORGANIZATIONAL AGILE METRICS Allrights reserved by ACM www.acm-software.com www.acm-software.com Agility Services Company
  • 2.
    Not everything thatcounts can be counted, and not everything can be counted counts. Albert Einstein All rights reserved by ACM www.acm-software.com
  • 3.
    Key Elements ofAgile Metrics § Measure outcomes, not individual activity § Working software is the primary measure of progress § Our highest priority is to satisfy the customer through early and continuous delivery of valuable software § Establish data driven decision making culture and trigger a learning organization via high level of transparency All rights reserved by ACM www.acm-software.com
  • 4.
    Examples of Good& Bad Metrics § User Satisfaction § Revenue / Feature § Feature CycleTime § Post Production Defect Rate § % of Features Completed § Release Frequency § Lines of Code § Hours Worked § Number of Defects Found In Development All rights reserved by ACM www.acm-software.com
  • 5.
    3 Levels ForEnhancingVisibility Organizational Level Metrics Team Level Metrics Team Performance All rights reserved by ACM www.acm-software.com
  • 6.
    Agile organizations needto use few, Lean metrics to watch their overall health.These metrics needs to focus on three main areas: time to market, value and innovation. Organizational Level Metrics Time to Market Ability to Innovate Value All rights reserved by ACM www.acm-software.com
  • 7.
    Time to MarketMetrics % of Completion; track completion in project level, epic level, according to release plan, etc. In order to do so, use Product Backlog Item level story point rolling estimations. § Closed § In Progress § Remaining 50 100 150 200 250 300 350 400 450 500 Call Center Upgrade Project Cloud Call Center Project Call Center Automation Story Points All rights reserved by ACM www.acm-software.com
  • 8.
    Time to MarketMetrics SmallTask & Project CycleTime (time between the start date and production); track in portfolio level, business domain level, etc 01 02 03 04 05 06 07 08 09 Months Portfolio A avg Portfolio B avg Portfolio C avg 10 20 30 40 50 60 70 80 90 100 110 120 Days All rights reserved by ACM www.acm-software.com
  • 9.
    Time to MarketMetrics Project Lead Time (time between the request occurrence date and production); track in portfolio level, business domain level, etc 01 02 03 04 05 06 07 08 09 Months Portfolio A avg Portfolio B avg Portfolio C avg 10 20 30 40 50 60 70 80 90 100 110 120 Days All rights reserved by ACM www.acm-software.com
  • 10.
    Time to MarketMetrics Project Flow (# of delivered projects, throughput); track in portfolio level, business domain level, etc 01 02 03 04 05 06 07 08 09 25 50 100 125 150 175 200 225 250 275 Number Months All rights reserved by ACM www.acm-software.com
  • 11.
    Time to MarketMetrics SmallTask Flow (# of delivered small tasks, throughput); track in portfolio level, business domain level, etc 01 02 03 04 05 06 07 08 09 5 20 40 60 80 Number Months All rights reserved by ACM www.acm-software.com
  • 12.
    Value Metrics Human CapitalAllocation; % of resource allocated (realised) to strategic projects, tactical projects, small tasks, etc 01 02 03 04 05 06 07 08 09 Strategic Projects Tactical Projects SmallTasks 10 20 30 40 50 60 70 80 90 100 % Months All rights reserved by ACM www.acm-software.com
  • 13.
    Ability to InnovateMetrics # of Post Prod Defects; track in portfolio level, business domain level, etc 01 02 03 04 05 06 07 08 09 25 50 100 125 150 175 200 225 250 275 Number Months All rights reserved by ACM www.acm-software.com
  • 14.
    Ability to InnovateMetrics Prod Defect Solution Avg.Time; track in portfolio level, business domain level, etc Months 01 02 03 04 05 06 07 08 09 10 20 30 40 50 60 70 80 90 100 110 120 Hours All rights reserved by ACM www.acm-software.com
  • 15.
    Ability to InnovateMetrics Innovation Rate; track in portfolio level, business domain level, etc 01 02 03 04 05 06 07 08 09 10 20 30 40 50 60 70 80 90 % Months 100 All rights reserved by ACM www.acm-software.com
  • 16.
    Transparency must betriggered from bottom up via teams. Therefore, teams should make their Sprint progress visible to every related parties. Team Level Metrics Reliability metrics; planning accuracy ratio, emergency ratio Ability to Innovate metrics; defect rate, innovation rate Value metrics; customer satisfaction, team happiness T2M metrics; project lead time, project cycle time, small task cycle time, # of small tasks delivered All rights reserved by ACM www.acm-software.com
  • 17.
    Team Level Metrics Allrights reserved by ACM www.acm-software.com
  • 18.
    Team PerformanceVisibility Agile performanceevaluation tends to enhance KAIZEN and learning.Therefore, a team oriented performance enhancement model should be developed that increases the transparency inside the team and leads to a learning organization. Method Weight Frequency Owner Supporter Delivery Success Component Quantitative Metrics 45% Bi Annually Team Group Product Leader Teamwork Component Kaizen Achievement 15% Quarterly Team Group Product Leader Self Development Component 360 Degree Feedback 20% Quarterly Team Agile Studio Direct Report Feedback 20% Bi Annually Team Group Product Leader All rights reserved by ACM www.acm-software.com
  • 19.
    BE AGILE, STAY LEAN www.acm-software.com Allrights reserved by ACM www.acm-software.com