Download as PDF, PPTX


![What to consider for agile metrics
VersionOne, Inc. [CC-BY-SA-3.0 (http://creativecommons.org/licenses/by-sa/3.0)], via Wikimedia Commons
5
5Montag, 22. April 13](https://image.slidesharecdn.com/agilemetrics-150724041642-lva1-app6892/75/Agile-metrics-5-2048.jpg)


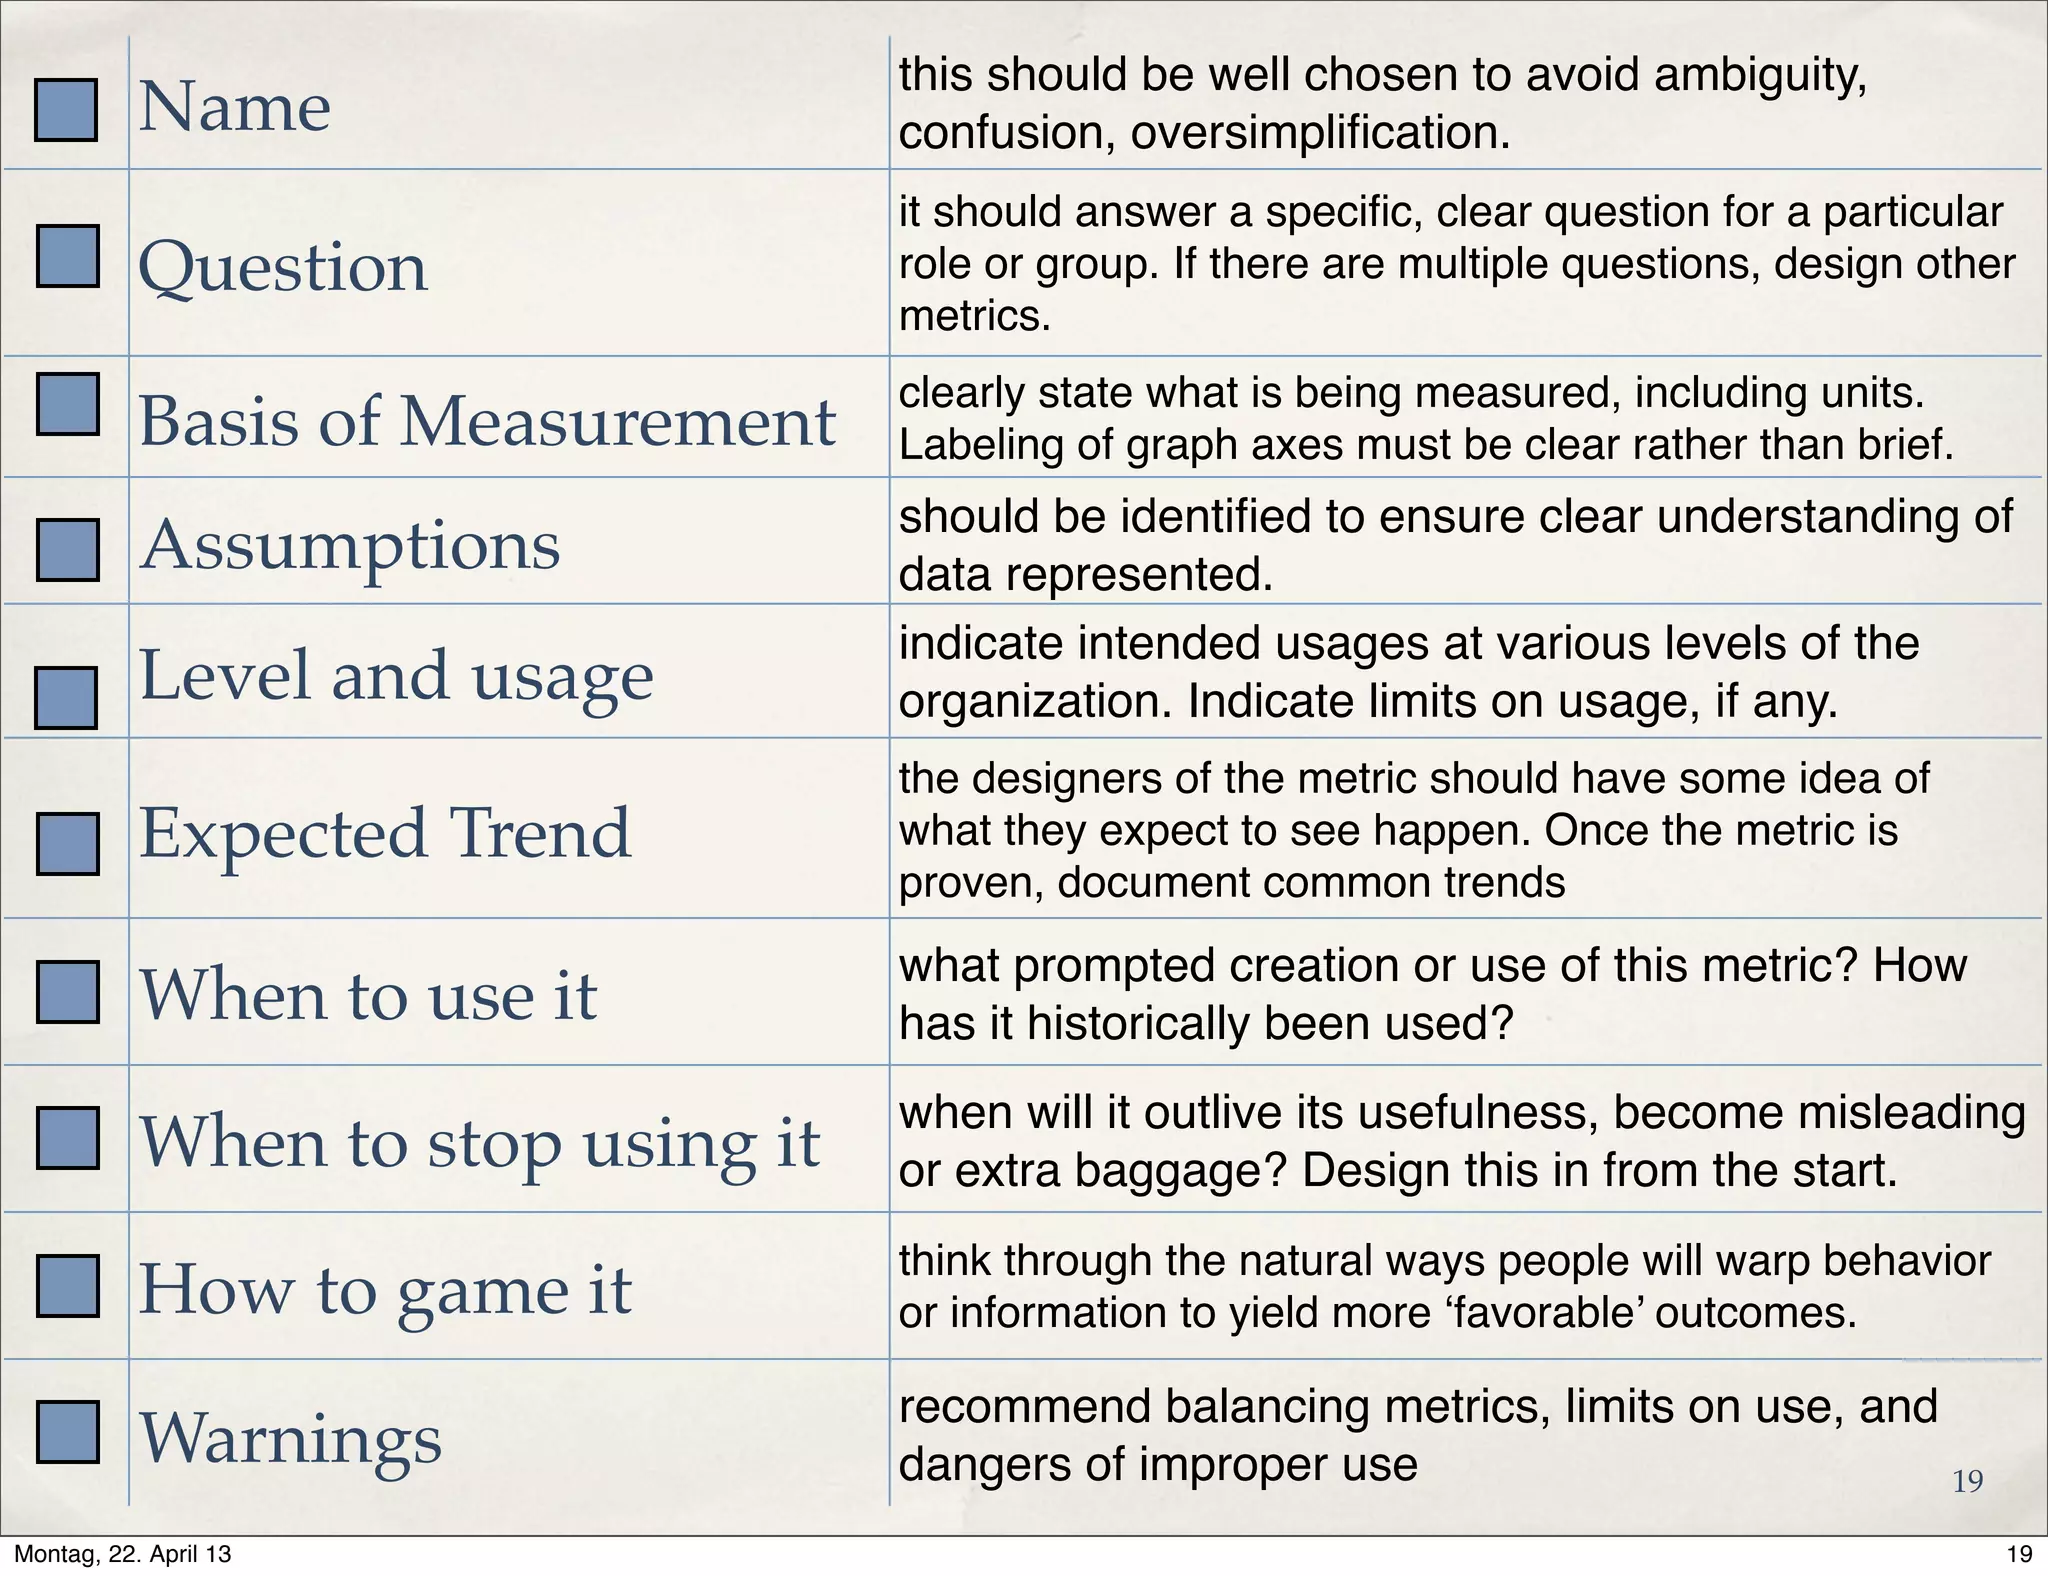
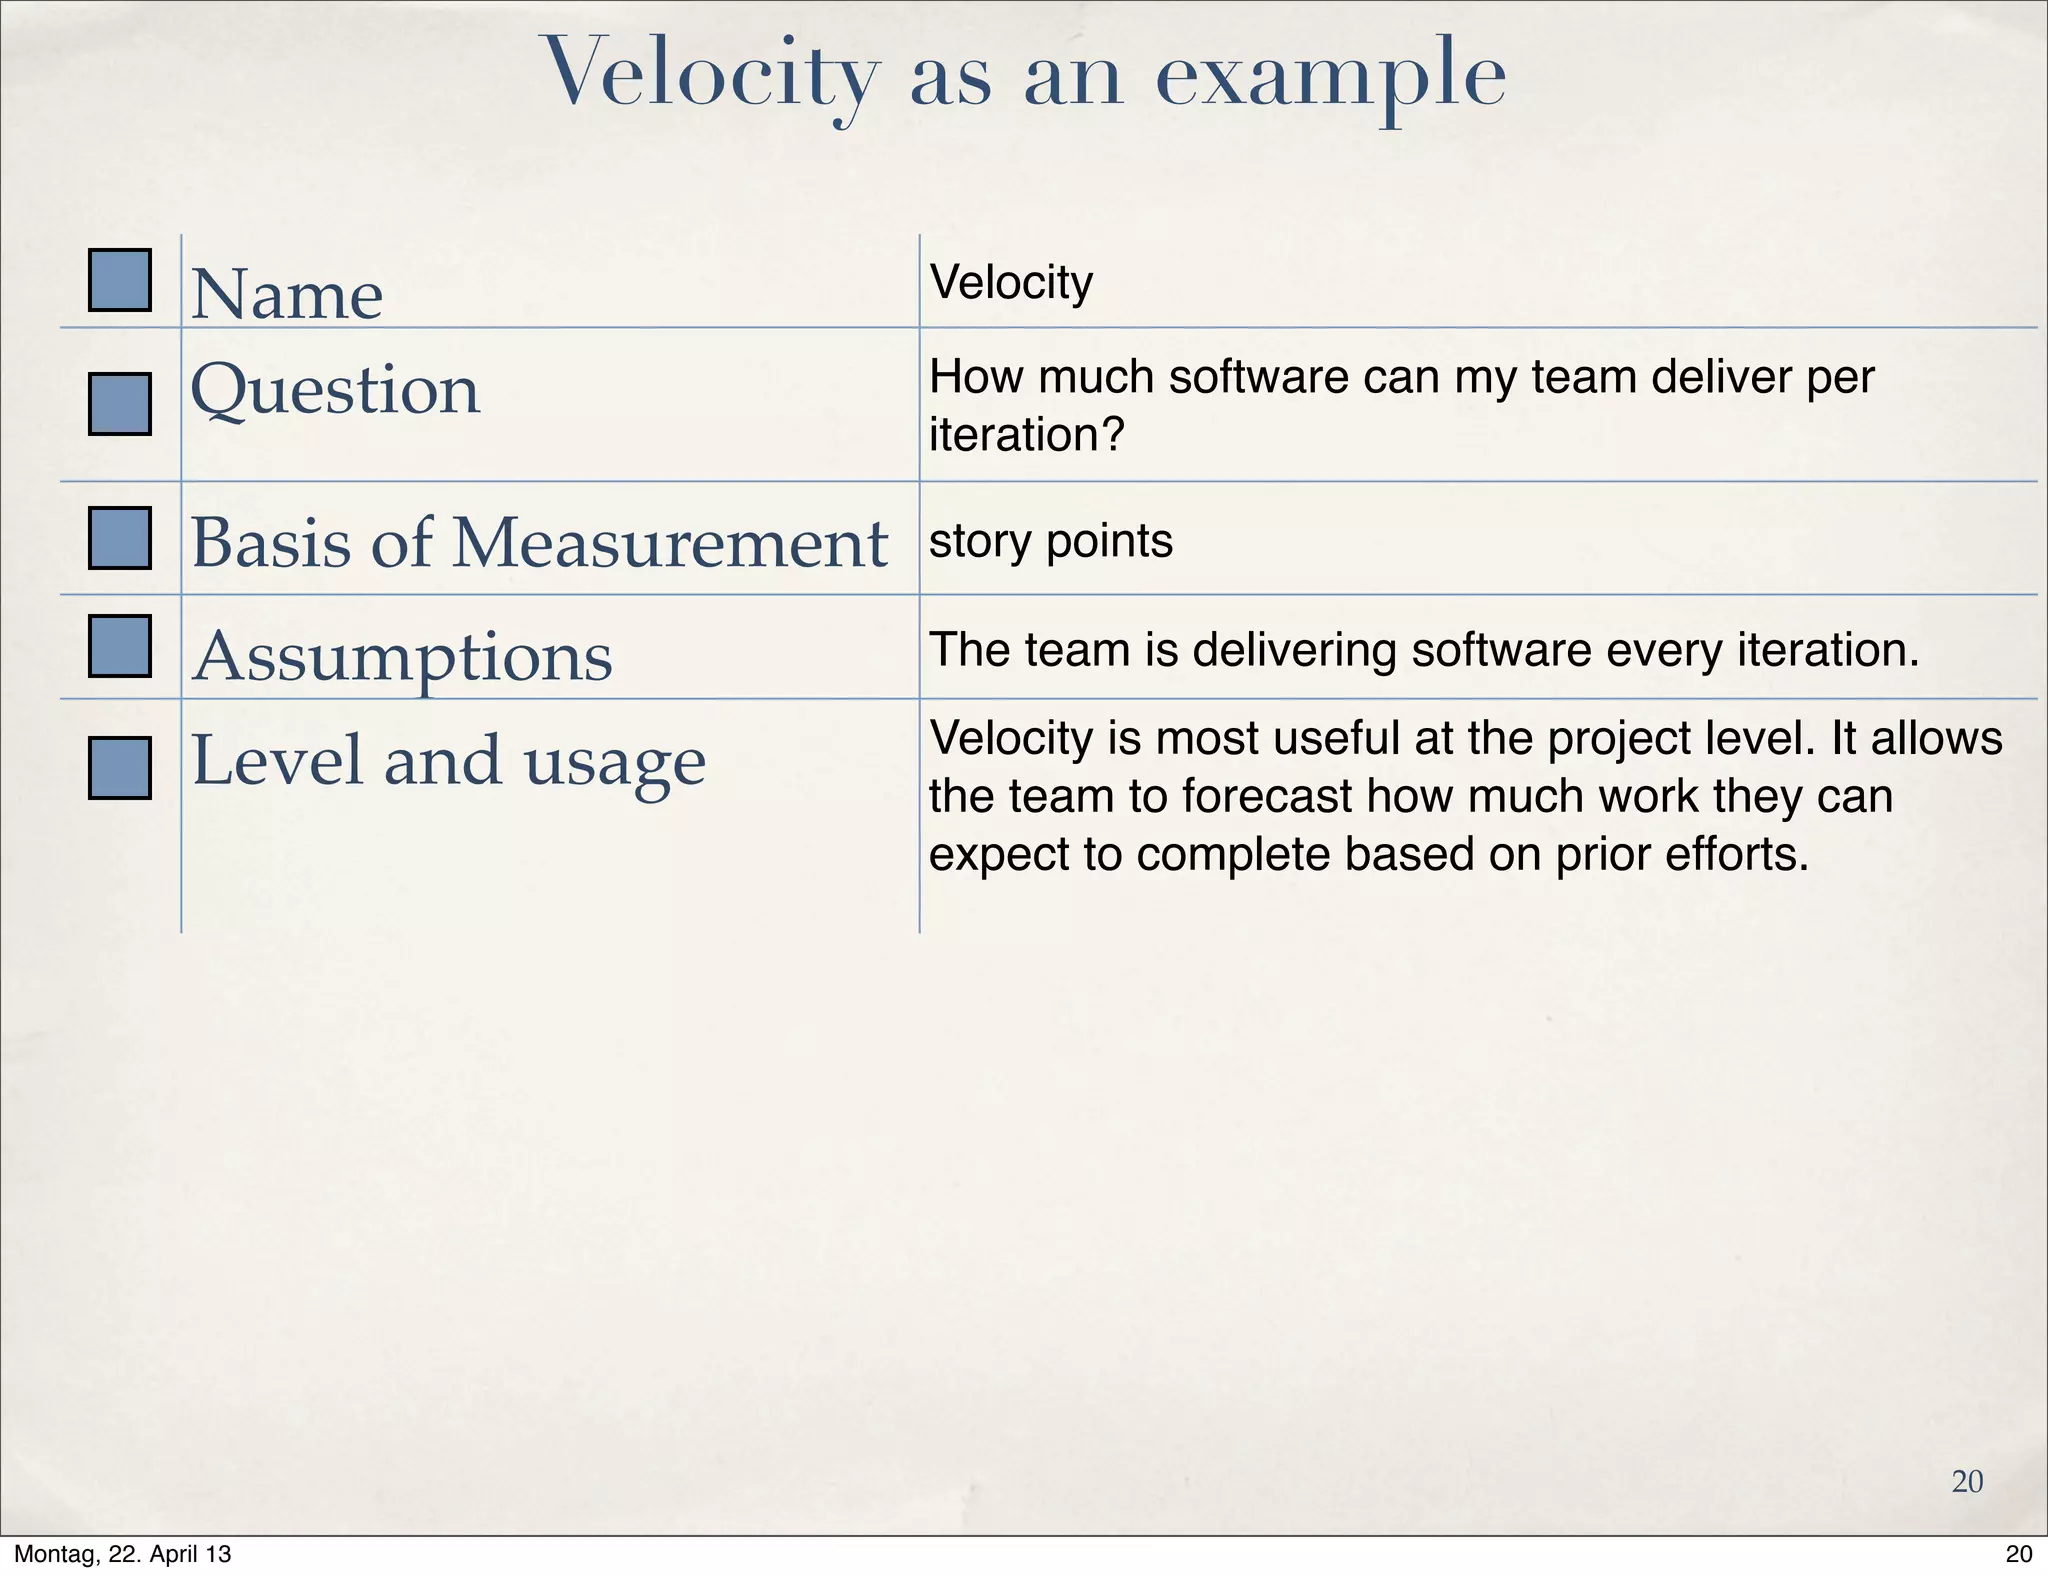
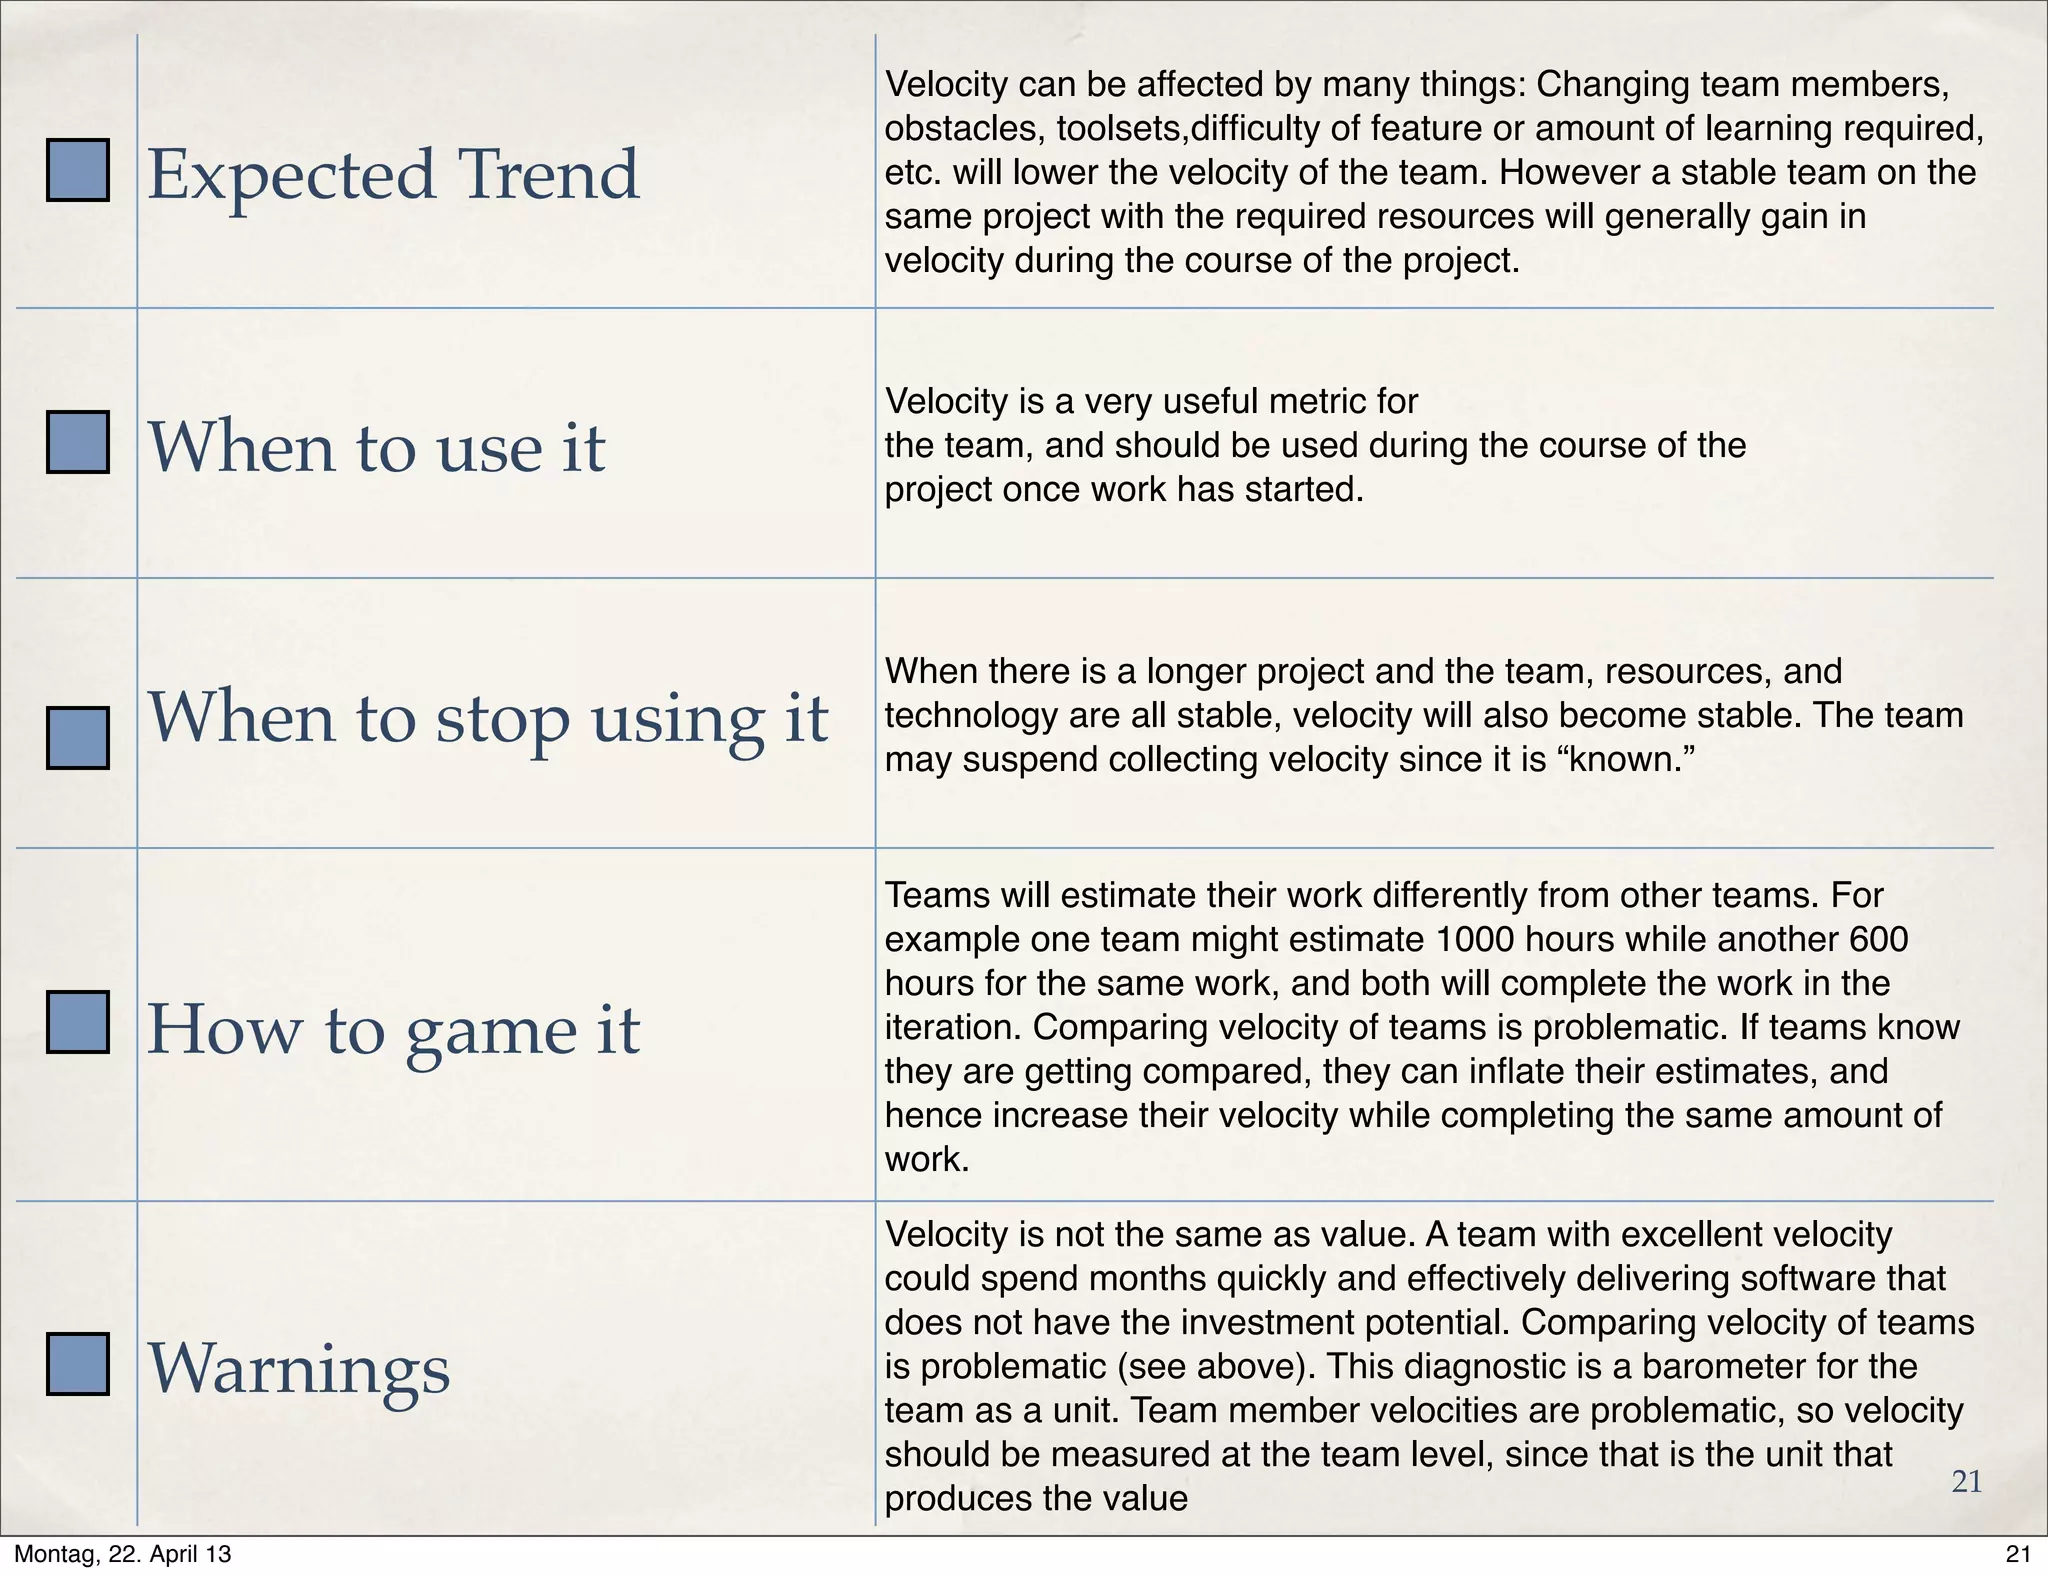


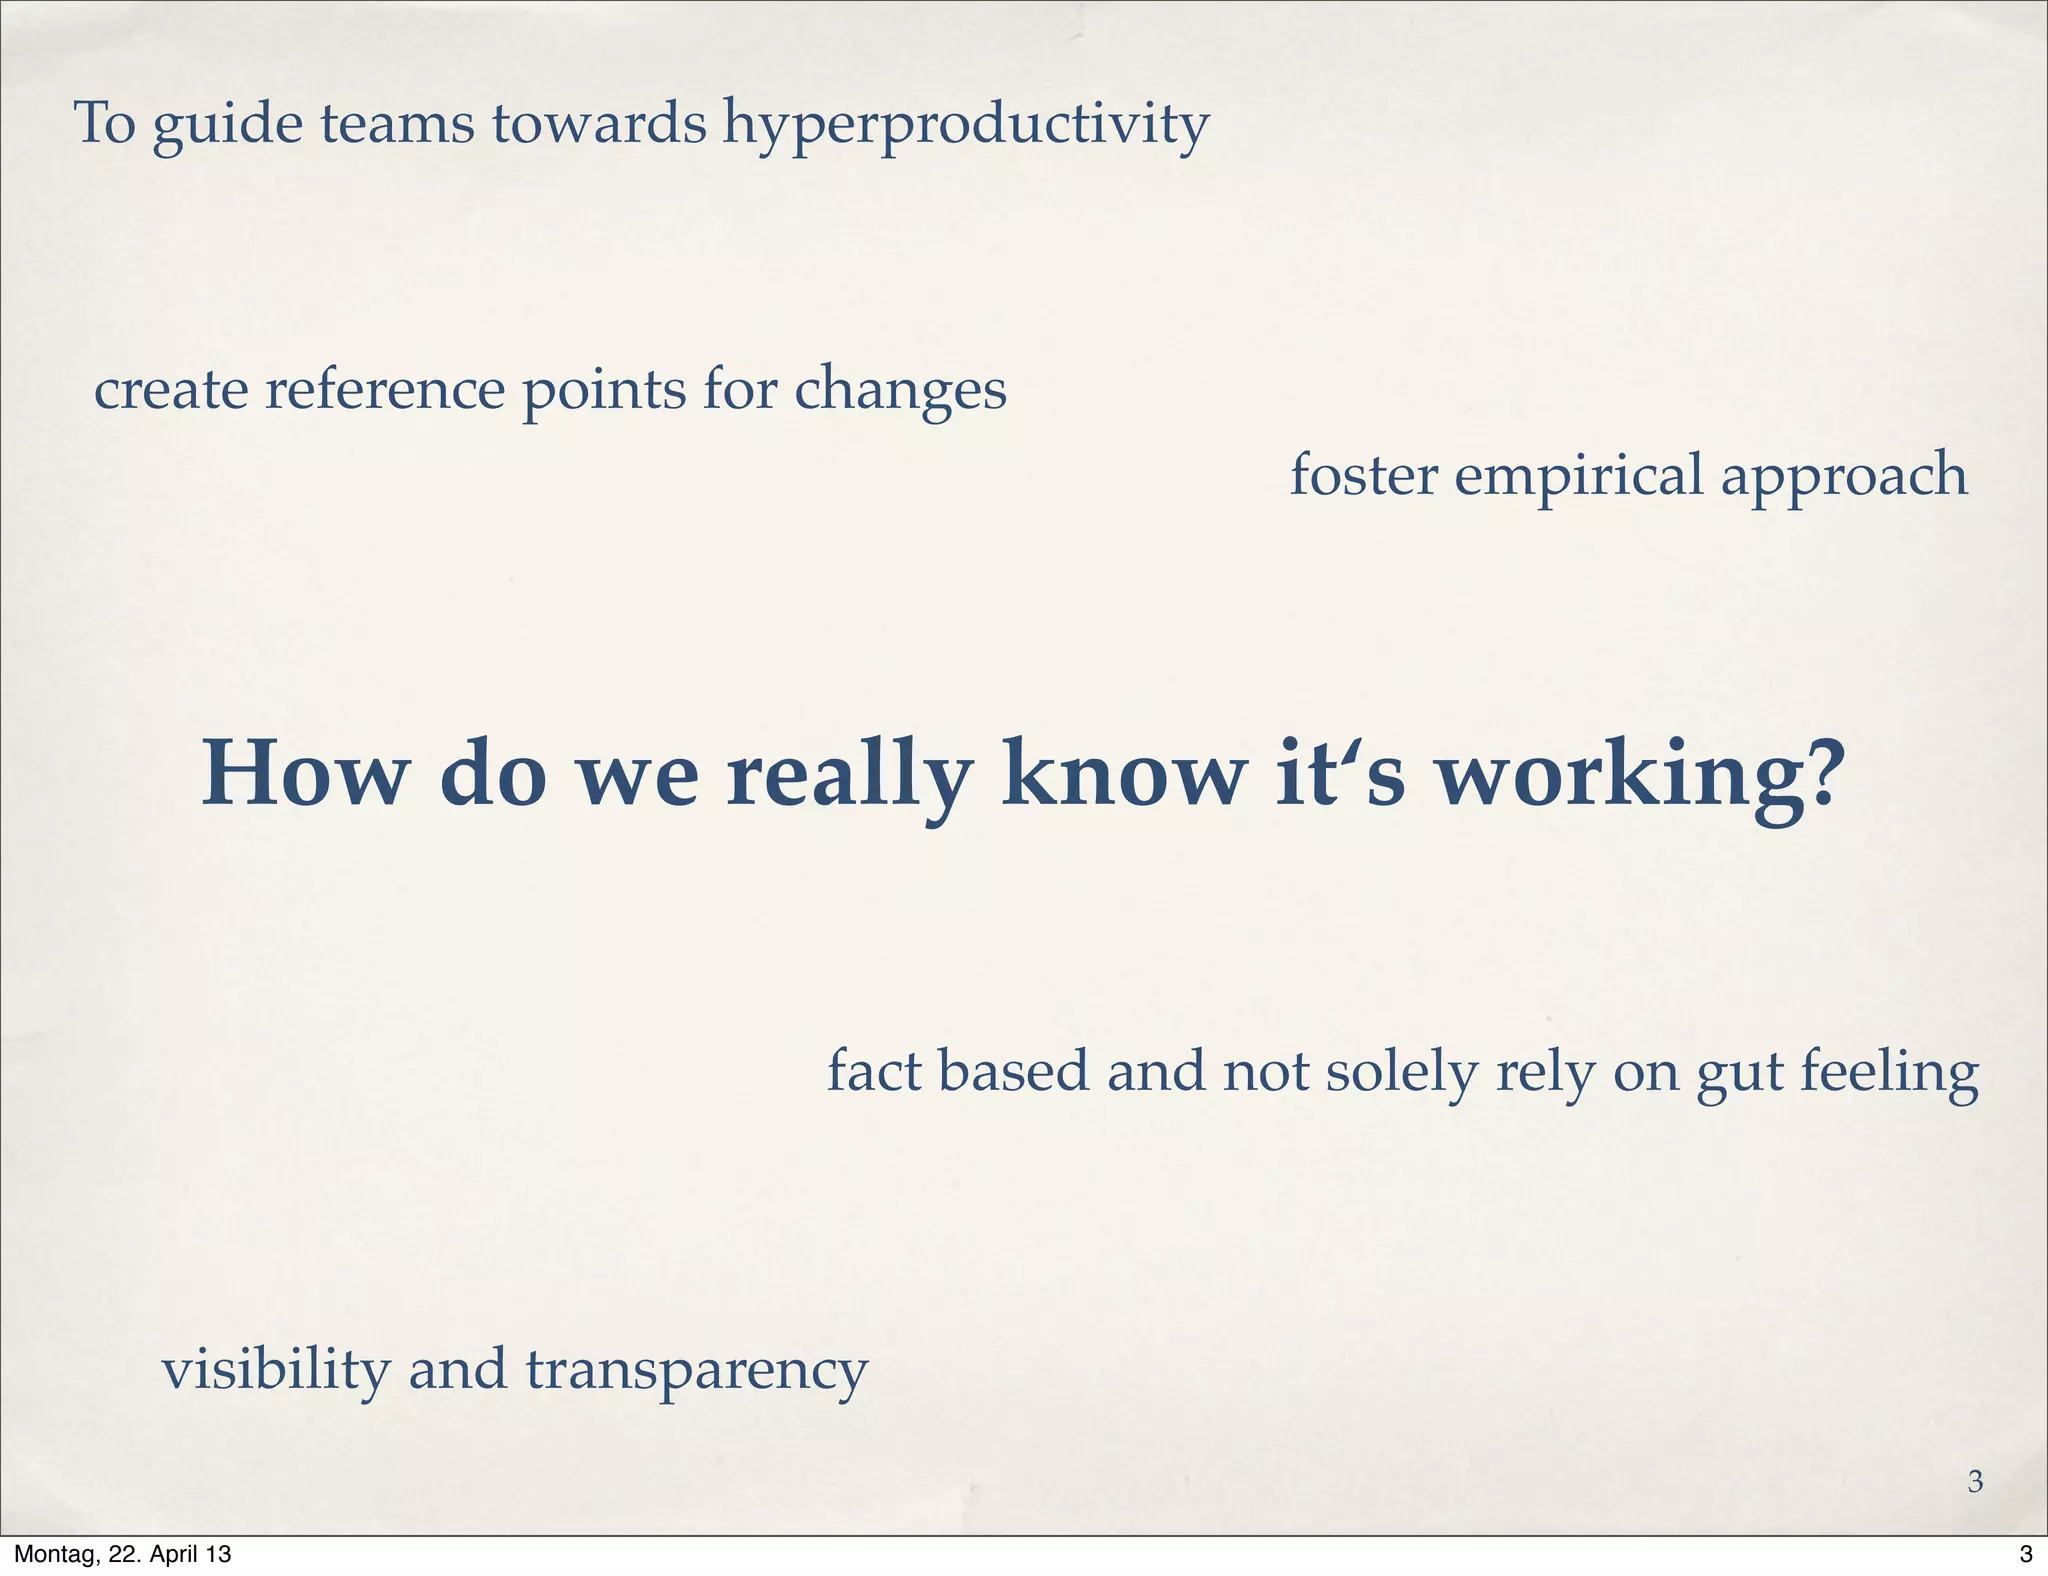
The document discusses the importance of agile metrics in guiding teams toward hyperproductivity and creating a fact-based approach for measuring progress. It emphasizes on the need for well-structured metrics that follow lean and agile principles while providing diagnostic insights to improve software delivery. Various examples of metrics, along with considerations for their design and usage, are presented to ensure they align with organizational goals and foster teamwork.