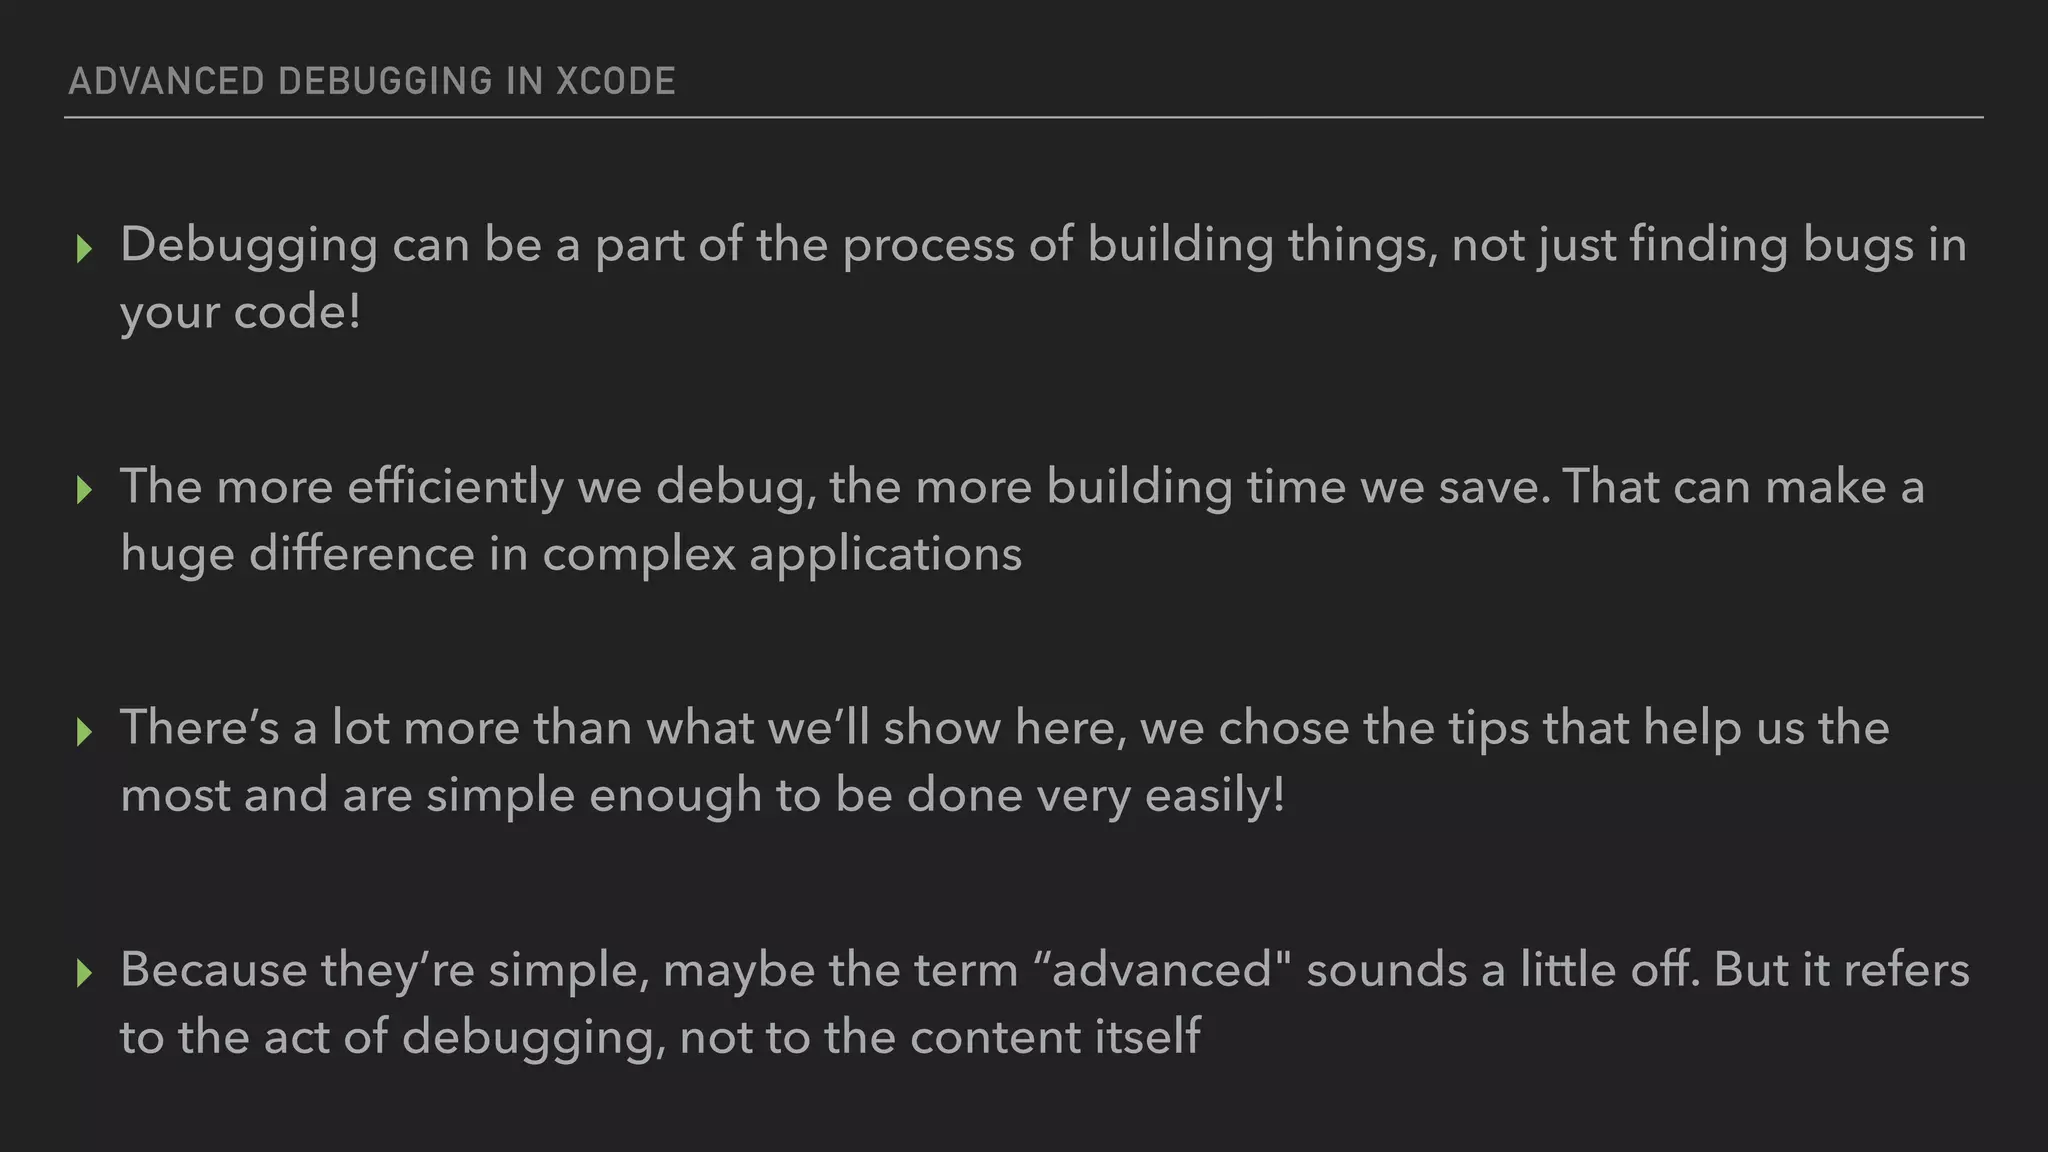
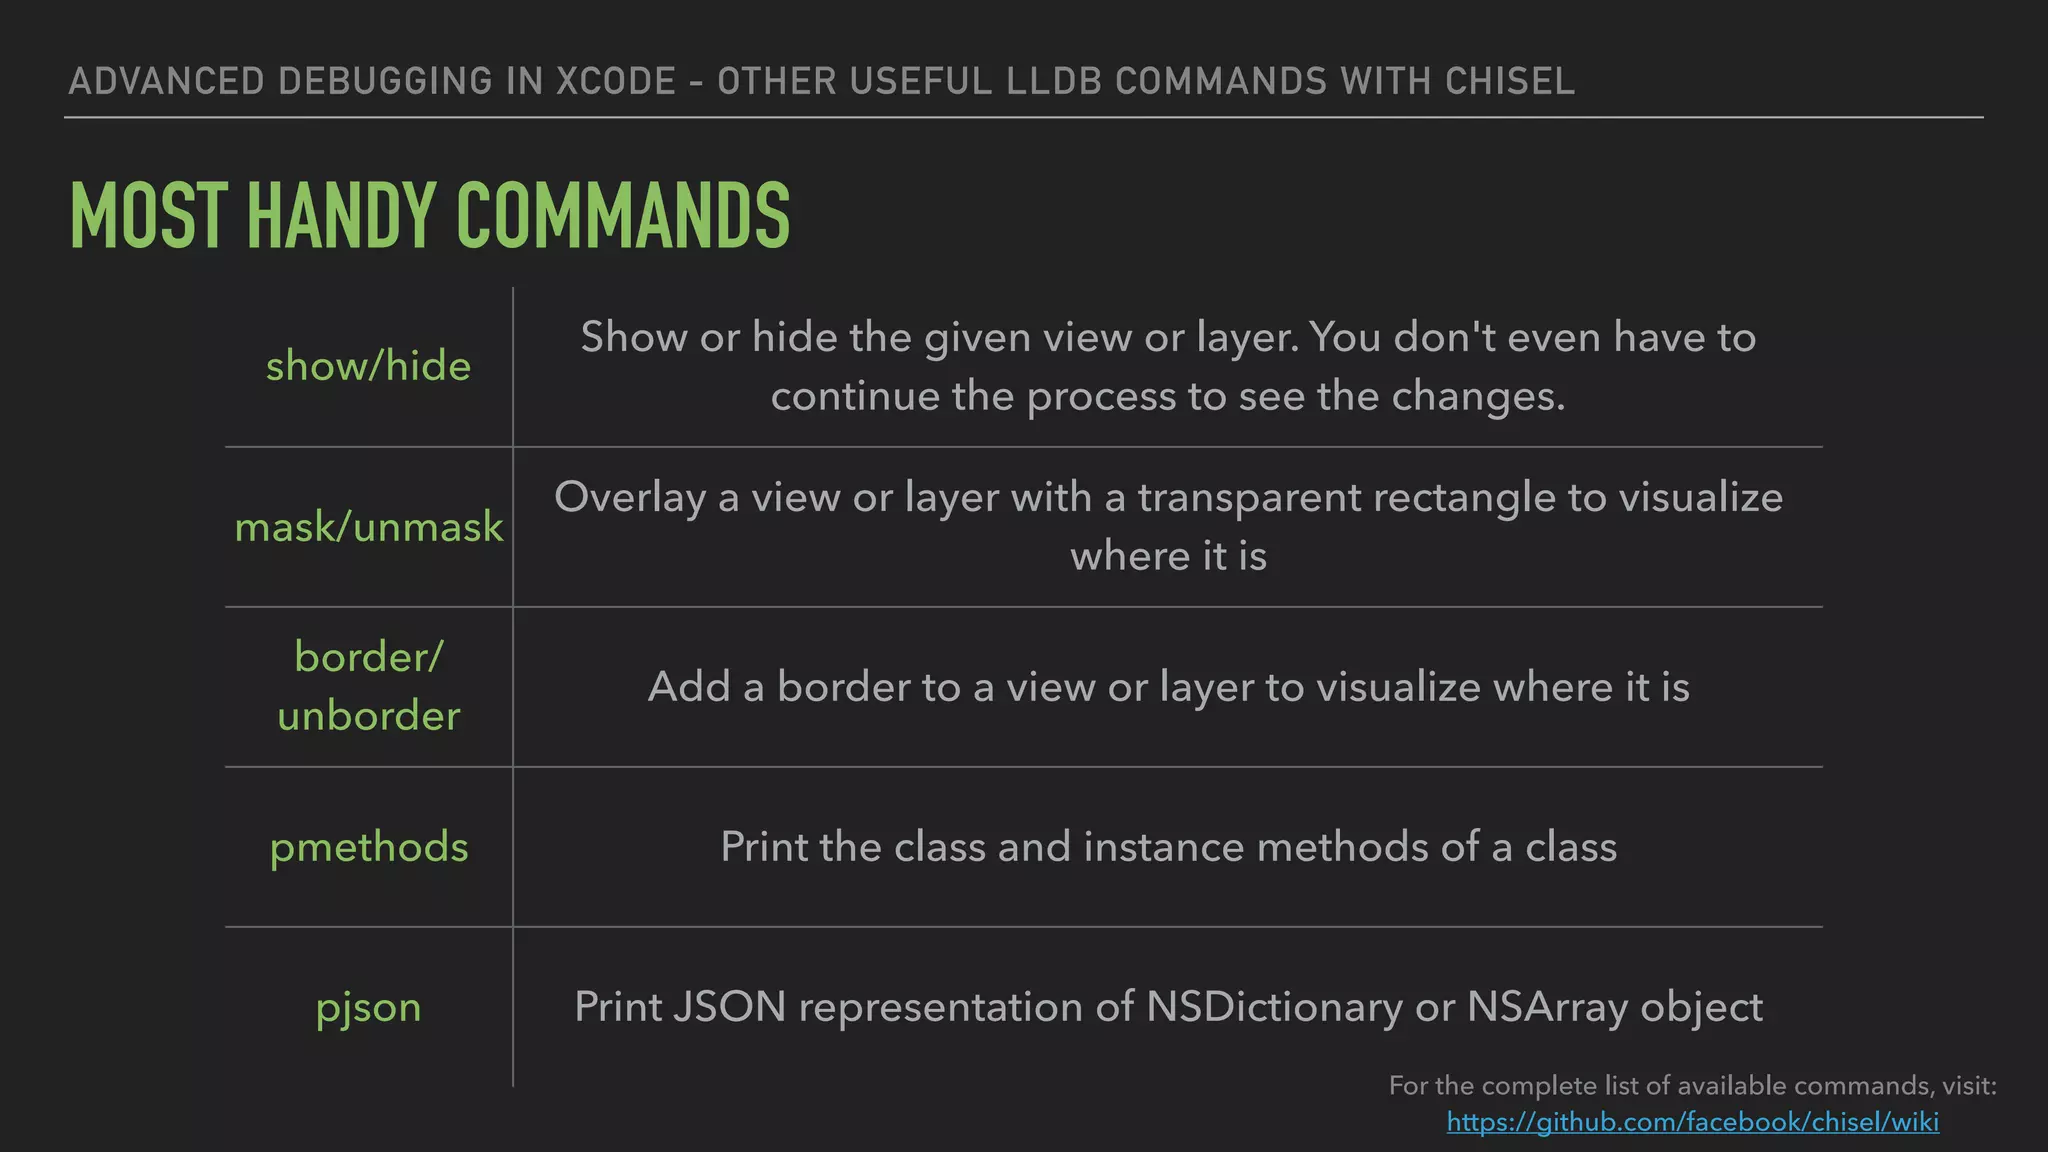
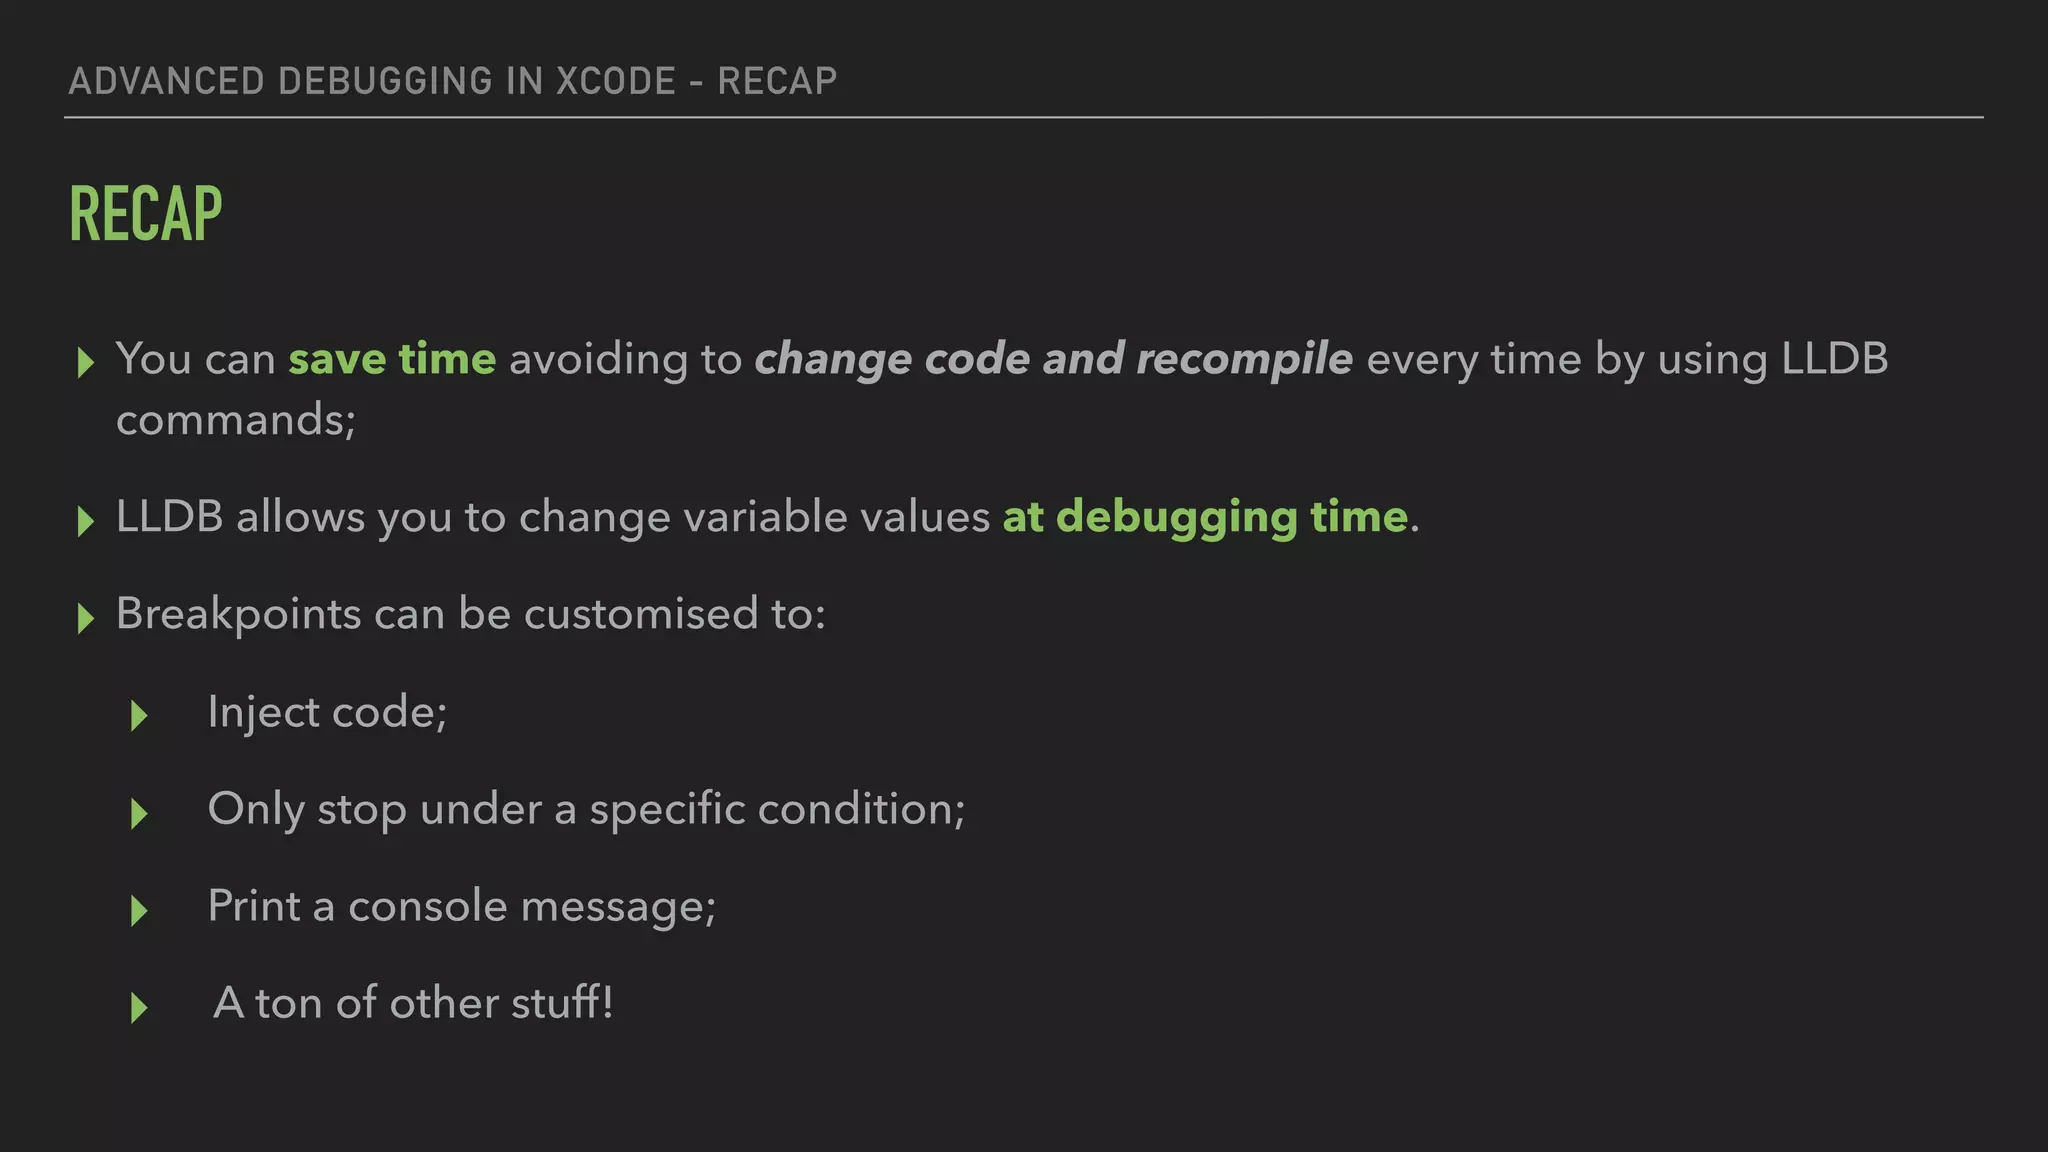
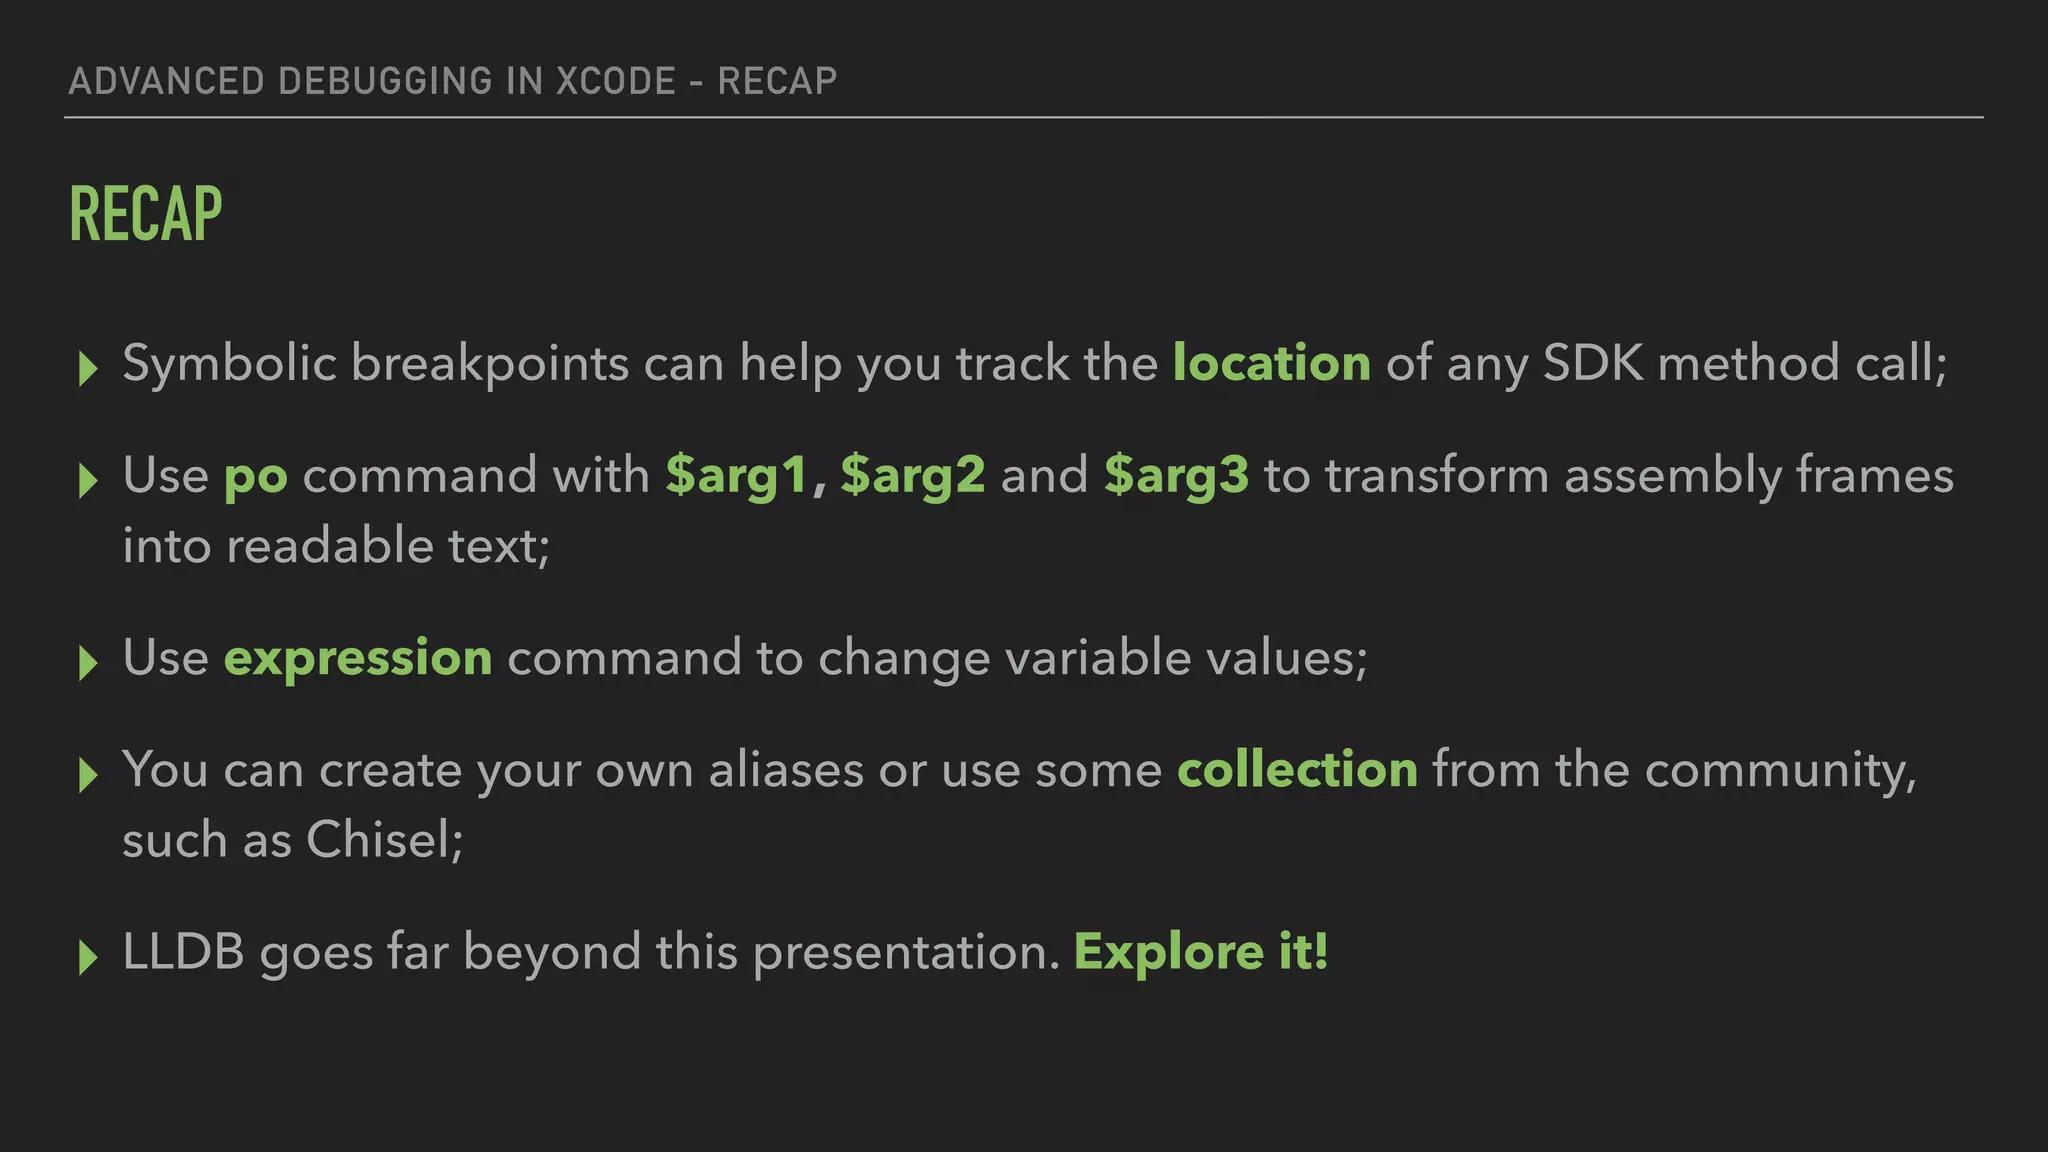
The document provides an overview of advanced debugging techniques in Xcode, focusing on efficient methods that save building time in complex applications. Key topics include changing code during runtime, using symbolic and conditional breakpoints, and utilizing LLDB commands. It emphasizes the potential of debuggers beyond just finding bugs, highlighting tools like Chisel for enhanced debugging capabilities.


![ADVANCED DEBUGGING IN XCODE - SYMBOLIC BREAKPOINTS
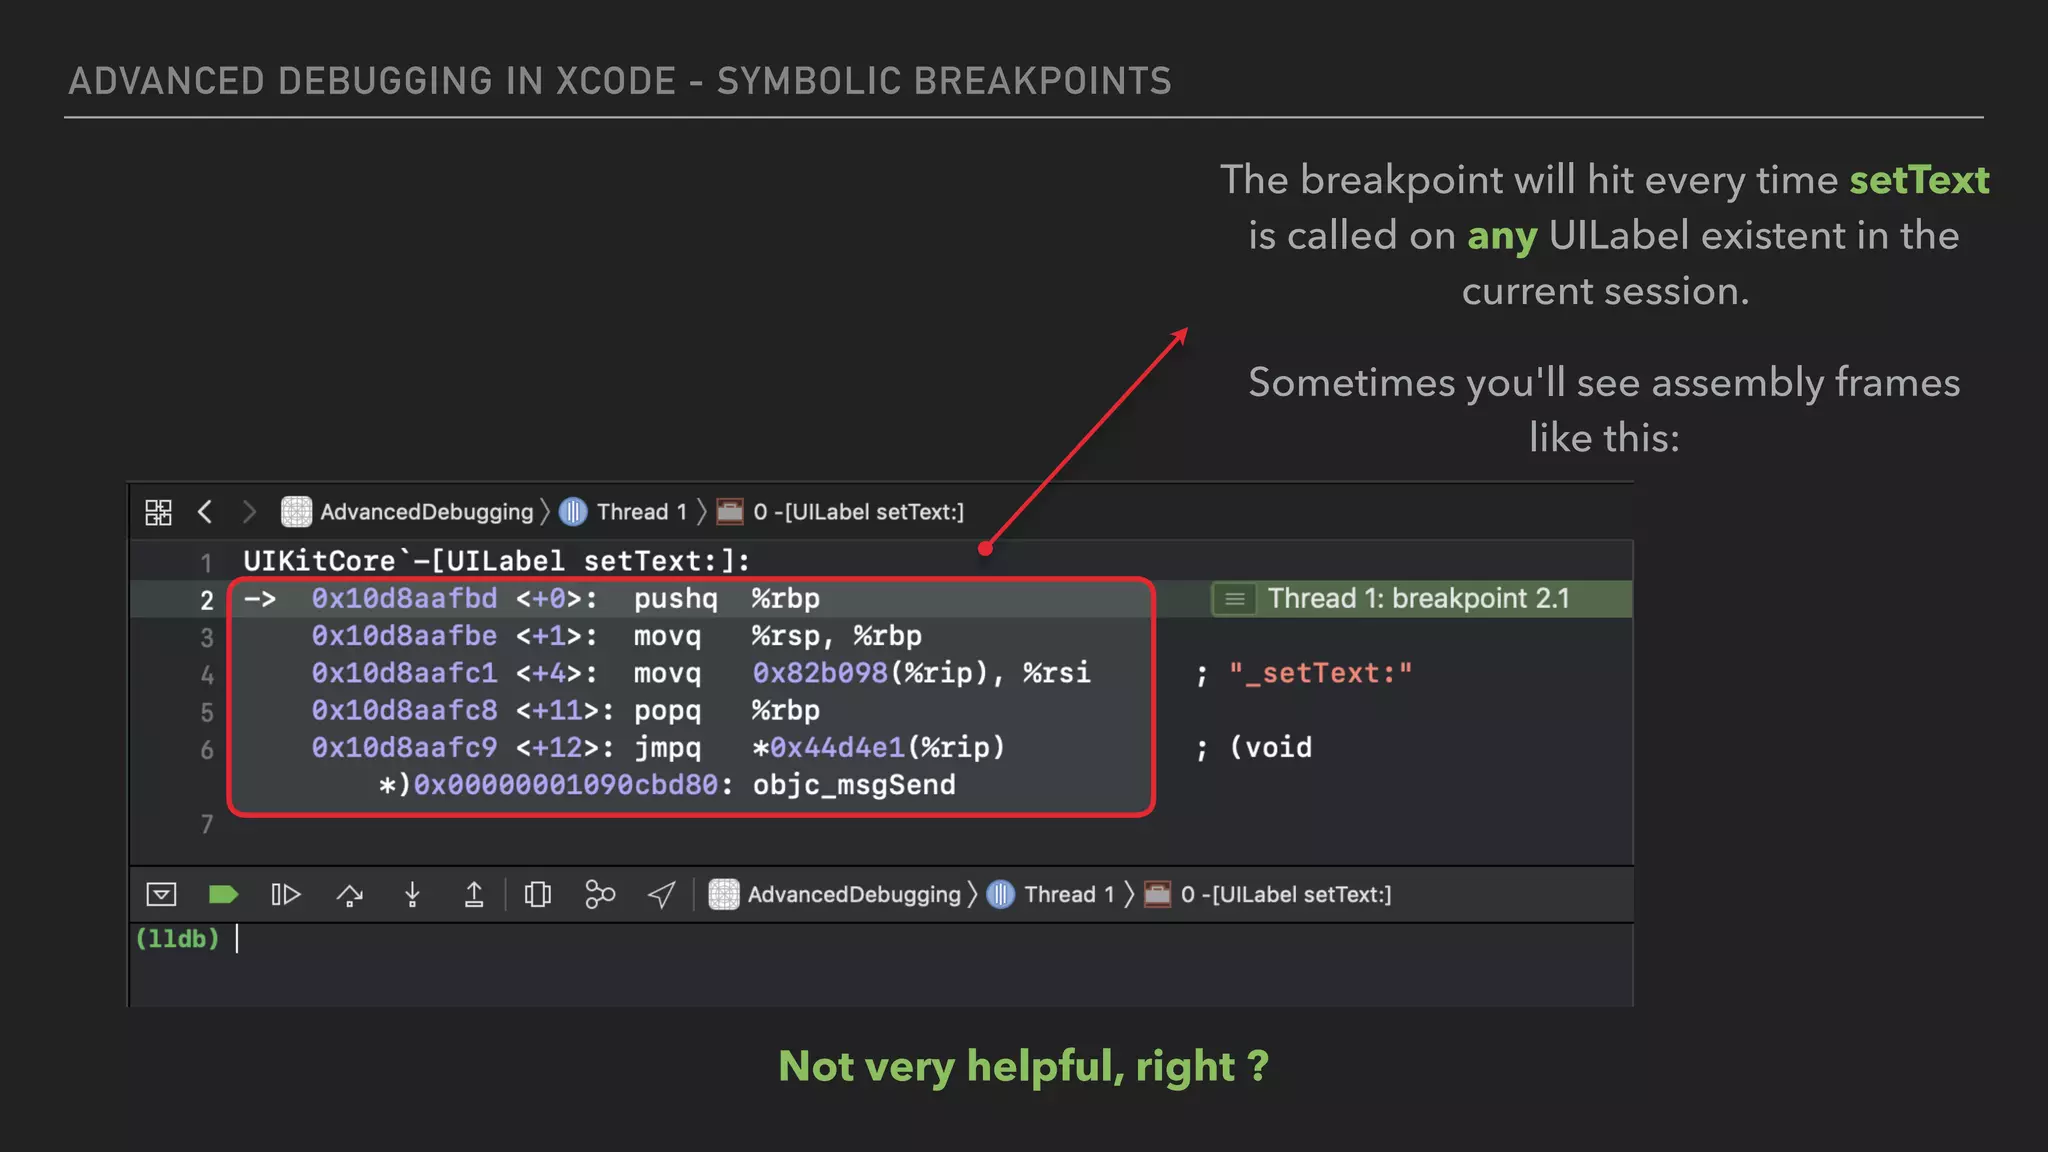
SYMBOLIC BREAKPOINT:
▸ A breakpoint that hits every time a method is called, for every instance of the
particular class in your current debugging session.
▸ Helps you easily track the location of any SDK method call you want
(apparently, it doesn’t work for your own code)
▸ You must use Objective-C syntax, even for Swift code. Example:
▸ To see every a time a text is set to any label, use -[UILabel setText:]](https://image.slidesharecdn.com/advanceddebugging-191111125946/75/Advanced-Debugging-in-XCode-19-2048.jpg)
![ADVANCED DEBUGGING IN XCODE - SYMBOLIC BREAKPOINTS
Go to Breakpoint
Navigator and add a
Symbolic Breakpoint
The symbol can be any method of
any class you want.
You must use Objective-C syntax.
-[UILabel setText:]](https://image.slidesharecdn.com/advanceddebugging-191111125946/75/Advanced-Debugging-in-XCode-20-2048.jpg)


![[TECHCON 2019: MOBILE - iOS]3.쉽고 재미있는 iOS 디버깅 - LLDB Command](https://cdn.slidesharecdn.com/ss_thumbnails/3-190712083226-thumbnail.jpg?width=640&height=640&fit=bounds)