Virtual Try-On Market Size and Share
Market Overview
| Study Period | 2019 - 2030 |
|---|---|
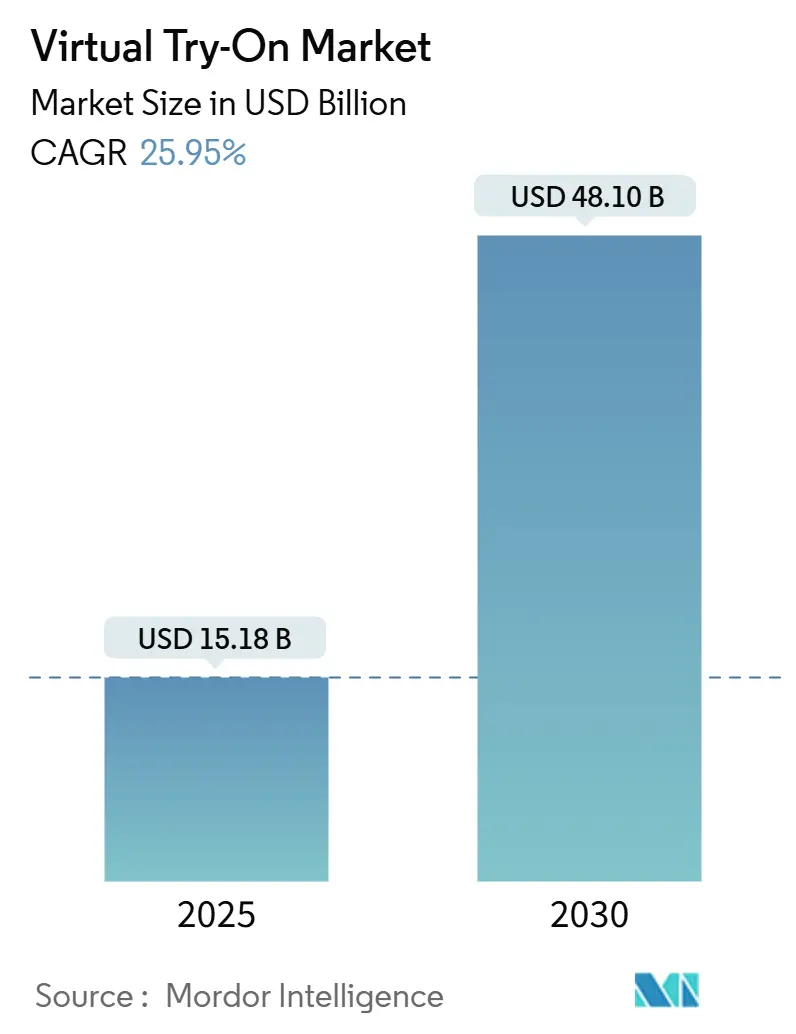
| Market Size (2025) | USD 15.18 Billion |
| Market Size (2030) | USD 48.10 Billion |
| Growth Rate (2025 - 2030) | 25.95% CAGR |
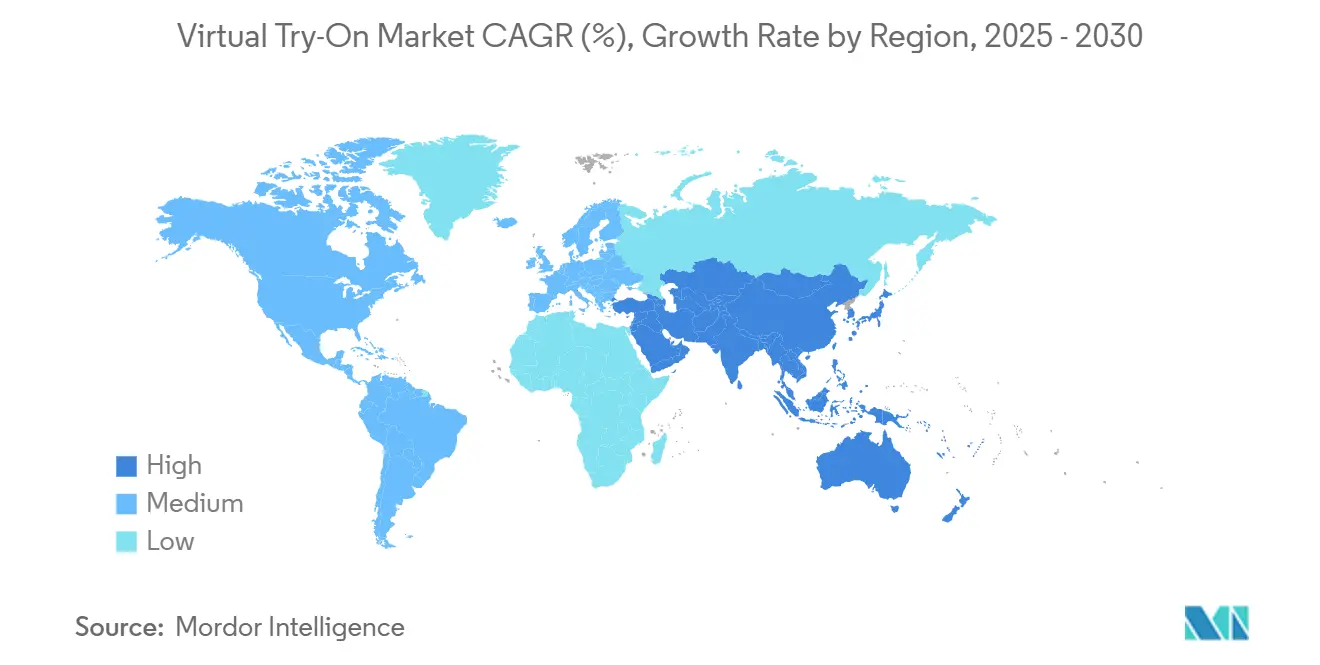
| Fastest Growing Market | Asia Pacific |
| Largest Market | North America |
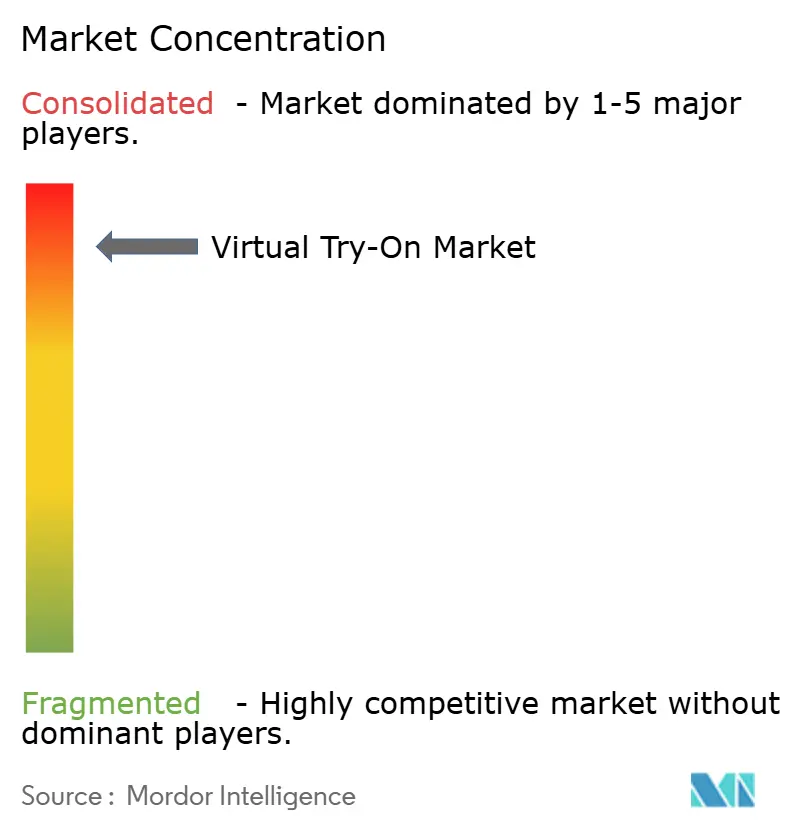
| Market Concentration | High |
Major Players
*Disclaimer: Major Players sorted in no particular order Image © Mordor Intelligence. Reuse requires attribution under CC BY 4.0. |
|
Virtual Try-On Market Analysis by Mordor Intelligence
The virtual try-on market reached USD 15.18 billion in 2025 and is on track to hit USD 48.10 billion by 2030, expanding at a 25.95% CAGR; this headline figure establishes the virtual try-on market size and its rapid trajectory. Retailers are channeling capital into immersive commerce tools because real-time fit simulation cuts return costs, heightens engagement, and widens customer lifetime value. Software platforms dominate because API-driven fit-recommendation engines bolt onto existing e-commerce stacks, while edge-based 5G rendering removes latency constraints that once limited real-time physics. Demand accelerates further as smartphone ARKit/ARCore penetration normalizes markerless experiences, and ESG-linked scorecards assign tangible value to lower product sampling waste. Meanwhile, avatar-based digital twin platforms carve out new social-commerce use cases that elevate brand stickiness and viral reach.
Key Report Takeaways
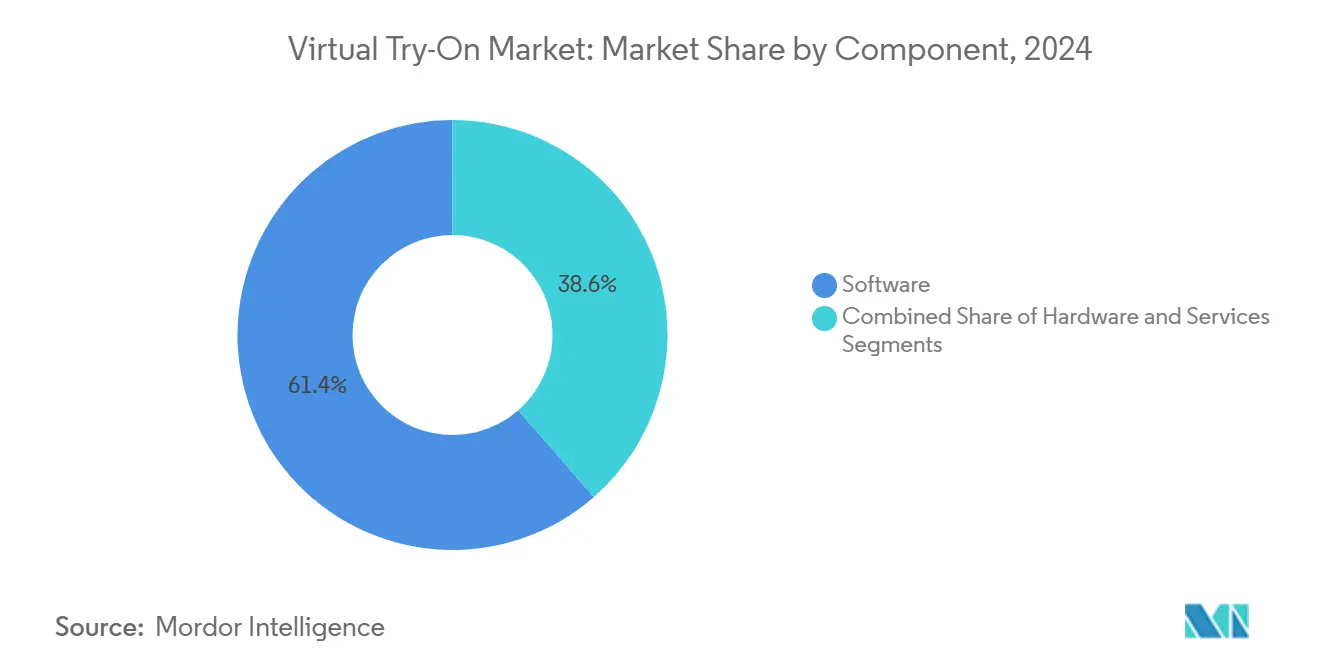
- By component, software solutions held 61.43% of the virtual try-on market share in 2024, while the services segment is forecast to post a 27.47% CAGR through 2030.
- By application, apparel commanded a 47.64% share of the virtual try-on market size in 2024, and footwear is projected to expand at a 26.89% CAGR to 2030.
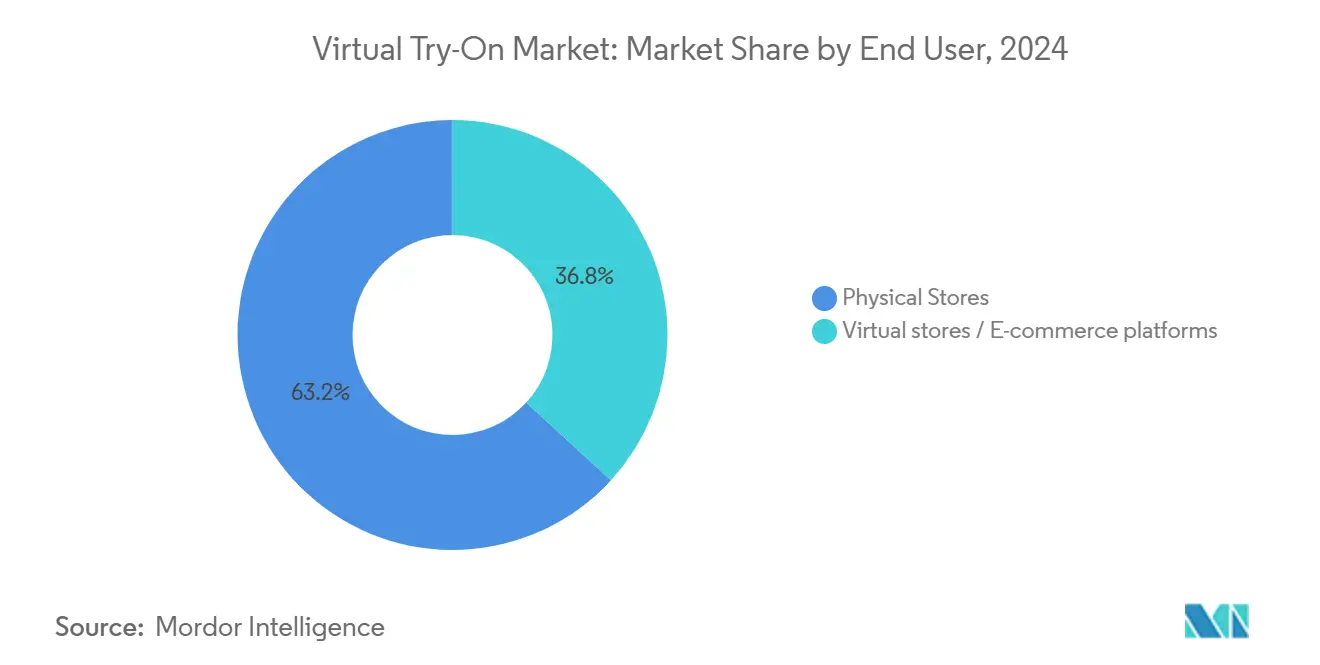
- By end user, physical stores captured 63.19% share of the virtual try-on market in 2024; virtual stores and e-commerce channels are advancing at 27.94% CAGR through 2030.
- By technology, smart mirrors and kiosks held 43.86% revenue share in 2024, whereas avatar-based digital twin platforms are set to grow at 26.23% CAGR to 2030.
- By geography, North America accounted for 37.66% of 2024 revenue, while Asia-Pacific delivered the fastest regional CAGR at 26.19% through 2030.
Global Virtual Try-On Market Trends and Insights
Drivers Impact Analysis
| Driver | (~) % Impact on CAGR Forecast | Geographic Relevance | Impact Timeline |
|---|---|---|---|
| E-commerce return-cost reduction imperative | +4.2% | Global; strongest in North America and Europe | Short term (≤ 2 years) |
| Smartphone ARKit/ARCore penetration | +3.8% | Global; Asia-Pacific leads adoption | Medium term (2-4 years) |
| Retailer demand for personalization and conversion uplift | +3.5% | North America and Europe, expanding to Asia-Pacific | Medium term (2-4 years) |
| Post-pandemic shift to contactless shopping | +2.9% | Global urban centers | Short term (≤ 2 years) |
| Sustainability-linked ESG scorecards | +2.1% | Europe and North America; emerging in Asia-Pacific | Long term (≥ 4 years) |
| 5G edge body-scan APIs | +1.8% | Asia-Pacific, spill-over to North America | Long term (≥ 4 years) |
| Source: Mordor Intelligence | |||
E-commerce Return-Cost Reduction Imperative
Online apparel return rates have hovered near 30-40%, costing retailers roughly USD 21 per returned item; virtual fit modules lower returns by 17% and lift purchase probability by 27%, creating immediate ROI that underpins the virtual try-on market. [1]Iris Publishers, “Technological and Social Impact on Hong Kong's Young Consumers' Online Shopping Behavior for Fashion and Casual Apparel: A Statistical Analysis,” irispublishers.com Higher retention translates into 2.3× lifetime customer value, making the investment self-funding within a few quarters. As shipping surcharges climb amid volatile fuel prices, CFOs quantify every basis point saved on reverse-logistics budgets, accelerating deployment pipelines. Retailers also re-route returns data into design feedback loops, shrinking future sizing errors. These financial and operational effects converge to keep the virtual try-on market on a high-growth slope.
Smartphone ARKit/ARCore Penetration
ARKit and ARCore now ship on roughly 85% of premium smartphones, removing the hardware barrier once blamed for slow consumer uptake. [2]Kinglight, “Samsung Unveiled MicroLED Beauty Mirror at CES 2025,” kinglight.com Robust simultaneous localization and mapping lets retailers deliver browser-based WebXR sessions that rival native apps, eliminating download friction and boosting session depth. Device-resident depth sensors also enrich fit-data fidelity, allowing retailers to auto-populate size charts at checkout. The vendor ecosystem benefits as standardized SDKs cut integration cycles, turning once-custom builds into plug-and-play extensions. Scale economies gained here unlock new price points for mid-tier merchants, broadening the virtual try-on market far beyond early enterprise adopters.
Retailer Demand for Personalization and Conversion Uplift
Conversion-rate optimization now dominates digital P&L discussions; Sephora recorded 35% higher engagement and 200% more trials after rolling out AR shade matching. [3]Snap Inc., “Ulta Beauty Generates 30 Million Product Trials and $6M in Purchases with Snapchat's New Shopping Lenses,” forbusiness.snapchat.com Ulta’s 30 million product trials at less than USD 0.01 per interaction show the unit economics advantage. Algorithmic personalization tailors recommendations by body metrics, tone, and style affinities in milliseconds, raising cross-sell probability while reducing cart abandonment. Persistent avatars extend those gains across channels, tightening loyalty-loop flywheels. Together, these outcomes cement personalization as a non-negotiable feature, spurring deeper platform spend and sustaining virtual try-on market expansion.
Sustainability-Linked ESG Scorecards Boosting Adoption
Environmental scorecards influence cap-ex sign-off as boards tie executive compensation to measurable CO₂ and waste reductions. Virtual sampling shrinks physical prototypes by 50-70%, with L’Oréal reporting 40% less packaging waste after digital shade trials. Demand forecasting accuracy improves when trial data informs production volumes, cutting overstocks that end up in landfills. Rating agencies now count digital-adoption metrics within ESG indices, turning virtual try-on deployments into a capital-market signaling mechanism. In Europe, where environmental regulation tightens annually, these factors combine to accelerate budget allocation toward immersive visualization, buoying the virtual try-on market through 2030.
Restraints Impact Analysis
| Restraint | (~) % Impact on CAGR Forecast | Geographic Relevance | Impact Timeline |
|---|---|---|---|
| Rendering-accuracy limits for diverse body shapes | –2.8% | Global, more pronounced in diverse markets | Medium term (2-4 years) |
| High upfront 3-D asset creation costs | –2.3% | Global; smaller retailers most affected | Short term (≤ 2 years) |
| Tightening biometric-privacy regulations | –1.9% | Europe and North America; expanding globally | Long term (≥ 4 years) |
| Fragmented IP licensing for body-tracking algorithms | –1.4% | Global; tech hubs concentrated | Medium term (2-4 years) |
| Source: Mordor Intelligence | |||
Rendering-Accuracy Limits for Diverse Body Shapes
Training datasets tilt toward narrowly defined body morphologies, causing mis-renders for plus-size shoppers and varied ethnic facial features, which can cut purchase intent by up to 60%. Precision scanning-such as Materialise’s 10-million-point cloud models-solves the fidelity gap but demands compute and bandwidth that many mass-market retailers cannot yet absorb. Poor experiences also carry reputational risk, driving social-media backlash that dissuades hesitant buyers. Until diverse-body datasets mature and hardware costs fall, this restraint will taper CAGR upside in several regions of the virtual try-on market.
High Upfront 3-D Asset Creation Costs
Digitizing a single SKU can run USD 500–5,000; fashion’s seasonal churn multiplies that outlay and squeezes smaller merchants’ margins. Funding rounds like CLO Virtual Fashion’s USD 34 million raise underscore the capital intensity required to scale asset libraries. Some retailers now pool budgets on shared platforms to amortize costs, but fragmentation persists, particularly outside the top 15 global brands. Unless generative-AI mesh creation reaches commercial-grade accuracy, cap-ex pressures will continue to weigh on virtual try-on market adoption among long-tail retailers.
Segment Analysis
By Component: Software Dominance Drives Integration Complexity
Software commanded 61.43% of 2024 revenue and set the architectural tone for how the virtual try-on market integrates with order-management systems. Fit-recommendation engines, API gateways, and computer-vision SDKs remain the central building blocks, while containerized microservices facilitate cloud-edge orchestration. Hardware-smart mirrors, depth cameras, and lidars still drive in-store wow-factor but trail software on scalability metrics. The services layer, advancing at 27.47% CAGR, monetizes ongoing model tuning, managed SaaS hosting, and analytics optimization, underscoring a shift toward outcome-based pricing.
Integration complexity feeds a growing reliance on specialists certified in multiple commerce back-ends, payments APIs, and data-privacy frameworks. MySizeID’s full-service install of FirstLook Smart Mirror illustrates how POS integration hurdles elevate service revenue. Shared 3-D libraries lower marginal asset costs, rewarding platform consolidators that curate multi-retailer ecosystems. These dynamics confirm that ecosystem competition, not standalone vendor quality, will dictate virtual try-on market share shifts over the forecast horizon.
Note: Segment shares of all individual segments available upon report purchase
By Application: Footwear Velocity Challenges Apparel Leadership
Apparel retained 47.64% of 2024 spending thanks to chronic return pain and well-developed body-scan algorithms. Yet footwear’s projected 26.89% CAGR threatens that lead as Nike, Adidas, and start-ups fuse foot-scan data with gait analytics for biomechanically precise sizing. Beauty and cosmetics rely on real-time shader pipelines to match undertones, while eyewear focuses on sub-millimeter facial measurements for lens alignment. Jewelry and watches, though niche, add high-margin transactions that justify advanced holographic renderers.
Footwear’s biomechanical layer demands force-plate data and pressure-map analytics, setting a higher technical bar than 2-D dress overlays. Beauty’s colorimetry challenges spur innovation in spectral rendering engines distinct from cloth physics. Such divergence fragments the supplier landscape, enabling vertical-specific champions to secure defensible niches. As each use case solidifies unique requirements, one-size-fits-all approaches lose ground, reinforcing specialized solution arcs within the virtual try-on market.
By End User: Physical Store Resilience Defies Digital Assumptions
Physical stores captured 63.19% of 2024 spend, proving that tactile atmospherics paired with smart mirrors elevate conversion by 40% versus mobile-only AR. Retailers now reposition fitting-room real estate as data-generating hubs, syncing on-site avatar updates with e-commerce profiles to unlock omni-channel synergies.
Virtual stores and e-commerce platforms, growing at a 27.94% CAGR, lean on persistent avatars to recreate social-shopping rituals and support asynchronous collaboration shopping. The two channels increasingly co-decode shopper intent: in-store scans refine online precision, while online styleboards guide store inventory localization. Vendors able to deliver consistent avatar hand-off between channels are poised to win disproportionate virtual try-on market share.
By Technology: Avatar Platforms Challenge Mirror Dominance
Smart mirrors and kiosks held 43.86% of 2024 turnover because they plug cleanly into retail remodel cycles and deliver immediate uplift metrics. However, avatar-driven digital twin platforms, expanding at 26.23% CAGR, cater to the creator economy’s appetite for shareable looks, fuelling viral brand amplification. 2-D AI overlay engines provide low-budget entry paths, whereas full 3-D AR suites command premium SaaS rates aligned with luxury positioning.
Snap’s Shopping Lenses, responsible for 30 million Ulta trials, highlight how social integrations compress customer-acquisition cost curves. Real-time cloth simulation, depth-cued occlusion, and physics-grade lighting now form the table stakes of differentiation. As avatar realism approaches cinematic standards, technology preference will pivot from static kiosk endpoints toward portable, user-owned avatars-reshaping long-term patterns within the virtual try-on market.
Geography Analysis
North America accounted for 37.66 of % revenue in 2024 due to early enterprise pilots, strong disposable income, and mature e-commerce logistics. Walmart, Sephora, and Ulta ran national-scale deployments, normalizing virtual fit workflows among mainstream consumers. Regulatory headwinds loom, however, with Colorado’s 2025 biometric-privacy statute mandating granular consent mechanics that may elongate integration timelines.
Asia-Pacific represents the fastest-growing geography at 26.19% CAGR through 2030, propelled by mobile-first buyer behavior and large-scale 5G rollouts. China’s 150 thousand AR/VR headset shipments in Q2 2025 signal rising hardware readiness. Japan’s Innovation Studio mirrors and South Korea’s display-maker investments diversify the vendor base and localize solution sets. Cultural comfort with avatar-mediated identity further accelerates uptake, while government digital-economy grants de-risk retailer experimentation.
Europe exhibits steady but compliance-shaped growth. GDPR adds cost layers, but sustainability imperatives and luxury positioning keep adoption on track. France’s Acuitis delivers 50% conversion on 3-D printed frames, validating premium-price tolerance for precision fit. Pan-EU retailers exploit cross-border avatar portability to harmonize inventory, yet must navigate emerging AI-governance acts that could alter data-processing rights post-2026.
Competitive Landscape
The virtual try-on market remains fragmented; no player exceeds a low-double-digit share, leaving room for niche champions. Incumbents such as Perfect Corp, FittingBox, and True Fit parlay extensive retail rosters and IP troves to maintain lead status. October 2023’s FittingBox acquisition of Ditto illustrates consolidation economics needed to amortize data-labeling and patent-licensing costs.
Differentiation centers on rendering accuracy, speed, and integration modularity. Apple’s patent covering hybrid geometry modeling signals the IP arms race within avatar realism. Emerging specialists target vertical gaps: Banuba for beauty filters, or Volumental for footwear scans. White space persists in furniture and automotive accessories, where dimensional accuracy intersects high basket value.
Licensing complexity shapes go-to-market: overlapping patents in body tracking and mesh reconstruction force start-ups into cross-licensing or M&A paths. Vendors that secure end-to-end stacks-scanning, simulation, analytics-will likely consolidate share as retailers pursue procurement simplicity. Over 2025-2030, competitive intensity is forecast to rise as cloud hyperscalers package AR toolkits, compressing margins yet expanding total addressable spend.
Virtual Try-On Industry Leaders
-
True Fit Corporation
-
Fit Analytics GmbH
-
Fits Me Ltd. (Rakuten Group)
-
Autumn Rock Limited (AstraFit)
-
Sizebay Internet Marketing Ltda.
- *Disclaimer: Major Players sorted in no particular order
Recent Industry Developments
- September 2025: Aeon Retail completed nationwide rollout of Perfect Corp AR makeup trials across 109 stores, covering 700 SKUs
- August 2025: Tag Co. launched MISE-demo EYES, a multilingual virtual-concierge system for Japanese eyewear chains
- June 2025: Innovation Studio installed +PLUS MIRROR interactive units at LULUTI Harajuku, offering AI color and fashion diagnostics
- February 2025: Acuitis rolled out Materialise’s Eyewear Fitting Suite to 100+ French stores, recording 50% conversion on 3-D printed frames
Global Virtual Try-On Market Report Scope
| Software | Fit-recommendation engines |
| AR-visualisation SDKs | |
| Digital-asset-management platforms | |
| Hardware | Smart mirrors |
| Depth sensors and cameras | |
| AR / MR head-mounted displays | |
| Services | Integration and consulting |
| Support and maintenance | |
| Managed SaaS hosting |
| Apparel |
| Eyewear |
| Footwear |
| Beauty and cosmetics |
| Jewelry and watches |
| Physical stores |
| Virtual stores / E-commerce platforms |
| 2-D AI image-overlay engines |
| 3-D model AR try-on |
| Smart mirror / kiosk systems |
| WebAR and mobile SDK |
| Avatar-based digital twin platforms |
| North America | United States | |
| Canada | ||
| Mexico | ||
| Europe | Germany | |
| United Kingdom | ||
| France | ||
| Russia | ||
| Rest of Europe | ||
| Asia-Pacific | China | |
| Japan | ||
| India | ||
| South Korea | ||
| Australia | ||
| Rest of Asia-Pacific | ||
| Middle East and Africa | Middle East | Saudi Arabia |
| United Arab Emirates | ||
| Rest of Middle East | ||
| Africa | South Africa | |
| Egypt | ||
| Rest of Africa | ||
| South America | Brazil | |
| Argentina | ||
| Rest of South America | ||
| By Component | Software | Fit-recommendation engines | |
| AR-visualisation SDKs | |||
| Digital-asset-management platforms | |||
| Hardware | Smart mirrors | ||
| Depth sensors and cameras | |||
| AR / MR head-mounted displays | |||
| Services | Integration and consulting | ||
| Support and maintenance | |||
| Managed SaaS hosting | |||
| By Application | Apparel | ||
| Eyewear | |||
| Footwear | |||
| Beauty and cosmetics | |||
| Jewelry and watches | |||
| By End User | Physical stores | ||
| Virtual stores / E-commerce platforms | |||
| By Technology / Form Factor | 2-D AI image-overlay engines | ||
| 3-D model AR try-on | |||
| Smart mirror / kiosk systems | |||
| WebAR and mobile SDK | |||
| Avatar-based digital twin platforms | |||
| By Geography | North America | United States | |
| Canada | |||
| Mexico | |||
| Europe | Germany | ||
| United Kingdom | |||
| France | |||
| Russia | |||
| Rest of Europe | |||
| Asia-Pacific | China | ||
| Japan | |||
| India | |||
| South Korea | |||
| Australia | |||
| Rest of Asia-Pacific | |||
| Middle East and Africa | Middle East | Saudi Arabia | |
| United Arab Emirates | |||
| Rest of Middle East | |||
| Africa | South Africa | ||
| Egypt | |||
| Rest of Africa | |||
| South America | Brazil | ||
| Argentina | |||
| Rest of South America | |||
Key Questions Answered in the Report
How large is the virtual try-on market in 2025?
The market reached USD 15.18 billion in 2025 and is tracking a 25.95% CAGR toward USD 48.10 billion by 2030.
Which application is growing fastest within virtual try-on?
Footwear is the velocity leader, advancing at a 26.89% CAGR as foot-scan and gait-analysis integrations mature.
Why do physical stores still dominate adoption?
Smart mirrors lift in-store conversion by about 40%, and retailers leverage staff assistance plus tactile validation to drive higher basket values.
What technology shift will shape the next five years?
Avatar-based digital twin platforms are set to overtake kiosk-centric models, enabling persistent, shareable representations across channels.
How do virtual try-on tools support ESG goals?
They cut physical sampling by up to 70%, trim packaging waste by 40%, and refine demand forecasts to lower overproduction.
Which region shows the fastest growth outlook?
Asia-Pacific leads with a 26.19% CAGR through 2030, buoyed by mobile-first commerce cultures and expanding 5G infrastructure.
Page last updated on:

