Threat Modeling Tools Market Size and Share
Market Overview
| Study Period | 2019 - 2030 |
|---|---|
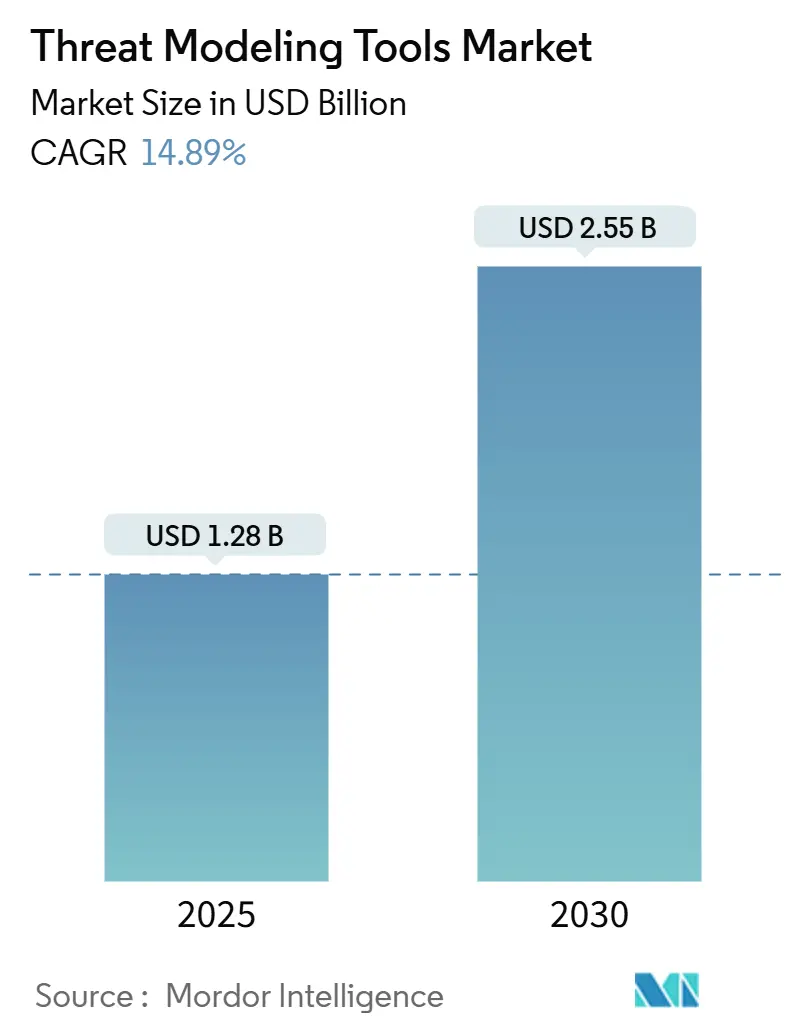
| Market Size (2025) | USD 1.28 Billion |
| Market Size (2030) | USD 2.55 Billion |
| Growth Rate (2025 - 2030) | 14.89% CAGR |
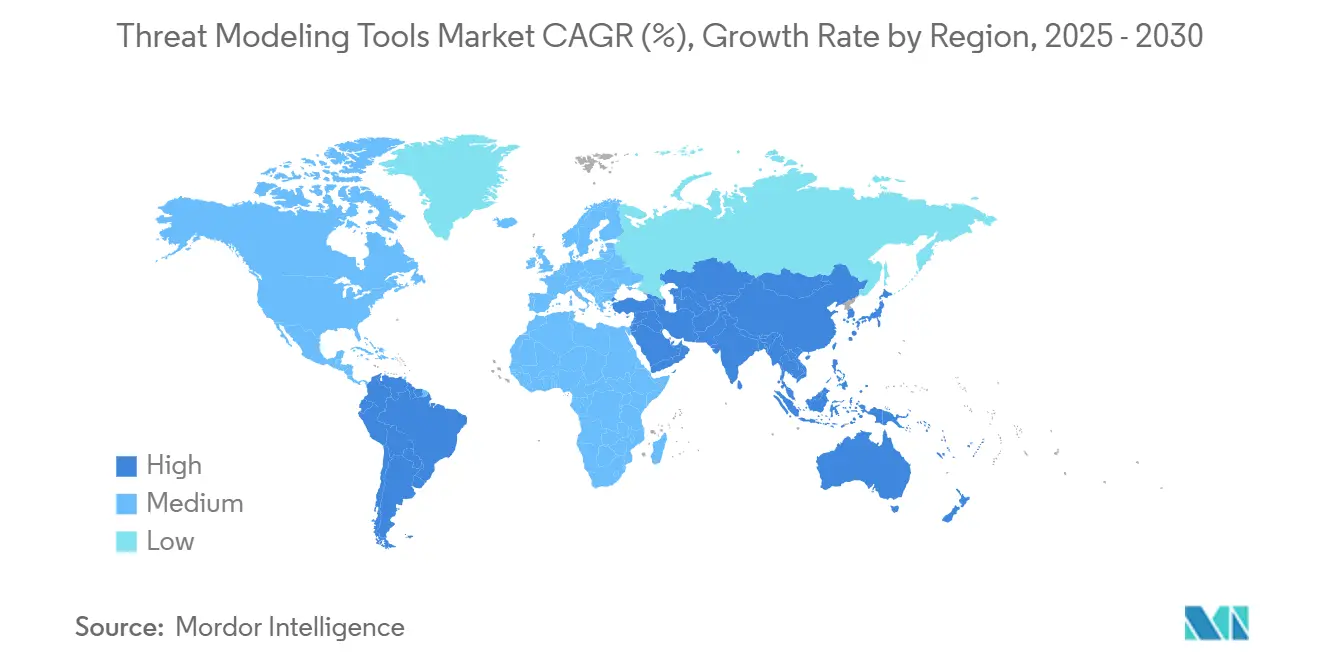
| Fastest Growing Market | Asia Pacific |
| Largest Market | North America |
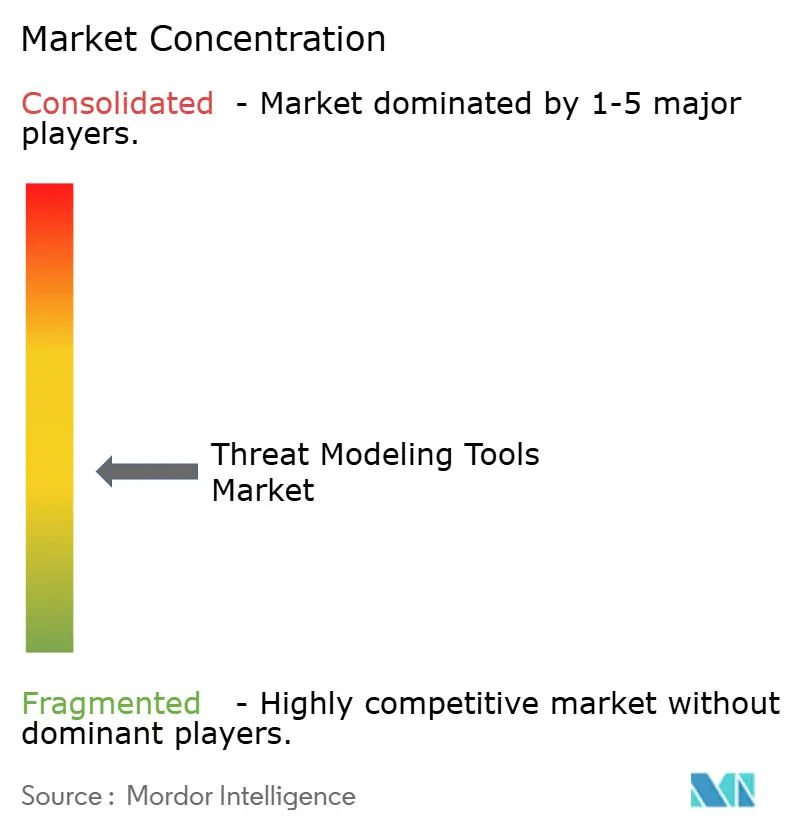
| Market Concentration | Medium |
Major Players
*Disclaimer: Major Players sorted in no particular order Image © Mordor Intelligence. Reuse requires attribution under CC BY 4.0. |
|
Threat Modeling Tools Market Analysis by Mordor Intelligence
The threat modeling tools market size reached USD 1.28 billion in 2025 and is forecast to expand to USD 2.55 billion by 2030, delivering a 14.89% CAGR. Growth stems from mandatory adoption of security-by-design practices, the spread of cloud-native development, and stringent regulations such as the NIST Secure Software Development Framework. Federal contractors must now demonstrate continuous threat modeling, while enterprises modernize their security toolchains to address micro-services and AI-driven workloads. Vendors that integrate automated modeling into DevSecOps pipelines gain sustained demand, especially as organizations pivot toward code-centric security workflows and subscription-based consumption.
Key Report Takeaways
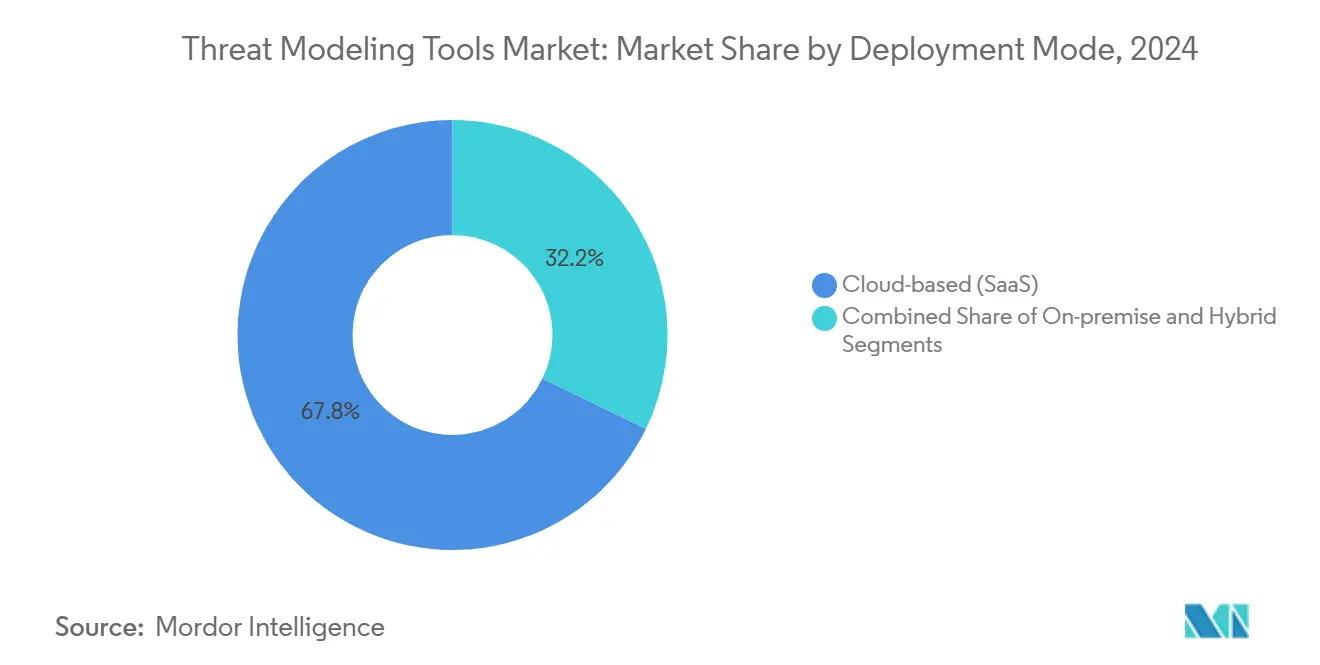
- By deployment mode, cloud-based SaaS held 67.82% of the threat modeling tools market share in 2024 and will expand at a 15.67% CAGR through 2030.
- By tool type, enterprise commercial platforms led with 45.74% revenue share in 2024, whereas threat-as-code/CLI tools are projected to grow fastest at 14.96% CAGR to 2030.
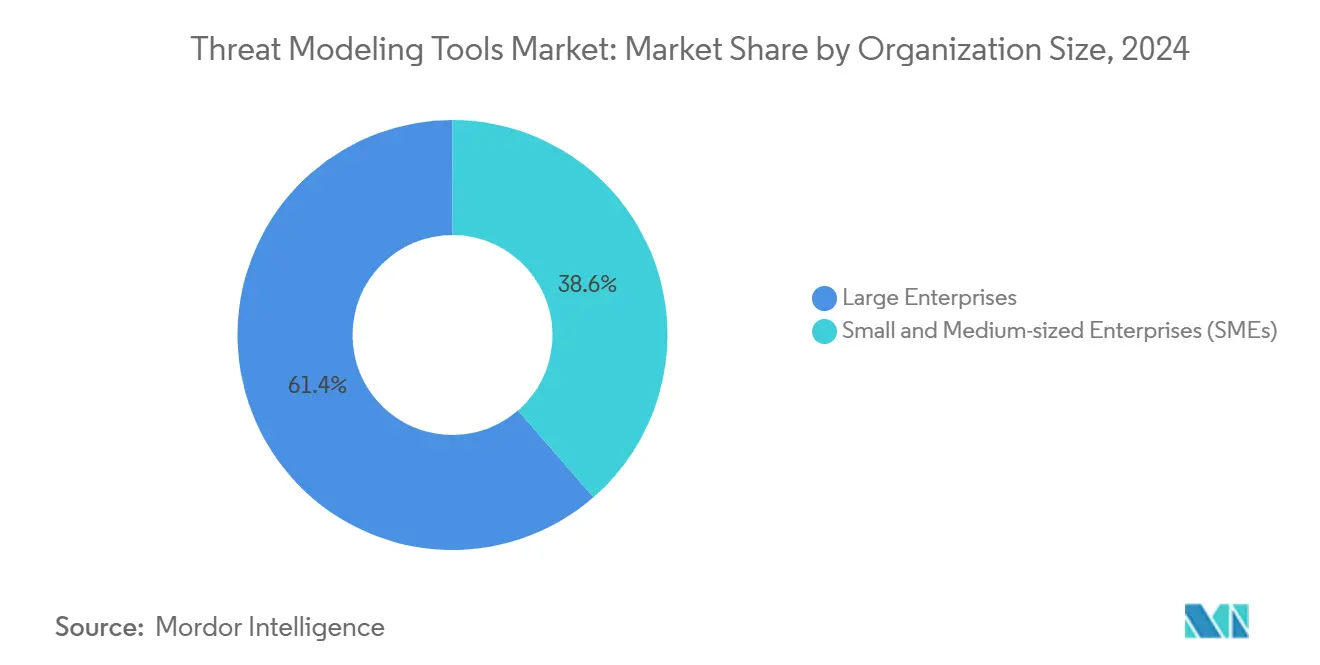
- By organization size, large enterprises accounted for 61.38% of 2024 revenue, while SMEs are positioned for the highest 16.23% CAGR through 2030.
- By end-use vertical, BFSI captured 27.93% of 2024 spending, and healthcare and life sciences are expected to advance at a 14.91% CAGR to 2030.
- By geography, North America dominated with a 39.86% share in 2024; Asia-Pacific is poised for a 15.04% CAGR, the fastest among all regions.
Global Threat Modeling Tools Market Trends and Insights
Drivers Impact Analysis
| Driver | (~) % Impact on CAGR Forecast | Geographic Relevance | Impact Timeline |
|---|---|---|---|
| DevSecOps-driven shift-left adoption | +3.2% | Global, with North America and Europe leading | Medium term (2-4 years) |
| Expanding regulatory mandates (NIST SSDF, GDPR, PCI, FedRAMP) | +2.8% | North America and Europe primary, Asia-Pacific emerging | Long term (≥ 4 years) |
| Cloud-native and micro-services architecture proliferation | +2.1% | Global, concentrated in tech-forward regions | Short term (≤ 2 years) |
| GenAI/LLM security frameworks needing bespoke threat models | +1.9% | Global, with early adoption in North America and Asia-Pacific | Medium term (2-4 years) |
| IaC auto-parsing enabling code-derived threat models | +1.7% | Global, developer-centric markets | Short term (≤ 2 years) |
| Software-supply-chain SBOM scoring integrations | +1.4% | North America and Europe, expanding to Asia-Pacific | Medium term (2-4 years) |
| Source: Mordor Intelligence | |||
DevSecOps-driven shift-left adoption
Enterprises increasingly embed threat modeling into daily development workflows to identify vulnerabilities before code reaches production. The NIST SSDF compels U.S. federal contractors to document threat modeling at design time, and similar provisions appear in EU Digital Operational Resilience Act drafts. Seamless plug-ins for GitHub, GitLab, and Azure DevOps make the practice as routine as a pull-request review. A major European bank cut release delays by 40% after automating its models within CI pipelines. Tool vendors that expose APIs and Infrastructure-as-Code parsers benefit, because developers can treat security diagrams as version-controlled artifacts. As a result, shift-left adoption adds a meaningful 3.2% uplift to forecast CAGR across the threat modeling tools market.
Expanding regulatory mandates
Legal frameworks worldwide now enshrine threat modeling as a compliance line-item. GDPR Article 25 requires privacy-by-design reviews, while PCI DSS 4.0 makes modeling mandatory for card-processing environments. [1]PCI Security Standards Council, “Payment Card Industry Data Security Standard v4.0,” pcisecuritystandards.org Singapore’s Cybersecurity Act amendments oblige critical-infrastructure owners to conduct periodic threat assessments. FedRAMP authorizations similarly demand architectural threat evaluations for cloud providers operating in the U.S. public sector. Fines for non-conformance and the associated vendor-lockout risks drive steady budget allocation, lifting the global baseline demand curve by 2.8%.
Cloud-native and microservices architecture proliferation
Rapid Kubernetes adoption fragments application boundaries, making legacy perimeter models obsolete. Modern tools must digest service mesh policies, container registries, and cluster ingress routes to map attack surfaces in real time. [2]Cloud Security Alliance, “Cloud Native Security Framework,” cloudsecurityalliance.org One multinational manufacturer uncovered 23 hidden attack paths inside its Kubernetes estate after deploying container-aware threat modeling, prompting architectural redesigns. Because container topologies change hourly, SaaS-based engines that rebuild models dynamically gain preference over static desktop utilities. This dynamic-environment fit accelerates tool refresh cycles and contributes an estimated 2.1% CAGR uplift.
GenAI/LLM security frameworks need bespoke threat models
Large language models introduce novel exposures, including prompt injection, training-data poisoning, and model theft. The OWASP Top 10 for LLM applications formalizes these risks. [3]OWASP Foundation, “OWASP Top 10 for Large Language Model Applications,” owasp.org Enterprises racing to embed generative AI must map data pipelines, model registries, and inference endpoints within threat models that legacy products cannot parse. Academic work such as ThreMoLIA outlines multi-layer methodologies, spurring tool vendors to ship AI-aware rule-sets. Early adopters in finance and healthcare already run red-team simulations against chatbots handling sensitive data, and this specialized demand adds a 1.9% positive impact to the market’s growth trajectory.
Restraints Impact Analysis
| Restraint | (~) % Impact on CAGR Forecast | Geographic Relevance | Impact Timeline |
|---|---|---|---|
| Shortage of skilled threat-modeling practitioners | -1.8% | Global, acute in emerging markets | Long term (≥ 4 years) |
| Integration and workflow complexity across heterogeneous SDLC stacks | -1.4% | Global, enterprise-focused | Medium term (2-4 years) |
| Model-drift and false assurance from auto-generated models | -0.9% | Global, AI-adopting organizations | Short term (≤ 2 years) |
| Platform consolidation squeezing stand-alone tool budgets | -0.7% | North America and Europe primarily | Medium term (2-4 years) |
| Source: Mordor Intelligence | |||
Shortage of skilled threat-modeling practitioners
Industry surveys show 78% of organizations struggle to hire staff who can translate architectural diagrams into actionable security requirements. The knowledge spans attack techniques, compliance law, and software design, limiting the talent pool. Regional gaps are widest in emerging economies where universities lag in security curricula. Programs from the Linux Foundation and CISA aim to close the gap, yet certification pipelines trail demand. Until automated tooling matures, scarce expertise suppresses large-scale deployments and shaves 1.8% from market CAGR potential.
Integration and workflow complexity across heterogeneous SDLC stacks
Enterprises juggle mixed programming languages, monoliths, micro-services, and hybrid clouds. Threat modeling tools must interface with issue trackers, CI/CD orchestrators, SIEMs, and compliance dashboards, often via bespoke connectors. Each new integration adds configuration overhead that small teams cannot absorb, slowing rollout. Hybrid on-premise and multi-cloud architectures intensify the challenge, as consistent modeling across environments proves elusive. Vendors that provide turnkey plug-ins gain adoption, but present fragmentation removes 1.4% from growth momentum.
Segment Analysis
By Deployment Mode: Cloud acceleration reshapes buyer preference
Cloud-based SaaS platforms accounted for 67.82% of 2024 revenue and are projected to rise at a 15.67% CAGR through 2030. The threat modeling tools market size for SaaS offerings benefits from on-demand scalability, global collaboration, and lower upfront cost. On-premise deployments persist in public-sector and regulated utilities that must keep diagrams behind firewalls, yet their single-digit growth lags the market.
Enterprises favor SaaS because vendors can continuously update threat libraries and machine-learning detection models. Collaboration features let distributed teams co-edit diagrams and automatically push security tickets into Agile backlogs. Hybrid models gain traction where financial-services firms store PII locally but tap cloud engines for compute-heavy attack-path analysis, demonstrating nuanced adoption rather than an all-or-nothing migration.
Note: Segment shares of all individual segments available upon report purchase
By Tool Type: Automation-first utilities rise quickly
Enterprise commercial platforms retained 45.74% of 2024 spend, thanks to integrated workflow orchestration, enterprise SSO, and audit-grade reporting. Yet CLI-based threat-as-code tools are anticipated to post a 14.96% CAGR, the fastest within the threat modeling tools market. Developers embed YAML-defined models in Git repos, enabling peer review just like application code.
Open-source/community editions serve as low-friction entry points, especially for SMEs piloting security practices. Diagram-centric drag-and-drop tools remain popular for executive presentations, though they increasingly export JSON to feed automated scanners. Simulation and attack-graph engines remain niche but indispensable to red-team units that stress-test complex critical infrastructure.
By Organization Size: SME expansion outpaces enterprise saturation.
Large enterprises contributed 61.38% of 2024 revenue because compliance departments and dedicated security architects institutionalized threat modeling. Growing saturation slows incremental spend, leaving large firms to optimize workflows rather than buy new seats. SMEs, however, will deliver a 16.23% CAGR, driven by low-code interfaces and pay-per-use SaaS that remove budgeting friction within the threat modeling tools market.
Vendor tutorials and guided wizards allow product owners without deep security backgrounds to run baseline models, broadening the addressable audience. Affordable pricing tiers and marketplace plug-ins further accelerate SME onboarding, especially among tech startups that deploy cloud stacks by default.
By End-Use Vertical: Healthcare adoption accelerates
BFSI remained the single largest purchaser, holding 27.93% of 2024 spending due to PCI DSS, SOX, and evolving open-banking directives that enforce proactive risk analysis. Healthcare and life sciences is projected to register the strongest 14.91% CAGR, reflecting hospital digitization, connected medical devices, and FDA guidance calling for pre-market threat assessments.
Telecom firms adopt threat modeling to secure 5G network slices and edge-compute nodes. Government agencies embed modeling into procurement frameworks for critical infrastructure, while manufacturing outfits map attack paths across IT-OT convergence and autonomous production lines.
Geography Analysis
North America commanded 39.86% of global revenue in 2024 on the back of NIST mandates, FedRAMP requirements, and a mature DevSecOps culture. Federal spending following Executive Order 14028 keeps demand elevated for generalized and niche threat modeling solutions. Canada boosts regional totals with privacy statute enforcement in the finance and healthcare domains, while Mexico accelerates adoption within automotive manufacturing supply chains.
Europe maintains steady momentum led by GDPR privacy-by-design obligations and forthcoming AI Act security clauses. Germany spearheads manufacturing and automotive use cases, the United Kingdom invests in secure financial services pipelines post-Brexit, and France channels defense budgets toward aerospace system modeling. Pan-EU harmonization of cybersecurity policies ensures tooling requirements remain broadly consistent across member states.
Asia-Pacific is set to realize the fastest 15.04% CAGR. China’s Interim AI Measures, Japan’s AI governance, and South Korea’s AI Basic Act all codify formal threat assessments, compelling procurement of specialized toolsets. India advances through NITI Aayog AI guidelines, while Singapore revises its Cybersecurity Act to mandate periodic modeling for critical information infrastructure. As digital transformation sweeps across ASEAN and Oceania, enterprises view threat modeling as foundational rather than optional.
Competitive Landscape
The threat modeling tools market remains moderately fragmented. Microsoft embeds modeling directly inside Azure DevOps, leveraging its ecosystem reach to onboard developers without a separate purchase cycle. Specialized vendors such as ThreatModeler Software and IriusRisk differentiate through AI-driven automation, regulatory template libraries, and industry-specific ontologies. Mastercard’s USD 2.65 billion acquisition of Recorded Future underscores consolidation momentum and signals that large payment networks see value in integrated risk analytics stacks.
Open-source initiatives like Threagile and ThreatSpec popularize threat-as-code, shifting influence toward developer communities rather than traditional security buyers. Patent filings at USPTO on ML-generated attack path detection highlight continual innovation aimed at reducing human expertise requirements. Vendors investing in infrastructure-as-code parsers, real-time cloud topology scans, and LLM-specific risk engines appear best positioned to capture incremental spend.
Despite competitive churn, barriers to entry persist: domain expertise, reference threat libraries, and enterprise-grade integrations require years to mature. As a result, incumbent vendors with established APIs, compliance dashboards, and professional-services arms maintain pricing power even while niche start-ups chip away at specialized sub-domains.
Threat Modeling Tools Industry Leaders
-
ThreatModeler Software Inc.
-
IriusRisk Limited
-
Security Compass Inc.
-
Foreseeti AB
-
Aristiun Inc.
- *Disclaimer: Major Players sorted in no particular order
Recent Industry Developments
- October 2025: Amazon Web Services launched ThreatComposer Cloud, a fully managed service that translates AWS CloudFormation and Terraform templates into continuously updated threat models.
- August 2025: IriusRisk acquired Brazil-based Conviso AppSec to expand its Latin American presence and integrate advanced code-centric threat modeling features.
- May 2025: OWASP released Threat Modeling Methodology v2.0, standardizing guidance on AI system exposure analysis and infrastructure-as-code mapping.
- March 2025: Microsoft added an AI-driven threat-playbook generator to Azure DevOps, enabling developers to auto-populate mitigation tasks during pull-request reviews.
Global Threat Modeling Tools Market Report Scope
| Cloud-based (SaaS) |
| On-premise |
| Hybrid |
| Enterprise Commercial Platforms |
| Open-Source / Community Editions |
| Threat-as-Code / CLI Tools |
| Diagramming-Centric Tools |
| Simulation and Attack-Graph Tools |
| Large Enterprises |
| Small and Medium-sized Enterprises (SMEs) |
| BFSI |
| IT and Telecom |
| Healthcare and Life Sciences |
| Government and Defense |
| Manufacturing and Industrial |
| North America | United States | |
| Canada | ||
| Mexico | ||
| Europe | Germany | |
| United Kingdom | ||
| France | ||
| Russia | ||
| Rest of Europe | ||
| Asia-Pacific | China | |
| Japan | ||
| India | ||
| South Korea | ||
| Australia | ||
| Rest of Asia-Pacific | ||
| Middle East and Africa | Middle East | Saudi Arabia |
| United Arab Emirates | ||
| Rest of Middle East | ||
| Africa | South Africa | |
| Egypt | ||
| Rest of Africa | ||
| South America | Brazil | |
| Argentina | ||
| Rest of South America | ||
| By Deployment Mode | Cloud-based (SaaS) | ||
| On-premise | |||
| Hybrid | |||
| By Tool Type | Enterprise Commercial Platforms | ||
| Open-Source / Community Editions | |||
| Threat-as-Code / CLI Tools | |||
| Diagramming-Centric Tools | |||
| Simulation and Attack-Graph Tools | |||
| By Organization Size | Large Enterprises | ||
| Small and Medium-sized Enterprises (SMEs) | |||
| By End-use Vertical | BFSI | ||
| IT and Telecom | |||
| Healthcare and Life Sciences | |||
| Government and Defense | |||
| Manufacturing and Industrial | |||
| By Geography | North America | United States | |
| Canada | |||
| Mexico | |||
| Europe | Germany | ||
| United Kingdom | |||
| France | |||
| Russia | |||
| Rest of Europe | |||
| Asia-Pacific | China | ||
| Japan | |||
| India | |||
| South Korea | |||
| Australia | |||
| Rest of Asia-Pacific | |||
| Middle East and Africa | Middle East | Saudi Arabia | |
| United Arab Emirates | |||
| Rest of Middle East | |||
| Africa | South Africa | ||
| Egypt | |||
| Rest of Africa | |||
| South America | Brazil | ||
| Argentina | |||
| Rest of South America | |||
Key Questions Answered in the Report
What is the current value of the threat modeling tools market?
The threat modeling tools market size stood at USD 1.28 billion in 2025.
How fast is demand for threat modeling platforms growing?
The market is projected to register a 14.89% CAGR between 2025 and 2030.
Why are cloud-based threat modeling tools gaining traction?
SaaS delivery offers real-time collaboration, continuous library updates, and lower upfront costs, which has driven cloud deployments to 67.82% share in 2024.
Which industry vertical is expected to grow fastest in adopting threat modeling?
Healthcare and life sciences will expand at a 14.91% CAGR through 2030 as medical device and patient-data regulations tighten.
Which region will see the quickest growth?
Asia-Pacific is forecast at a 15.04% CAGR due to new AI governance and cybersecurity mandates in China, Japan, and South Korea.
What skills shortage affects implementation?
A global lack of specialized threat-modeling practitioners restricts deployment, subtracting an estimated 1.8% from potential CAGR.
Page last updated on:

