Telecom Service Assurance Market Size and Share
Market Overview
| Study Period | 2019 - 2030 |
|---|---|
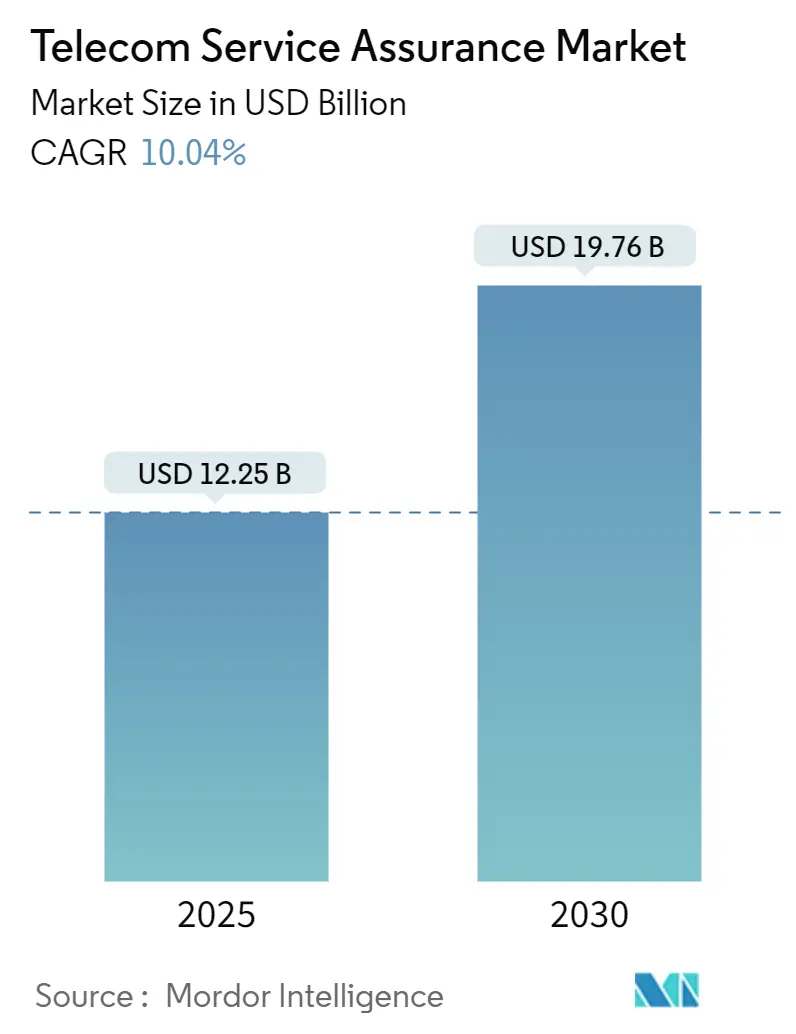
| Market Size (2025) | USD 12.25 Billion |
| Market Size (2030) | USD 19.76 Billion |
| Growth Rate (2025 - 2030) | 10.04% CAGR |
| Fastest Growing Market | Asia Pacific |
| Largest Market | North America |
| Market Concentration | Medium |
Major Players
*Disclaimer: Major Players sorted in no particular order Image © Mordor Intelligence. Reuse requires attribution under CC BY 4.0. |
|
Telecom Service Assurance Market Analysis by Mordor Intelligence
The telecom service assurance market size reached USD 12.25 billion in 2025 and is forecast to attain USD 19.76 billion by 2030, reflecting a 10.04% CAGR over 2025-2030. Heightened performance-monitoring needs, 5G standalone adoption, and AI-centric zero-touch operations have boosted near-term spending as operators transition from reactive to proactive network management paradigms. Private-network and IoT vertical use cases are widening the addressable base, while hyperscaler partnerships are redirecting assurance architectures toward cloud-native, open-API designs. Competitive intensity has remained moderate; large multinationals are consolidating adjacent capabilities through acquisitions to strengthen end-to-end portfolios. North America continued to dominate in 2025, yet Asia Pacific’s swift 5G rollout and enterprise digitalization yielded the fastest regional growth. Multiplying compliance mandates-from STIR/SHAKEN to the EU AI Act-have further entrenched the telecom service assurance market as a mission-critical spend category.
Key Report Takeaways
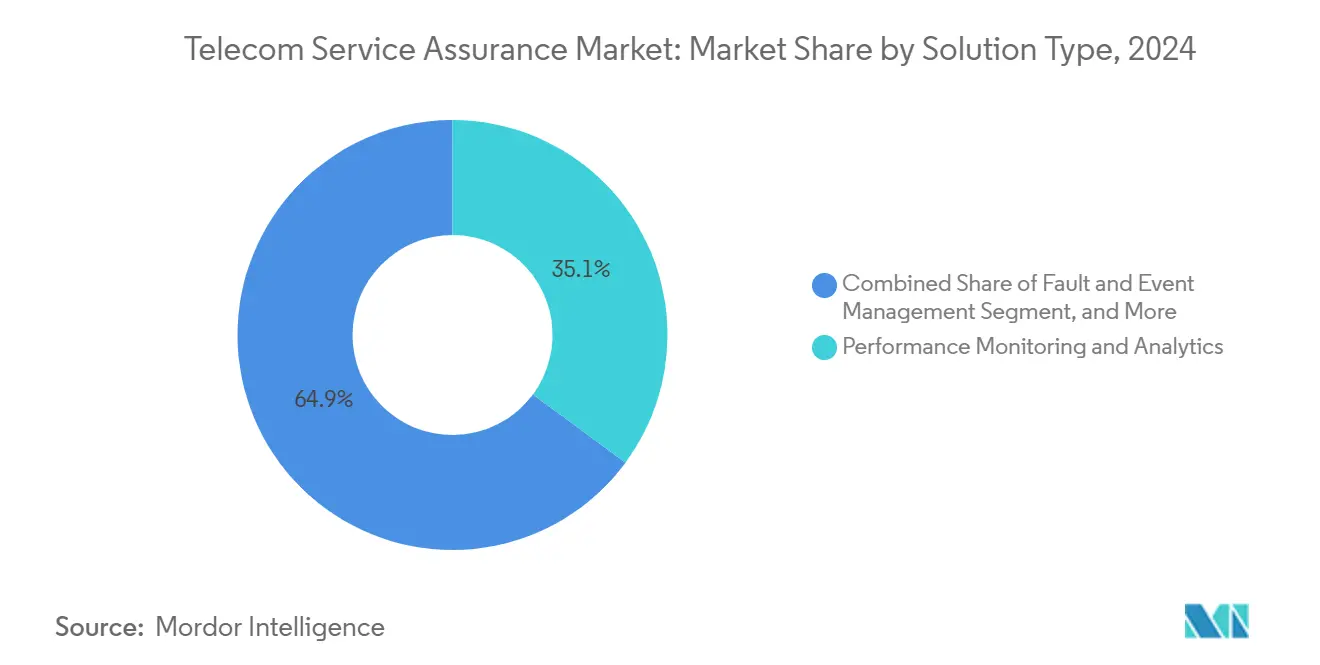
- By solution type, Performance Monitoring and Analytics led with 35.12% revenue share in 2024; Automated Root-Cause and Remediation is projected to expand at an 11.23% CAGR through 2030.
- By deployment mode, on-premises platforms accounted for 51.34% of the telecom service assurance market share in 2024, while cloud-native implementations are set to grow 12.33% annually to 2030.
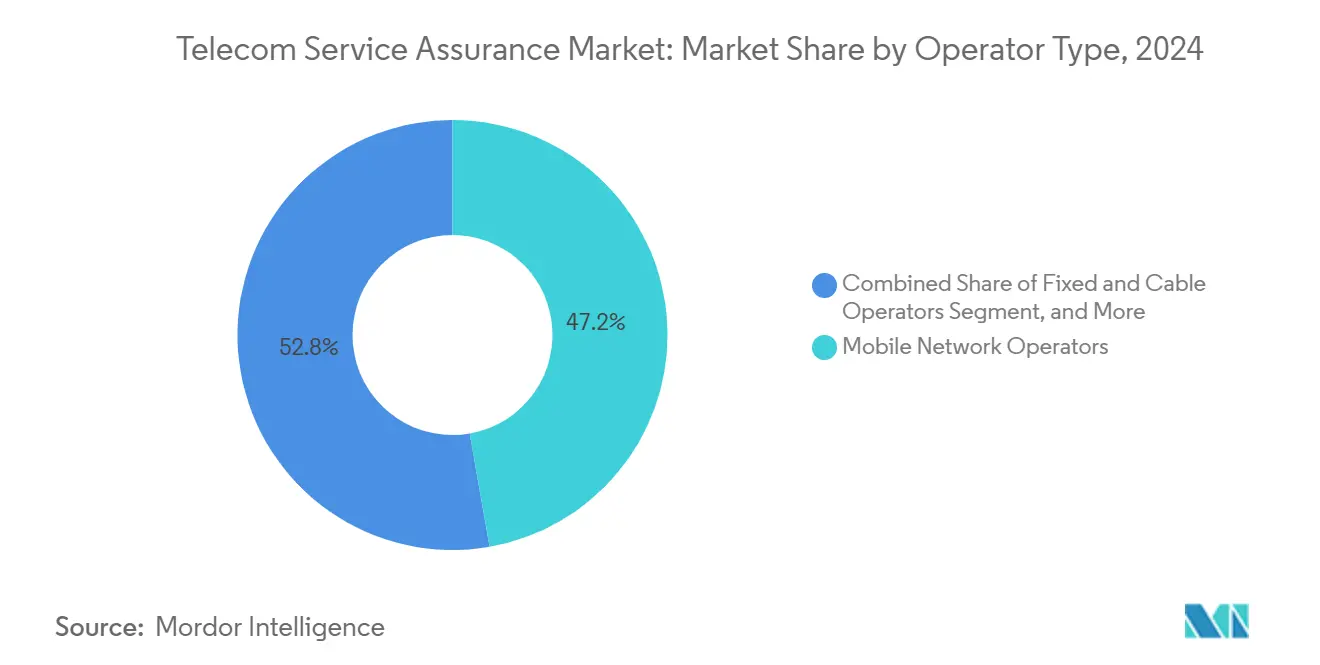
- By operator type, mobile network operators retained 47.24% share of the telecom service assurance market size in 2024, whereas private-network enterprises will post a 13.12% CAGR during 2025-2030.
- By application domain, 5G RAN Assurance held 31.13% share of the telecom service assurance market size in 2024 and IoT/M2M Assurance is accelerating at a 13.22% CAGR to 2030.
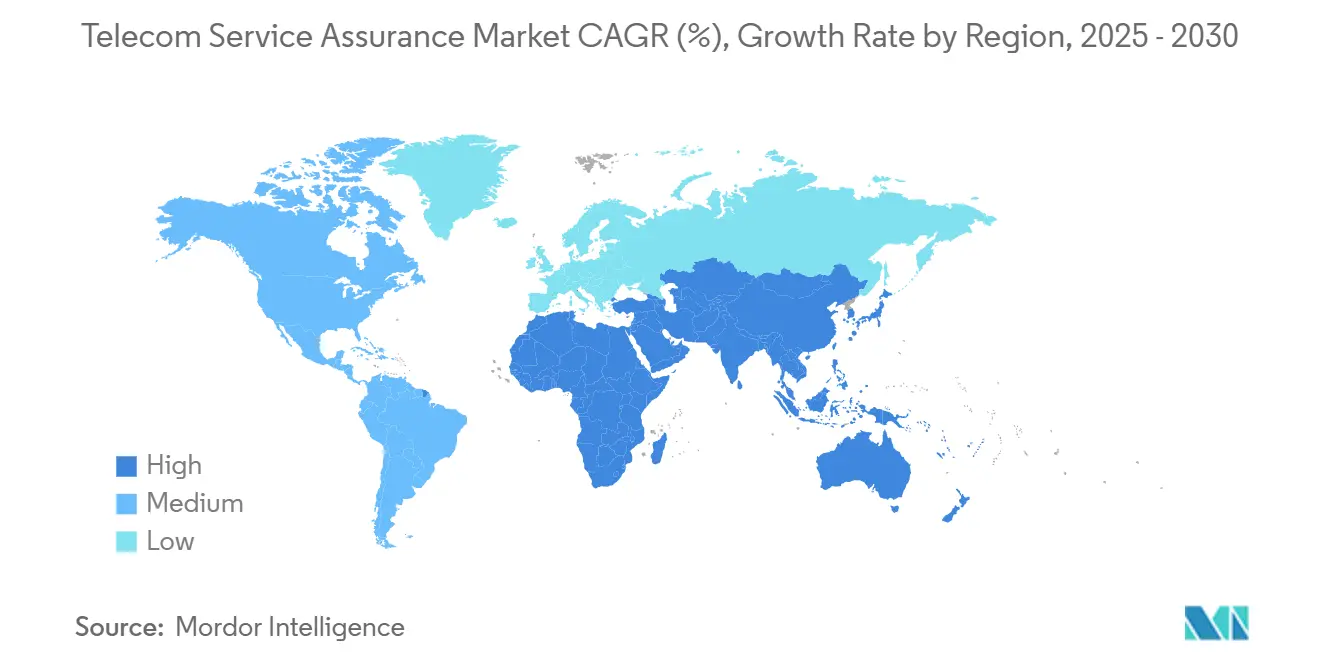
- By geography, North America captured 32.32% of the telecom service assurance market share in 2024; Asia Pacific is advancing at a 12.41% CAGR through 2030.
Global Telecom Service Assurance Market Trends and Insights
Drivers Impact Analysis
| Driver | (~) % Impact on CAGR Forecast | Geographic Relevance | Impact Timeline |
|---|---|---|---|
| AI-centric zero-touch operations adoption | +2.1% | Global; early leadership in North America and Asia Pacific | Medium term (2-4 years) |
| 5G SA roll-out demanding real-time SLA visibility | +1.8% | Global; concentrated in North America, Europe, Asia Pacific | Short term (≤2 years) |
| Compliance pressure (STIR/SHAKEN, GDPR, EU AI Act) | +1.3% | North America and Europe; expanding to Asia Pacific | Long term (≥4 years) |
| Telco API monetization needs end-to-end quality | +1.6% | Global; advanced adoption in North America and Europe | Medium term (2-4 years) |
| Private-5G and IoT verticals creating assurance white-space | +1.9% | Global; enterprise concentration in North America and Europe | Medium term (2-4 years) |
| Hyperscaler partnerships forcing open assurance APIs | +1.4% | Global; driven by major cloud providers | Short term (≤2 years) |
| Source: Mordor Intelligence | |||
AI-centric Zero-touch Operations Adoption
Widespread automation initiatives reshaped network operations in 2024-2025 as operators pursued TM Forum Level 4-5 autonomy to curb operating expenses and sharpen service quality. Ericsson’s joint work with AWS on Agentic AI proved that intent-based orchestration can cut manual interventions and lift customer satisfaction. TM Forum economic modelling estimated average annual savings of USD 800 million per tier-1 operator once AI-driven closed-loop control matures.[1]TM Forum, “The Economics of Autonomous Networks,” inform.tmforum.org Eighty-seven percent of global carriers had at least one production AI use case by late-2024, yet half cited fragmented data collection as the top barrier, spurring demand for unified assurance data lakes. Regulators added momentum: the EU AI Act requires transparent and auditable models, strengthening procurement criteria for assurance platforms that embed explainability. These forces collectively enlarged spending allocations to AI-native assurance modules, reinforcing growth in the telecom service assurance market.
5G SA Roll-out Demanding Real-time SLA Visibility
Commercial 5G standalone networks ran at scale in North America, Europe, and key Asia Pacific markets during 2024, triggering unprecedented resiliency requirements. NETSCOUT released virtual tap technology to ingest 100 Gbps traffic streams for microsecond-level analytics across cloudified cores. Spirent’s active-assurance probes generated synthetic traffic to validate slice performance before customer impact, reversing long-standing reactive operating models. Service providers prioritized slice-aware analytics that tie transport, core, and RAN metrics into unified dashboards, a gap that traditional OSS/BSS could not cover. Standards groups TM Forum and 3GPP finalized slice-specific KPIs, propelling vendors to embed them natively. Heightened enterprise SLA expectations-especially for robotics and AR-further elevated real-time assurance from an optional feature to a contractual necessity.
Compliance Pressure (STIR/SHAKEN, GDPR, EU AI Act)
Voice authentication, data privacy, and AI governance rules tightened throughout 2024-2025. FCC enforcement actions on illegal robocalls accelerated STIR/SHAKEN deadlines, obligating United States carriers to maintain exhaustive identity-verification audit trails. GDPR’s territorial scope continued to affect AI-enhanced analytics pipelines that process subscriber data, increasing scrutiny of model outputs and retention schedules. Proposed fines under the EU AI Act incentivized European carriers to deploy traceable AI algorithms within service-assurance stacks. Collectively, these layered mandates redirected budgets toward platforms that render continuous compliance reporting, with built-in policy engines and immutable logs, thereby sustaining the telecom service assurance market’s double-digit growth.
Telco API Monetization Needs End-to-end Quality
Network-exposure platforms progressed from pilots to revenue-generating services in 2024-2025, demanding high-fidelity monitoring across core, edge, and application layers. Verizon’s globally exposed APIs for location, quality-on-demand, and slicing reiterated that developers expect deterministic performance.[2] Verizon, “5G Network APIs for Developers,” verizon.com The Aduna joint venture among Bridge Alliance operators and Ericsson underscored multi-operator consistency, pushing standardized CAMARA interfaces that embed assurance hooks. Telstra’s collaboration with Vonage on advanced voice APIs showed that SLA breaches directly erode monetization, raising adoption barriers unless end-to-end assurance is proven. Consequently, API analytics modules-tracking latency, jitter, and throughput per call-became core purchase criteria, feeding another vector of demand into the telecom service assurance market.
Restraints Impact Analysis
| Restraint | (~) % Impact on CAGR Forecast | Geographic Relevance | Impact Timeline |
|---|---|---|---|
| Capex freezes by Tier-1 MNOs 2024-25 | -1.7% | Global; particularly North America and Europe | Short term (≤2 years) |
| Legacy OSS/BSS integration complexity | -1.2% | Global; higher impact in mature markets | Long term (≥4 years) |
| Skilled-labor shortage in network AIOps | -0.9% | Global; acute in North America and Europe | Medium term (2-4 years) |
| Rising security-compliance cost offsets ROI | -0.8% | Global; regulatory-driven in North America and Europe | Medium term (2-4 years) |
| Source: Mordor Intelligence | |||
Capex Freezes by Tier-1 MNOs 2024-25
Carrier capex contracted sharply in 2024 as 5G radio builds peaked and macroeconomic uncertainty rose. Dell’Oro’s tracking placed industry capex 8% lower year-over-year, with projections for a 2% CAGR decline through 2027. Large United States operators reduced infrastructure outlays by roughly 50% versus prior budgets, delaying non-essential software expansions. Assurance vendors faced extended sales cycles and heightened ROI scrutiny; however, they leveraged cost-savings narratives-predictive maintenance and energy optimization-to remain on procurement short lists. Analysts expect budgets to thaw in late-2025 once 5G monetization initiatives mature, positioning assurance spending to rebound alongside renewed RAN densification.
Legacy OSS/BSS Integration Complexity
Siloed operational stacks, some tracing back two decades, slowed adoption of cloud-native assurance. HCLTech identified fragmented data models and poor cross-domain visibility as chief blockers to unified monitoring.[3]HCLTech, “Realizing OSS Transformation Benefits,” hcltech.com Strategyand concluded that digital-enablement platforms require rewiring around microservices and open REST APIs, yet many operators hesitate to risk service continuity during migration. The resulting multi-phase projects inflate timelines and consultancy fees, tempering near-term market expansion. Vendors countered by offering adapter frameworks and low-code integration toolkits, but complex brownfield environments still impose a structural drag on the telecom service assurance market.
Segment Analysis
By Solution Type: Performance Monitoring Commands Adoption Momentum
Performance Monitoring and Analytics captured 35.12% revenue in 2024, underpinning every major network-modernization program. The segment’s high share reflected urgent needs to visualize radio, transport, and core domains in real time. Cisco’s AI-augmented telemetry streams exemplified how operators pivoted from threshold-based alarms to predictive analytics that pre-empt congestion. The telecom service assurance market size tied to Performance Monitoring is projected to maintain a robust mid-single-digit CAGR as slice-aware metrics expand.
Automated Root-Cause and Remediation rose as the high-growth niche, forecast at 11.23% CAGR through 2030, propelled by TM Forum Level-4 autonomy targets. Carriers demanded closed-loop feedback that self-heals degraded slices within seconds, slashing MTTR by up to 60%. Vendors bundled machine-learning policy engines that correlate billions of events and recommend remediation scripts, compressing troubleshooting head-counts. Over 30 global operators issued RFPs for root-cause AI modules during 2025, signaling a maturation path from pilot to mainstream adoption.
Note: Segment shares of all individual segments available upon report purchase
By Deployment Mode: Hybrid Cloud Gains Ground
On-premises platforms still held 51.34% share in 2024 as operators sought tight control over sensitive core data. However, cloud-native instances of telecom service assurance market solutions expanded 12.33% annually, enabled by containerization and CI/CD pipelines. Red Hat’s Kubernetes-based OSS reference stack showcased cost benefits from elastic scaling and managed services. Simultaneously, Infovista’s KLERITY delivered vendor-agnostic assurance with multi-tenancy to serve enterprise customers in SaaS mode.
Hybrid mode is emerging as the default architecture: heavy packet brokering and lawful-intercept workloads remain on-premises, while AI training and long-term analytics shift to public clouds. This duality addresses data-sovereignty directives yet harnesses hyperscaler GPUs for model training. The telecom service assurance market size for hybrid architectures is forecast at USD 9.4 billion by 2030, advancing on par with overall market CAGR.
By Operator Type: Private Networks Accelerate Demand
Mobile network operators dominated revenue at 47.24% in 2024, but enterprise-owned private networks constitute the telecom service assurance market’s fastest riser at a 13.12% CAGR. Amdocs’ global managed MPN portfolio illustrated enterprises’ appetite for full-stack visibility-from localized cores to edge IoT gateways-delivered via subscription. Automotive, pharmaceuticals, and logistics verticals deployed campus networks supporting AGVs and machine-vision systems, sharply elevating assurance complexity.
MVNO and digital-only operators favored lightweight, cloud-hosted assurance suites with API billing integration, trading deep customization for speed-to-market. Fixed and cable players focused on fiber-quality metrics and proactive DOCSIS monitoring to maintain quad-play competitiveness. Collectively, cross-operator heterogeneity widened the solution landscape and fostered modular product strategies among vendors.
Note: Segment shares of all individual segments available upon report purchase
By Application Domain: IoT/M2M Leads Innovation Curve
5G RAN Assurance accounted for the largest slice in 2024 due to massive MIMO rollouts and slice orchestration. Yet, IoT/M2M Assurance is growing 13.22% annually as connected-device counts head toward 6.4 billion by 2029. Mobileum’s prebuilt controls for SIM lifecycle testing spotlight how continuous, device-centric telemetry replaces bursty, call-centric paradigms. Energy utilities, smart-city grids, and healthcare sensors drove demand for anomaly detection at scale, sparking specialized rule engines that parse MQTT and CoAP flows.
Customer-experience analytics merged with network KPIs in 2025, tying churn likelihood to micro-outage patterns. McKinsey estimated telcos could cut churn by 5-10 basis points through AI-driven QoE scoring, reinforcing customer-centric assurance funding. Edge-cloud deployments further fragmented monitoring needs, creating sub-millisecond latency targets that traditional probes could not capture without lightweight container agents distributed across MEC nodes.
Geography Analysis
North America sustained 32.32% share in 2024, fueled by STIR/SHAKEN compliance deadlines and early standalone-core commercialization. Operators such as AT&T and Verizon piloted Level-4 energy-optimization use cases that trimmed cell-site power by 5%. Integration with AWS and Google Cloud advanced the regional shift toward assurance-as-code pipelines. The telecom service assurance market size tied to North America is projected at USD 6.8 billion by 2030, maintaining mid-single-digit growth as private-5G initiatives scale.
Asia Pacific rose as the primary growth engine, logging a 12.41% CAGR through 2030 on the back of nationwide 5G coverage in India, Thailand, and Australia. Fitch Ratings affirmed stable credit metrics for many Asia-Pacific telcos, enabling sustained investments in assurance modernization. Enterprise 5G and massive IoT deployments across manufacturing corridors spurred demand for slice-aware and device-centric monitoring, doubling average deal sizes compared with LTE-era contracts.
Europe retained significant opportunity, balancing GDPR and impending EU AI Act compliance burdens with open-RAN diversification. Operators sought vendor-neutral dashboards that reconcile multiple RU/DU suppliers, elevating the appeal of disaggregated assurance. Middle East and Africa gained traction through Comarch’s multi-domain OSS rollouts, which align with government digital-economy blueprints. Latin America approached the tipping point for 5G dominance, with GSMA projecting 60% 5G penetration by 2030. This transition necessitates cloud-hosted assurance to offset constrained capex budgets.
Competitive Landscape
The telecom service assurance market features moderate concentration with overlapping domains among infrastructure OEMs, independent software vendors, and cloud hyperscalers. Nokia, Ericsson, Cisco, IBM, and Amdocs leveraged extensive service portfolios to cross-sell assurance in large digital-transformation contracts. Specialized players—VIAVI, Spirent, MYCOM OSI—focused on test, monitoring, and AI analytics niches, often partnering with integrators for turnkey delivery. VIAVI’s USD 1.28 billion Spirent acquisition (closed March 2025) exemplified horizontal consolidation to achieve scale across active and passive assurance.
AI capability became the prime differentiation lever. Ericsson achieved the first TM Forum-certified Level-4 autonomy for predictive cell-energy management, reporting a 135-ton CO₂e reduction at Denmark’s TDC NET pilot. MYCOM OSI added generative-AI guidance in October 2024 for slice optimization, securing multi-year renewals with European incumbents. Cloud alignment likewise shaped vendor positioning: Amdocs integrated Amazon Bedrock LLMs into its amAIz platform, delivering 45% customer-satisfaction lifts in production trials.
Price competition intensified in lower-tier segments, but Tier-1 operators emphasized proof-of-value-energy savings, MTTR cuts, churn reduction-over headline license discounts. Emerging disruptors offering 100% Kubernetes-native stacks capitalized on greenfield private-network opportunities, eroding legacy vendors’ entry-level revenue. Overall, the market gravitates toward AI-fueled feature wars while M&A activity narrows the mid-size vendor band.
Telecom Service Assurance Industry Leaders
-
Nokia Corporation
-
Telefonaktiebolaget LM Ericsson
-
International Business Machines Corporation
-
Cisco Systems, Inc.
-
Amdocs Ltd.
- *Disclaimer: Major Players sorted in no particular order
Recent Industry Developments
- March 2025: Keysight closed its Spirent purchase while selling Spirent’s HSE and security assets to VIAVI for USD 425 million, realigning test portfolios.
- March 2024: Ericsson and Bridge Alliance launched Aduna for standardized CAMARA-based network APIs across 34 member networks.
- February 2025: Nokia secured EU clearance for its USD 2.3 billion Infinera acquisition, targeting EUR 200 million synergies by 2027.
- February 2025: Three UK shifted to Ericsson core software to triple peak capacity to 9 Tbps.
Global Telecom Service Assurance Market Report Scope
Telecom service assurance involves continuously monitoring, managing, and optimizing networks to ensure predefined service level agreements (SLAs), focusing on maintaining peak performance and reliability and addressing issues promptly. The scope of the study delves into service assurance solutions and service types around the globe, and market size encompasses the revenue generated from service assurance solutions and service types offered by various players operating in the market. The study tracks the key market parameters, underlying growth influencers, and major vendors operating, supporting market estimations and growth rates during the forecast period.
The market is segmented by component type (system type [probe system, network management, workforce management, fault management, quality monitoring, and other system types], services type [professional services, managed services]), deployment type (on-premise and hosted), and geography (North America, Europe, Asia-Pacific, Latin America, and the Middle East & Africa). The report offers the market size in value terms in USD for all the abovementioned segments.
| Meetings |
| Incentives |
| Conferences |
| Exhibitions |
| Hybrid/Virtual Events |
| Event Planning and Management |
| Venue Rental |
| Transportation and Logistics |
| Accommodation |
| Food and Catering |
| Audio-Visual and Technology Services |
| Other Service Types |
| Convention Centers |
| Hotels and Resorts |
| Outdoor / Unconventional Venues |
| Corporate Owned Facilities |
| IT and Telecom |
| Healthcare and Pharmaceuticals |
| Banking, Financial Services and Insurance (BFSI) |
| Automotive and Manufacturing |
| Hospitality and Tourism |
| Government and Public Sector |
| Other Industry Verticals |
| North America | United States | |
| Canada | ||
| Mexico | ||
| South America | Brazil | |
| Argentina | ||
| Rest of South America | ||
| Europe | Germany | |
| United Kingdom | ||
| France | ||
| Italy | ||
| Spain | ||
| Russia | ||
| Rest of Europe | ||
| Asia Pacific | China | |
| Japan | ||
| India | ||
| South Korea | ||
| Australia | ||
| Rest of Asia Pacific | ||
| Middle East and Africa | Middle East | United Arab Emirates |
| Saudi Arabia | ||
| Turkey | ||
| Rest of Middle East | ||
| Africa | South Africa | |
| Nigeria | ||
| Kenya | ||
| Rest of Africa | ||
| By Event Type | Meetings | ||
| Incentives | |||
| Conferences | |||
| Exhibitions | |||
| Hybrid/Virtual Events | |||
| By Service Type | Event Planning and Management | ||
| Venue Rental | |||
| Transportation and Logistics | |||
| Accommodation | |||
| Food and Catering | |||
| Audio-Visual and Technology Services | |||
| Other Service Types | |||
| By Venue Type | Convention Centers | ||
| Hotels and Resorts | |||
| Outdoor / Unconventional Venues | |||
| Corporate Owned Facilities | |||
| By Industry Vertical | IT and Telecom | ||
| Healthcare and Pharmaceuticals | |||
| Banking, Financial Services and Insurance (BFSI) | |||
| Automotive and Manufacturing | |||
| Hospitality and Tourism | |||
| Government and Public Sector | |||
| Other Industry Verticals | |||
| By Geography | North America | United States | |
| Canada | |||
| Mexico | |||
| South America | Brazil | ||
| Argentina | |||
| Rest of South America | |||
| Europe | Germany | ||
| United Kingdom | |||
| France | |||
| Italy | |||
| Spain | |||
| Russia | |||
| Rest of Europe | |||
| Asia Pacific | China | ||
| Japan | |||
| India | |||
| South Korea | |||
| Australia | |||
| Rest of Asia Pacific | |||
| Middle East and Africa | Middle East | United Arab Emirates | |
| Saudi Arabia | |||
| Turkey | |||
| Rest of Middle East | |||
| Africa | South Africa | ||
| Nigeria | |||
| Kenya | |||
| Rest of Africa | |||
Key Questions Answered in the Report
What CAGR will the telecom service assurance market record between 2025 and 2030?
The market is projected to grow at a 10.04% CAGR over 2025-2030.
Which region will expand the fastest through 2030?
Asia Pacific will lead growth at a 12.41% CAGR because of widespread 5G rollouts and Industry 4.0 initiatives.
Which solution category held the largest revenue in 2024?
Performance Monitoring and Analytics led with 35.12% share.
Performance Monitoring and Analytics led with 35.12% share.
Enterprise private-5G deployments require dedicated monitoring, driving a 13.12% CAGR in that customer segment.
How are hyperscaler alliances influencing product design?
Partnerships with AWS, Google Cloud, and Azure push open-API, cloud-native architectures that integrate assurance into DevOps pipelines.
What compliance trends are shaping spending priorities?
What compliance trends are shaping spending priorities?
Page last updated on:

