Smart Water Meter Market Size and Share
Market Overview
| Study Period | 2019 - 2030 |
|---|---|
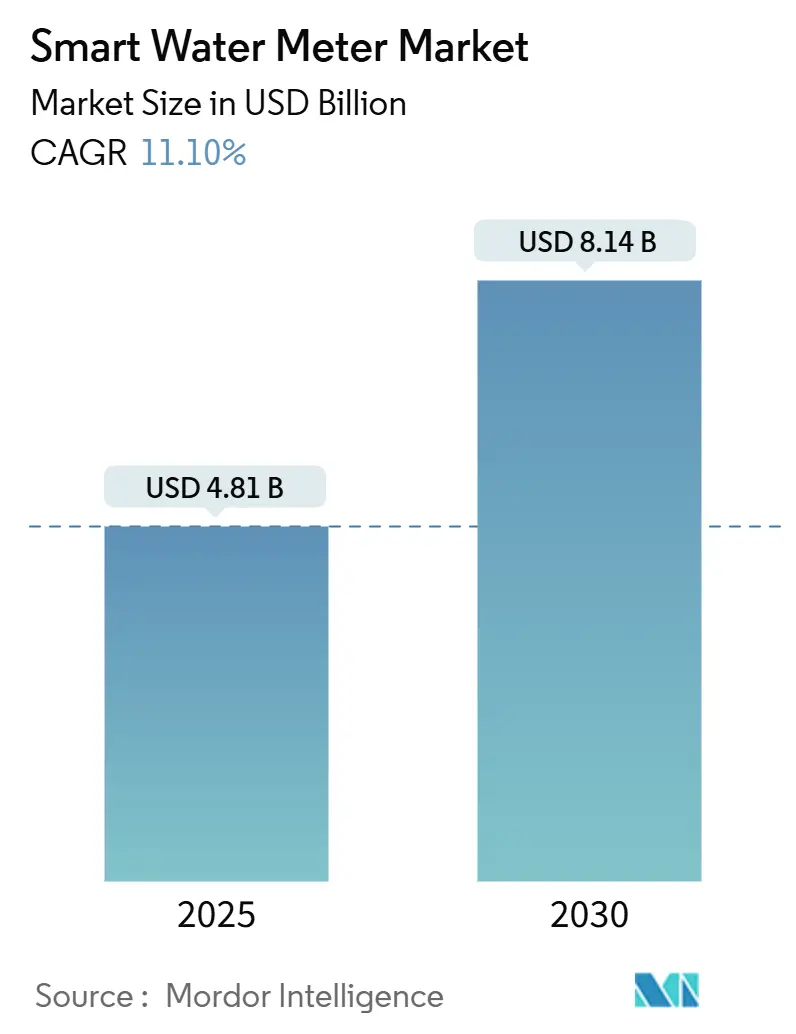
| Market Size (2025) | USD 4.81 Billion |
| Market Size (2030) | USD 8.14 Billion |
| Growth Rate (2025 - 2030) | 11.10% CAGR |
| Fastest Growing Market | Asia Pacific |
| Largest Market | Europe |
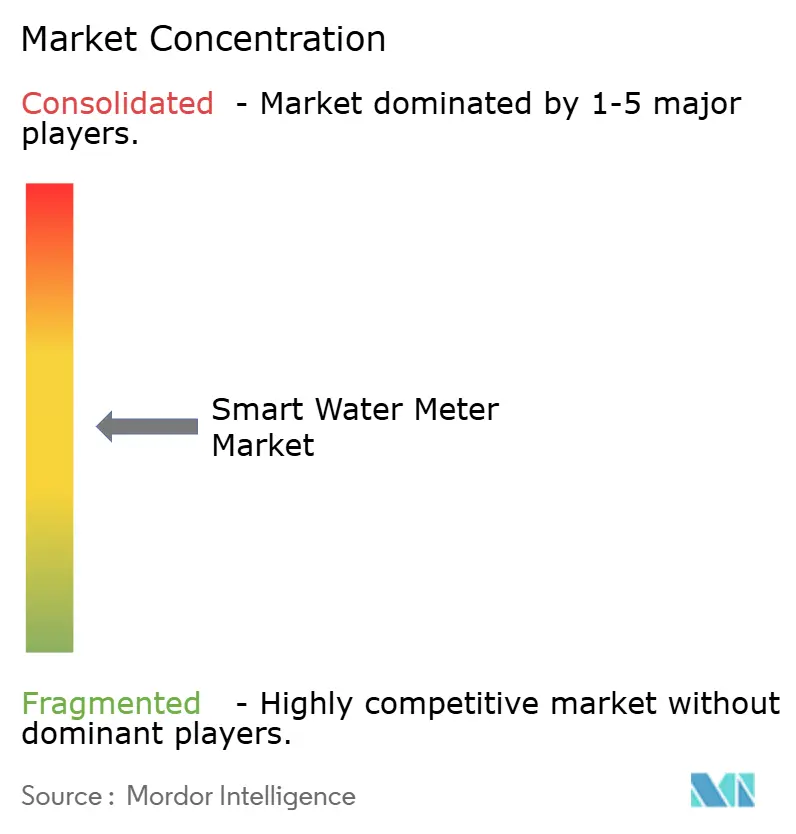
| Market Concentration | Medium |
Major Players
*Disclaimer: Major Players sorted in no particular order Image © Mordor Intelligence. Reuse requires attribution under CC BY 4.0. |
|
Smart Water Meter Market Analysis by Mordor Intelligence
The Smart Water Meter market size reached USD 4.81 billion in 2025 and is projected to climb to USD 8.14 billion by 2030, reflecting an 11.1% CAGR over the forecast period. Utilities continue to migrate from mechanical meters to connected devices that enable real-time monitoring, automated billing, and data-driven leak detection. Regulatory mandates for conservation, mounting pressure to replace aging distribution assets, and the expansion of Internet of Things platforms combine to accelerate adoption across utility classes. Vendor competition centers on integrating analytics and two-way communications while maintaining a favorable total cost of ownership. Expanding financing options, such as pay-as-you-save models, and performance-based regulation that rewards verified water-loss reduction, further strengthen demand pipelines in developed and emerging economies.
Key Report Takeaways
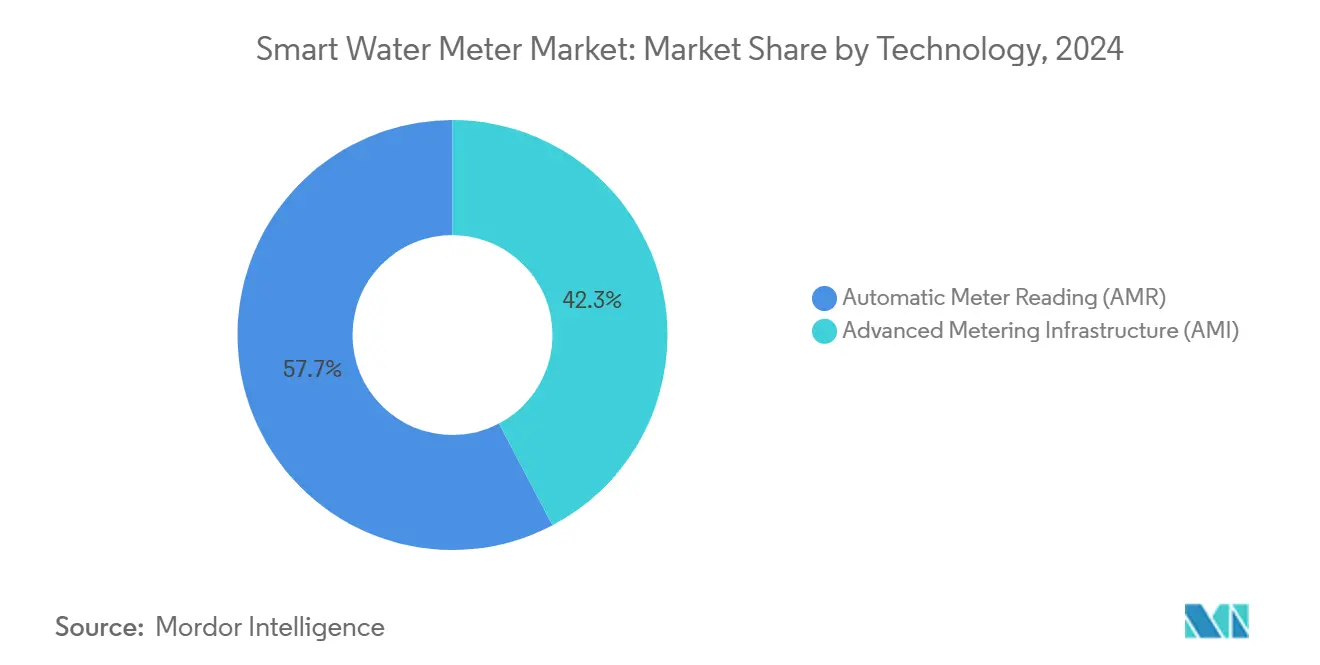
- By technology, Automatic Meter Reading captured 57.7% of the Smart Water Meter market share in 2024, while Advanced Metering Infrastructure is forecast to expand at an 11.9% CAGR through 2030.
- By application, residential deployments held 58.4% of the Smart Water Meter market size in 2024; commercial deployments are advancing at a 12.2% CAGR to 2030.
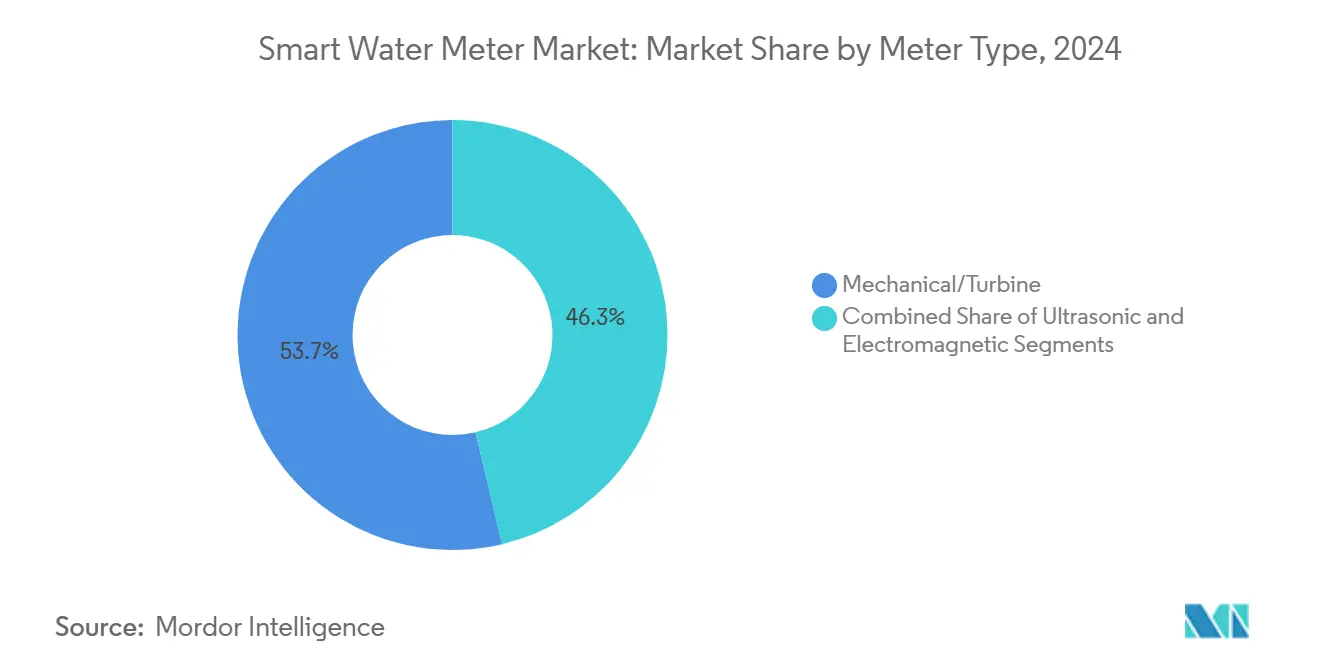
- By meter type, mechanical and turbine units accounted for 53.7% of the Smart Water Meter market share in 2024, yet ultrasonic meters are growing at a 12.3% CAGR over the same period.
- By communication technology, proprietary RF systems led with 49.2% revenue share of the Smart Water Meter market in 2024, while cellular protocols record the highest projected CAGR at 12.6% through 2030.
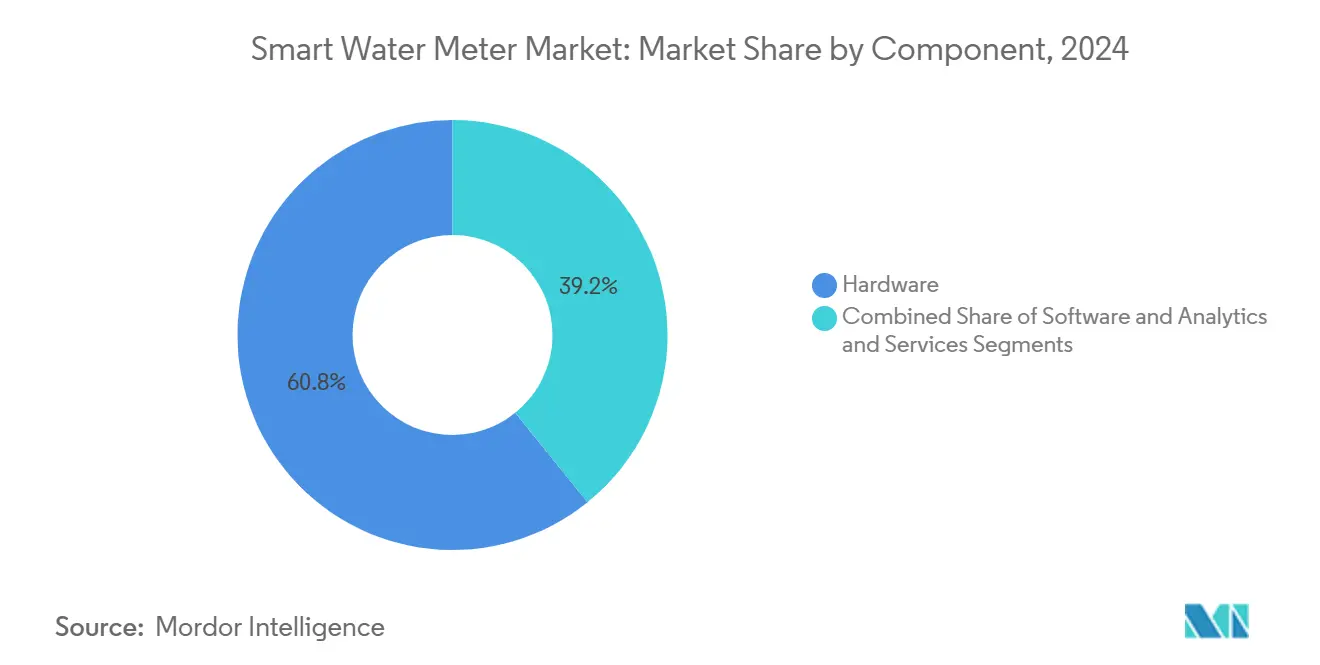
- By component, hardware represented 60.8% of the Smart Water Meter market size in 2024, whereas the software and analytics segments register a 12% CAGR to 2030.
- By deployment, retrofit programs held a 64.1% share of the Smart Water Meter market in 2024; new installations are set to increase at an 11.8% CAGR to 2030.
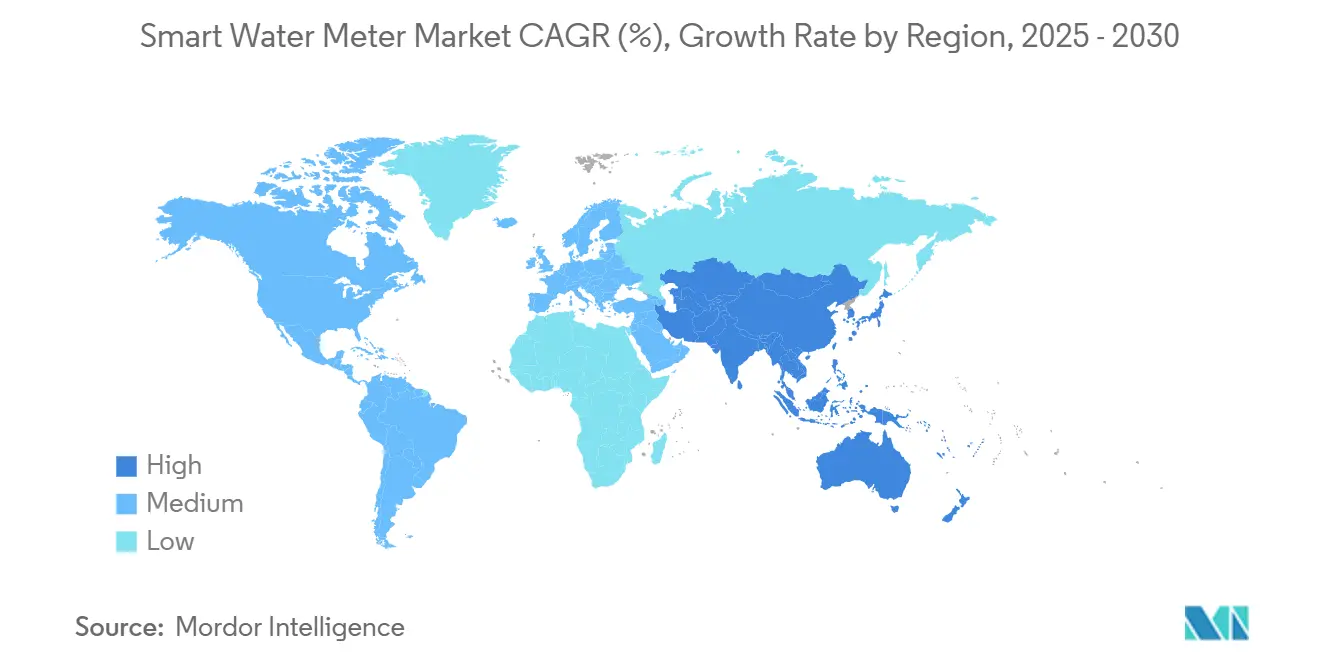
- By geography, Europe commanded 36.46% revenue share of the Smart Water Meter market in 2024; Asia-Pacific is the fastest-growing region at a 12.4% CAGR through 2030.
Global Smart Water Meter Market Trends and Insights
Drivers Impact Analysis
| Driver | (~) % Impact on CAGR Forecast | Geographic Relevance | Impact Timeline |
|---|---|---|---|
| Supportive government regulations | +2.8% | Global, with strongest influence in Europe and North America | Medium term (2-4 years) |
| Need to improve water-use efficiency | +2.4% | Global, with acute impact in water-stressed regions like MENA and Australia | Long term (≥ 4 years) |
| Reducing non-revenue water (NRW) losses | +2.1% | Global, with highest impact in developing markets across Asia-Pacific and Latin America | Medium term (2-4 years) |
| Smart-city and IoT platform integration | +1.9% | APAC core markets, spill-over to Europe and North America | Long term (≥ 4 years) |
| Pay-as-you-save financing models | +1.2% | North America and Europe, expanding to emerging markets | Short term (≤ 2 years) |
| Drought-driven conservation mandates | +1.6% | Regional focus on California, Australia, South Africa, and Mediterranean Europe | Short term (≤ 2 years) |
| Source: Mordor Intelligence | |||
Supportive Government Regulations
Mandatory deployment timelines and water-efficiency standards push utilities toward advanced metering solutions that satisfy compliance and reporting needs. The EU Drinking Water Directive requires end-to-end monitoring, prompting Germany and France to stipulate smart meters in all new constructions and major renovations. [1]Xylem, “Anglian Water Continues Rollout with Sensus Smart Meters Through 2030,” xylem.com California’s permanent water-use rules demand granular data for enforcement, making AMI rollouts a prerequisite for funding eligibility. [2]Government Websites by CivicPlus, “Residential Water Meter Replacement Program and Reading System Upgrade,” sanluisaz.gov Utilities gain cost recovery mechanisms when they document water-loss cuts and customer engagement improvements, which lowers investment risk and supports full-territory deployments. Vendors benefit from volume orders that reduce per-unit costs, while policymakers secure transparent performance metrics to track conservation progress. Across municipal, regional, and national levels, regulation underwrites the long-term certainty needed for widespread Smart Water Meter market adoption.
Need to Improve Water-Use Efficiency
Utilities in water-scarce regions adopt connected meters to identify high-consumption patterns and empower customers with hourly data that supports behavioral changes. Industrial facilities using continuous telemetry report 20–30% consumption cuts after pinpointing leaks and optimizing processes. [3]Veolia Water Technologies & Solutions, “Veolia Takes Artificial Intelligence Deployment to the Next Level,” watertechnologies.com Agricultural pilots that combine soil-moisture sensing with weather-based scheduling record up to 28% savings, demonstrating cross-sector utility. Efficiency gains also yield energy savings because water production and pumping constitute large operational expenses. Analytics applications forecast demand, allowing utilities to flatten peaks and defer capacity expansion. As utilities tie conservation to revenue decoupling, efficiency gains translate into stable financial performance and propel the Smart Water Meter market forward.
Reducing Non-Revenue Water Losses
Smart meters feed distribution-network models that balance inflows and billed volumes, exposing hidden leaks, theft, and meter tampering. Yorkshire Water’s LoRaWAN deployment covering 1.3 million endpoints posted measurable drops in real-loss volumes and boosted customer experience. Predictive algorithms flag anomalies, enabling utilities to reduce non-revenue water by 10–15% through rapid leak response. Cost reductions extend to lower treatment volumes and energy use, improving the economic case for large-scale rollouts. Data integration with GIS and mobile workforce software helps prioritize repairs by financial impact, streamlining crew assignments, and shortening outage windows. Performance improvements feed into regulatory scorecards, reinforcing the business case for the Smart Water Meter market.
Smart-City and IoT Platform Integration
Urban digitization programs in China, Singapore, and Western Europe are embedding water metering within broader IoT architectures that also oversee energy, traffic, and environment. Low-power wide-area protocols such as NB-IoT and LoRaWAN support battery-operated meters, delivering near-real-time data without costly site power. Edge computing at the endpoint enables local decision-making, including automated shut-off when catastrophic leaks occur. Customer portals merge water and energy dashboards, improving transparency and bill accuracy. Open-standard architectures limit vendor lock-in and encourage scalable, interoperable networks. As smart-city funding pools grow, water utilities gain access to new capital sources, further expanding the Smart Water Meter market.
Restraints Impact Analysis
| Restraint | (~) % Impact on CAGR Forecast | Geographic Relevance | Impact Timeline |
|---|---|---|---|
| High upfront costs and cybersecurity risks | -1.8% | Global, with acute impact in developing markets and small utilities | Short term (≤ 2 years) |
| Systems-integration complexity | -1.4% | North America and Europe, where legacy infrastructure is prevalent | Medium term (2-4 years) |
| Shortage of utility data-analytics talent | -0.9% | Global, with particular challenges in rural and developing regions | Long term (≥ 4 years) |
| Battery-life limits in ultrasonic units | -0.7% | Regional impact in extreme climate zones and remote deployment areas | Medium term (2-4 years) |
| Source: Mordor Intelligence | |||
High Upfront Costs and Cybersecurity Risks
Full AMI rollouts cost USD 200–400 per endpoint, challenging utilities with tight capital budgets. Rate-case approvals can stretch over several years, delaying project start dates. Cybersecurity countermeasures, encryption, intrusion detection, and 24-hour monitoring raise the total project expense by an additional 15–25%. [4]DLT, “AI for Water: 10 Ways AI Is Changing the Water Industry,” dlt.com Smaller systems, especially in developing economies, often defer investments without concessional finance. High-profile cyber incidents intensify regulatory scrutiny, further elevating compliance costs. These factors collectively weigh on Smart Water Meter market growth until financing mechanisms mature and security frameworks standardize.
Systems-Integration Complexity
Legacy billing and customer information platforms frequently lack the interfaces needed to ingest 15-minute interval data. Utilities report 20–40% budget overruns when middleware upgrades and workforce training are underestimated. Inconsistent communication standards add interoperability headaches, forcing utilities to lock into single-vendor ecosystems or fund costly custom development. Change-management burdens slow deployment velocity and temporarily distract operational staff from core service delivery, constraining Smart Water Meter market momentum in mature regions.
Segment Analysis
By Technology: AMI Gains Ground Despite AMR Dominance
Automatic Meter Reading systems accounted for 57.7% of Smart Water Meter market share in 2024, reflecting their entrenched base and cost-efficient one-way data transmission. Many utilities adopt AMR during early modernization phases because drive-by collection sharply reduces manual labor without extensive network build-out. The Smart Water Meter market size attached to AMR remains large, yet its growth moderates as second-generation rollouts favor two-way architectures.
Advanced Metering Infrastructure records an 11.9% CAGR to 2030 as utilities seek real-time leak alerts, remote disconnect, and time-variant pricing schemes. Cellular, NB-IoT, and LoRaWAN modules drop in cost, erasing a key barrier to AMI adoption. Service providers package meters, analytics, and software subscriptions, distributing capital costs over operating budgets. Data-rich AMI platforms integrate easily with conservation programs, accelerating regional penetration and widening the Smart Water Meter market.
By Application: Commercial Sector Drives Innovation
Residential deployments formed 58.4% of the Smart Water Meter market size in 2024 after multiple European and North American mandates required smart meters for new housing. Consumers benefit from usage portals that connect conservation goals to tangible savings, sustaining stable replacement cycles.
Commercial buildings show the fastest uptake at a 12.2% CAGR, propelled by facility-management software that pairs water, energy, and HVAC data. High-rise real-estate owners justify investment through lower operating expenses and green-building certifications. Retail chains and hospitality groups apply analytics to benchmark sites, uncover concealed leaks, and optimize irrigation. As sustainability reporting frameworks tighten, enterprise users expand deployments, bolstering overall Smart Water Meter market growth.
By Meter Type: Ultrasonic Technology Gains Momentum
Mechanical and turbine devices held 53.7% Smart Water Meter market share in 2024, owing to mature supply chains and lower acquisition prices. Utilities value their familiarity and proven durability in broad service environments.
Ultrasonic meters are projected to grow 12.3% per year as accuracy at low flow rates improves billing fidelity and customer trust. With no moving parts, ultrasonic models reduce maintenance truck rolls and extend service life, important factors in remote networks. Enhanced battery chemistry mitigates earlier life-span concerns, making the technology more viable for mass deployment. These benefits expand addressable opportunity and contribute to Smart Water Meter market advancement.
Note: Segment shares of all individual segments available upon report purchase
By Communication Technology: Cellular Protocols Lead Growth
Proprietary radio networks retained a 49.2% revenue share in 2024 because many AMR systems employ fixed or drive-by RF. Utilities appreciate predictable performance and long‐range capabilities in rural settings.
Cellular NB-IoT and LTE-M solutions post a 12.6% CAGR due to global coverage, managed security layers, and standards-based hardware. Operators offer utility-focused data plans that lower lifetime connectivity costs. Over-the-air firmware updates and robust encryption simplify operations and harden security posture, pushing utilities to favor cellular in fresh bids. LoRaWAN continues to gain ground in low-density regions that lack reliable cellular footprints, ensuring multiple paths for Smart Water Meter market expansion.
By Component: Software Analytics Drive Value Creation
Hardware still represents 60.8% of the Smart Water Meter market size, covering meters, antennas, and installation kits. Tight supply chains and ongoing replacement programs sustain stable shipment volumes.
Software and analytics climb at a 12% CAGR to 2030 as utilities monetize data through leak alarms, personalized alerts, and predictive maintenance. Subscription-based dashboards generate recurring revenues that offset initial capital outlays. Artificial-intelligence algorithms surfacing within cloud platforms now flag anomalous consumption and recommend proactive asset interventions, positioning analytics as the critical differentiator in vendor portfolios and spurring Smart Water Meter market momentum.
Note: Segment shares of all individual segments available upon report purchase
By Deployment: New Installations Accelerate
Retrofit projects accounted for 64.1% of the Smart Water Meter market in 2024, driven by mandated replacements of aging mechanical infrastructure across OECD countries. Upgrade programs often bundle meters with ancillary pressure and quality sensors for holistic asset insights.
New installations grow at 11.8% annually as greenfield developments in Asia-Pacific and the Middle East specify smart infrastructure from day one. Developers capitalize on bundled energy-water packages to meet sustainability codes and enhance property values. In Latin America, concession models fund complete network rollouts, bypassing legacy systems entirely. These dynamics broaden the Smart Water Meter market scope beyond replacement cycles.
Geography Analysis
Europe dominated the Smart Water Meter market with 36.46% revenue share in 2024, anchored by EU directives that compel water-loss tracking and transparent billing. National implementation roadmaps guarantee steady tender pipelines, and long-term vendor frameworks streamline procurement. Utilities also tap recovery funds targeting climate resilience, accelerating district-wide AMI deployments that underpin stable regional demand.
Asia-Pacific registers the fastest expansion, clocking a 12.4% CAGR to 2030. China’s extensive smart-city pilots embed metering within neighborhood digital twins, while India’s Jal Jeevan Mission finances rural connections that include smart endpoints. Southeast Asian economies such as Indonesia and Vietnam upgrade legacy assets concurrently with rapid urbanization, avoiding sunk costs tied to older technologies. Government grants, multilateral loans, and public-private partnerships combine to scale installations and enlarge the Smart Water Meter market.
North America benefits from aging infrastructure replacement and statewide conservation mandates. California utilities deploy AMI to enforce per-capita usage limits and to support wildfire resilience through remote shut-off capabilities. Canada advances province-level modernization programs focusing on non-revenue water recovery, adding incremental growth. Latin America’s concession tenders in Brazil signal sizable upcoming opportunities, while Middle East and Africa utilities leverage smart meters to address scarcity and reduce theft, though deployment progress varies by funding availability and communication-network readiness.
Competitive Landscape
The Smart Water Meter market remains moderately fragmented, with leading firms such as Itron, Badger Meter, and Xylem-Sensus vying alongside regional manufacturers and IoT specialists. Top players deliver complete stacks of hardware, communications, and cloud analytics that reduce integration risk for utilities. Recent consolidation illustrates a pivot toward data-centric offerings: Badger Meter’s USD 185 million SmartCover buy injected advanced leak-detection software into its portfolio, while Xylem folded Idrica’s analytics platform into Sensus to deepen predictive insights.
Competitive focus now lies in artificial-intelligence algorithms that convert meter telemetry into actionable maintenance and customer engagement outputs. Companies highlight time-to-value metrics, showcasing pilot projects where utilities recovered double-digit non-revenue water percentages or shaved peak-hour treatment energy. Component miniaturization and battery innovations serve as additional differentiators, especially in remote deployments without easy service access.
Regional entrants carve niches by customizing low-cost ultrasonic units or localized cloud dashboards to specific tariff structures. Interoperability certifications gain importance as utilities insist on open standards to avoid vendor lock-in. Market positioning also hinges on financing support; vendors offering pay-as-you-save or outcome-based contracts penetrate small-to-mid-size utilities that previously lacked capital for full AMI rollouts. These competitive dynamics continue to broaden the overall Smart Water Meter market.
Smart Water Meter Industry Leaders
-
Arad Ltd.
-
Badger Meter Inc.
-
Itron Inc.
-
Sensus USA Inc. (Xylem Inc.)
-
Kamstrup A/S
- *Disclaimer: Major Players sorted in no particular order
Recent Industry Developments
- September 2025: San Luis, Arizona, completed a USD 2.76 million NextGen Meter Project replacing 5,000 mechanical units with ultrasonic AMI devices that feed real-time customer portals and leak detection.
- March 2025: Xylem Vue released its Water Technology Trends 2025 report, highlighting AI-powered anomaly detection.
- February 2025: Tambaram City, India, tendered INR 4.06 crore (USD 4.9 million) for a 1.50 MLD plant with smart monitoring.
- January 2025: Cuyahoga Falls, Ohio, began a citywide NextGen Meter Project with integrated water-electric AMI.
- November 2024: Itron upgraded 25,000 Tennessee meters to ultrasonic smart devices, reporting a 10% revenue lift through billing accuracy gains.
Global Smart Water Meter Market Report Scope
Smart water meters are devices used to measure the quantity/volume of water passing through a supply pipeline/outlet, which may include the primary water supply pipeline for an entire facility or a sub-zone. Measurements can be done in units, including cubic feet or gallons, among others.
The smart water metering market is segmented by technology (automatic meter reading, advanced metering infrastructure), by application (residential, commercial, industrial), and by geography (North America, Europe, Asia-Pacific, Latin America, Middle East, and Africa). The market sizes and forecasts are provided in terms of value (USD) for all the above segments.
| Automatic Meter Reading (AMR) |
| Advanced Metering Infrastructure (AMI) |
| Residential |
| Commercial |
| Industrial |
| Agricultural |
| Mechanical / Turbine |
| Ultrasonic |
| Electromagnetic |
| Radio-frequency (Proprietary RF) |
| LoRaWAN / Other LPWAN |
| Cellular (NB-IoT/LTE-M) |
| Wired (M-Bus/Ethernet) |
| Hardware |
| Software and Analytics |
| Services |
| New Installations |
| Retrofit / Replacement |
| North America | United States | |
| Canada | ||
| Mexico | ||
| South America | Brazil | |
| Argentina | ||
| Chile | ||
| Rest of South America | ||
| Europe | Germany | |
| United Kingdom | ||
| France | ||
| Italy | ||
| Spain | ||
| Rest of Europe | ||
| Asia-Pacific | China | |
| India | ||
| Japan | ||
| South Korea | ||
| Malaysia | ||
| Singapore | ||
| Australia | ||
| Rest of Asia-Pacific | ||
| Middle East and Africa | Middle East | United Arab Emirates |
| Saudi Arabia | ||
| Turkey | ||
| Rest of Middle East | ||
| Africa | South Africa | |
| Nigeria | ||
| Rest of Africa | ||
| By Technology | Automatic Meter Reading (AMR) | ||
| Advanced Metering Infrastructure (AMI) | |||
| By Application | Residential | ||
| Commercial | |||
| Industrial | |||
| Agricultural | |||
| By Meter Type | Mechanical / Turbine | ||
| Ultrasonic | |||
| Electromagnetic | |||
| By Communication Technology | Radio-frequency (Proprietary RF) | ||
| LoRaWAN / Other LPWAN | |||
| Cellular (NB-IoT/LTE-M) | |||
| Wired (M-Bus/Ethernet) | |||
| By Component | Hardware | ||
| Software and Analytics | |||
| Services | |||
| By Deployment | New Installations | ||
| Retrofit / Replacement | |||
| By Geography | North America | United States | |
| Canada | |||
| Mexico | |||
| South America | Brazil | ||
| Argentina | |||
| Chile | |||
| Rest of South America | |||
| Europe | Germany | ||
| United Kingdom | |||
| France | |||
| Italy | |||
| Spain | |||
| Rest of Europe | |||
| Asia-Pacific | China | ||
| India | |||
| Japan | |||
| South Korea | |||
| Malaysia | |||
| Singapore | |||
| Australia | |||
| Rest of Asia-Pacific | |||
| Middle East and Africa | Middle East | United Arab Emirates | |
| Saudi Arabia | |||
| Turkey | |||
| Rest of Middle East | |||
| Africa | South Africa | ||
| Nigeria | |||
| Rest of Africa | |||
Key Questions Answered in the Report
How large is the Smart Water Meter market in 2025?
The Smart Water Meter market size stands at USD 4.81 billion in 2025 with an 11.1% growth trajectory to 2030.
Which region grows fastest in smart water metering?
Asia-Pacific leads growth at a 12.4% CAGR thanks to smart-city investments in China and rural expansion programs in India.
What technology segment is expanding most rapidly?
Advanced Metering Infrastructure posts the highest growth, rising at 11.9% per year as utilities seek two-way communications.
Why are utilities adopting ultrasonic meters?
Ultrasonic units provide higher low-flow accuracy and lower maintenance, enabling utilities to improve billing precision and cut service costs.
What is a key barrier to wider deployment?
Up-front capital and added cybersecurity expenses pose the biggest challenges, especially for small or resource-constrained utilities.
Page last updated on:

