Liquid Biofuels Market Size and Share
Market Overview
| Study Period | 2020 - 2030 |
|---|---|
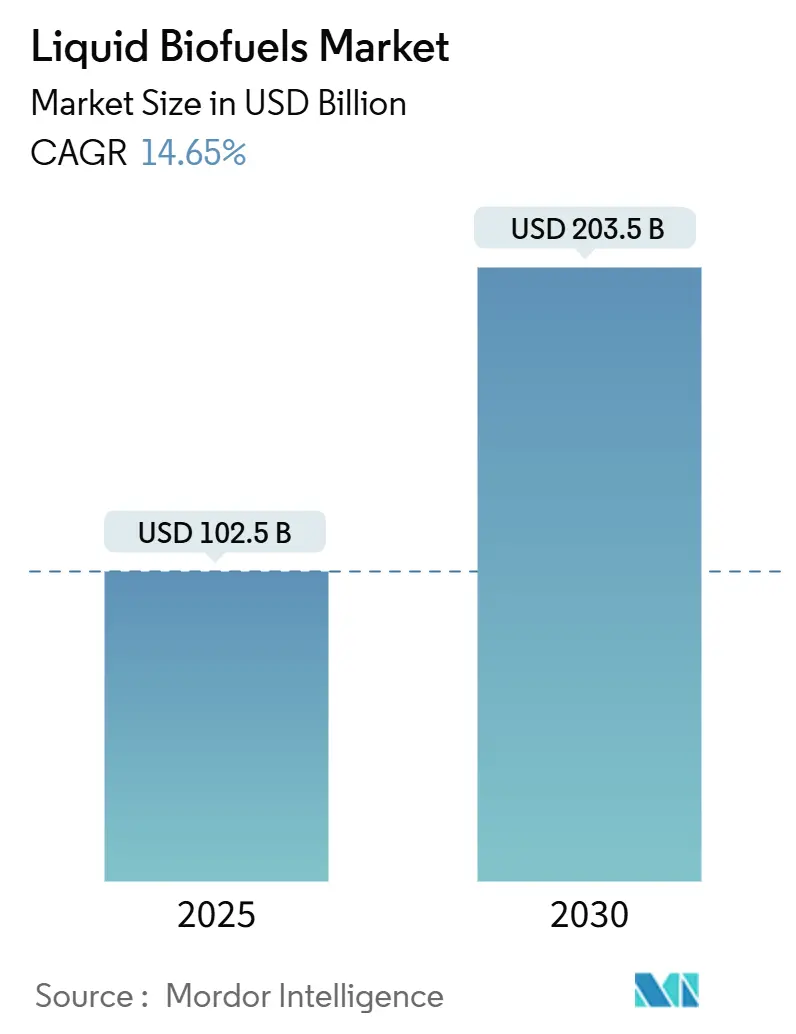
| Market Size (2025) | USD 102.5 Billion |
| Market Size (2030) | USD 203.5 Billion |
| Growth Rate (2025 - 2030) | 14.65% CAGR |
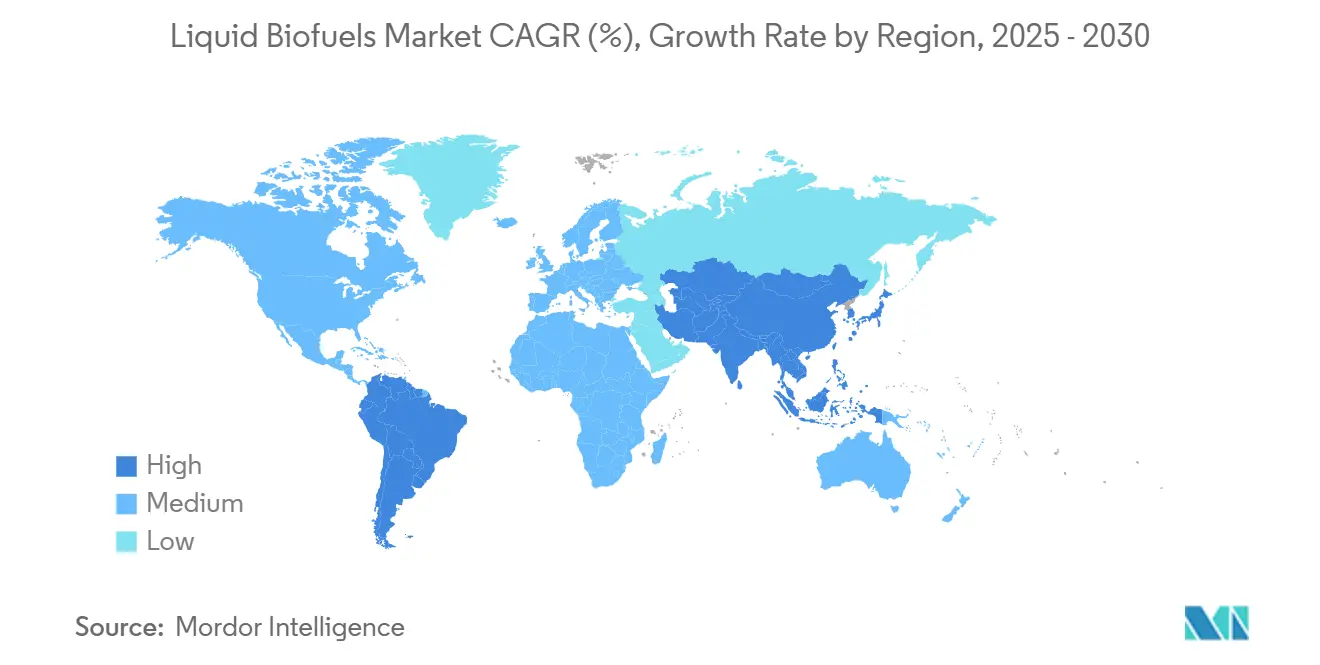
| Fastest Growing Market | Asia Pacific |
| Largest Market | North America |
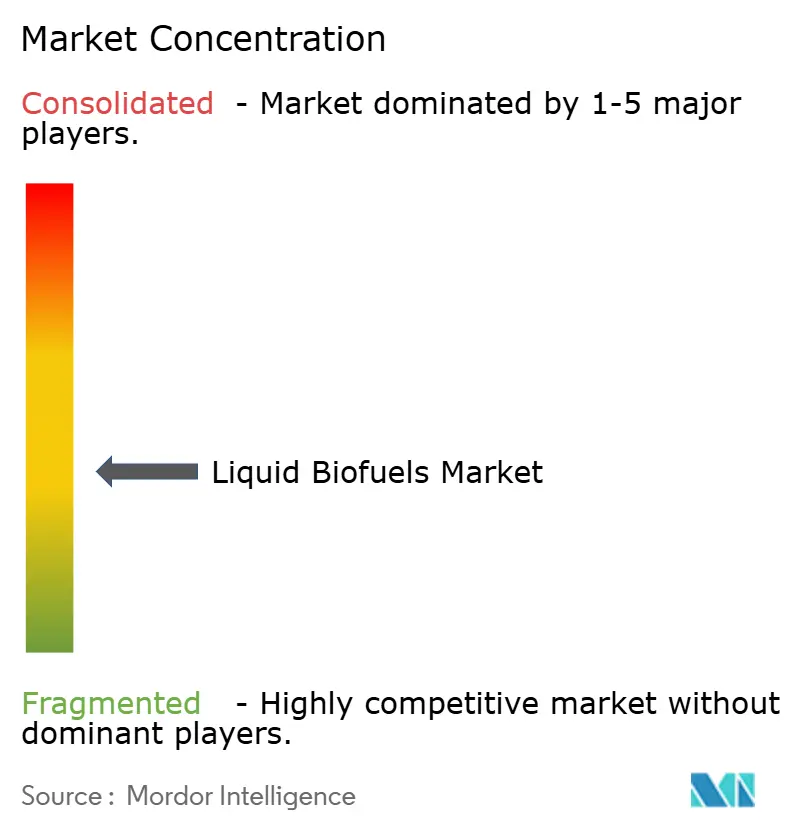
| Market Concentration | Medium |
Major Players
*Disclaimer: Major Players sorted in no particular order Image © Mordor Intelligence. Reuse requires attribution under CC BY 4.0. |
|
Liquid Biofuels Market Analysis by Mordor Intelligence
The Liquid Biofuels Market size is estimated at USD 102.5 billion in 2025, and is expected to reach USD 203.5 billion by 2030, at a CAGR of 14.65% during the forecast period (2025-2030).
Strong policy mandates, rising aviation decarbonization commitments, and rapid gains in conversion efficiency underpin this expansion. Government blending targets in the United States, Brazil, India, and the European Union stimulate steady offtake, while Sustainable Aviation Fuel (SAF) premiums enhance producer margins. Feedstock diversification toward waste oils and algae hedges against commodity volatility, and retrofit investments enable conventional refiners to pivot into the renewable value chain. Market opportunities coalesce around corporate power-purchase agreements, carbon-intensity credits, and integrated biorefinery platforms that monetize multiple coproducts. Competitive strategies are increasingly centered on securing long-term feedstock, locking in aviation offtake, and deploying modular technology packages that reduce capital costs and increase uptime across distributed assets.
Key Report Takeaways
- By type, bioethanol led the Global Liquid Biofuels market with a 62.2% share in 2024; SAF is projected to record the fastest growth, at a 37.6% CAGR, through 2030.
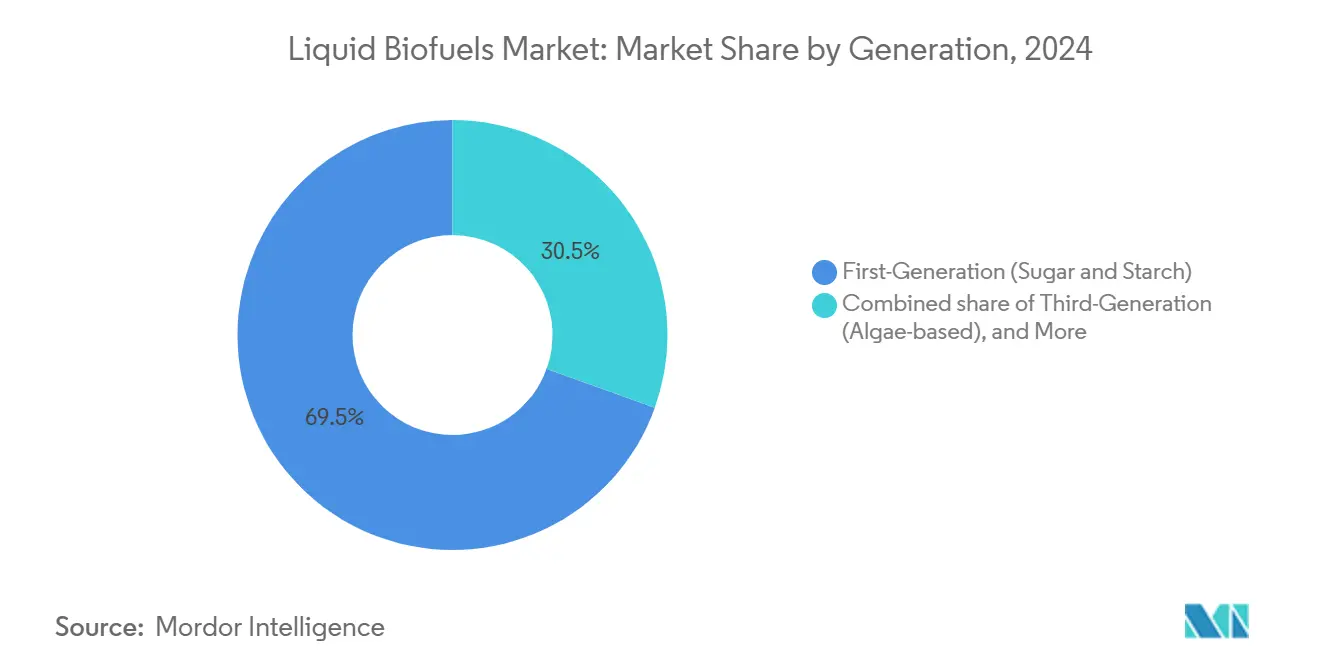
- By generation, first-generation fuels commanded a 69.5% share of the Global Liquid Biofuels market size in 2024, while third-generation algae pathways are expected to expand at a 17.9% CAGR to 2030.
- By feedstock, sugar crops held 38.1% of 2024 revenues; algae feedstock utilization is set to grow at a 19.1% CAGR.
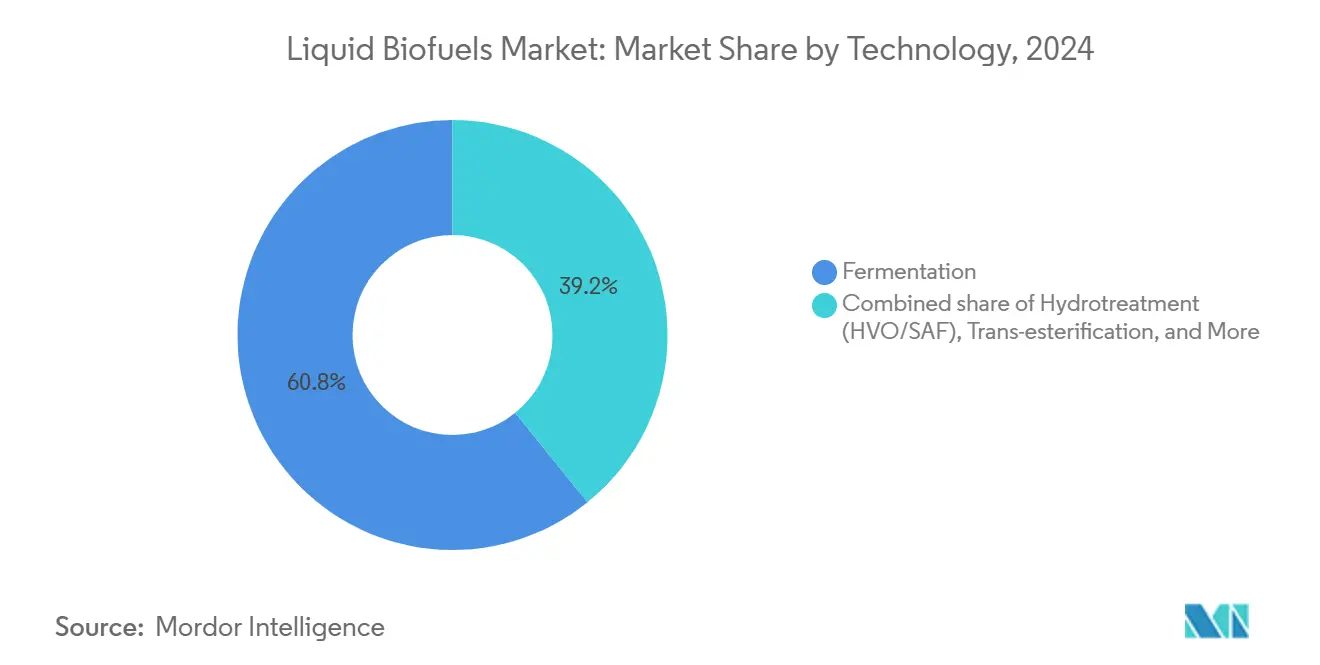
- By technology, fermentation accounted for a 60.8% share in 2024, whereas hydrotreatment processes are forecast to rise at a 20.0% CAGR.
- By end-use sector, road transport accounted for 88.4% of demand in 2024; aviation consumption is projected to advance at a 37.9% CAGR to 2030.
- By geography, North America contributed 42.3% of the revenue in 2024; the Asia-Pacific region is poised for the strongest 18.6% CAGR through 2030.
Global Liquid Biofuels Market Trends and Insights
Drivers Impact Analysis
| Driver | (~) % Impact on CAGR Forecast | Geographic Relevance | Impact Timeline |
|---|---|---|---|
| Government mandates & blending targets | 3.20% | Global with highest effect in EU, US, Brazil | Medium term (2-4 years) |
| Volatility in crude oil prices | 1.80% | Global, most visible in net-importing regions | Short term (≤ 2 years) |
| Technological advances in conversion efficiency | 2.10% | North America & EU leadership, APAC scaling | Long term (≥ 4 years) |
| Rising demand for Sustainable Aviation Fuel | 4.30% | Major aviation hubs across North America & EU | Medium term (2-4 years) |
| Corporate biofuel PPAs for logistics fleets | 1.90% | North America, EU, expanding into APAC | Medium term (2-4 years) |
| Carbon-intensity premiums in voluntary carbon markets | 1.20% | California, EU and global corporate markets | Long term (≥ 4 years) |
| Source: Mordor Intelligence | |||
Government Mandates & Blending Targets
Legislated blending schedules now convert aspirational targets into binding compliance obligations. The EU ReFuelEU rule sets SAF volumes that climb from 2% in 2025 toward 70% in 2050, while the U.S. Renewable Fuel Standard holds a 36 billion-gallon ceiling to 2030. Brazil’s “Fuel of the Future” pushes 27% ethanol in gasoline by 2027, and India accelerates to 20% blending by 2025. These mandates create predictable demand pools that buffer producers from fossil-fuel price swings and underpin forward pricing for compliance-grade barrels.[1]Editorial Board, “Brazil’s Fuel of the Future Mandate,” advancedbiofuelsusa.org
Volatility in Crude Oil Prices
Brent price swings above USD 80 per barrel widen renewable parity windows, allowing HVO and SAF to compete without subsidies. Higher oil values elevate agricultural input costs, yet they also lift the reference price that determines wholesale fuel spreads. Producers hedge by signing multi-year offtake deals with airlines and logistics operators, effectively fixing minimum price floors that cushion margin risk. As carbon pricing matures, the traditional link between crude and biofuels weakens, allowing renewables to capture independent low-carbon premiums.[2]Research Office, “Biofuel Economics under Oil Volatility,” dtu.dk
Technological Advances in Conversion Efficiency
Enzymatic breakthroughs now convert used cooking oil into drop-in fuels with 1,000-fold activity gains, while hydrothermal liquefaction yields reach 86% biocrude from mixed biomass. Machine-learning catalyst tuning trims process heat loads, and microbial strain monitoring raises ethanol yields by 5%, adding USD 1.6 billion in annual revenue potential.[3]Staff Writer, “Enzyme Breakthrough Boosts Biofuels,” sciencedaily.com These improvements unlock non-food residues, municipal waste, and algae as viable feedstocks, enhancing resilience against crop price cycles and land-use constraints.
Rising Demand for Sustainable Aviation Fuel
Airlines face binding targets under CORSIA and EU ETS revisions, prompting long-dated procurement. Southwest Airlines has committed to 680 million gallons from USA BioEnergy’s Texas plant, where renewable jet fuel sells at double to triple the price of conventional kerosene while cutting lifecycle emissions by 80%.[4]News Desk, “Southwest Signs 680 Mgal SAF Pact,” digitalrefining.com Energy majors are now redirecting refinery hydrotreaters toward SAF, with 43 projects slated to add 286,000 barrels per day (b/d) by 2030.
Restraints Impact Analysis
| Restraint | (~) % Impact on CAGR Forecast | Geographic Relevance | Impact Timeline |
|---|---|---|---|
| Feedstock competition with food & livestock | -2.10% | Global, acute in grain-exporting regions | Medium term (2-4 years) |
| High capex for advanced biofuel facilities | -1.80% | Global, most restrictive in emerging markets | Long term (≥ 4 years) |
| Land-use change risk under EU deforestation rules | -1.30% | EU imports and connected supply chains | Medium term (2-4 years) |
| Enzyme supply bottlenecks for cellulosic ethanol | -0.90% | North America & EU facilities | Short term (≤ 2 years) |
| Source: Mordor Intelligence | |||
Feedstock Competition with Food & Livestock
Rising biofuel demand intensifies pressure on grain prices, with the corn and soybean markets particularly vulnerable to diversion shocks. Analyses suggest that food prices could rise 16-171% per exajoule of renewable fuel produced, and drought-year shortfalls exacerbate the tension between energy security and food access. Advanced pathways that tap into residues or algae ease the conflict but remain costlier and less mature.
High Capex for Advanced Biofuel Facilities
Commercial SAF units require USD 3–6 of capital per annual gallon, translating to USD 2–4 billion for 500 million-gallon plants. Financing hurdles are growing in risk-averse credit markets, making strong balance sheets and sovereign loan guarantees increasingly critical. Retrofitting legacy refineries reduces capital expenditure intensity, favoring integrated energy firms over pure-play start-ups.
Segment Analysis
By Type: SAF Drives Premium Fuel Transition
Bioethanol retained 62.2% of 2024 volumes yet posts modest growth as mature mandates plateau. SAF, in contrast, surges at a 37.6% CAGR on the back of airline net-zero pledges, carbon-pricing tailwinds, and security-of-supply concerns that justify multi-year contracts tied to inflation-indexed floors. Hydrotreatment and alcohol-to-jet pathways enable refiners to quickly switch lineups, channeling capital to the highest-margin aviation barrels. Biodiesel remains steady in captive regional markets, with renewable diesel (HVO) capturing fleet conversions where infrastructure compatibility is a key factor.
Investors funnel funds into flexible assets that can toggle among jet, diesel, and naphtha cuts. LanzaJet’s alcohol-to-jet platform leverages existing ethanol plants, while Comstock Fuels’ lignin route projects 63 billion gallons of potential SAF output by 2040. Such modularity allows operators to chase seasonally shifting spreads, supporting consistently higher utilizations across the Global Liquid Biofuels market.
By Generation: Advanced Technologies Gain Commercial Traction
First-generation corn and sugarcane facilities still account for 69.5% of revenue, given their sunk assets and robust logistics. Nonetheless, third-generation algae ventures are expanding at a 17.9% CAGR as photobioreactor costs fall and lipid productivity rises. Second-generation cellulosic plants scale more cautiously due to enzyme costs and feedstock aggregation issues; yet, they unlock residues that avoid food-crop conflicts. Fourth-generation synthetic biology remains pre-commercial but commands growing R&D budgets aimed at direct fuel secretion and integrated CO₂ capture.
Tetraselmis species now deliver 79.8% lipid yields under optimized nitrogen withholding, proving algae’s near-term economics for high-value aviation channels. Marine macroalgae offer carbon sequestration benefits and reduce freshwater use, thereby ticking multiple ESG boxes prized by institutional capital. Such gains accelerate adoption across the Global Liquid Biofuels market even as legacy starch and sugar plants retain scale advantages.
Note: Segment shares of all individual segments available upon report purchase
By Feedstock: Waste Streams Challenge Agricultural Dominance
Sugar-rich cane and beet streams supplied 38.1% of the 2024 inputs through mature value chains and favorable agronomic practices. Yet waste oils, animal fats, and lignocellulosic residues gain share because they secure low carbon-intensity scores and dodge land-use risk. Algae feedstocks are projected to grow at a 19.1% CAGR, driven by declines in open-pond and photobioreactor costs and the prospect of co-producing high-protein coproducts. Oilseed reliance wanes under EU scrutiny of deforestation, steering demand toward certified soy, camelina, and carinata in temperate zones.
Policy credits amplify returns for waste-based barrels, prompting refiners to add pretreatment units for used cooking oil. Emerging Fuels Technology’s 20 million-liter wood-residue project in Ontario exemplifies local-feedstock, high-value models that trim transport costs and qualify for provincial incentives. Feedstock flexibility thus becomes a critical hedge within the Global Liquid Biofuels market.
By Technology: Hydrotreatment Captures Aviation Premium
Fermentation processes account for a 60.8% share of output, thanks to established ethanol infrastructure. Hydrotreatment units, however, are expected to rise at a 20.0% CAGR because they convert a wide range of lipids into fully fungible drop-in fuels for aviation and heavy-duty fleets. Trans-esterification maintains niche biodiesel demand yet faces cold-flow and quality hurdles in colder climates. Gasification, Fischer–Tropsch, and pyrolysis offer feedstock agnosticism but require larger scales and higher capital expenditures (Capex).
The U.S. Department of Energy’s latest USD 6 million awards back CO₂-to-SAF and engineered bacteria that ferment corn stover at lower enzyme loadings, showcasing policy support for diversification. Operators choose paths based on carbon intensity, feedstock geography, and offtake premiums, thereby reinforcing the plurality of technologies across the Global Liquid Biofuels market.
Note: Segment shares of all individual segments available upon report purchase
By End-use Sector: Aviation Disrupts Ground Transport Dominance
Road transport still accounts for 88.4% of the 2024 gallons under E10 and B20 blends. Aviation, though, posts the strongest 37.9% CAGR because electrification options remain unviable for long-haul flights. Marine bunkering begins shifting under IMO sulfur and future carbon mandates, with pilot voyages using 100% renewable diesel blends. Power generation and industrial heat applications occupy small but resilient niches that leverage renewable fuel for emergency backup and process steam.
Airlines secure SAF via take-or-pay deals that lock premium spreads, enabling project developers to underwrite debt. The maritime sector joins the Getting to Zero Coalition, trialing algae-based fuels on transoceanic lanes. Thus, buyer mix diversification underpins long-run resilience for the Global Liquid Biofuels market.
Geography Analysis
North America accounted for 42.3% of 2024 revenue, underpinned by the Renewable Fuel Standard and USD-scale SAF projects, such as USA BioEnergy’s Texas biorefinery, which converts forest waste into approximately 65 million gallons annually. Corn ethanol blenders leverage integrated rail networks and coproduct synergies, while Canadian canola biodiesel and emerging SAF hubs in Illinois and Washington enhance regional depth. Policy continuity and ample agricultural residues encourage ongoing retrofit investments, thereby reinforcing the region’s leadership in the global liquid biofuels market.
The Asia-Pacific region records the fastest 18.6% CAGR from 2020 to 2030. China invests USD 1 billion in SAF capacity, utilizing municipal waste to reduce aviation emissions and crude oil imports. India is aiming to reach 20% ethanol blending by 2025, combining sugarcane production and expanding corn acreage to meet demand. Japan and South Korea partner with refiners and airlines to test alcohol-to-jet fuel and synthetic kerosene, while ASEAN producers weigh the costs of deforestation compliance against growing local diesel premiums. Dynamic policy landscapes and rapid fuel demand growth keep the APAC region central to volume expansion for the Global Liquid Biofuels market.
Europe leverages stringent climate law to channel capital into advanced facilities. Neste scales up renewable diesel output, posting 80% quarter-on-quarter growth in SAF production, and OMV Petrom commits EUR 750 million to a combined SAF/HVO unit, underscoring the importance of integrated refinery plays. RED III rules prioritize waste-based and cellulosic credits, promoting feedstock imports from certified supply chains across multiple continents. High carbon prices enable premium pass-through to end-users, sustaining margins despite elevated feedstock costs.
Competitive Landscape
Moderate fragmentation characterizes the Global Liquid Biofuels market. Integrated energy majors retrofit hydrotreaters and leverage their trading arms to balance feedstock flows, while specialist players develop proprietary chemistries centered on lignin, syngas, or CO₂ utilization. BP’s USD 1.4 billion acquisition of Bunge Bioenergia deepens vertical integration from sugarcane fields to molecule distribution. Neste maintains scale advantages in HVO and SAF through global feedstock sourcing and disciplined capacity additions. LanzaJet pioneers alcohol-to-jet technology at a commercial scale, aligning with ethanol producers to access low-cost feedstock.
Strategic focus now tilts toward guaranteed supply and offtake. Producers enter into multi-year feedstock contracts with waste-oil aggregators and farmers’ cooperatives, and airlines sign 10- to 20-year SAF deals to hedge carbon-compliance risk. Technology differentiation remains vital: enzymes that trim residence time, catalysts that widen lipid specs, and modular reactors that slash capex all create defensible niches. M&A momentum should persist, as capital-intensive facilities favor balance-sheet strength, and as policy clarity reduces execution risk for multibillion-dollar projects.
Liquid Biofuels Industry Leaders
-
Neste Oyj
-
Archer Daniels Midland Co.
-
Valero Energy Corp. (Renewable Fuels)
-
POET LLC
-
Chevron Renewable Energy Group Inc.
- *Disclaimer: Major Players sorted in no particular order
Recent Industry Developments
- February 2025: USA BioEnergy purchased 1,600 acres in Texas for a USD 2.8 billion biorefinery, targeting 65 million gallons of SAF per year, with a 20-year offtake agreement from Southwest Airlines.
- January 2025: Emerging Fuels Technology signed a master license with Highbury Energy to deliver 20 million liters of wood-based fuels in Ontario, backed by Natural Resources Canada.
- December 2024: Galp outlined plans to launch biofuel production by 2026, marking its entry into the European renewable fuels market.
- December 2024: Developers announced a USD 820 million SAF plant in southwest Illinois, adding capacity to the U.S. aviation fuel network.
Global Liquid Biofuels Market Report Scope
| Bioethanol |
| Biodiesel |
| Renewable Diesel (HVO) |
| Sustainable Aviation Fuel (SAF) |
| Others |
| First-Generation (Sugar and Starch) |
| Second-Generation (Cellulosic) |
| Third-Generation (Algae-based) |
| Fourth-Generation (Synthetic Biology/Photobiological) |
| Sugar Crops (Sugarcane, Sugar Beet) |
| Starch Crops (Corn, Wheat, Cassava) |
| Oilseeds (Soy, Rapeseed, Palm) |
| Used Cooking Oil and Animal Fat |
| Lignocellulosic Agri-Residues |
| Algae |
| Fermentation |
| Trans-esterification |
| Hydrotreatment (HVO/SAF) |
| Gasification and FT-Synthesis |
| Pyrolysis and Upgrading |
| Road Transport |
| Aviation |
| Marine |
| Power Generation and Heating |
| North America | United States |
| Canada | |
| Mexico | |
| Europe | Germany |
| United Kingdom | |
| France | |
| Italy | |
| NORDIC Countries | |
| Russia | |
| Rest of Europe | |
| Asia-Pacific | China |
| India | |
| Japan | |
| South Korea | |
| ASEAN Countries | |
| Rest of Asia-Pacific | |
| South America | Brazil |
| Argentina | |
| Rest of South America | |
| Middle East and Africa | Saudi Arabia |
| United Arab Emirates | |
| South Africa | |
| Egypt | |
| Rest of Middle East and Africa |
| By Type | Bioethanol | |
| Biodiesel | ||
| Renewable Diesel (HVO) | ||
| Sustainable Aviation Fuel (SAF) | ||
| Others | ||
| By Generation | First-Generation (Sugar and Starch) | |
| Second-Generation (Cellulosic) | ||
| Third-Generation (Algae-based) | ||
| Fourth-Generation (Synthetic Biology/Photobiological) | ||
| By Feedstock | Sugar Crops (Sugarcane, Sugar Beet) | |
| Starch Crops (Corn, Wheat, Cassava) | ||
| Oilseeds (Soy, Rapeseed, Palm) | ||
| Used Cooking Oil and Animal Fat | ||
| Lignocellulosic Agri-Residues | ||
| Algae | ||
| By Technology | Fermentation | |
| Trans-esterification | ||
| Hydrotreatment (HVO/SAF) | ||
| Gasification and FT-Synthesis | ||
| Pyrolysis and Upgrading | ||
| By End-use Sector | Road Transport | |
| Aviation | ||
| Marine | ||
| Power Generation and Heating | ||
| By Geography | North America | United States |
| Canada | ||
| Mexico | ||
| Europe | Germany | |
| United Kingdom | ||
| France | ||
| Italy | ||
| NORDIC Countries | ||
| Russia | ||
| Rest of Europe | ||
| Asia-Pacific | China | |
| India | ||
| Japan | ||
| South Korea | ||
| ASEAN Countries | ||
| Rest of Asia-Pacific | ||
| South America | Brazil | |
| Argentina | ||
| Rest of South America | ||
| Middle East and Africa | Saudi Arabia | |
| United Arab Emirates | ||
| South Africa | ||
| Egypt | ||
| Rest of Middle East and Africa | ||
Key Questions Answered in the Report
What is the current global value of liquid biofuels?
Global liquid biofuels sales stand at USD 102.50 billion in 2025 and are projected to reach USD 203.50 billion by 2030.
How fast are Sustainable Aviation Fuels growing?
SAF volumes are expanding at a 37.6% CAGR through 2030, the fastest rate among all fuel types.
Which region is adding capacity the quickest?
Asia-Pacific shows the strongest expansion, advancing at an 18.6% CAGR on the back of major SAF projects in China and India’s 20% ethanol-blending push.
What share do first-generation biofuels still hold?
Fuels derived from sugar and starch crops retain 69.5% of 2024 revenue due to mature supply chains and entrenched mandates.
Which technology is gaining momentum for aviation demand?
Hydrotreatment units for renewable diesel and SAF are scaling at a 20.0% CAGR as refiners retrofit existing equipment.
What is the biggest challenge to scaling advanced facilities?
Capital intensity remains high, with commercial SAF plants requiring USD 2–4 billion, making long-term offtake and feedstock contracts critical for financing.
Page last updated on:

