Market Overview
| Study Period | 2020 - 2030 |
|---|---|
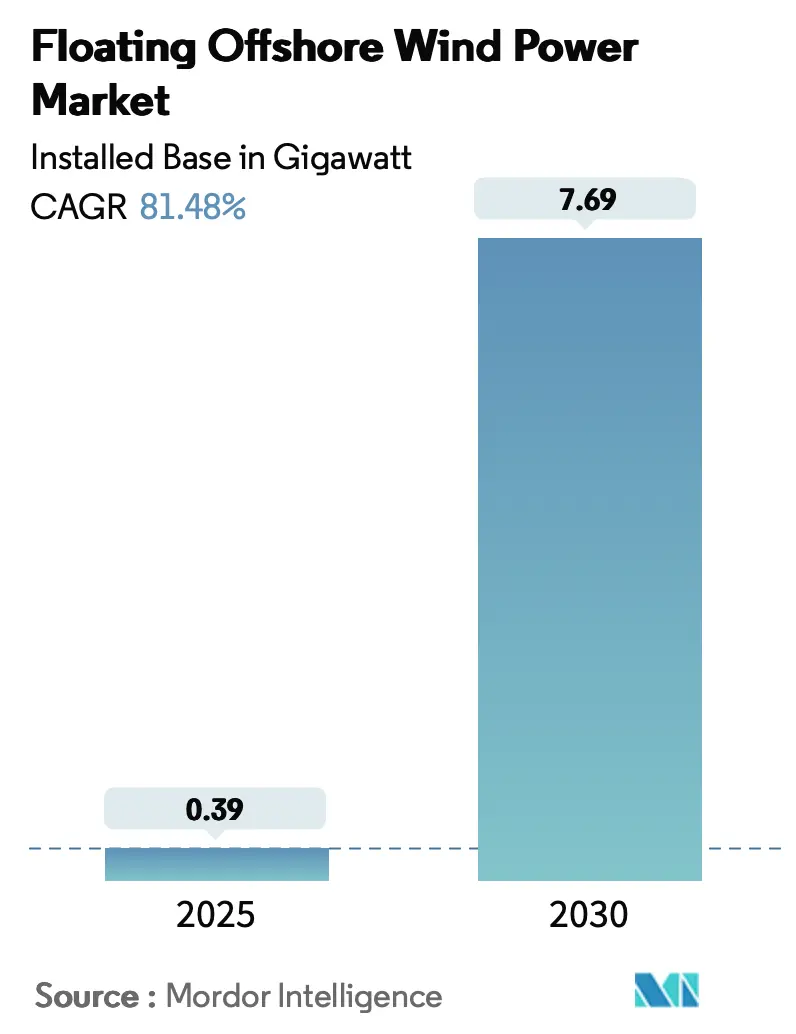
| Market Volume (2025) | 0.39 gigawatt |
| Market Volume (2030) | 7.69 gigawatt |
| Growth Rate (2025 - 2030) | 81.48% CAGR |
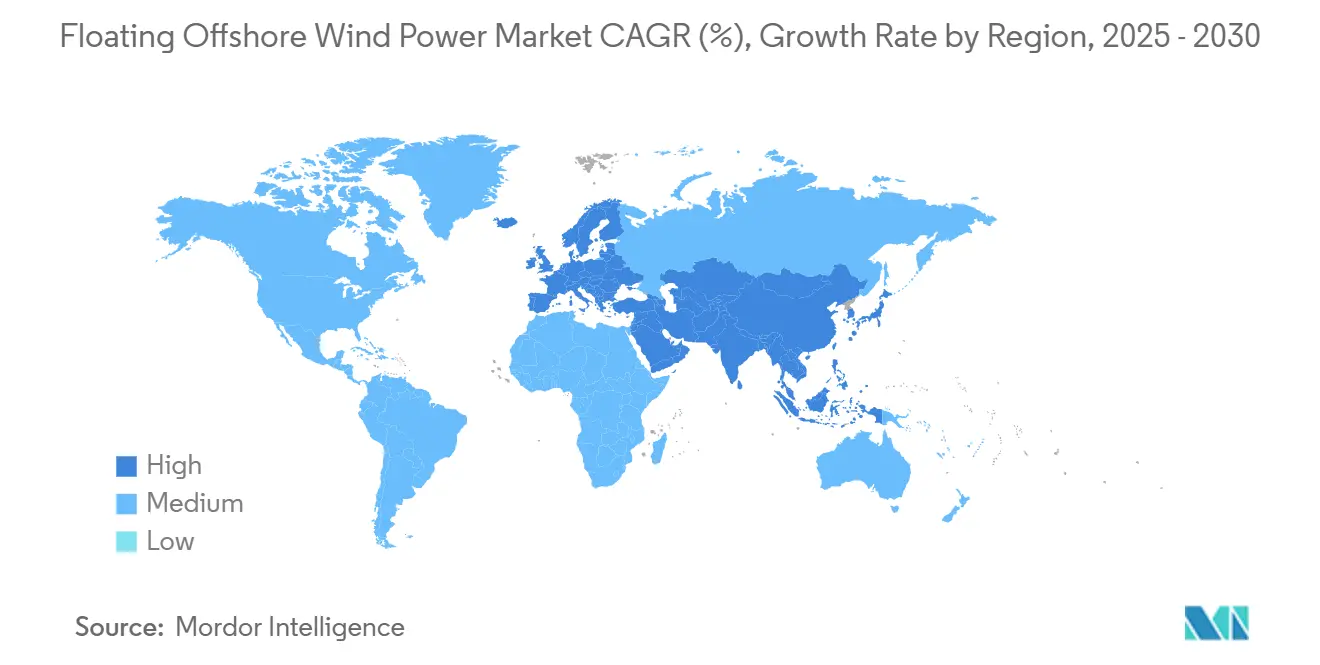
| Fastest Growing Market | Europe |
| Largest Market | Europe |
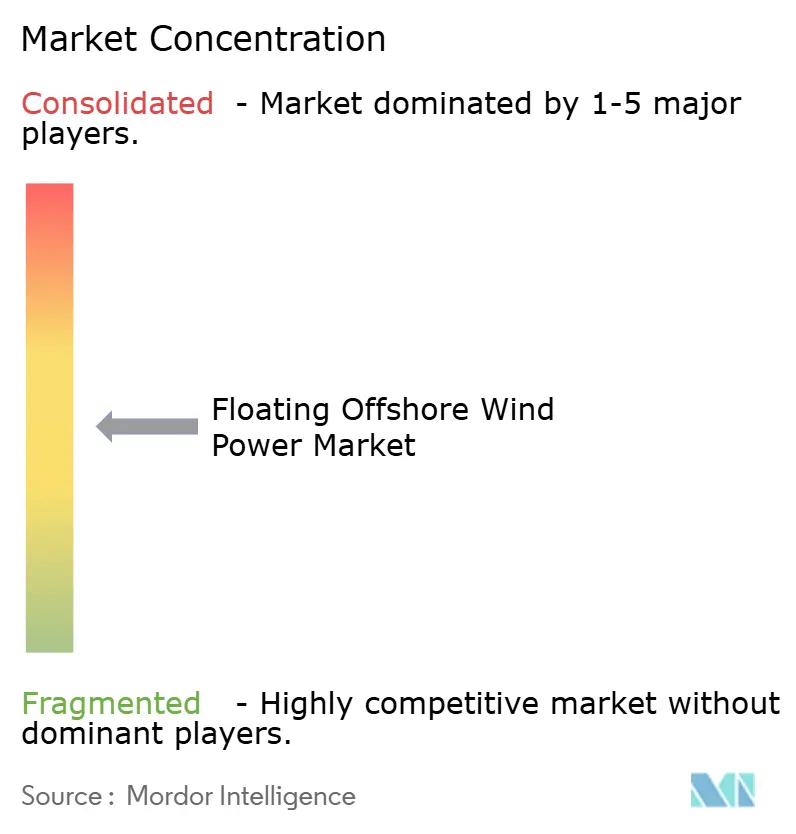
| Market Concentration | Medium |
Major Players
*Disclaimer: Major Players sorted in no particular order Image © Mordor Intelligence. Reuse requires attribution under CC BY 4.0. |
|
Floating Offshore Wind Power Market Analysis by Mordor Intelligence
The Floating Offshore Wind Power Market size in terms of installed base is expected to grow from 0.39 gigawatt in 2025 to 7.69 gigawatt by 2030, at a CAGR of 81.48% during the forecast period (2025-2030).
This expansion reflects the sector’s ability to tap deeper-water sites that hold 80% of global offshore wind resources, while rapid cost compression is pushing the Levelized Cost of Energy toward €50-100/MWh by 2030.(1)Enerdata, “Offshore Wind LCOE Outlook,” enerdata.net As the floating offshore wind market enters a commercial phase, supply chains built around conventional fixed-bottom projects are being re-tooled to handle Semi-Submersible and Spar-Buoy platforms that can be assembled quayside and towed to depths exceeding 1,000 m. Developers are also pivoting to turbines above 15 MW to spread foundation and installation costs over larger generation envelopes. Regional policy adds momentum: Europe’s revenue-stabilizing Contracts for Difference (CfD) reforms, the United States’ “Floating Offshore Wind Shot,” and Japan–Korea lease auctions are unlocking capital, while oil-and-gas platform conversions in the Gulf of Mexico highlight cross-sector synergies. These forces, combined with emerging hydrogen co-location schemes that absorb surplus power, position the floating offshore wind market for significant scale-up this decade.
Key Report Takeaways
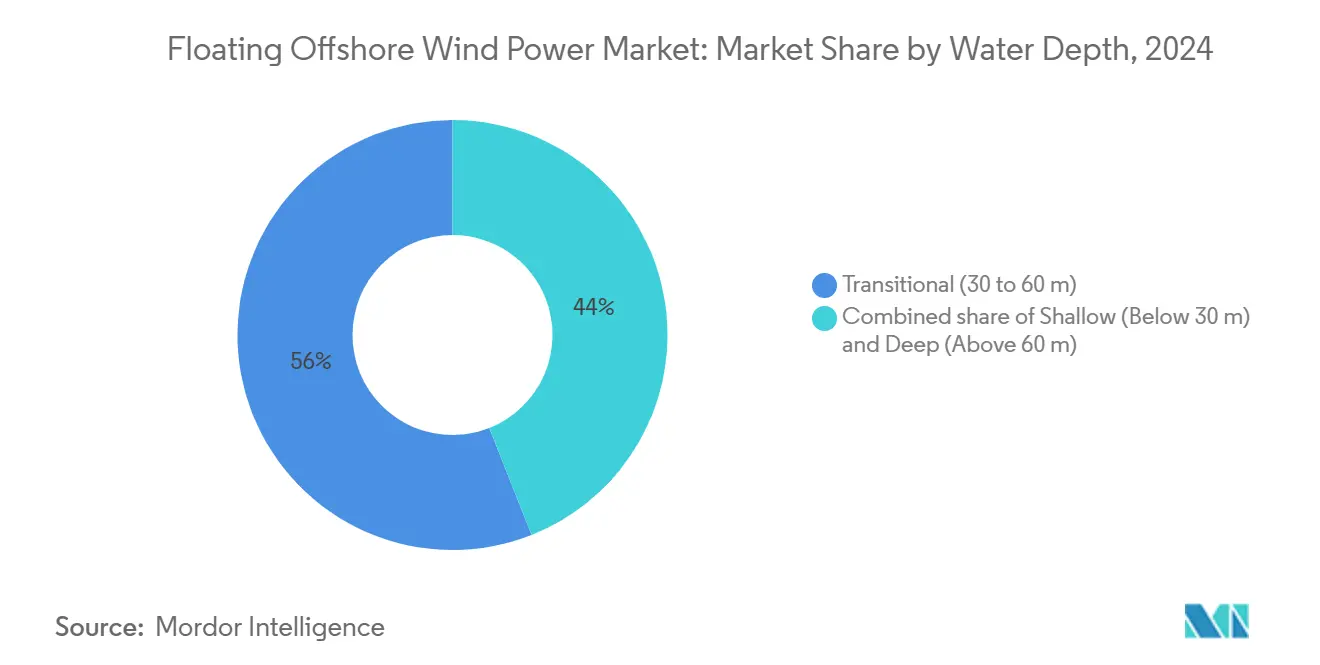
- By water depth, transitional (30 to 60 m) sites led with 55% floating offshore wind market share in 2024; the deep-water segment (Above 60 m) is projected to expand at an 88% CAGR through 2030.
- By platform type, Semi-Submersibles captured 57% of the floating offshore wind market in 2024, while Spar-Buoy units are forecast to accelerate at an 84% CAGR to 2030.
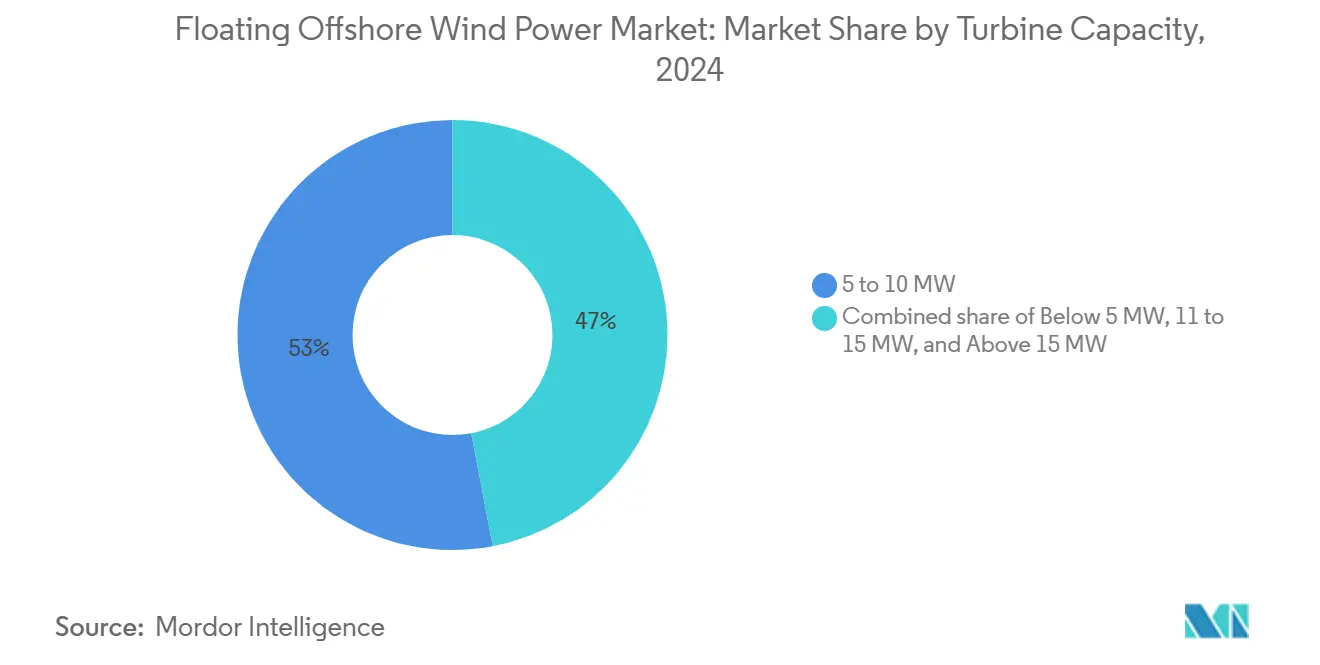
- By turbine rating, the 6 to 10 MW class accounted for 53% of the floating offshore wind market size in 2024; turbines above 15 MW are slated to grow at an 84% CAGR during 2025-2030.
- By application stage, pre-commercial pilots held 68% of the floating offshore wind market size in 2024, whereas utility-scale plants are on course for a 93% CAGR to 2030.
- By geography, Europe held a 92% market share in the floating offshore wind market in 2024; the Asia-Pacific region is the fastest-growing, advancing at a 156% CAGR through 2030.
Global Floating Offshore Wind Power Market Trends and Insights
Drivers Impact Analysis
| Driver | (~) % Impact on CAGR Forecast | Geographic Relevance | Impact Timeline |
|---|---|---|---|
| Growing Lease Awards in U.S. & APAC Deep-Water Zones | +22.5% | U.S. West Coast, South Korea, Japan, Taiwan | Medium term (2-4 years) |
| Rapid Turbine Upsizing to 15-20 MW Class Reducing LCOE | +18.7% | Global, with early adoption in Europe | Medium term (2-4 years) |
| Oil & Gas Platform Conversions Unlocking Gulf of Mexico Supply Chain | +15.3% | Gulf of Mexico, North Sea | Short term (≤ 2 years) |
| EU & UK CfD Reform Boosting Bankability | +14.2% | Europe, UK | Short term (≤ 2 years) |
| National Hydrogen Roadmaps Creating Co-location Demand | +10.6% | Europe, UK, Japan | Medium term (2-4 years) |
| Asian Cable-Vessel Build-out Shortening Installation Schedules | +8.9% | Asia-Pacific, with global spillover | Medium term (2-4 years) |
| Source: Mordor Intelligence | |||
Understand The Key Trends Shaping This Market
Download PDF
Growing Lease Awards in U.S. & APAC Deep-Water Zones
A surge of deep-water lease auctions is reshaping the floating offshore wind market, with the U.S. Bureau of Ocean Energy Management preparing multiple sales through 2025 and targeting 15 GW of floating capacity by 2035. The federal “Floating Offshore Wind Shot” pairs these leases with research and development aimed at achieving 70% cost reductions.(2)U.S. Department of Energy, “Floating Offshore Wind Shot,” energy.gov In the Asia-Pacific region, South Korea’s 1.8 GW tender and Japan’s entry into the U.S. cost-reduction initiative underscore how bilateral partnerships are building a 244 GW global pipeline. Developers view these awards as stepping stones from demonstration to multi-GW arrays, prompting early investments in port upgrades, cable factories, and installation vessels. Therefore, policy continuity across the Pacific Rim is locking in bankable revenue streams while pushing the floating offshore wind market closer to gigawatt-scale annual additions.
Rapid Turbine Upsizing to 15-20 MW Class Reducing LCOE
Moving from a 6-10 MW baseline to 15-20 MW turbines cuts per-megawatt foundation counts by up to 40%, directly lowering steel and mooring use. Research on Spanish Atlantic sites finds that 15 MW machines can drive LCOE to 100 €/MWh in favorable conditions.(3)Equinor, “Hywind Tampen—World’s Largest Floating Wind Farm,” equinor.com Manufacturers such as Siemens Gamesa and Vestas have accelerated their prototyping schedules to secure an early-mover advantage, while port owners lengthen their quays and reinforce cradle structures to handle 120-m blades. The upsizing wave also reshuffles vessel demand: only a handful of next-generation WTIVs can install nacelles weighing over 1,200 tons, creating new charter-rate spikes that force developers to lock in capacity years in advance. Overall, turbine scale-up is pivotal to meeting national cost-reduction targets and sustaining the blistering growth of the floating offshore wind market.
Oil & Gas Platform Conversions Unlocking Gulf of Mexico Supply Chain
Repurposing idle platforms offsets steel price volatility and accelerates permitting because foundation footprints already exist. A decision-framework study shows that retrofit IRRs exceed 12% when lifespans are extended by 25 years and topsides are converted to floating substations.(4)National Renewable Energy Laboratory, “Offshore Turbine Trends 2025,” nrel.gov The Gulf of Mexico’s dense network of fabrication yards presents an instant critical mass for mooring chains, anchors, and dynamic cables, cutting logistics costs compared to greenfield yards. Europe mirrors this logic: North Sea operators are redeploying semi-sub structures as testbeds for 2-MW demonstrators, validating load cases before scaling to 15-MW turbines. These synergies help the floating offshore wind market absorb oil-service labor while de-risking schedules, which is crucial during the current steel-price swing cycle.
EU & UK CfD Reform Boosting Bankability
The UK’s 2024 overhaul of CfD rules introduced phased construction windows and a Clean Industry Bonus that incentivizes domestic fabrication. Contract allocations covering 9.6 GW of low-carbon capacity included a 400 MW floating wind tranche, underscoring lender confidence once price-fluctuation risk is removed. Academic analyses show that two-sided CfDs raise achievable debt ratios by up to 27%, thereby trimming the weighted average cost of capital and potentially reducing consumer tariffs by 12 EUR/MWh. Continental Europe is following suit: France’s tender design now rewards green steel content, a policy that spurs the development of nascent floater yards. These reforms crystallize a template for export-credit agencies and pension funds, thereby funneling cheaper capital into the floating offshore wind market as multibillion-dollar capital expenditure cycles come to fruition.
Restraints Impact Analysis
| Restraint | (~) % Impact on CAGR Forecast | Geographic Relevance | Impact Timeline |
|---|---|---|---|
| WTIV & FIV Vessel Shortage Driving Day-rates > US$450k | -19.3% | Global, most acute in Asia-Pacific | Medium term (2-4 years) |
| High-Voltage Dynamic Cable Failures in 50-100 m Depth Pilots | -16.8% | Global, particularly in pilot projects | Short term (≤ 2 years) |
| California ESA Right-Whale Constraints Slowing BOEM Permits | -12.5% | U.S. West Coast | Short term (≤ 2 years) |
| Spot Steel Price Volatility (> US$950/t) Disrupting Floater Yards | -10.2% | Global, with heightened impact in Europe | Short term (≤ 2 years) |
| Source: Mordor Intelligence | |||
WTIV & FIV Vessel Shortage Driving Day Rates Above USD 450k
Only 10 vessels worldwide can handle turbines exceeding 14 MW, and even fewer can lift 3-column Semi-Submersible hull sections. Day rates have already surpassed USD 450,000, approximately double the 2022 levels, and order books indicate a construction gap extending into 2028. Asia-Pacific faces extra hurdles from cabotage rules restricting foreign hulls, meaning Japanese and Korean projects must either build domestic WTIVs or absorb costly mobilization voyages. Developers now embed vessel-availability clauses into Power Purchase Agreements, delaying Final Investment Decisions until tonnage slots are secured. This bottleneck risks trimming close-in floating offshore wind market installations unless capital flows into specialized shipyards accelerate.
High-Voltage Dynamic Cable Failures in 50-100 m Depth Pilots
Compared with fixed-bottom peers, dynamic export cables must handle cyclic bending, axial tension, and heightened corrosion. Early pilots reported insulation fatigue, leading to partial discharge events within three years of commissioning, which triggered unscheduled outages. The COREWIND program targets at least a 15% LCOE cut through optimized catenary-to-lazy-wave geometries. Parallel research recommends composite armoring and distributed buoyancy modules to suppress curvature peaks, yet commercial suppliers remain limited. Insurance premiums now carry an uplift for projects in depths of 50-100 meters, reflecting data scarcity. Resolving these failures is essential for bankability and will dictate how swiftly the floating offshore wind market transitions from pilot arrays to 500 MW clusters.
Segment Analysis
By Water Depth: Transitional Depths Anchor Early Deployment
Transitional zones between 30 m and 60 m accounted for 55% of 2024 installations, equating to a floating offshore wind market size of roughly 131 MW. These locations reuse portions of fixed-bottom supply chains, allowing developers to validate moorings, SCADA, and O&M strategies at modest cost. The segment’s popularity is evident in Scotland’s Kincardine and France’s Mediterranean demonstrators, which collectively logged availability above 92% in 2024. Yet the deep-water segment (above 60 m) is scaling rapidly, driven by stronger wind profiles that increase annual energy output by up to 25% compared to transitional sites. As turbine ratings exceed 15 MW, deeper waters also reduce visual-impact opposition, a factor that is especially potent in tourism-heavy coastlines.
Deep-water projects are forecast to post an 88% CAGR, lifting their floating offshore wind market share to just over 40% by 2030. Norway’s Utsira-Nord and California’s Morro Bay zones illustrate how contiguous 1-GW blocks streamline array layouts and enable shared export corridors. Oil-and-gas majors bring subsea expertise that mitigates met-ocean risks, while classification societies have codified design fatigue factors exceeding 25 years. The shallow (<30 m) category remains confined to R&D prototypes where seabed conditions or ecological constraints make fixed monopiles unviable. Over time, increasing confidence in the dynamic performance of cables and the structural redundancy of floaters is expected to decisively tilt investment toward water depths beyond 100 m, reinforcing the deep-water pathway for the floating offshore wind industry.
Note: Segment shares of all individual segments available upon report purchase
By Floating Platform Type: Semi-Submersibles Retain Lead as Spar-Buoys Surge
Semi-submersible hulls dominated the floating offshore wind market with a 57% share in 2024, buoyed by designs such as WindFloat and VolturnUS, which can be fabricated in modular sections and launched via existing docks. Their shallow draft facilitates tow-out operations without extensive dredging, a key advantage for shipyard-constrained nations. Mooring spreads utilize standard chain and polyester rope, minimizing the need for bespoke hardware. The approach reliably delivers stability with pitch motions below 5°, ensuring drivetrain loads stay within warranty envelopes for 6-10 MW turbines. Developers value the platform’s adaptability, enabling deployment from Norwegian fjords to the Canary Islands.
Spar-Buoy concepts, although accounting for 31% of 2024 capacity, are on an 84% CAGR trajectory as material usage per MW drops by up to 15% compared with Semi-Subs. Hywind Tampen’s 107-m-long columns verified operational uptimes of 97% under North Sea squalls. Future variants plan to employ slip-forming techniques that reduce fabrication person-hours, while hybrid concrete-steel spars promise further capital expenditure savings. Tension-leg platforms offer heave suppression traits that are attractive for turbine nacelle heights approaching 180 m, but anchor-pile precision raises costs. Barge and hybrid formats remain niche, yet Japan’s 3 MW Hibiki-nada plant shows how calm-sea locales can host low-freeboard hulls. Competition among hull types will continue until mass production clarifies the most bankable option; however, semi-submersibles currently serve as the reference design for lenders assessing the risk in the floating offshore wind market.
By Turbine Capacity Rating: Scale-Up Drives Cost Compression
Turbines in the 5-10 MW band captured 53% of installations, resulting in a 2024 floating offshore wind market size of approximately 126 MW. The class features a mature supply chain of drivetrain bearings, yaw motors, and blades under 90 meters, which can still navigate through most port gate clearances. These ratings also align with the load envelopes used to certify early floaters, simplifying bankability reviews. Even so, developer appetite is rapidly tilting toward units exceeding 15 MW, where a single machine can power 25,000 homes and reduce array cabling by 35%. This above 15 MW category will hold 38% floating offshore wind market share by 2030 at an 84% CAGR.
Intermediate 11-15 MW turbines act as stepping stones, allowing operators to stagger capital outlays while yards prepare for even larger nacelles. At today's material prices, Spain's cost curves demonstrate that 15 MW machines strike the best balance between blade chord length, tower-top mass, and floater displacement. At the small end, units with a capacity of ≤ 5 MW plunge to single-digit demand outside research platforms. Component consolidation, integrating power converters, transformers, and switchgear inside nacelles, further reinforces the economic edge of the high-capacity class, aligning with national targets that necessitate fewer seabed leases for the same energy yield.
Note: Segment shares of all individual segments available upon report purchase
By Application Stage: Commercial Utility-Scale Ramps Up
Pilot arrays of 10 MW or less still represent 68% of global installations, underscoring the nascency nature of the floating offshore wind market. These projects validate survival strategies under combined wave-current loads, accelerate learning on craneless maintenance, and provide insurers with data sets that feed actuarial models. Yet, commercial utility-scale ventures are arriving swiftly: the UK’s 400 MW Pentland Firth award and France’s 250 MW Golfe du Lion tender illustrate how multi-hundred-megawatt blocks are now clearing investment committees. Analysts track a 93% CAGR for the utility category, which will eclipse pilots in annual capacity additions by 2027.
Hybrid wind-to-X schemes, especially floating wind plus green hydrogen, are gaining traction where weak grids impede gigawatt-scale interconnections. Europe’s hydrogen roadmaps anticipate up to 8 Mt/year of electrolysis output by 2030, creating offtake sinks that can smooth variable wind profiles. Co-location also taps synergies in shared offshore substations, desalination units, and pipeline corridors. Consequently, investors view hybridization as a hedge against curtailment risk, reinforcing the momentum toward ever-larger floating arrays and extending the value chain beyond pure electricity sales.
Geography Analysis
Europe maintained a commanding 92% share of global deployments in 2024, with a floating offshore wind market size close to 220 MW. Mature engineering clusters in Norway, Scotland, and Portugal underpin this lead, while the UK’s 50 GW total offshore wind ambition—5 GW of which must be floating by 2030—anchors forward pipelines. State-backed grants, such as the GBP 160 million Floating Offshore Wind Manufacturing Investment Scheme, funnel capital expenditure (capex) toward blade, tower, and mooring plants, thereby shortening delivery times. Norway’s Hywind Tampen has already demonstrated concrete CO₂ savings by electrifying petroleum platforms, solidifying government and public buy-in. France is following with Mediterranean tenders that favor local fabrication yards in Fos-sur-Mer and Port-la-Nouvelle, expanding regional industrial footprints.
Asia-Pacific is the fastest-growing theatre, registering a 156% CAGR as island nations seek deeper-water options where continental shelf widths are minimal. Japan’s target of 5.7 GW by fiscal 2030 and 45 GW by 2040 relies heavily on floating foundations; its seabed surveys identify 424 GW of theoretical resource above 10 m/s wind speeds. South Korea’s 1.8 GW procurement round near Ulsan promises to ignite a specialized supply base encompassing chains, suction anchors, and heavy-lift barges. Taiwan positions itself as a non-China alternative for blades and nacelles, leveraging tax incentives inside its Port of Taichung free-trade zone. China itself dominates fixed-bottom additions, but provincial authorities from Guangdong to Zhejiang are cataloging floating wind corridors exceeding 80 m in depth to diversify coastal load centers.
North America ramps up under the Biden-Harris Administration’s 30 GW offshore wind and 15 GW floating targets. California’s twin lease zones at Morro Bay and Humboldt could host enough capacity to power 5.5 million households, but Endangered Species Act safeguards for the North Atlantic right whale prolong permitting cycles along the broader Pacific Coast. The Gulf of Mexico’s milder sea states and dense brownfield infrastructure make it an attractive early-mover candidate, with oil majors repurposing jack-up rigs as temporary welding stations. Canada monitors the sector’s progress while awaiting turbine icing studies before setting national quotas, whereas Mexico explores policy incentives to integrate floating wind with existing gas-fired peakers on the Baja Peninsula. Collectively, North American projects account for more than 40 GW of auctioned potential, a base that will materially widen the floating offshore wind market after 2027.
Competitive Landscape
The competitive arena is moderately concentrated, with the top five developers expected to hold roughly 60% of commissioned capacity by 2030. Oil-and-gas incumbents, such as Equinor, Shell, and TotalEnergies, leverage decades of deep-water mooring expertise to secure a leading position, frequently partnering with renewable specialists Ørsted and RWE to share risk and project equity. Platform design houses BW Ideol and Principle Power license hull IP to multiple consortia, widening addressable markets while capturing recurring royalty streams. Siemens Gamesa’s 15-MW SG 150 DD-Flex turbine remains the unit of choice for early utility-scale arrays, although Vestas’ V236-15 MW prototype and GE Vernova’s Haliade-X family are vying for contract wins as nacelle logistics solutions mature.
Supply chain bottlenecks spur new entrants: Spanish and Norwegian yards retool to produce floating substations, while Korean heavy-industry groups pursue dual-fuel WTIVs capable of switching to methanol for eventual emissions compliance. Hitachi Energy demonstrates floating offshore substation concepts that compress transformers and switchgear into a single 340-t topside, halving steel tonnage compared with fixed-bottom peers. Meanwhile, cable makers Nexans and Sumitomo are racing to qualify dynamic 220 kV cables with integrated fiber-optic cores, striving to lower OPEX through predictive maintenance algorithms. Strategic equity swaps are common: Ocean Winds blends EDP Renewables’ utility backing with ENGIE’s trading desk to stabilize revenue, while Japan’s JERA invests in European demonstrators to secure first-hand operating data. These moves collectively reinforce the growth trajectory of the floating offshore wind market, even as vessel scarcity and material inflation test execution discipline.
Floating Offshore Wind Power Industry Leaders
-
General Electric Company
-
Vestas Wind Systems A/S
-
Siemens Gamesa Renewable Energy, S.A
-
BW Ideol AS
-
Equinor ASA
- *Disclaimer: Major Players sorted in no particular order
Need More Details on Market Players and Competitors?
Download PDF
Recent Industry Developments
- June 2025: DNV, a global leader in wind energy technology certification, has signed a memorandum of understanding (MoU) with Japan's Floating Offshore Wind Technology Research Association (FLOWRA) to explore collaborative opportunities in the development of floating wind technology.
- April 2025: The UK government announced a GBP 300 million package for domestic offshore wind supply chains, spanning turbine components, floating platforms, and subsea cables.
- April 2025: China Power, Tokyu Land Corporation, and Renewable Japan commenced commercial operation of the 3 MW Hibiki-nada barge-type floating wind plant, Japan’s first of its kind.
- March 2025: The UK government has allocated more than £ 55 million for Port of Cromarty Firth upgrades, enabling the serial production of floating turbines and creating up to 1,000 skilled jobs.
Research Methodology Framework and Report Scope
Market Definitions and Key Coverage
Our study defines the floating offshore wind power market as all grid-connected wind turbines installed on buoyant, moored platforms that operate in waters deeper than thirty meters, with market size measured in commissioned capacity (MW) as well as their associated revenue pools.
Scope Exclusion: Near-shore fixed-foundation projects in depths below thirty meters are excluded.
Segmentation Overview
- By Water Depth
- Shallow (Below 30 m)
- Transitional (30 to 60 m)
- Deep (Above 60 m)
- By Floating Platform Type
- Semi-Submersible
- Spar-Buoy
- Tension-Leg Platform (TLP)
- Barge and Hybrid Concepts
- By Turbine Capacity
- Below 5 MW
- 5 to 10 MW
- 11 to 15 MW
- Above 15 MW
- By Application Stage
- Pre-Commercial Pilot
- Commercial Utility-Scale
- Hybrid Wind-to-X (Hydrogen, Desalination)
- By Geography
- North America
- United States
- Rest of North America
- Europe
- France
- United Kingdom
- Spain
- Nordic Countries
- Italy
- Rest of Europe
- Asia-Pacific
- China
- Japan
- South Korea
- Rest of Asia-Pacific
- South America
- Brazil
- Argentina
- Rest of South America
- Middle East and Africa
- United Arab Emirates
- Saudi Arabia
- South Africa
- Rest of Middle East and Africa
- North America
Detailed Research Methodology and Data Validation
Primary Research
During 2025, we interviewed turbine OEM engineers, mooring contractors, port managers, and power-offtake planners across Europe, Asia-Pacific, and North America. Their insights helped us confirm average turbine ratings, commissioning lags, and achievable load factors, which we then used to temper aspirational project schedules published online.
Desk Research
Mordor analysts first gather foundational numbers from open datasets such as IRENA, GWEC annual capacity tallies, Eurostat renewable statistics, and U.S. DOE offshore wind market reports, which outline national pipelines, auction results, and commissioning dates. Policy documents by the European Commission, the UK Crown Estate, and BOEM supply target trajectories and lease specifics that anchor the capacity build-out curves. Industry journals and port authority cargo logs help us approximate nacelle movements and blade exports that signal actual installations. We layer this with paywalled intelligence pulled from D&B Hoovers for company financials and Dow Jones Factiva for investment announcements to cross-check project valuations. The sources listed are illustrative; many additional publications and datasets inform the desk phase.
A second pass mines patent filings via Questel and shipment traces from Volza to validate technology diffusion and hardware flow, letting us isolate genuine turbine deployments from mere press releases. Where gaps persist, we consult Aviation Week and IMTMA libraries for steel and composite cost indices used to sanity-check capex assumptions.
Market-Sizing & Forecasting
A top-down installed-capacity reconstruction is built from government targets and announced project pipelines, which are then stress-tested with selective bottom-up supplier roll-ups for the five largest arrays. Drivers such as average turbine rating, water-depth mix, floating platform choice, capacity factor progression, steel price trends, and lease-to-COD cycle length feed a multivariate regression that projects capacity through 2030. Missing sub-municipal data, when encountered, is bridged using regional penetration ratios benchmarked against analogous fixed-bottom builds.
Data Validation & Update Cycle
Outputs run through variance checks against IRENA and GWEC time-series, after which a senior reviewer challenges anomalies. Models refresh annually, with off-cycle updates triggered by final investment decisions, turbine order backlogs, or policy shifts. Just before publication, an analyst reruns the latest numbers so clients receive a current snapshot.
Why Mordor's Floating Offshore Wind Power Baseline Earns Trust
Published figures for this young sector often diverge because providers mix revenue and capacity metrics, bundle fixed-bottom assets, or apply aggressive learning-curve multipliers. Our team anchors estimates to physically installed megawatts and moderates long-range growth using country-specific supply-chain constraints, which makes Mordor's view naturally more conservative yet dependable for planning.
Key gap drivers include: a) differing unit of account (capacity versus dollar value), b) inclusion of speculative license areas that lack grid agreements, and c) currency and inflation adjustments applied inconsistently across multiyear models.
Benchmark comparison
| Market Size | Anonymized source | Primary gap driver |
|---|---|---|
| 0.39 GW (2025) | Mordor Intelligence | - |
| USD 1.7 B (2025) | Global Consultancy A | Mixes revenue of component vendors with capacity, lacks deployment cut-off date |
| USD 0.37 B (2024) | Trade Journal B | Counts prototypes and optioned leases, excludes Asia-Pacific cost inflation |
In short, Mordor's stepwise capacity tracking, tempered assumptions, and annual refresh cadence supply decision-makers with a transparent baseline that links directly to verifiable turbines in the water.
Need A Different Region or Segment?
Customize Now
Key Questions Answered in the Report
What is the projected size of the floating offshore wind market by 2030?
The floating offshore wind market is forecast to reach 7,690.33 MW by 2030, reflecting an 81.48% CAGR during 2025-2030.
Which region currently dominates floating offshore wind installations?
Europe held 92% of global capacity in 2024, supported by robust CfD schemes and early technological investments.
Why are turbines above 15 MW becoming popular in floating projects?
Larger turbines cut the number of foundations needed, drive LCOE toward €50-100/MWh, and improve project IRRs by spreading fixed costs over greater energy output.
What are the main bottlenecks slowing deployment?
Shortages of suitable installation vessels and reliability issues with high-voltage dynamic cables are the two most significant near-term constraints.
How are oil-and-gas assets contributing to floating wind growth?
Retrofitting existing offshore platforms reduces capex, leverages established Gulf of Mexico and North Sea supply chains, and accelerates permitting by reusing proven structures.
What policy tools are improving project bankability?
Reformed two-sided CfDs in the UK and similar mechanisms in the EU offer revenue stability, raise allowable debt levels by up to 27%, and lower consumer electricity costs.
Page last updated on:

