Market Overview
| Study Period | 2019 - 2030 |
|---|---|
| Base Year For Estimation | 2024 |
| Forecast Data Period | 2025 - 2030 |
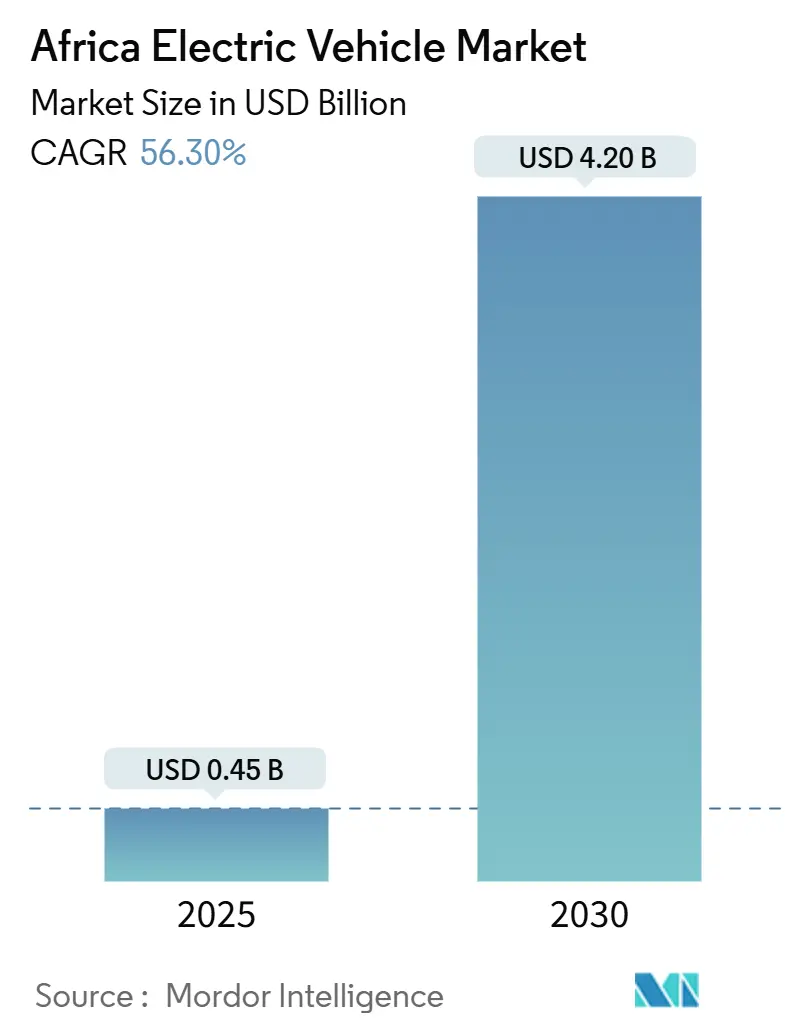
| Market Size (2025) | USD 0.45 Billion |
| Market Size (2030) | USD 4.20 Billion |
| Growth Rate (2025 - 2030) | 56.30% CAGR |
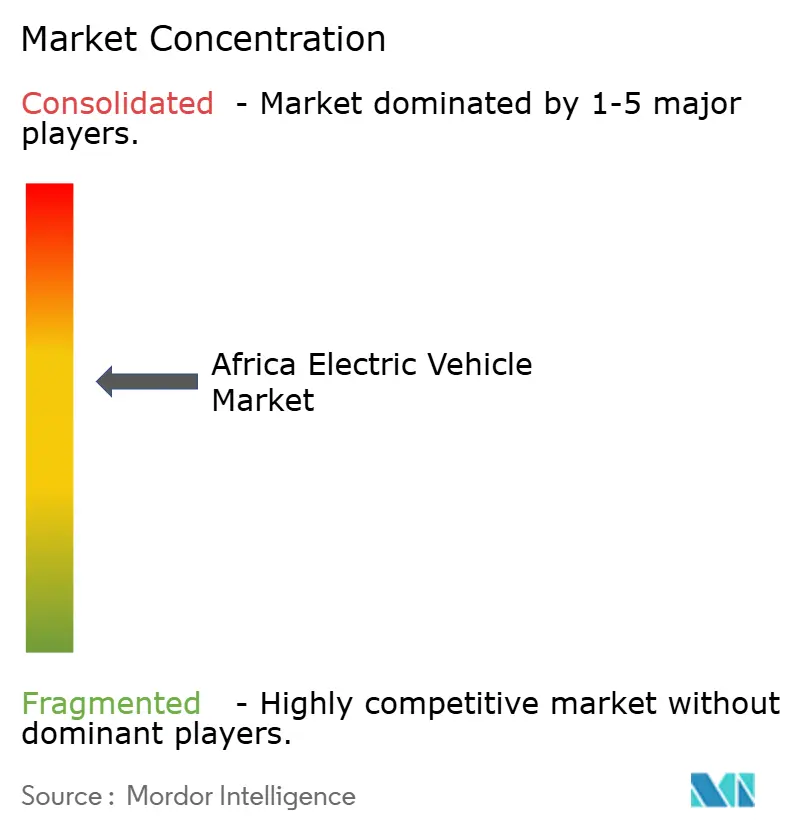
| Market Concentration | Medium |
Major Players
*Disclaimer: Major Players sorted in no particular order Image © Mordor Intelligence. Reuse requires attribution under CC BY 4.0. |
|
Africa Electric Vehicle Market Analysis by Mordor Intelligence
The Africa electric vehicle market size is USD 0.45 billion in 2025 and is forecast to reach USD 4.2 billion by 2030, representing a 56.3% CAGR 2025-2030. Government incentives, plentiful battery-mineral resources, and the ability to leapfrog legacy automotive infrastructure are propelling adoption across diverse mobility segments. Ethiopia’s ICE-import ban, Ghana’s eight-year zero-tariff window, and South Africa’s emerging production rebates widen consumer access while attracting upstream battery investment. Chinese, European, and African players are racing to localize battery and vehicle assembly capacity, positioning the Africa electric vehicle market as a strategic growth frontier for the global industry. Fast-declining battery costs, rising two-wheeler demand for last-mile logistics, and fintech-enabled micro-leasing reinforce the region’s transition to low-carbon transport.
Key Report Takeaways
- By propulsion, battery-electric vehicles held 79.23% revenue share of the Africa electric vehicle market in 2024, while fuel-cell electric cars are projected to post the fastest 58.31% CAGR through 2030.
- By vehicle type, passenger cars led the Africa electric vehicle market with a 61.81% share in 2024, whereas two—and three-wheelers are advancing at a 59.72% CAGR to 2030.
- By drive configuration, front-wheel drive captured 58.17% revenue share of the Africa electric vehicle market in 2024; all-wheel drive is forecast to expand at a 57.82% CAGR through 2030.
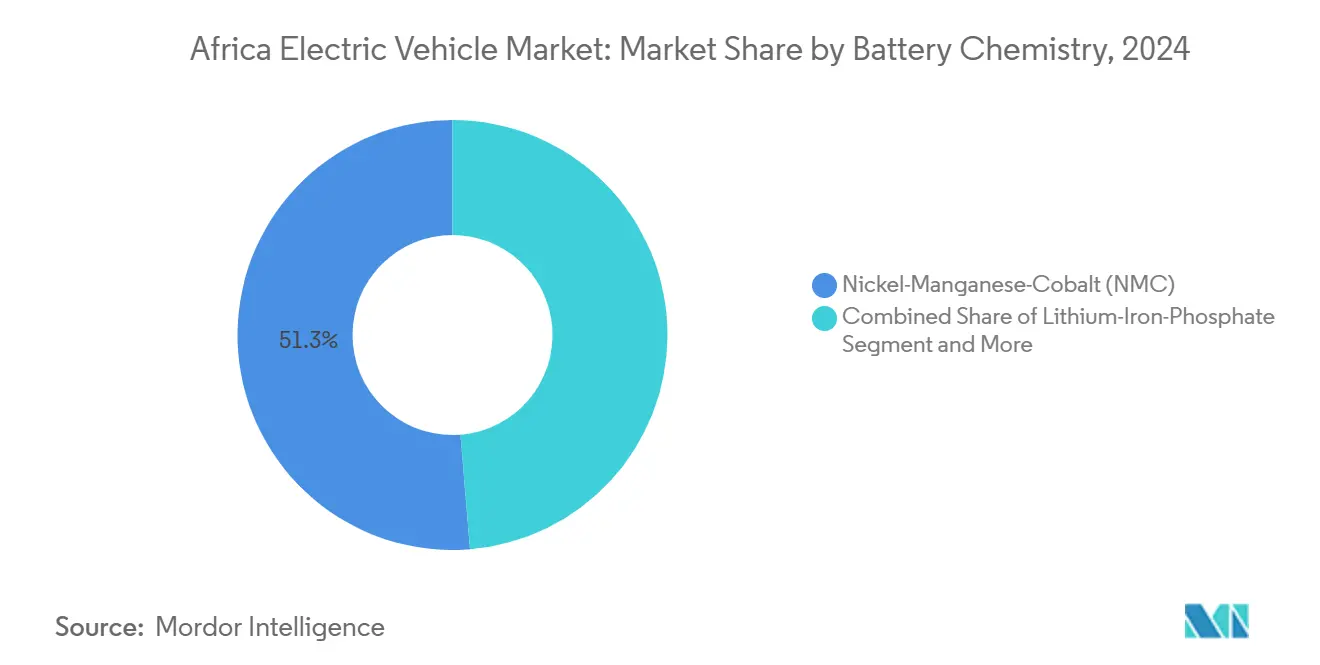
- By battery chemistry, nickel-manganese-cobalt accounted for a 51.29% share of the Africa electric vehicle market in 2024, and solid-state batteries are set to grow at a 57.62% CAGR between 2025 and 2030.
- By charging method, AC slow charging commanded 68.61% of the Africa electric vehicle market share in 2024, while DC fast charging will rise at a 57.21% CAGR to 2030.
- By geography, Ghana led with a 29.31% revenue share in 2024; Ethiopia is the fastest-growing country, with a 58.92% CAGR through 2030.
Africa Electric Vehicle Market Trends and Insights
Drivers Impact Analysis
| Driver | (~) % Impact on CAGR Forecast | Geographic Relevance | Impact Timeline |
|---|---|---|---|
| Zero-Duty Incentives | +12.5% | Ethiopia, Ghana, South Africa, Rwanda | Short term (≤ 2 years) |
| Cheaper Batteries, Mass Models | +10.8% | Concentrated impact in Morocco, South Africa | Medium term (2-4 years) |
| Mineral Supply-Chain Push | +9.2% | DRC, Zambia, Morocco, Madagascar | Long term (≥ 4 years) |
| E-Motorcycle Leapfrog | +8.7% | Kenya, Nigeria, Rwanda, Ghana | Short term (≤ 2 years) |
| Battery-Swap Pricing | +7.3% | Kenya, Nigeria, Benin, Togo, Rwanda | Medium term (2-4 years) |
| OEM-Fintech Micro-Leasing | +6.1% | Nigeria, Kenya, Ghana | Medium term (2-4 years) |
| Source: Mordor Intelligence | |||
Government Incentives and Zero-Duty Imports Surge EV Affordability
Ethiopia’s 2024 ban on internal-combustion vehicle imports lifted electric-vehicle registrations above 60% of new sales by early 2025. Ghana’s eight-year zero-tariff window eliminates customs duties on fully electric imports, stimulating assembly investment commitments by global OEMs. South Africa’s draft incentive framework proposes production rebates that pivot the policy mix from consumption to manufacturing, enhancing the Africa electric vehicle market’s regional supply-chain depth. Kenya’s VAT exemption, combined with a discounted e-mobility electricity tariff, drove a five-fold rise in 2023 registrations, confirming price elasticity of demand. Rwanda’s tax holiday and renewable power share reinforce affordability, enabling Volkswagen’s GenFarm e-tractor rollout.
Plummeting Battery-Pack Prices Unlock Mass-Market Models
Rapid cell-price declines, coupled with Morocco’s USD 6.5 billion Gotion gigafactory and BTR’s USD 366 million cathode plant, are lowering landed-cost structures for regional assemblers. Localizing battery production sidesteps forex risk and logistics premiums, trimming vehicle sticker prices and improving the Africa electric vehicle market’s total cost of ownership. COBCO’s 70 GWh precursor facility illustrates economies of scale cascading across West, Central, and North African export corridors. With rise of renewable energy penetration in Morocco, further cuts energy input costs, translating into competitive battery pricing across the continent. As scale advantages stretch across supply chains, sub-USD 15,000 mass-market models are expected to proliferate by 2027, widening addressable demand among ride-hailing and delivery fleets.
Pan-African Mineral Value-Chain Push Fuels Local EV/Battery Investment
Control of 92% of global platinum and 56% of cobalt provides Africa with structural bargaining power in global battery supply chains. The DRC-Zambia EV corridor leverages copper-cobalt clusters to host SEZs that attract cell-assembly and precursor-material plants, anchoring the Africa electric vehicle market locally. Zimbabwe’s Kamativi lithium capacity and Madagascar’s graphite projects align with EU critical-raw-material strategies, channeling concessionary finance toward processing assets. Ghana’s sovereign-fund-backed Tema lithium refinery adds conversion capacity, capturing more value than raw ore exports. Integrated upstream-to-downstream footprints shorten shipping cycles, reduce emissions, and increase the competitiveness of African-built vehicles in regional trade under AfCFTA rules.
Leap-Frogging to E-Motorcycles and Tuk-Tuks for Last-Mile Logistics
Motorcycle taxis represent more than one-third of urban rides in Kenya, offering an immediate electrification target with limited road infrastructure dependence. Spiro’s network of 22,000 e-bikes and 600 swap stations demonstrates the pay-per-use model that solves range anxiety while removing upfront battery cost. Operators report higher daily earnings than petrol peers, a financial pull that accelerates electric two-wheeler diffusion across multiple countries. Kenya’s fleet of 2.2 million boda-bodas could cut transport emissions by 85% if fully electrified, leveraging its renewable-heavy grid. Similar economics apply in Nigeria, Ghana, and Rwanda, where informal-sector drivers value fuel savings, reduced maintenance, and micro-leasing flexibility.
Restraints Impact Analysis
| Restraint | (~) % Impact on CAGR Forecast | Geographic Relevance | Impact Timeline |
|---|---|---|---|
| Charging Cap-Ex Burden | -8.4% | Sub-Saharan Africa excluding South Africa | Long term (≥ 4 years) |
| Fragile Rural Grids | -7.1% | Rural areas across Nigeria, Kenya, Ghana, Tanzania | Medium term (2-4 years) |
| Used ICE Flood | -5.8% | West and East Africa | Short term (≤ 2 years) |
| Weak EV Resale | -4.3% | South Africa, Morocco, Kenya | Medium term (2-4 years) |
| Source: Mordor Intelligence | |||
High Cap-Ex for Charging and Grid Upgrades
Rolling out continent-wide fast-charging corridors entails heavy capital intensity that strains public budgets competing with health and education priorities. South Africa runs roughly 316 public chargers, concentrated around Gauteng, underscoring the infrastructure gap even in the most advanced auto hub. Nigeria’s flagship charging super-station signals private-sector appetite, but financing requirements remain daunting for the 53 other countries where electricity networks are often under-funded. Grid modernization must occur in tandem with charger deployment, a dual investment track extending developers' payback periods. Elevated borrowing costs across many African economies further depress project internal-rate-of-return calculations. Consequently, blended-finance structures and concessional climate funds will be essential to scale charging networks that can support sustained growth in the Africa electric vehicle market.
Weak Grid Reliability and Low Electrification Outside Metros
Urban areas like Nairobi, Lagos, and Johannesburg enjoy a relatively stable supply, yet rural regions face intermittent outages that impede dependable vehicle charging. The reliability gap curtails the addressable demand for cars and vans operating beyond metropolitan rings. Paradoxically, countries with high renewable potential lack transmission infrastructure capable of delivering consistent power for transport electrification, especially during evening peaks. Rural electrification programs prioritize household lighting over high-capacity vehicle chargers, elongating timelines for broad EV accessibility. Unless mini-grid developers integrate mobility loads into project economics, the Africa electric vehicle market risks becoming an urban-centric phenomenon, delaying environmental gains from nationwide fleet decarbonization.
Segment Analysis
By Propulsion Type: BEV Dominance Drives Market Foundation
Battery-electric vehicles generated 79.23% of 2024 revenue, anchoring the Africa electric vehicle market. Fuel-cell vehicles will accelerate at 58.31% CAGR through 2030, underpinned by South Africa’s EUR 4.7 billion green-hydrogen program that leverages the nation’s platinum reserves. The Africa electric vehicle market size for fuel-cell platforms is projected to rise sharply once green-hydrogen hubs reach commercialization after 2027. Plug-in hybrids remain niche because most governments incentivize full electrification to bypass imported fuel dependencies. Unencumbered by legacy ICE supply chains, African assemblers can commit entirely to BEV architectures, channeling limited capital toward a single technology stack. As local battery plants scale, BEV sticker prices are set to fall, reinforcing their market supremacy while fuel-cell ecosystems mature in parallel.
The Africa electric vehicle market share of BEVs is expected to remain above 70% through 2030, even as FCEVs penetrate freight, mining, and inter-city bus routes that value hydrogen’s long-range attributes. Policy clarity around hydrogen infrastructure roll-out will determine the pace at which truck fleets pivot from diesel to fuel cells. Until then, BEVs will continue dominating passenger and light-commercial categories because charging networks expand faster than hydrogen refueling stations. The propulsion landscape, therefore, tilts toward a BEV-first trajectory with selective FCEV uptake in high-utilization heavy-duty niches.

Note: Segment shares of all individual segments available upon report purchase
By Vehicle Type: Two-Wheeler Revolution Reshapes Mobility
Passenger cars led the 2024 revenue pool at 61.81%, yet two- and three-wheelers will chalk up a 59.72% CAGR, mirroring the continent’s ride-hail and cargo-delivery dynamics. The Africa electric vehicle market size for two-wheelers is projected to triple between 2025 and 2027 as micro-mobility companies expand battery-swap networks. Operators prefer electric bikes because daily fuel savings exceed battery-subscription fees, directly boosting take-home income. Ride-hailing platforms bundle bikes with insurance and digital-wallet repayment plans, broadening access for drivers lacking formal credit histories.
Commercial vans and buses remain smaller slices but hold strategic relevance. Electric buses employed by Roam Kenya cut operator energy costs by 50% and improve urban air-quality metrics, prompting Nairobi County to waive route-licensing fees for zero-emission fleets. Long-distance coaches and heavy trucks await higher-capacity charging corridors or hydrogen alternatives. Nevertheless, growing city-bus electrification projects will anchor depot-based DC fast-charging hubs that spill over into public-access fast-chargers, strengthening the Africa electric vehicle market infrastructure base.
By Vehicle Drive Type: FWD Efficiency Meets AWD Performance Demand
Front-wheel-drive layouts captured 58.17% revenue share in 2024, meeting urban efficiency needs at lower cost. All-wheel-drive’s 57.82% CAGR reflects a shift toward SUVs and pickups adapted for Africa’s mixed road conditions. Tesla’s planned Morocco plant will assemble AWD variants that cater to consumers traveling between paved urban arteries and unpaved peri-urban tracks. Premium importers already market AWD crossovers suited for both city commutes and rural journeys, signaling a gradual re-mix of drivetrain demand.
Rear-wheel drive retains loyalty among commercial haulers and performance enthusiasts. Yet local assemblers favor FWD platforms because component sourcing and assembly complexity are lower, aligning with thin supplier bases. Consequently, FWD will stay dominant in the Africa electric vehicle market while AWD gains traction in higher-margin lifestyle and commercial-utility segments.
By Battery Chemistry: NMC Leadership Faces Solid-State Disruption
Nickel-manganese-cobalt batteries controlled 51.29% of 2024 shipments, leveraging abundant regional cobalt resources. The Africa electric vehicle market is, however, poised to diversify chemistry options. Solid-state cells are projected to grow at a 57.62% CAGR, promising higher energy density and enhanced thermal safety. Early adoption will begin in premium SUVs and buses, prioritizing extended range, gradually cascading into mass models post-2028. Lithium-iron-phosphate retains a strong foothold within two-wheelers and entry-level cars because of cost and safety advantages, with sodium-ion chemistries emerging for stationary storage applications co-located with mini-grids.
Morocco’s 70 GWh COBCO precursor plant ensures secure NMC supply for assemblers across West and Central Africa. Meanwhile, academic-industrial consortia in South Africa pilot locally sourced solid-electrolyte formulations built upon abundant sodium resources, illustrating the chemistry diversification underway. Over the forecast horizon, chemistry selection will hinge on raw-material availability, pack-level cost, and evolving safety regulations, shaping competitive positioning within the Africa electric vehicle market.
Note: Segment shares of all individual segments available upon report purchase
By Charging Method: AC Dominance Yields to DC Fast-Charging Future
AC slow-charging systems delivered 68.61% of 2024 energy to African EVs through home sockets and workplace wall-boxes. DC fast-charging is set to expand at a 57.21% CAGR due to national corridor projects backed by development-finance institutions. Nigeria’s mega-station demonstrates economies of scale for 150 kW chargers powered by onsite solar-storage hybrids. Audi South Africa’s 150 kW network shows premium brands catalyze technology upgrading, with lessons filtering to mass-market networks.
Policy standardization of plug types and tariff structures will accelerate DC roll-outs. Cross-border freight lanes identified by AfCFTA agencies are earmarked for 350 kW chargers that cut truck dwell times. While AC remains dominant through 2027, rapid corridor deployment will narrow the gap thereafter, reinforcing confidence in long-distance usability and expanding the total addressable Africa electric vehicle market.
Geography Analysis
Ghana commands 29.31% of 2024 revenue after removing import duties and launching sovereign-fund incentives that attract assembly partners. The Africa electric vehicle market share generated by Ghana benefits from port proximity that eases inbound battery-cell logistics and outgoing vehicle exports to West African neighbors. Ethiopia ranks as the fastest-growing country at 58.92% CAGR owing to its ICE ban and 96% hydro-powered grid, simultaneously eliminating tailpipe and electricity-generation emissions[1]“Ethiopia’s electric revolution,”, CNN Africa Correspondent, cnn.com. Consumers in Addis Ababa rapidly shift to battery-electric taxis, stimulated by ride-hail fleet mandates that favor zero-emission vehicles.
South Africa maintains long-standing automotive supply-chain advantages and introduces rebates to localize EV production. BYD’s release of three models creates new competition for incumbent OEMs and keeps the Africa electric vehicle market dynamic. Morocco’s 614,000-unit 2024 output, with a target of 100,000 EVs by 2025, positions the country as a bridge between Africa and Europe, tapping into duty-free access under EU-Mediterranean agreements.
Nigeria stakes out a 2040 zero-emission sales target and hosts the continent’s largest assembled charging station, yet grid reliability challenges slow immediate uptake. Kenya registered a five-fold jump in 2023 sales and now leverages cheap geothermal electricity to power charging hubs in Nairobi and Mombasa. Egypt negotiates CKD assembly with Volkswagen to serve both North Africa and the Middle East, reflecting strategic diversification. Smaller markets like Rwanda pioneer agricultural e-tractors, while Burkina Faso debuts an indigenous EV brand, demonstrating a broadening innovation base. Collectively, regional integration under AfCFTA will foster specialization and supply-chain synergies that grow the Africa electric vehicle market beyond today’s high-potential hotspots.
Competitive Landscape
Competition is fragmented, creating white-space for new entrants. Chinese manufacturers such as BYD and Gotion pursue vertical integration, coupling battery plants with CKD vehicle lines that shorten delivery times and cut landed costs. Tesla’s USD 5 billion Morocco commitment signals Western OEM acknowledgment of regional demand pull. Volkswagen invests USD 210 million to expand South African capacity and deploys e-tractors in Rwanda and Nigeria, aligning with rural electrification agendas[2]“Tesla confirms Morocco factory,”, African News Agency, africanewsagency.ma.
African startups—including Ampersand, Roam, BasiGo, and Spiro—lead in two-wheeler electrification and battery swapping, leveraging fintech partnerships for driver leasing. Spiro’s 9 million battery swaps generate recurring revenue that funds network expansion, illustrating alternative profit pools within the African electric vehicle market. As in Ethiopia's EV deployment, strategic collaborations between OEMs and state-owned utilities enhance grid-upgrade planning while anchoring domestic content targets.
Regulatory incentives increasingly reward local manufacturing, prompting tier-one suppliers to site cathode, anode, and cell-pack plants in mineral-rich jurisdictions. As supply-chain footprints expand, bargaining power diffuses across an enlarged ecosystem, reinforcing competitive intensity while lowering entry barriers for component specialists and software-defined-vehicle startups.
Africa Electric Vehicle Industry Leaders
-
Nissan Motor Co., Ltd.
-
Volkswagen AG
-
Tesla Inc.
-
BYD Co. Ltd.
-
Hyundai Motor Co.
- *Disclaimer: Major Players sorted in no particular order
Need More Details on Market Players and Competitors?
Download PDF
Recent Industry Developments
- June 2025: Sino-Moroccan COBCO began EV-battery material production at 70 GWh annual capacity, enough for nearly 1 million vehicles.
- March 2025: Lagos inaugurated Africa's largest assembled fast-charging station, marking a significant milestone in the continent's transition to sustainable energy solutions.
- April 2024: Roam Electric partnered with County Bus Service to deploy 200 electric buses across Kenya by 2026.
Africa Electric Vehicle Market Report Scope
An electric vehicle (EV) runs on electricity rather than an internal combustion engine (ICE). As a result, such a vehicle is viewed as a potential replacement for current-generation automobiles to address issues such as rising pollution, global warming, and depleting natural resources.
The African EV market is segmented by propulsion, vehicle type, vehicle drive type, and country. By propulsion, the market is segmented into battery electric vehicles, hybrid electric vehicles, fuel cell electric vehicles, and plug-in hybrid electric vehicles. By vehicle type, the market is segmented into passenger cars and commercial vehicles. By vehicle drive type, the market is segmented into front-wheel drive, rear-wheel drive, and all-wheel drive. By country, the market is segmented into South Africa, Egypt, Morocco, Nigeria, Ghana, and Rest of Africa. The report offers market size and forecasts in value (USD) for all the above segments.
By Propulsion Type
| Battery Electric Vehicles (BEV) |
| Plug-in Hybrid Electric Vehicles (PHEV) |
| Hybrid Electric Vehicles (HEV) |
| Fuel-Cell Electric Vehicles (FCEV) |
By Vehicle Type
| Passenger Cars |
| Commercial Vehicles |
| Two- and Three-Wheelers |
| Buses and Coaches |
By Vehicle Drive Type
| Front-Wheel Drive |
| Rear-Wheel Drive |
| All-Wheel Drive |
By Battery Chemistry
| Lithium-Iron-Phosphate (LFP) |
| Nickel-Manganese-Cobalt (NMC) |
| Sodium-ion |
| Solid-State |
| Other Emerging Chemistries (Li-S, Li-Air) |
By Charging Method
| AC Slow (Below 22 kW) |
| DC Fast (Above50 kW) |
By Country
| South Africa |
| Morocco |
| Nigeria |
| Egypt |
| Ethiopia |
| Ghana |
| Kenya |
| Rest of Africa |
| By Propulsion Type | Battery Electric Vehicles (BEV) |
| Plug-in Hybrid Electric Vehicles (PHEV) | |
| Hybrid Electric Vehicles (HEV) | |
| Fuel-Cell Electric Vehicles (FCEV) | |
| By Vehicle Type | Passenger Cars |
| Commercial Vehicles | |
| Two- and Three-Wheelers | |
| Buses and Coaches | |
| By Vehicle Drive Type | Front-Wheel Drive |
| Rear-Wheel Drive | |
| All-Wheel Drive | |
| By Battery Chemistry | Lithium-Iron-Phosphate (LFP) |
| Nickel-Manganese-Cobalt (NMC) | |
| Sodium-ion | |
| Solid-State | |
| Other Emerging Chemistries (Li-S, Li-Air) | |
| By Charging Method | AC Slow (Below 22 kW) |
| DC Fast (Above50 kW) | |
| By Country | South Africa |
| Morocco | |
| Nigeria | |
| Egypt | |
| Ethiopia | |
| Ghana | |
| Kenya | |
| Rest of Africa |
Need A Different Region or Segment?
Customize Now
Key Questions Answered in the Report
How big is the Africa electric vehicle market in 2025?
It is valued at USD 0.45 billion in 2025 and is forecast to reach USD 4.2 billion by 2030.
What is driving rapid electric two-wheeler adoption?
Battery-swap networks and pay-per-use financing cut upfront costs and boost driver income, pushing two-wheeler CAGRs above 59%.
Why are battery plants clustering in Morocco?
Investors leverage proximity to Europe, renewable-energy inputs, and favorable industrial zones, lowering landed battery costs for regional assemblers.
What are the main barriers to wider EV uptake outside cities?
High cap-ex for fast-charging networks and weak rural grid reliability slow adoption beyond metropolitan centers.
How supportive are African governments toward local EV production?
Ethiopia, South Africa, Ghana, and Morocco have introduced bans, rebates, or zero-tariff schemes that attract OEM and battery investors to assemble locally.
Page last updated on:

