Automatic Impact Testing Machine Market Size and Share Forecast Outlook 2025 to 2035

The Automatic Impact Testing Machine Market is estimated to be valued at USD 213.0 million in 2025 and is projected to reach USD 399.8 million by 2035, registering a compound annual growth rate (CAGR) of 6.5% over the forecast period.
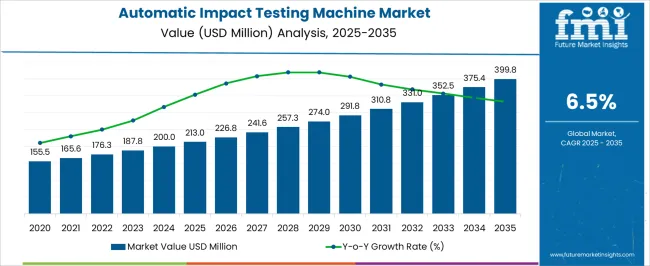
Quick Stats for Automatic Impact Testing Machine Market

  • Automatic Impact Testing Machine Market Value (2025): USD 213.0 million
  • Automatic Impact Testing Machine Market Forecast Value (2035): USD 399.8 million
  • Automatic Impact Testing Machine Market Forecast CAGR: 6.5%
  • Leading Segment in Automatic Impact Testing Machine Market in 2025: Main Instrument (55.0%)
  • Key Growth Regions in Automatic Impact Testing Machine Market: North America, Asia-Pacific, Europe
  • Top Key Players in Automatic Impact Testing Machine Market: INSTRON, MTS, Tinius Olsen, Bairoe, Cadex, Instron, Fine Manufacturing, Zwick, Laryee Technology, R. K. Instruments, Akash Industries, SUNTEST, Coesfeld, QingDao ZhongBang

Automatic Impact Testing Machine Market Value Analysis

Automatic Impact Testing Machine Market Key Takeaways

Metric Value
Automatic Impact Testing Machine Market Estimated Value in (2025 E) USD 213.0 million
Automatic Impact Testing Machine Market Forecast Value in (2035 F) USD 399.8 million
Forecast CAGR (2025 to 2035) 6.5%

Why is the Automatic Impact Testing Machine Market Growing?

The Automatic Impact Testing Machine market is experiencing steady growth as industrial sectors increasingly prioritize material testing, quality assurance, and compliance with global safety and engineering standards. The current market scenario reflects strong adoption across research and development centers, manufacturing plants, and educational institutions where material performance evaluation is critical.

The market growth is being supported by advancements in automation and precision control technologies that enhance the reliability and repeatability of impact testing. Rising investments in material science research and the need for standardized testing procedures in construction, automotive, aerospace, and metallurgical industries are further boosting demand.

Additionally, the growing emphasis on skill development in educational laboratories and the expansion of technical training programs are facilitating adoption in academic institutions As industries continue to focus on product durability, safety, and process optimization, the market for automatic impact testing machines is anticipated to grow steadily, providing versatile solutions that combine robust instrumentation with advanced software and service integration.

Segmental Analysis

The automatic impact testing machine market is segmented by component, service type, end use, industry, sales channel, and geographic regions. By component, automatic impact testing machine market is divided into Main Instrument and Accessories. In terms of service type, automatic impact testing machine market is classified into Calibration Services, Repair Services, and Others. Based on end use, automatic impact testing machine market is segmented into Educational Laboratory, Research Institute, Industries, and Others. By industry, automatic impact testing machine market is segmented into Automobile, Mechanical, Mining, Construction, Manufacturing, and Others. By sales channel, automatic impact testing machine market is segmented into OEMs, Distributors, and E-Commerce. Regionally, the automatic impact testing machine industry is classified into North America, Latin America, Western Europe, Eastern Europe, Balkan & Baltic Countries, Russia & Belarus, Central Asia, East Asia, South Asia & Pacific, and the Middle East & Africa.
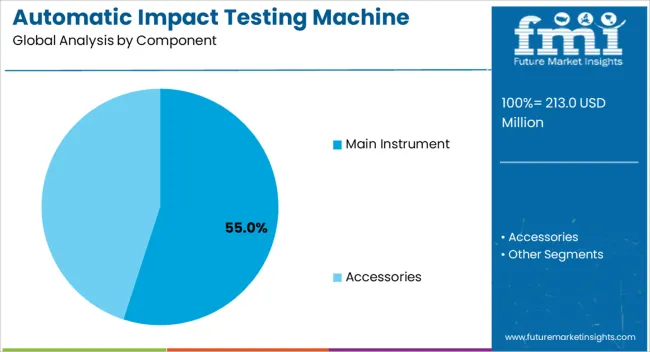
Insights into the Main Instrument Segment

Automatic Impact Testing Machine Market Analysis By Component

The main instrument component is projected to account for 55.00% of the overall Automatic Impact Testing Machine market revenue in 2025, positioning it as the leading component segment. This dominance is being driven by the critical role of the instrument in accurately performing impact tests, ensuring compliance with international standards, and enabling repeatable results.

Growth has been facilitated by innovations in precision engineering, automation, and sensor integration, which enhance the reliability and accuracy of impact measurements. Industrial and research applications demand high-performance instrumentation that can withstand repeated mechanical stress and provide consistent results, making this segment essential for material testing laboratories and manufacturing units.

The long operational life, ease of calibration, and compatibility with software-based data acquisition systems have reinforced its market position As industries continue to emphasize quality assurance, durability testing, and automated processes, the main instrument segment is expected to maintain its leading share and support overall market expansion.
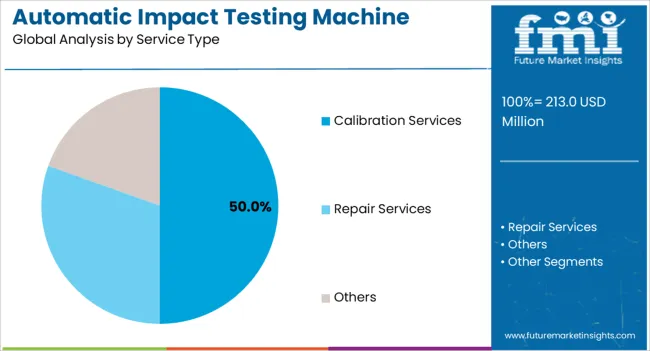
Insights into the Calibration Services Segment

Automatic Impact Testing Machine Market Analysis By Service Type

Calibration services are anticipated to hold 50.00% of the market revenue in 2025, emerging as the most prominent service type within the Automatic Impact Testing Machine market. This growth has been driven by the critical need for regular calibration to ensure accurate and reproducible test results, maintain compliance with international testing standards, and optimize machine performance.

The increasing complexity of automated testing systems has elevated the importance of professional calibration services to prevent measurement errors and reduce downtime. Service providers offering timely maintenance, calibration, and validation support have been key enablers for the adoption of automatic impact testing machines in industrial and academic settings.

With growing regulatory scrutiny and heightened emphasis on laboratory accreditation, the demand for calibration services is expected to rise, reinforcing the value of ongoing service support and contributing significantly to market growth.
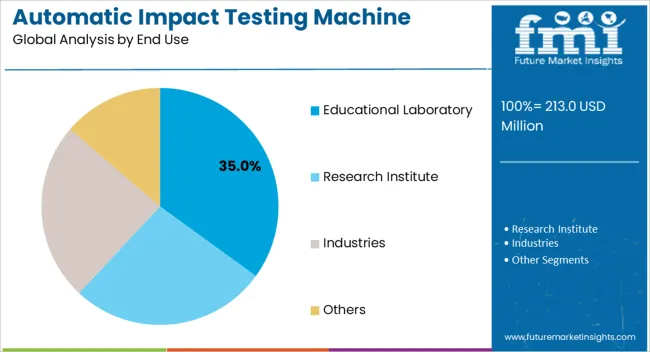
Insights into the Educational Laboratory Segment

Automatic Impact Testing Machine Market Analysis By End Use

The educational laboratory end-use industry is projected to account for 35.00% of the Automatic Impact Testing Machine market revenue in 2025, making it the largest end-use segment. This growth has been facilitated by increasing integration of material science and engineering programs into higher education curricula, where hands-on training in impact testing is essential for developing practical skills.

Educational institutions are increasingly investing in automated testing machines to provide students with exposure to real-world industrial practices, ensuring proficiency in standard testing protocols. The adoption is further supported by the machines’ ease of use, safety features, and adaptability for multiple material types, which make them ideal for learning environments.

As universities, technical colleges, and research laboratories continue to expand their programs in materials engineering and applied sciences, the demand for automatic impact testing machines in educational laboratories is expected to remain robust, supporting overall market expansion and skill development initiatives.

Market Overview

Automatic Impact Testing Machine Market Overview

The Impact tests measure the resistance to failure property of materials for application of a sudden force. The energy absorbed before fracture and Impact energy is tested through the automatic impact testing machine. Automatic impact testers are used for conducting Izod, and Charpy test.

The Automatic impact testing machine comprises of the automatic lifting of the pendulum, loading of the specimen, and automatic releasing of the pendulum. Some of the companies provide a digital display or analog display to show the result of the test conducted by the automatic impact testing machine.

Additionally, machines for preparation of specimens for these tests are provided by the automatic impact testing machine manufacturers. Automatic impact testing machine market is expected to find extensive use in the industries including automobile, mechanical, construction, and mining industries.

This is due to the expansion and increasing focus on the quality products BY these industries. Thus, automobile impact testing machine market is expected to ensure a significant growth during the forecast period.
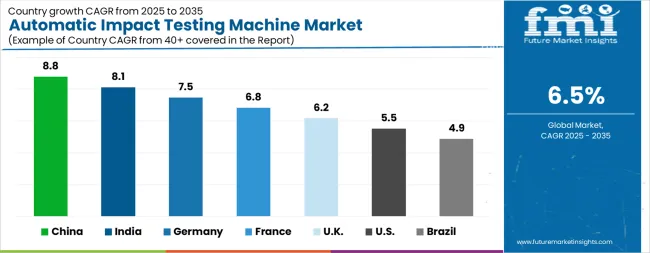
Analysis of Automatic Impact Testing Machine Market By Key Countries

Automatic Impact Testing Machine Market Cagr Analysis By Country

Country CAGR
China 8.8%
India 8.1%
Germany 7.5%
France 6.8%
UK 6.2%
USA 5.5%
Brazil 4.9%

Country-wise Analysis

The Automatic Impact Testing Machine Market is expected to register a CAGR of 6.5% during the forecast period, exhibiting varied country level momentum. China leads with the highest CAGR of 8.8%, followed by India at 8.1%. Developed markets such as Germany, France, and the UK continue to expand steadily, while the USA is likely to grow at consistent rates. Brazil posts the lowest CAGR at 4.9%, yet still underscores a broadly positive trajectory for the global Automatic Impact Testing Machine Market. In 2024, Germany held a dominant revenue in the Western Europe market and is expected to grow with a CAGR of 7.5%. The USA Automatic Impact Testing Machine Market is estimated to be valued at USD 72.8 million in 2025 and is anticipated to reach a valuation of USD 124.7 million by 2035. Sales are projected to rise at a CAGR of 5.5% over the forecast period between 2025 and 2035. While Japan and South Korea markets are estimated to be valued at USD 11.4 million and USD 6.1 million respectively in 2025.
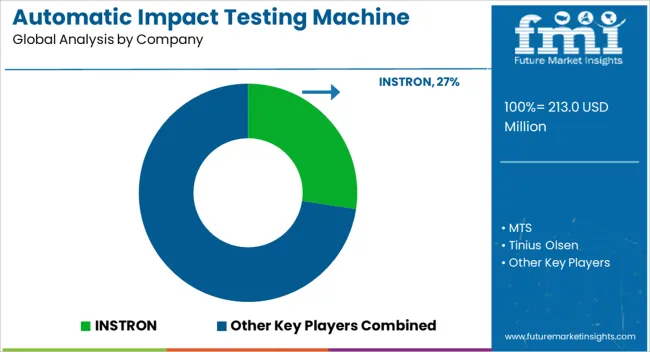
Key Players in the Automatic Impact Testing Machine Market

Automatic Impact Testing Machine Market Analysis By Company

  • INSTRON
  • MTS
  • Tinius Olsen
  • Bairoe
  • Cadex
  • Instron
  • Fine Manufacturing
  • Zwick
  • Laryee Technology
  • R. K. Instruments
  • Akash Industries
  • SUNTEST
  • Coesfeld
  • QingDao ZhongBang

Scope of the Report

Item Value
Quantitative Units USD 213.0 Million
Component Main Instrument and Accessories
Service Type Calibration Services, Repair Services, and Others
End Use Educational Laboratory, Research Institute, Industries, and Others
Industry Automobile, Mechanical, Mining, Construction, Manufacturing, and Others
Sales Channel OEMs, Distributors, and E-Commerce
Regions Covered North America, Europe, Asia-Pacific, Latin America, Middle East & Africa
Country Covered United States, Canada, Germany, France, United Kingdom, China, Japan, India, Brazil, South Africa
Key Companies Profiled INSTRON, MTS, Tinius Olsen, Bairoe, Cadex, Instron, Fine Manufacturing, Zwick, Laryee Technology, R. K. Instruments, Akash Industries, SUNTEST, Coesfeld, and QingDao ZhongBang

Automatic Impact Testing Machine Market by Segments

Component:

  • Main Instrument
  • Accessories

Service Type:

  • Calibration Services
  • Repair Services
  • Others

End Use:

  • Educational Laboratory
  • Research Institute
  • Industries
  • Others

Industry:

  • Automobile
  • Mechanical
  • Mining
  • Construction
  • Manufacturing
  • Others

Sales Channel:

  • OEMs
  • Distributors
  • E-Commerce

Region:

  • North America
    • USA
    • Canada
    • Mexico
  • Latin America
    • Brazil
    • Chile
    • Rest of Latin America
  • Western Europe
    • Germany
    • UK
    • Italy
    • Spain
    • France
    • Nordic
    • BENELUX
    • Rest of Western Europe
  • Eastern Europe
    • Russia
    • Poland
    • Hungary
    • Balkan & Baltic
    • Rest of Eastern Europe
  • East Asia
    • China
    • Japan
    • South Korea
  • South Asia and Pacific
    • India
    • ASEAN
    • Australia & New Zealand
    • Rest of South Asia and Pacific
  • Middle East & Africa
    • Kingdom of Saudi Arabia
    • Other GCC Countries
    • Turkiye
    • South Africa
    • Other African Union
    • Rest of Middle East & Africa

Frequently Asked Questions

How big is the automatic impact testing machine market in 2025?

The global automatic impact testing machine market is estimated to be valued at USD 213.0 million in 2025.

What will be the size of automatic impact testing machine market in 2035?

The market size for the automatic impact testing machine market is projected to reach USD 399.8 million by 2035.

How much will be the automatic impact testing machine market growth between 2025 and 2035?

The automatic impact testing machine market is expected to grow at a 6.5% CAGR between 2025 and 2035.

What are the key product types in the automatic impact testing machine market?

The key product types in automatic impact testing machine market are main instrument and accessories.

Which service type segment to contribute significant share in the automatic impact testing machine market in 2025?

In terms of service type, calibration services segment to command 50.0% share in the automatic impact testing machine market in 2025.

Table of Content

  1. Executive Summary
    • Global Market Outlook
    • Demand-side Trends
    • Supply-side Trends
    • Technology Roadmap Analysis
    • Analysis and Recommendations
  2. Market Overview
    • Market Coverage / Taxonomy
    • Market Definition / Scope / Limitations
  3. Market Background
    • Market Dynamics
      • Drivers
      • Restraints
      • Opportunity
      • Trends
    • Scenario Forecast
      • Demand in Optimistic Scenario
      • Demand in Likely Scenario
      • Demand in Conservative Scenario
    • Opportunity Map Analysis
    • Product Life Cycle Analysis
    • Supply Chain Analysis
    • Investment Feasibility Matrix
    • Value Chain Analysis
    • PESTLE and Porter’s Analysis
    • Regulatory Landscape
    • Regional Parent Market Outlook
    • Production and Consumption Statistics
    • Import and Export Statistics
  4. Global Market Analysis 2020 to 2024 and Forecast, 2025 to 2035
    • Historical Market Size Value (USD Million) Analysis, 2020 to 2024
    • Current and Future Market Size Value (USD Million) Projections, 2025 to 2035
      • Y-o-Y Growth Trend Analysis
      • Absolute $ Opportunity Analysis
  5. Global Market Pricing Analysis 2020 to 2024 and Forecast 2025 to 2035
  6. Global Market Analysis 2020 to 2024 and Forecast 2025 to 2035, By Component
    • Introduction / Key Findings
    • Historical Market Size Value (USD Million) Analysis By Component , 2020 to 2024
    • Current and Future Market Size Value (USD Million) Analysis and Forecast By Component , 2025 to 2035
      • Main Instrument
      • Accessories
    • Y-o-Y Growth Trend Analysis By Component , 2020 to 2024
    • Absolute $ Opportunity Analysis By Component , 2025 to 2035
  7. Global Market Analysis 2020 to 2024 and Forecast 2025 to 2035, By Service Type
    • Introduction / Key Findings
    • Historical Market Size Value (USD Million) Analysis By Service Type, 2020 to 2024
    • Current and Future Market Size Value (USD Million) Analysis and Forecast By Service Type, 2025 to 2035
      • Calibration Services
      • Repair Services
      • Others
    • Y-o-Y Growth Trend Analysis By Service Type, 2020 to 2024
    • Absolute $ Opportunity Analysis By Service Type, 2025 to 2035
  8. Global Market Analysis 2020 to 2024 and Forecast 2025 to 2035, By End Use
    • Introduction / Key Findings
    • Historical Market Size Value (USD Million) Analysis By End Use, 2020 to 2024
    • Current and Future Market Size Value (USD Million) Analysis and Forecast By End Use, 2025 to 2035
      • Educational Laboratory
      • Research Institute
      • Industries
      • Others
    • Y-o-Y Growth Trend Analysis By End Use, 2020 to 2024
    • Absolute $ Opportunity Analysis By End Use, 2025 to 2035
  9. Global Market Analysis 2020 to 2024 and Forecast 2025 to 2035, By Industry
    • Introduction / Key Findings
    • Historical Market Size Value (USD Million) Analysis By Industry, 2020 to 2024
    • Current and Future Market Size Value (USD Million) Analysis and Forecast By Industry, 2025 to 2035
      • Automobile
      • Mechanical
      • Mining
      • Construction
      • Manufacturing
      • Others
    • Y-o-Y Growth Trend Analysis By Industry, 2020 to 2024
    • Absolute $ Opportunity Analysis By Industry, 2025 to 2035
  10. Global Market Analysis 2020 to 2024 and Forecast 2025 to 2035, By Sales Channel
    • Introduction / Key Findings
    • Historical Market Size Value (USD Million) Analysis By Sales Channel, 2020 to 2024
    • Current and Future Market Size Value (USD Million) Analysis and Forecast By Sales Channel, 2025 to 2035
      • OEMs
      • Distributors
      • E-Commerce
    • Y-o-Y Growth Trend Analysis By Sales Channel, 2020 to 2024
    • Absolute $ Opportunity Analysis By Sales Channel, 2025 to 2035
  11. Global Market Analysis 2020 to 2024 and Forecast 2025 to 2035, By Region
    • Introduction
    • Historical Market Size Value (USD Million) Analysis By Region, 2020 to 2024
    • Current Market Size Value (USD Million) Analysis and Forecast By Region, 2025 to 2035
      • North America
      • Latin America
      • Western Europe
      • Eastern Europe
      • East Asia
      • South Asia and Pacific
      • Middle East & Africa
    • Market Attractiveness Analysis By Region
  12. North America Market Analysis 2020 to 2024 and Forecast 2025 to 2035, By Country
    • Historical Market Size Value (USD Million) Trend Analysis By Market Taxonomy, 2020 to 2024
    • Market Size Value (USD Million) Forecast By Market Taxonomy, 2025 to 2035
      • By Country
        • USA
        • Canada
        • Mexico
      • By Component
      • By Service Type
      • By End Use
      • By Industry
      • By Sales Channel
    • Market Attractiveness Analysis
      • By Country
      • By Component
      • By Service Type
      • By End Use
      • By Industry
      • By Sales Channel
    • Key Takeaways
  13. Latin America Market Analysis 2020 to 2024 and Forecast 2025 to 2035, By Country
    • Historical Market Size Value (USD Million) Trend Analysis By Market Taxonomy, 2020 to 2024
    • Market Size Value (USD Million) Forecast By Market Taxonomy, 2025 to 2035
      • By Country
        • Brazil
        • Chile
        • Rest of Latin America
      • By Component
      • By Service Type
      • By End Use
      • By Industry
      • By Sales Channel
    • Market Attractiveness Analysis
      • By Country
      • By Component
      • By Service Type
      • By End Use
      • By Industry
      • By Sales Channel
    • Key Takeaways
  14. Western Europe Market Analysis 2020 to 2024 and Forecast 2025 to 2035, By Country
    • Historical Market Size Value (USD Million) Trend Analysis By Market Taxonomy, 2020 to 2024
    • Market Size Value (USD Million) Forecast By Market Taxonomy, 2025 to 2035
      • By Country
        • Germany
        • UK
        • Italy
        • Spain
        • France
        • Nordic
        • BENELUX
        • Rest of Western Europe
      • By Component
      • By Service Type
      • By End Use
      • By Industry
      • By Sales Channel
    • Market Attractiveness Analysis
      • By Country
      • By Component
      • By Service Type
      • By End Use
      • By Industry
      • By Sales Channel
    • Key Takeaways
  15. Eastern Europe Market Analysis 2020 to 2024 and Forecast 2025 to 2035, By Country
    • Historical Market Size Value (USD Million) Trend Analysis By Market Taxonomy, 2020 to 2024
    • Market Size Value (USD Million) Forecast By Market Taxonomy, 2025 to 2035
      • By Country
        • Russia
        • Poland
        • Hungary
        • Balkan & Baltic
        • Rest of Eastern Europe
      • By Component
      • By Service Type
      • By End Use
      • By Industry
      • By Sales Channel
    • Market Attractiveness Analysis
      • By Country
      • By Component
      • By Service Type
      • By End Use
      • By Industry
      • By Sales Channel
    • Key Takeaways
  16. East Asia Market Analysis 2020 to 2024 and Forecast 2025 to 2035, By Country
    • Historical Market Size Value (USD Million) Trend Analysis By Market Taxonomy, 2020 to 2024
    • Market Size Value (USD Million) Forecast By Market Taxonomy, 2025 to 2035
      • By Country
        • China
        • Japan
        • South Korea
      • By Component
      • By Service Type
      • By End Use
      • By Industry
      • By Sales Channel
    • Market Attractiveness Analysis
      • By Country
      • By Component
      • By Service Type
      • By End Use
      • By Industry
      • By Sales Channel
    • Key Takeaways
  17. South Asia and Pacific Market Analysis 2020 to 2024 and Forecast 2025 to 2035, By Country
    • Historical Market Size Value (USD Million) Trend Analysis By Market Taxonomy, 2020 to 2024
    • Market Size Value (USD Million) Forecast By Market Taxonomy, 2025 to 2035
      • By Country
        • India
        • ASEAN
        • Australia & New Zealand
        • Rest of South Asia and Pacific
      • By Component
      • By Service Type
      • By End Use
      • By Industry
      • By Sales Channel
    • Market Attractiveness Analysis
      • By Country
      • By Component
      • By Service Type
      • By End Use
      • By Industry
      • By Sales Channel
    • Key Takeaways
  18. Middle East & Africa Market Analysis 2020 to 2024 and Forecast 2025 to 2035, By Country
    • Historical Market Size Value (USD Million) Trend Analysis By Market Taxonomy, 2020 to 2024
    • Market Size Value (USD Million) Forecast By Market Taxonomy, 2025 to 2035
      • By Country
        • Kingdom of Saudi Arabia
        • Other GCC Countries
        • Turkiye
        • South Africa
        • Other African Union
        • Rest of Middle East & Africa
      • By Component
      • By Service Type
      • By End Use
      • By Industry
      • By Sales Channel
    • Market Attractiveness Analysis
      • By Country
      • By Component
      • By Service Type
      • By End Use
      • By Industry
      • By Sales Channel
    • Key Takeaways
  19. Key Countries Market Analysis
    • USA
      • Pricing Analysis
      • Market Share Analysis, 2024
        • By Component
        • By Service Type
        • By End Use
        • By Industry
        • By Sales Channel
    • Canada
      • Pricing Analysis
      • Market Share Analysis, 2024
        • By Component
        • By Service Type
        • By End Use
        • By Industry
        • By Sales Channel
    • Mexico
      • Pricing Analysis
      • Market Share Analysis, 2024
        • By Component
        • By Service Type
        • By End Use
        • By Industry
        • By Sales Channel
    • Brazil
      • Pricing Analysis
      • Market Share Analysis, 2024
        • By Component
        • By Service Type
        • By End Use
        • By Industry
        • By Sales Channel
    • Chile
      • Pricing Analysis
      • Market Share Analysis, 2024
        • By Component
        • By Service Type
        • By End Use
        • By Industry
        • By Sales Channel
    • Germany
      • Pricing Analysis
      • Market Share Analysis, 2024
        • By Component
        • By Service Type
        • By End Use
        • By Industry
        • By Sales Channel
    • UK
      • Pricing Analysis
      • Market Share Analysis, 2024
        • By Component
        • By Service Type
        • By End Use
        • By Industry
        • By Sales Channel
    • Italy
      • Pricing Analysis
      • Market Share Analysis, 2024
        • By Component
        • By Service Type
        • By End Use
        • By Industry
        • By Sales Channel
    • Spain
      • Pricing Analysis
      • Market Share Analysis, 2024
        • By Component
        • By Service Type
        • By End Use
        • By Industry
        • By Sales Channel
    • France
      • Pricing Analysis
      • Market Share Analysis, 2024
        • By Component
        • By Service Type
        • By End Use
        • By Industry
        • By Sales Channel
    • India
      • Pricing Analysis
      • Market Share Analysis, 2024
        • By Component
        • By Service Type
        • By End Use
        • By Industry
        • By Sales Channel
    • ASEAN
      • Pricing Analysis
      • Market Share Analysis, 2024
        • By Component
        • By Service Type
        • By End Use
        • By Industry
        • By Sales Channel
    • Australia & New Zealand
      • Pricing Analysis
      • Market Share Analysis, 2024
        • By Component
        • By Service Type
        • By End Use
        • By Industry
        • By Sales Channel
    • China
      • Pricing Analysis
      • Market Share Analysis, 2024
        • By Component
        • By Service Type
        • By End Use
        • By Industry
        • By Sales Channel
    • Japan
      • Pricing Analysis
      • Market Share Analysis, 2024
        • By Component
        • By Service Type
        • By End Use
        • By Industry
        • By Sales Channel
    • South Korea
      • Pricing Analysis
      • Market Share Analysis, 2024
        • By Component
        • By Service Type
        • By End Use
        • By Industry
        • By Sales Channel
    • Russia
      • Pricing Analysis
      • Market Share Analysis, 2024
        • By Component
        • By Service Type
        • By End Use
        • By Industry
        • By Sales Channel
    • Poland
      • Pricing Analysis
      • Market Share Analysis, 2024
        • By Component
        • By Service Type
        • By End Use
        • By Industry
        • By Sales Channel
    • Hungary
      • Pricing Analysis
      • Market Share Analysis, 2024
        • By Component
        • By Service Type
        • By End Use
        • By Industry
        • By Sales Channel
    • Kingdom of Saudi Arabia
      • Pricing Analysis
      • Market Share Analysis, 2024
        • By Component
        • By Service Type
        • By End Use
        • By Industry
        • By Sales Channel
    • Turkiye
      • Pricing Analysis
      • Market Share Analysis, 2024
        • By Component
        • By Service Type
        • By End Use
        • By Industry
        • By Sales Channel
    • South Africa
      • Pricing Analysis
      • Market Share Analysis, 2024
        • By Component
        • By Service Type
        • By End Use
        • By Industry
        • By Sales Channel
  20. Market Structure Analysis
    • Competition Dashboard
    • Competition Benchmarking
    • Market Share Analysis of Top Players
      • By Regional
      • By Component
      • By Service Type
      • By End Use
      • By Industry
      • By Sales Channel
  21. Competition Analysis
    • Competition Deep Dive
      • INSTRON
        • Overview
        • Product Portfolio
        • Profitability by Market Segments (Product/Age /Sales Channel/Region)
        • Sales Footprint
        • Strategy Overview
          • Marketing Strategy
          • Product Strategy
          • Channel Strategy
      • MTS
      • Tinius Olsen
      • Bairoe
      • Cadex
      • Instron
      • Fine Manufacturing
      • Zwick
      • Laryee Technology
      • R. K. Instruments
      • Akash Industries
      • SUNTEST
      • Coesfeld
      • QingDao ZhongBang
  22. Assumptions & Acronyms Used
  23. Research Methodology

List of Tables

  • Table 1: Global Market Value (USD Million) Forecast by Region, 2020-2035
  • Table 2: Global Market Value (USD Million) Forecast by Component , 2020-2035
  • Table 3: Global Market Value (USD Million) Forecast by Service Type, 2020-2035
  • Table 4: Global Market Value (USD Million) Forecast by End Use, 2020-2035
  • Table 5: Global Market Value (USD Million) Forecast by Industry, 2020-2035
  • Table 6: Global Market Value (USD Million) Forecast by Sales Channel, 2020-2035
  • Table 7: North America Market Value (USD Million) Forecast by Country, 2020-2035
  • Table 8: North America Market Value (USD Million) Forecast by Component , 2020-2035
  • Table 9: North America Market Value (USD Million) Forecast by Service Type, 2020-2035
  • Table 10: North America Market Value (USD Million) Forecast by End Use, 2020-2035
  • Table 11: North America Market Value (USD Million) Forecast by Industry, 2020-2035
  • Table 12: North America Market Value (USD Million) Forecast by Sales Channel, 2020-2035
  • Table 13: Latin America Market Value (USD Million) Forecast by Country, 2020-2035
  • Table 14: Latin America Market Value (USD Million) Forecast by Component , 2020-2035
  • Table 15: Latin America Market Value (USD Million) Forecast by Service Type, 2020-2035
  • Table 16: Latin America Market Value (USD Million) Forecast by End Use, 2020-2035
  • Table 17: Latin America Market Value (USD Million) Forecast by Industry, 2020-2035
  • Table 18: Latin America Market Value (USD Million) Forecast by Sales Channel, 2020-2035
  • Table 19: Western Europe Market Value (USD Million) Forecast by Country, 2020-2035
  • Table 20: Western Europe Market Value (USD Million) Forecast by Component , 2020-2035
  • Table 21: Western Europe Market Value (USD Million) Forecast by Service Type, 2020-2035
  • Table 22: Western Europe Market Value (USD Million) Forecast by End Use, 2020-2035
  • Table 23: Western Europe Market Value (USD Million) Forecast by Industry, 2020-2035
  • Table 24: Western Europe Market Value (USD Million) Forecast by Sales Channel, 2020-2035
  • Table 25: Eastern Europe Market Value (USD Million) Forecast by Country, 2020-2035
  • Table 26: Eastern Europe Market Value (USD Million) Forecast by Component , 2020-2035
  • Table 27: Eastern Europe Market Value (USD Million) Forecast by Service Type, 2020-2035
  • Table 28: Eastern Europe Market Value (USD Million) Forecast by End Use, 2020-2035
  • Table 29: Eastern Europe Market Value (USD Million) Forecast by Industry, 2020-2035
  • Table 30: Eastern Europe Market Value (USD Million) Forecast by Sales Channel, 2020-2035
  • Table 31: East Asia Market Value (USD Million) Forecast by Country, 2020-2035
  • Table 32: East Asia Market Value (USD Million) Forecast by Component , 2020-2035
  • Table 33: East Asia Market Value (USD Million) Forecast by Service Type, 2020-2035
  • Table 34: East Asia Market Value (USD Million) Forecast by End Use, 2020-2035
  • Table 35: East Asia Market Value (USD Million) Forecast by Industry, 2020-2035
  • Table 36: East Asia Market Value (USD Million) Forecast by Sales Channel, 2020-2035
  • Table 37: South Asia and Pacific Market Value (USD Million) Forecast by Country, 2020-2035
  • Table 38: South Asia and Pacific Market Value (USD Million) Forecast by Component , 2020-2035
  • Table 39: South Asia and Pacific Market Value (USD Million) Forecast by Service Type, 2020-2035
  • Table 40: South Asia and Pacific Market Value (USD Million) Forecast by End Use, 2020-2035
  • Table 41: South Asia and Pacific Market Value (USD Million) Forecast by Industry, 2020-2035
  • Table 42: South Asia and Pacific Market Value (USD Million) Forecast by Sales Channel, 2020-2035
  • Table 43: Middle East & Africa Market Value (USD Million) Forecast by Country, 2020-2035
  • Table 44: Middle East & Africa Market Value (USD Million) Forecast by Component , 2020-2035
  • Table 45: Middle East & Africa Market Value (USD Million) Forecast by Service Type, 2020-2035
  • Table 46: Middle East & Africa Market Value (USD Million) Forecast by End Use, 2020-2035
  • Table 47: Middle East & Africa Market Value (USD Million) Forecast by Industry, 2020-2035
  • Table 48: Middle East & Africa Market Value (USD Million) Forecast by Sales Channel, 2020-2035

List of Figures

  • Figure 1: Global Market Pricing Analysis
  • Figure 2: Global Market Value (USD Million) Forecast 2020-2035
  • Figure 3: Global Market Value Share and BPS Analysis by Component , 2025 and 2035
  • Figure 4: Global Market Y-o-Y Growth Comparison by Component , 2025-2035
  • Figure 5: Global Market Attractiveness Analysis by Component
  • Figure 6: Global Market Value Share and BPS Analysis by Service Type, 2025 and 2035
  • Figure 7: Global Market Y-o-Y Growth Comparison by Service Type, 2025-2035
  • Figure 8: Global Market Attractiveness Analysis by Service Type
  • Figure 9: Global Market Value Share and BPS Analysis by End Use, 2025 and 2035
  • Figure 10: Global Market Y-o-Y Growth Comparison by End Use, 2025-2035
  • Figure 11: Global Market Attractiveness Analysis by End Use
  • Figure 12: Global Market Value Share and BPS Analysis by Industry, 2025 and 2035
  • Figure 13: Global Market Y-o-Y Growth Comparison by Industry, 2025-2035
  • Figure 14: Global Market Attractiveness Analysis by Industry
  • Figure 15: Global Market Value Share and BPS Analysis by Sales Channel, 2025 and 2035
  • Figure 16: Global Market Y-o-Y Growth Comparison by Sales Channel, 2025-2035
  • Figure 17: Global Market Attractiveness Analysis by Sales Channel
  • Figure 18: Global Market Value (USD Million) Share and BPS Analysis by Region, 2025 and 2035
  • Figure 19: Global Market Y-o-Y Growth Comparison by Region, 2025-2035
  • Figure 20: Global Market Attractiveness Analysis by Region
  • Figure 21: North America Market Incremental Dollar Opportunity, 2025-2035
  • Figure 22: Latin America Market Incremental Dollar Opportunity, 2025-2035
  • Figure 23: Western Europe Market Incremental Dollar Opportunity, 2025-2035
  • Figure 24: Eastern Europe Market Incremental Dollar Opportunity, 2025-2035
  • Figure 25: East Asia Market Incremental Dollar Opportunity, 2025-2035
  • Figure 26: South Asia and Pacific Market Incremental Dollar Opportunity, 2025-2035
  • Figure 27: Middle East & Africa Market Incremental Dollar Opportunity, 2025-2035
  • Figure 28: North America Market Value Share and BPS Analysis by Country, 2025 and 2035
  • Figure 29: North America Market Value Share and BPS Analysis by Component , 2025 and 2035
  • Figure 30: North America Market Y-o-Y Growth Comparison by Component , 2025-2035
  • Figure 31: North America Market Attractiveness Analysis by Component
  • Figure 32: North America Market Value Share and BPS Analysis by Service Type, 2025 and 2035
  • Figure 33: North America Market Y-o-Y Growth Comparison by Service Type, 2025-2035
  • Figure 34: North America Market Attractiveness Analysis by Service Type
  • Figure 35: North America Market Value Share and BPS Analysis by End Use, 2025 and 2035
  • Figure 36: North America Market Y-o-Y Growth Comparison by End Use, 2025-2035
  • Figure 37: North America Market Attractiveness Analysis by End Use
  • Figure 38: North America Market Value Share and BPS Analysis by Industry, 2025 and 2035
  • Figure 39: North America Market Y-o-Y Growth Comparison by Industry, 2025-2035
  • Figure 40: North America Market Attractiveness Analysis by Industry
  • Figure 41: North America Market Value Share and BPS Analysis by Sales Channel, 2025 and 2035
  • Figure 42: North America Market Y-o-Y Growth Comparison by Sales Channel, 2025-2035
  • Figure 43: North America Market Attractiveness Analysis by Sales Channel
  • Figure 44: Latin America Market Value Share and BPS Analysis by Country, 2025 and 2035
  • Figure 45: Latin America Market Value Share and BPS Analysis by Component , 2025 and 2035
  • Figure 46: Latin America Market Y-o-Y Growth Comparison by Component , 2025-2035
  • Figure 47: Latin America Market Attractiveness Analysis by Component
  • Figure 48: Latin America Market Value Share and BPS Analysis by Service Type, 2025 and 2035
  • Figure 49: Latin America Market Y-o-Y Growth Comparison by Service Type, 2025-2035
  • Figure 50: Latin America Market Attractiveness Analysis by Service Type
  • Figure 51: Latin America Market Value Share and BPS Analysis by End Use, 2025 and 2035
  • Figure 52: Latin America Market Y-o-Y Growth Comparison by End Use, 2025-2035
  • Figure 53: Latin America Market Attractiveness Analysis by End Use
  • Figure 54: Latin America Market Value Share and BPS Analysis by Industry, 2025 and 2035
  • Figure 55: Latin America Market Y-o-Y Growth Comparison by Industry, 2025-2035
  • Figure 56: Latin America Market Attractiveness Analysis by Industry
  • Figure 57: Latin America Market Value Share and BPS Analysis by Sales Channel, 2025 and 2035
  • Figure 58: Latin America Market Y-o-Y Growth Comparison by Sales Channel, 2025-2035
  • Figure 59: Latin America Market Attractiveness Analysis by Sales Channel
  • Figure 60: Western Europe Market Value Share and BPS Analysis by Country, 2025 and 2035
  • Figure 61: Western Europe Market Value Share and BPS Analysis by Component , 2025 and 2035
  • Figure 62: Western Europe Market Y-o-Y Growth Comparison by Component , 2025-2035
  • Figure 63: Western Europe Market Attractiveness Analysis by Component
  • Figure 64: Western Europe Market Value Share and BPS Analysis by Service Type, 2025 and 2035
  • Figure 65: Western Europe Market Y-o-Y Growth Comparison by Service Type, 2025-2035
  • Figure 66: Western Europe Market Attractiveness Analysis by Service Type
  • Figure 67: Western Europe Market Value Share and BPS Analysis by End Use, 2025 and 2035
  • Figure 68: Western Europe Market Y-o-Y Growth Comparison by End Use, 2025-2035
  • Figure 69: Western Europe Market Attractiveness Analysis by End Use
  • Figure 70: Western Europe Market Value Share and BPS Analysis by Industry, 2025 and 2035
  • Figure 71: Western Europe Market Y-o-Y Growth Comparison by Industry, 2025-2035
  • Figure 72: Western Europe Market Attractiveness Analysis by Industry
  • Figure 73: Western Europe Market Value Share and BPS Analysis by Sales Channel, 2025 and 2035
  • Figure 74: Western Europe Market Y-o-Y Growth Comparison by Sales Channel, 2025-2035
  • Figure 75: Western Europe Market Attractiveness Analysis by Sales Channel
  • Figure 76: Eastern Europe Market Value Share and BPS Analysis by Country, 2025 and 2035
  • Figure 77: Eastern Europe Market Value Share and BPS Analysis by Component , 2025 and 2035
  • Figure 78: Eastern Europe Market Y-o-Y Growth Comparison by Component , 2025-2035
  • Figure 79: Eastern Europe Market Attractiveness Analysis by Component
  • Figure 80: Eastern Europe Market Value Share and BPS Analysis by Service Type, 2025 and 2035
  • Figure 81: Eastern Europe Market Y-o-Y Growth Comparison by Service Type, 2025-2035
  • Figure 82: Eastern Europe Market Attractiveness Analysis by Service Type
  • Figure 83: Eastern Europe Market Value Share and BPS Analysis by End Use, 2025 and 2035
  • Figure 84: Eastern Europe Market Y-o-Y Growth Comparison by End Use, 2025-2035
  • Figure 85: Eastern Europe Market Attractiveness Analysis by End Use
  • Figure 86: Eastern Europe Market Value Share and BPS Analysis by Industry, 2025 and 2035
  • Figure 87: Eastern Europe Market Y-o-Y Growth Comparison by Industry, 2025-2035
  • Figure 88: Eastern Europe Market Attractiveness Analysis by Industry
  • Figure 89: Eastern Europe Market Value Share and BPS Analysis by Sales Channel, 2025 and 2035
  • Figure 90: Eastern Europe Market Y-o-Y Growth Comparison by Sales Channel, 2025-2035
  • Figure 91: Eastern Europe Market Attractiveness Analysis by Sales Channel
  • Figure 92: East Asia Market Value Share and BPS Analysis by Country, 2025 and 2035
  • Figure 93: East Asia Market Value Share and BPS Analysis by Component , 2025 and 2035
  • Figure 94: East Asia Market Y-o-Y Growth Comparison by Component , 2025-2035
  • Figure 95: East Asia Market Attractiveness Analysis by Component
  • Figure 96: East Asia Market Value Share and BPS Analysis by Service Type, 2025 and 2035
  • Figure 97: East Asia Market Y-o-Y Growth Comparison by Service Type, 2025-2035
  • Figure 98: East Asia Market Attractiveness Analysis by Service Type
  • Figure 99: East Asia Market Value Share and BPS Analysis by End Use, 2025 and 2035
  • Figure 100: East Asia Market Y-o-Y Growth Comparison by End Use, 2025-2035
  • Figure 101: East Asia Market Attractiveness Analysis by End Use
  • Figure 102: East Asia Market Value Share and BPS Analysis by Industry, 2025 and 2035
  • Figure 103: East Asia Market Y-o-Y Growth Comparison by Industry, 2025-2035
  • Figure 104: East Asia Market Attractiveness Analysis by Industry
  • Figure 105: East Asia Market Value Share and BPS Analysis by Sales Channel, 2025 and 2035
  • Figure 106: East Asia Market Y-o-Y Growth Comparison by Sales Channel, 2025-2035
  • Figure 107: East Asia Market Attractiveness Analysis by Sales Channel
  • Figure 108: South Asia and Pacific Market Value Share and BPS Analysis by Country, 2025 and 2035
  • Figure 109: South Asia and Pacific Market Value Share and BPS Analysis by Component , 2025 and 2035
  • Figure 110: South Asia and Pacific Market Y-o-Y Growth Comparison by Component , 2025-2035
  • Figure 111: South Asia and Pacific Market Attractiveness Analysis by Component
  • Figure 112: South Asia and Pacific Market Value Share and BPS Analysis by Service Type, 2025 and 2035
  • Figure 113: South Asia and Pacific Market Y-o-Y Growth Comparison by Service Type, 2025-2035
  • Figure 114: South Asia and Pacific Market Attractiveness Analysis by Service Type
  • Figure 115: South Asia and Pacific Market Value Share and BPS Analysis by End Use, 2025 and 2035
  • Figure 116: South Asia and Pacific Market Y-o-Y Growth Comparison by End Use, 2025-2035
  • Figure 117: South Asia and Pacific Market Attractiveness Analysis by End Use
  • Figure 118: South Asia and Pacific Market Value Share and BPS Analysis by Industry, 2025 and 2035
  • Figure 119: South Asia and Pacific Market Y-o-Y Growth Comparison by Industry, 2025-2035
  • Figure 120: South Asia and Pacific Market Attractiveness Analysis by Industry
  • Figure 121: South Asia and Pacific Market Value Share and BPS Analysis by Sales Channel, 2025 and 2035
  • Figure 122: South Asia and Pacific Market Y-o-Y Growth Comparison by Sales Channel, 2025-2035
  • Figure 123: South Asia and Pacific Market Attractiveness Analysis by Sales Channel
  • Figure 124: Middle East & Africa Market Value Share and BPS Analysis by Country, 2025 and 2035
  • Figure 125: Middle East & Africa Market Value Share and BPS Analysis by Component , 2025 and 2035
  • Figure 126: Middle East & Africa Market Y-o-Y Growth Comparison by Component , 2025-2035
  • Figure 127: Middle East & Africa Market Attractiveness Analysis by Component
  • Figure 128: Middle East & Africa Market Value Share and BPS Analysis by Service Type, 2025 and 2035
  • Figure 129: Middle East & Africa Market Y-o-Y Growth Comparison by Service Type, 2025-2035
  • Figure 130: Middle East & Africa Market Attractiveness Analysis by Service Type
  • Figure 131: Middle East & Africa Market Value Share and BPS Analysis by End Use, 2025 and 2035
  • Figure 132: Middle East & Africa Market Y-o-Y Growth Comparison by End Use, 2025-2035
  • Figure 133: Middle East & Africa Market Attractiveness Analysis by End Use
  • Figure 134: Middle East & Africa Market Value Share and BPS Analysis by Industry, 2025 and 2035
  • Figure 135: Middle East & Africa Market Y-o-Y Growth Comparison by Industry, 2025-2035
  • Figure 136: Middle East & Africa Market Attractiveness Analysis by Industry
  • Figure 137: Middle East & Africa Market Value Share and BPS Analysis by Sales Channel, 2025 and 2035
  • Figure 138: Middle East & Africa Market Y-o-Y Growth Comparison by Sales Channel, 2025-2035
  • Figure 139: Middle East & Africa Market Attractiveness Analysis by Sales Channel
  • Figure 140: Global Market - Tier Structure Analysis
  • Figure 141: Global Market - Company Share Analysis
Dashboard
Dashboard
Dashboard
Dashboard
Dashboard
Dashboard

Full Research Suite comprises of:

Market outlook & trends analysis

Market outlook & trends analysis

Interviews & case studies

Interviews & case studies

Strategic recommendations

Strategic recommendations

Vendor profiles & capabilities analysis

Vendor profiles & capabilities analysis

5-year forecasts

5-year forecasts

8 regions and 60+ country-level data splits

8 regions and 60+ country-level data splits

Market segment data splits

Market segment data splits

12 months of continuous data updates

12 months of continuous data updates

DELIVERED AS:

PDF EXCEL ONLINE

Full Research Suite


$5000

$7500

$10000

Buy Report Now
Similar Industry Reports

Similar Industry Reports

Automatic Filter Press Solutions Market

Automatic Filter Press Solutions Market Size and Share Forecast Outlook 2025 to 2035

Automatic Filter Presses (AFPs) Market

Automatic Filter Presses (AFPs) Market Size and Share Forecast Outlook 2025 to 2035

Automatic Riveting Equipment Market

Automatic Riveting Equipment Market Forecast and Outlook 2025 to 2035

Automatic Transmission Market

Automatic Transmission Market Size and Share Forecast Outlook 2025 to 2035

Automatic Emergency Braking System Market

Automatic Emergency Braking System Market Size and Share Forecast Outlook 2025 to 2035

Automatic Floodgate Market

Automatic Floodgate Market Size and Share Forecast Outlook 2025 to 2035

Automatic Dependent Surveillance-Broadcast (ADS-B) System Market

Automatic Dependent Surveillance-Broadcast (ADS-B) System Market Size and Share Forecast Outlook 2025 to 2035

Automatic Emergency Braking (AEB) Market

Automatic Emergency Braking (AEB) Market Size and Share Forecast Outlook 2025 to 2035

Automatic Identification and Data Capture Market

Automatic Identification and Data Capture Market Size and Share Forecast Outlook 2025 to 2035

Automatic Transfer Switch Market

Automatic Transfer Switch Market Size and Share Forecast Outlook 2025 to 2035

Automatic Weapons Market

Automatic Weapons Market Size and Share Forecast Outlook 2025 to 2035

Automatic Bottle Opener Market

Automatic Bottle Opener Market Size and Share Forecast Outlook 2025 to 2035

Automatic Hog Feeder Market

Automatic Hog Feeder Market Size and Share Forecast Outlook 2025 to 2035

Automatic Goat Waterer Market

Automatic Goat Waterer Market Size and Share Forecast Outlook 2025 to 2035

Automatic Wine Dispensers Market

Automatic Wine Dispensers Market Size and Share Forecast Outlook 2025 to 2035

Automatic Content Recognition Market

Automatic Content Recognition Market Size and Share Forecast Outlook 2025 to 2035

Automatic Dishwasher Market

Automatic Dishwasher Market Size and Share Forecast Outlook 2025 to 2035

Automatic Dicing Saw Market

Automatic Dicing Saw Market Analysis - Size, Share, and Forecast Outlook 2025 to 2035

Automatic Paper Cutter Market

Automatic Paper Cutter Market Size, Trends, and Forecast 2025 to 2035

Automatic Gearbox Valves Market

Automatic Gearbox Valves Market Growth - Trends & Forecast 2025 to 2035

Future Market Insights

Automatic Impact Testing Machine Market

Chat With MaRIA

Chat With

MaRIA

Hi There, I am MaRIA, Your Market Research Intelligence Assistant. How may I help you?