Configuring PhpStorm
This article explains to you how to configure your PhpStorm to work with your local installation of Drupal and debug using XDebug. If you would like to know how to install Drupal or XDebug please refer to the many articles already published.
For full documentation on using PhpStorm and Drupal, refer to the JetBrains documentation.
Obtain the software
- Download PhpStorm from the vendor JetBrains' website
- Install the software for your operating system
- Provide your license key or start with the trial version
Beta-versions of next major release, available more or less every season can be legally used without a paid license.
Free license for Drupal contributors
As part of their Open-source Partnership program, JetBrains supports various FLOSS communities, including the Drupal Association (see our announcement). Drupal contributors with 35 or more issue credits gained over the past year are eligible for a gratis license. See the program rules and application form.
Enable Drupal support
PhpStorm has built-in support for things like autocompletion, syntax highlighting, Drush, integration with the Drupal.org issue queue, and more. Read about how to enable and configure it in the official PhpStorm documentation.
PhpStorm and Xdebug in DDEV or Lando
With these steps you can get PhpStorm and Xdebug working together in DDEV or Lando. There are many moving parts, and it can be challenging to make it work, so the point here is simply to get it running, with the fewest steps. There are many tutorials which can help you further with the debugging.
An existing Drupal installation made with Composer (web root in /web folder) running in DDEV or Lando is assumed.
DDEV setup
To set up Xdebug and PhpStorm in DDEV:
- Install the DDEV Integration Plugin via Settings → Plugins → Marketplace
- Opening port 9003 in your firewall may be necessary
- Restart DDEV
- Start Xdebug by running
ddev xdebug
Checking "Use Compose V2" under Build, Execution, Deployment → Docker → Tools seems no longer necessary.
Lando setup
To set up Xdebug and PhpStorm in Lando, follow the steps on Lando + PhpStorm + Xdebug. See also Setting up Xdebug with Lando and PhpStorm (2018).
Add Xdebug breakpoint in PhpStorm
Make sure PhpStorm and Xdebug is set up in your development environment (DDEV, Lando, etc., see above) and Xdebug is enabled.
- Open PhpStorm
- Open the Drupal installation
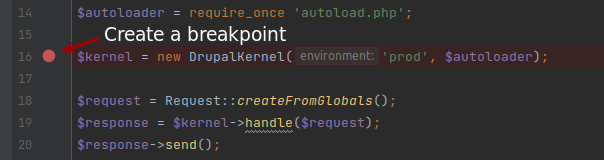
- Open index.php
- Place a break-point at line 16, clicking in the gutter, which should create a red dot:
- Click the icon with the little green bug and phone hook ("Start Listening for PHP Debugging Connections") in the upper right corner:
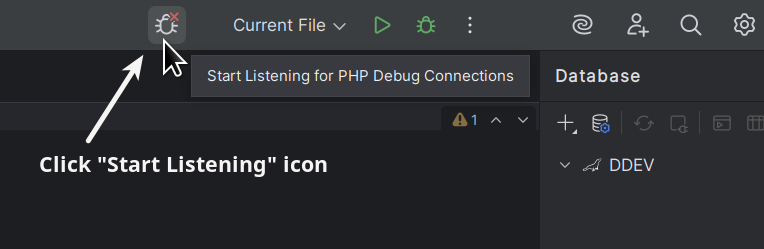
- The icon should change, and the red cross change to green lines, to indicate it's in listening mode.
- Now, click F5 to refresh a page in your Drupal installation. If everything worked as expected, PhpStorm should pop up, showing the available variables at line 16 of index.php file.
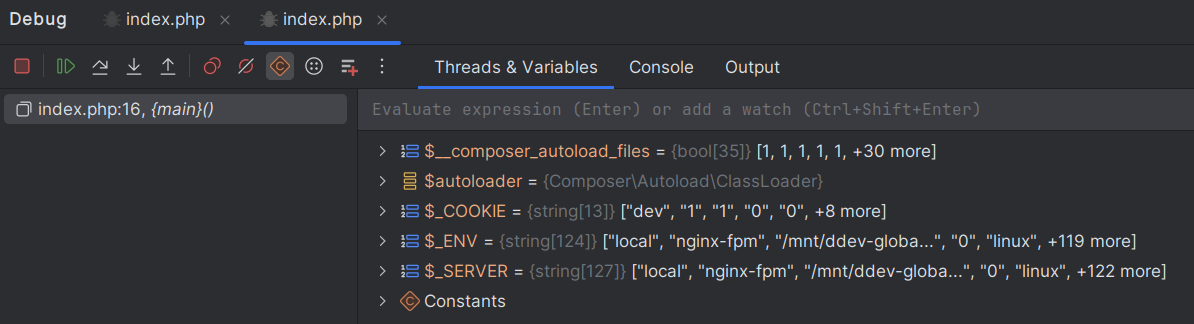
Congratulations, you can now debug Drupal code with PhpStorm, step-by-step!
Creating a project
It is assumed you already have a full Drupal environment which includes: Apache, MySQL, PHP, Drupal and XDebug
So, as a result, we have two assumptions:
- your local Drupal site is at http://mylocalsite (usually it's http://localhost);
- your local Drupal code is at c:\path\to\my\local\code
which is also the DocumentRoot for mylocalsite vhost config in Apache.
So here is what you need to do:
- File --> New Project from Existing Files
- choose Web Server is installed locally, source files are located under its document root --> Next
- enter the path of your local Drupal code c:\path\to\my\local\code
- Local Server:
- Name: your project name should be fine
- Web server root URL: should be http://mylocalsite:[port]
- Web path for project root: leave blank. In Drupal projects, the web path is the same as the path to the source code --> Finish
Configuring PhpStorm to link to Drupal.org's GitLab
You can create an "external tool" that will allow you to select code, and have a link to git.drupalcode.org of that code put on your pasteboard for sharing with other people so they can look at what you are looking at.
- Start by making a script called "pasteboard" - put it in /usr/local/bin.
- Then go to preferences => tools => external tools and add one with the fields you see in this screenshot.
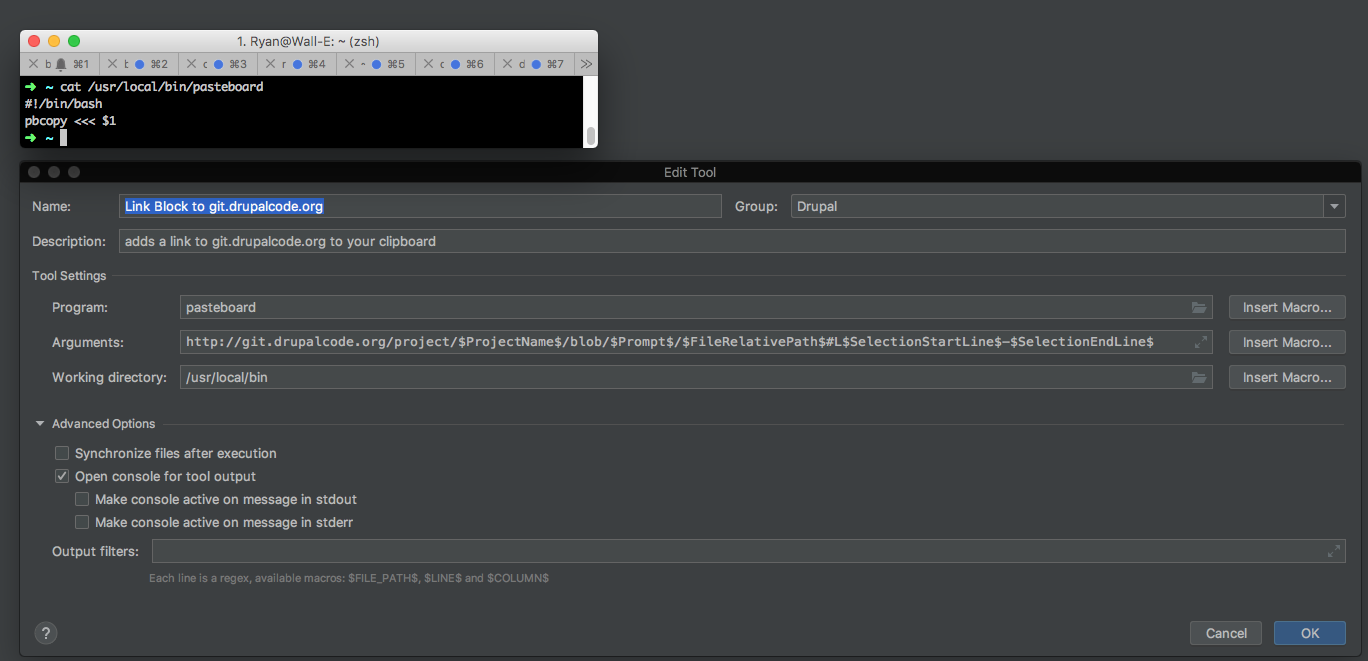
If the project name does not match then you can hard code it like
http://git.drupalcode.org/project/drupal/blob/$Prompt$/$FileRelativePath$#L$SelectionStartLine$-$SelectionEndLine$ - Then, once its saved you should be able to highlight any code, right click, and go through the 'external tools' menu like so:
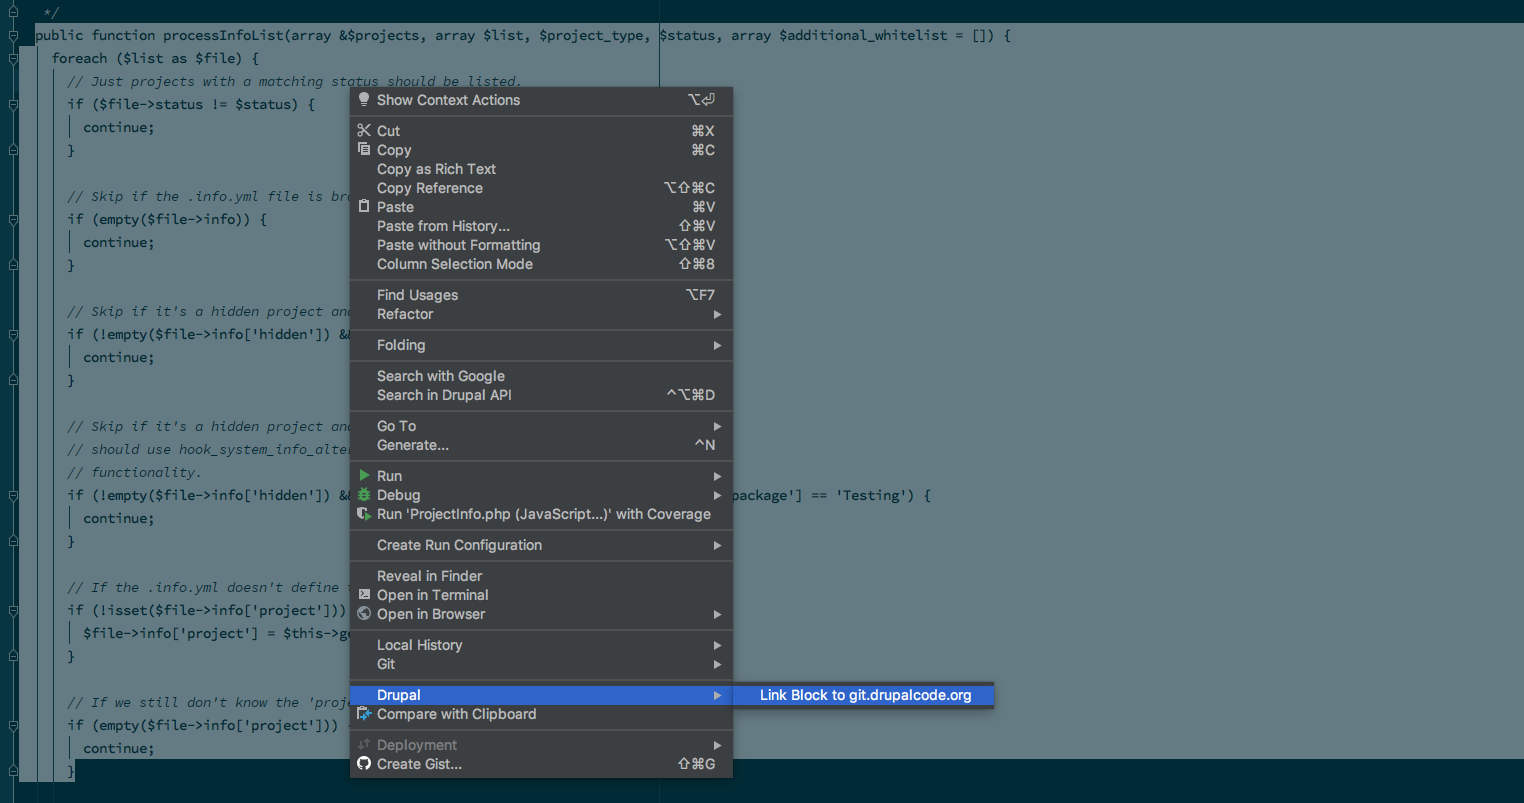
- It will pop up with a dialog that just says 'enter parameters' : this is where you type in a branch name for whatever branch you're on.
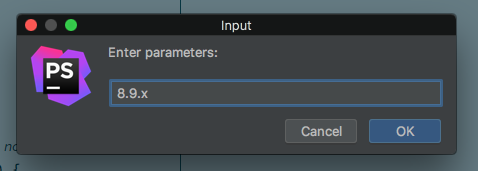
- As soon as you do, your clipboard should have the url directly to the code you highlighted, on your pasteboard, with the intent of sharing it with somebody: http://git.drupalcode.org/project/drupal/blob/8.9.x/core/lib/Drupal/Core/Utility/ProjectInfo.php#L42-74
- You can then assign it a keyboard shortcut too so you can just highlight cmd-shft-something and type the branch and paste
Debugging Xdebug
Sometimes you need to debug Xdebug, and one method is adding this in a page, which will print out the values of Xdebug’s diagnostic log on the screen:
xdebug_info();
exit;
For more debug tips, see Setup Step Debugging in PHP with Xdebug 3 and Docker Compose.
Related Articles
Help improve this page
You can:
- Log in, click Edit, and edit this page
- Log in, click Discuss, update the Page status value, and suggest an improvement
- Log in and create a Documentation issue with your suggestion

