580 California St., Suite 400
San Francisco, CA, 94104
This research area focuses on developing and standardizing metrological characteristics (MCs) and calibration methodologies for areal surface topography measuring instruments, aiming to enhance their accuracy, traceability, and applicability in industrial and research settings. Precise calibration of lateral (x, y) and vertical (z) scales, including linearity, amplification, and squareness, is critical to obtain reliable 3D surface data, directly impacting the fidelity of surface texture assessments across diverse applications.
This theme explores image processing, computational geometry, and sampling methodologies for accurate surface area estimation and topography extraction from volumetric, irregular, or anisotropic surfaces. It addresses challenges in reconstructing iso-surfaces, accounting for real-world surface irregularities, and optimizing measurement precision despite anisotropy and data discretization constraints. Such studies enable improved interpretation of surface characteristics crucial for metrological, tribological, and material science applications.
This area investigates the design, development, and validation of portable systems and software that leverage image recognition, machine learning algorithms, and device interfacing to measure surface areas efficiently and accurately outside the laboratory setting. Such systems enable real-time, non-destructive, and automated surface area quantification applications in agriculture, textiles, and industrial metrology, expanding access and reducing reliance on costly or complex instrumentation.
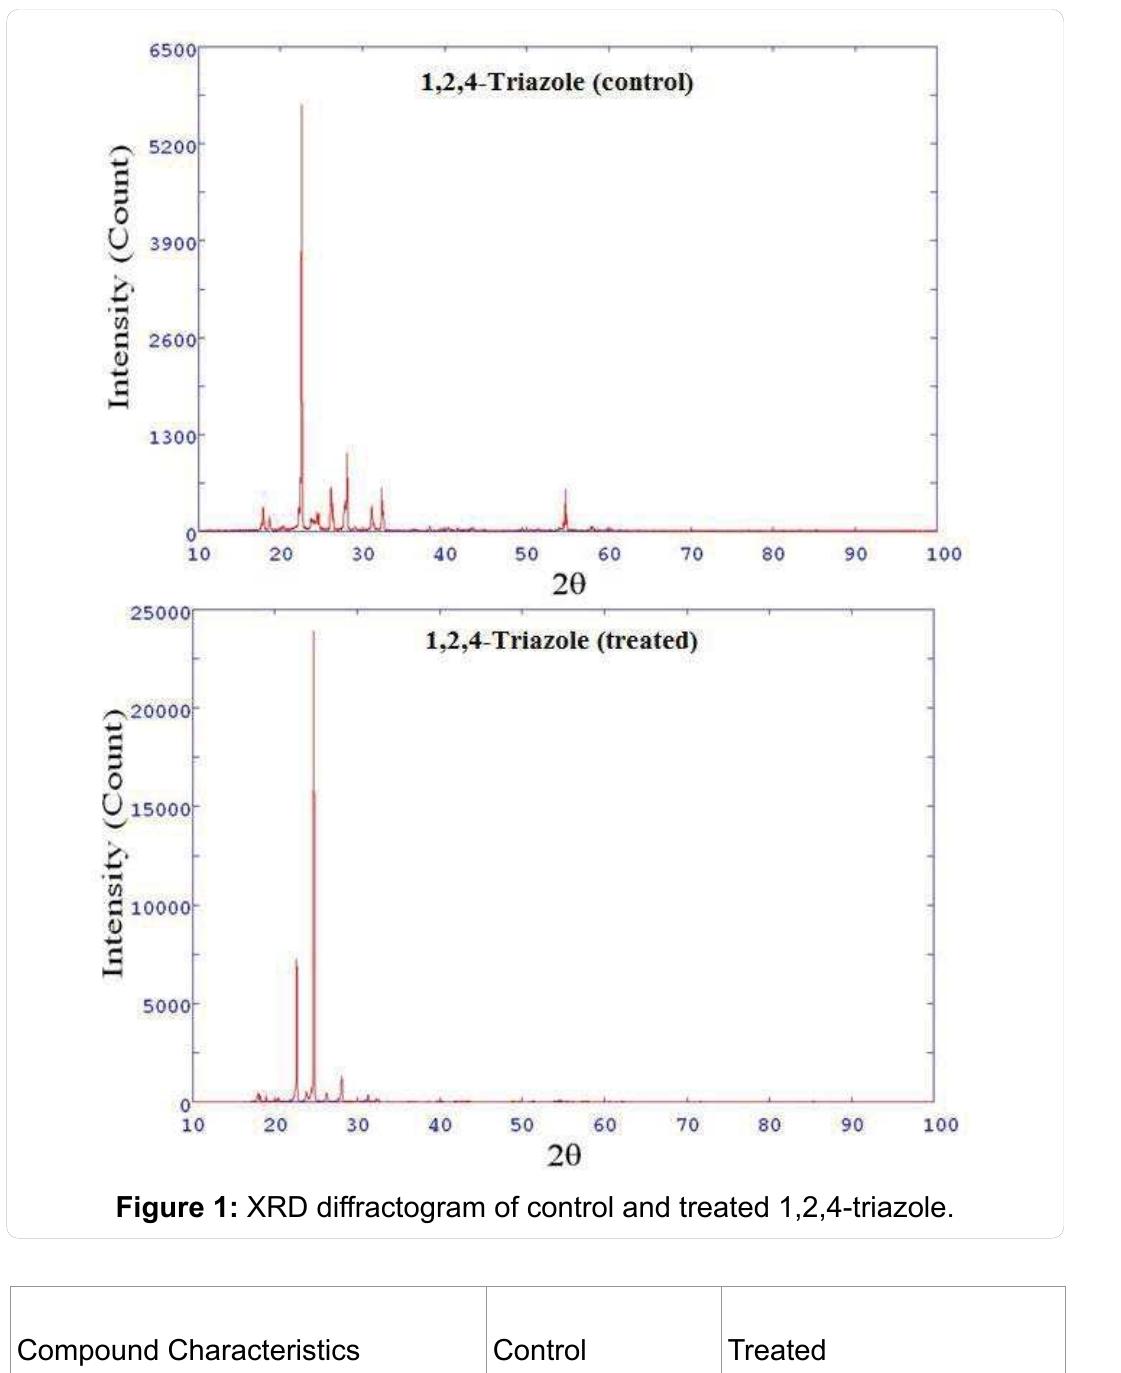
![FT-IR spectra of control and treated 1,2,4-triazole (Tl and T2) samples are presented in Figure 6.The FT-IR spectrum of control 1,2,4-triazole showed characteristic absorption peaks at 3097 and 3032 cm’! due to C-H aromatic vibrations. Vibration peak at 3126 cm" was due N-H stretching of the sample. FT-IR peaks at 1529 and 1483 cm" were corresponded to C=C stretching for aromatic groups. Vibration peak for -N=N stretching was observed at 1543 cm" [31]. Likewise, the FT-IR spectrum of 1,2,4-triazole (T1) showed absorptions peaks at 3095, and 3034 cm?! that were due to C-H aromatic vibrations. N-H stretching vibration was observed at 3128 cm" in the sample. FT-IR peaks observed at 1529, and 1483 cm" were corresponded to C=C (aromatic) stretching vibration peak (Figure 6). Vibration peak for -N=N stretching was observed at 1543 cm. FT-IR spectrum of |,2,4-triazole (T2) showed absorption peaks at 3028 cm" that were due to C-H (aromatic) stretching vibrations. N-H stretching vibration peak was observed at 3128 cm" in the sample. C=C (aromatic) stretching vibrations were observed at 1529, and 1481 cm". N=N stretching peak Acknowledgement](https://figures.academia-assets.com/40056132/figure_004.jpg)