


580 California St., Suite 400
San Francisco, CA, 94104
This theme investigates the development, advantages, and challenges of using dried blood spot (DBS) sampling coupled with mass spectrometry techniques for clinical diagnostics and therapeutic drug monitoring. It addresses the methodological considerations such as sample collection, analyte sensitivity, hematocrit effect, and assay reproducibility, aiming to extend DBS utility beyond newborn screening to broader clinical contexts.
This theme explores the adoption, operational management, and quality assurance of point-of-care testing performed outside centralized laboratories, including settings such as clinics, homes, and remote locations. It assesses regulatory frameworks, user competency, analytical performance, and integration into patient care workflows, illustrating how POCT can reduce turnaround times and improve clinical decision-making while highlighting risks related to variability in user performance and quality controls.
This theme focuses on harnessing computer vision, smartphone platforms, and real-time image processing to enhance the objectivity, sensitivity, and throughput of spot tests, traditionally qualitative and subjective by nature. It investigates the application of advanced imaging algorithms for kinetic colorimetric analysis, assay failure detection, and automated result interpretation, bridging rapid presumptive testing with confirmatory laboratory methods across fields like forensic drug detection and lateral flow immunoassays.
![There is evidence of vertical and horizontal cracks formation during the drying cycle as the shrinkage process occurs and upon wetting cycle the cracks create preferential paths for water to infiltrate the sample. Figure 9 shows an example of the formation of vertical and horizontal cracks within the samples. The generation of the cracking in the drying phase becomes preferential wetting paths during the wetting phase by promoting swelling and closure of the cracks [29-33].](https://figures.academia-assets.com/78678241/figure_009.jpg)
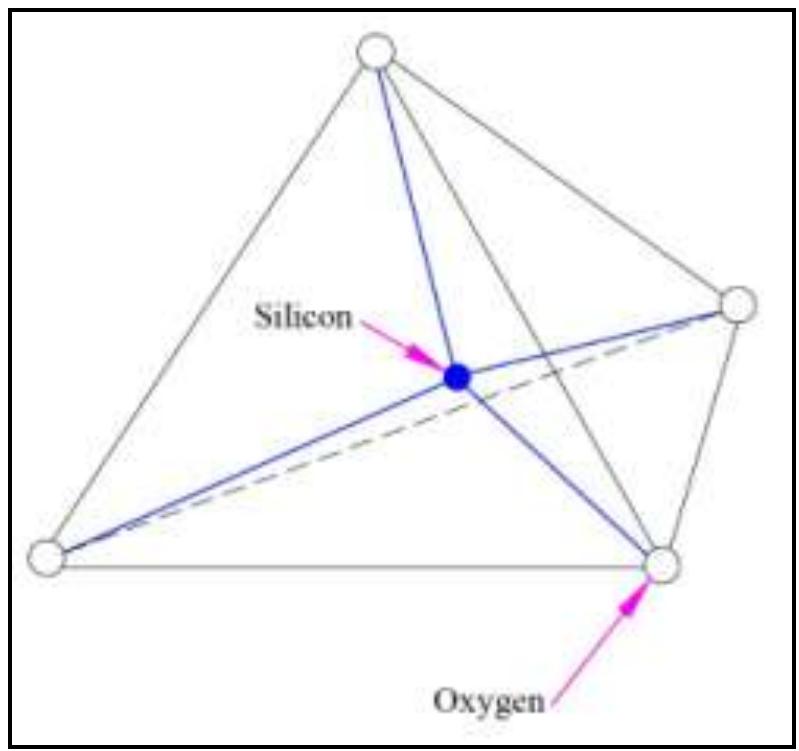
![Figure 2: Single unit of octahedral mineral [19] Figure 1: Single unit of tetrahedral mineral [19]](https://figures.academia-assets.com/78678241/figure_001.jpg)
![Kovacs [26] used the Atterberg limits to create a soil classification system (Figure 7), which was then modified by th United Soil Classification System (USCS). Figure 7: Location of clay mineralogy bands on USCS soil classification [23] Figure 7 is only a guideline for clay mineralogy classification based upon the Atterberg limits. There are a multitude of soils that do not fall within the clay mineralogy groupings that governing the behavior of the soil sample/stratigraphy.](https://figures.academia-assets.com/78678241/figure_007.jpg)
![Figure 4: Different causes of clay water interaction (a) hydrogen bonding (b) ion hydration (c) attraction by osmosis (d) dipole attraction [17]](https://figures.academia-assets.com/78678241/figure_006.jpg)
![3. CLAY WATER INTERACTION It is evident that the engineering and physico-chemical behavior of clay are largely influenced by the moisture Therefore, it is important to know the mechanism of clay water interaction. The clay particles contain adsorbec counterions and excess ions in the form of precipitated salts at dry condition. The addition of water hydrates the counterions adsorbed in the particle surface. During the hydration process, some of the counterions lose their primary hydration shell (all or partly) and develop inner sphere complex. The ions with primary hydration shells also exist in the form of outer sphere complex. The hydrated counterions are attached to the particles due to the presence of surface charge. The rest of the counterions are separated from the surface of the particles by water. Uday et al. [17] summarizec the possible causes of clay water interaction, which included hydrogen bonding, attraction by osmosis, hydration of exchangeable cations, charged surface dipole attraction, and presence of dispersion force as illustrated in Figure 6.](https://figures.academia-assets.com/78678241/table_001.jpg)
![Table 2: Typical ranges of LL, PL and activity of minerals [12] Viennet et al. [23] presented a study on the quantification of clay minerals in fine fraction of soil. The Cation Exchange Capacity (CEC), Specific Surface Area (SSA), and total potassium tests were performed on the natural and artificial soils. Based on the experimental results, artificial neural networks were developed to quantify the minerals. It was reported that the performance of the neural network incorporating three parameters were in good agreement with mineralogical distribution of the tested soils. Prandel et al. [24] correlated free swell ratio of soils with the mineral contents. An extensive experimental program consisting of seventy soil specimens was developed to determine the free swell ratio. Thereafter, a chart was developed (Table 3) to determine mineralogy of the specimen using free swell ratio.](https://figures.academia-assets.com/78678241/table_002.jpg)
![Table 3: Mineralogy based classification of soil using free swell ratio [24]](https://figures.academia-assets.com/78678241/table_003.jpg)
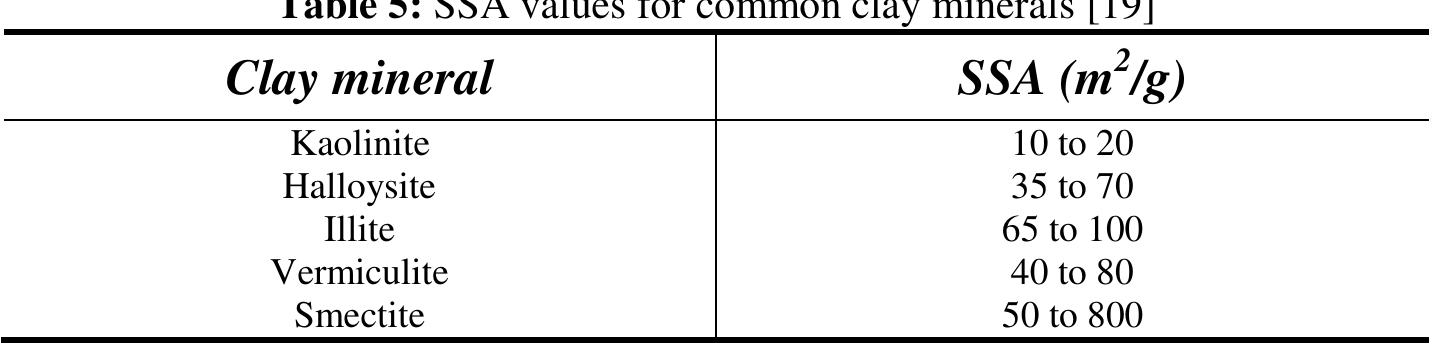
![The fabric morphology of illite is characterized by hexagonal small flaky particles when well crystallized. Accordin, to Mitchel [19], the surface area of this mineral ranges from 65 to 100 m? / g. The typical chemical formula of the cla’ minerals are presented in Table 1.](https://figures.academia-assets.com/78678241/figure_005.jpg)
![The most common soil properties used to determine the swell potential of expansive soils include activity, Atterberg limits, clay fractions, colloidal content, plasticity index, swell percent, shrinkage limit and the shrinkage index. Skemptor [27] proposed a methodology to classify expanse potential for various types of soils. His methodology is based on the percent of clay fraction (percent passing 0.002 mm) and the plasticity index. Figure 8 describes the swell potential relatec to the plasticity index and the clay fraction. It was observed that once the swell potential is “medium” or “marginal”, the potential for a geotechnical hazard is significant.](https://figures.academia-assets.com/78678241/figure_008.jpg)
![Typically, exposed hydroxyl can be replaced by exchangeable ions, and Al** can be substituted for Si** . Moreover, the presence of a divalent ion can cause a substitution of divalent ion for Al** . The ranges of cation exchange capacity in [19] kaolinite are in between 3 to 15 meq/100g. The surface morphology of kaolinite mineral is characterized by six- sided hexagonal plates. The lateral dimension and thickness of the plates are ranged from 0.1 to 0.4 wm and 0.05 to 2 tim, respectively because of the crystal structure and morphology, the typical specific surface area of kaolinite ranges Lee QD eseced ATK ec) Puc](https://figures.academia-assets.com/78678241/figure_003.jpg)
![Figure 2: Structure of montmorillonite crystal [19]](https://figures.academia-assets.com/78678241/figure_004.jpg)
![Table 4: CEC value for common clay minerals [19]](https://figures.academia-assets.com/78678241/table_004.jpg)
![Table 6: Swell potential [28, 29] Holtz and Gibbs [28] proposed methods for determining the swell potential of soils, as given in Table 6. Furthermore, Holtz [26] recorded the volume change of the material from an air-dry state to a saturated state under 1-psi (7-kPa) surcharge pressure in an odometer apparatus. The swell potential criterion that was determined by Holtz [29] is presented in Table 6.](https://figures.academia-assets.com/78678241/table_006.jpg)
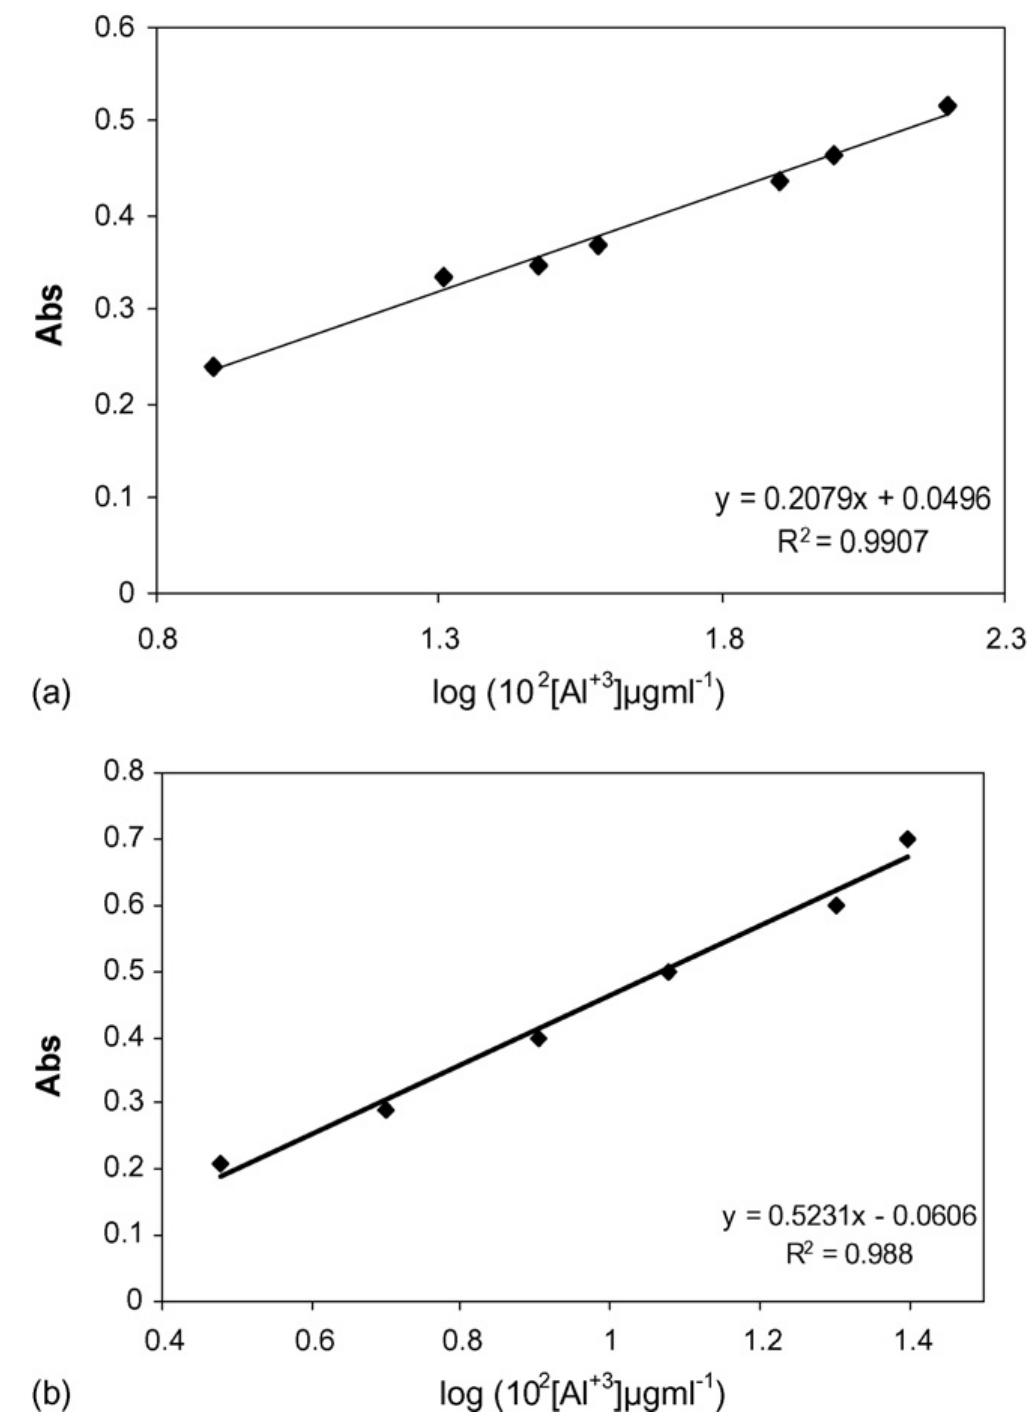
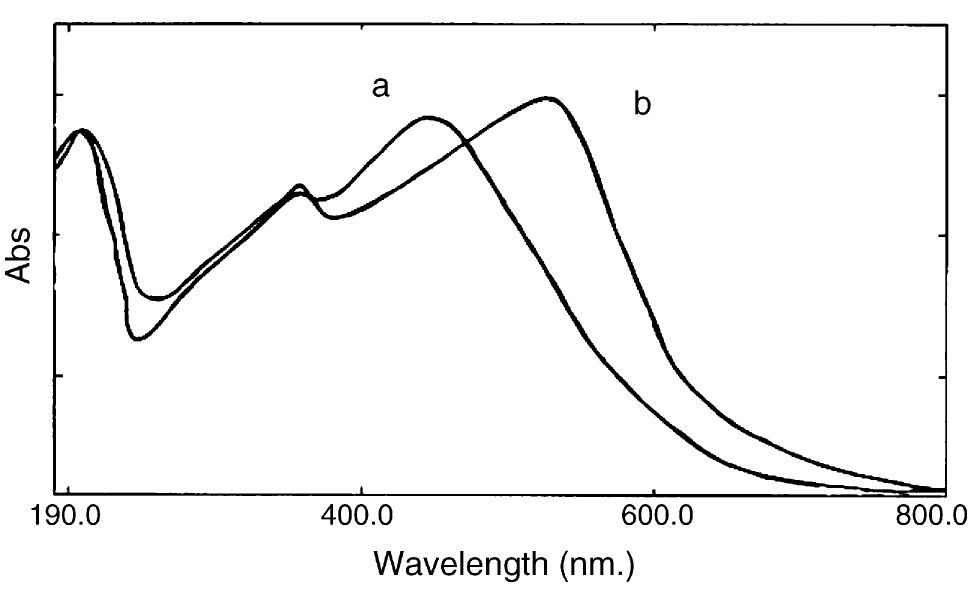
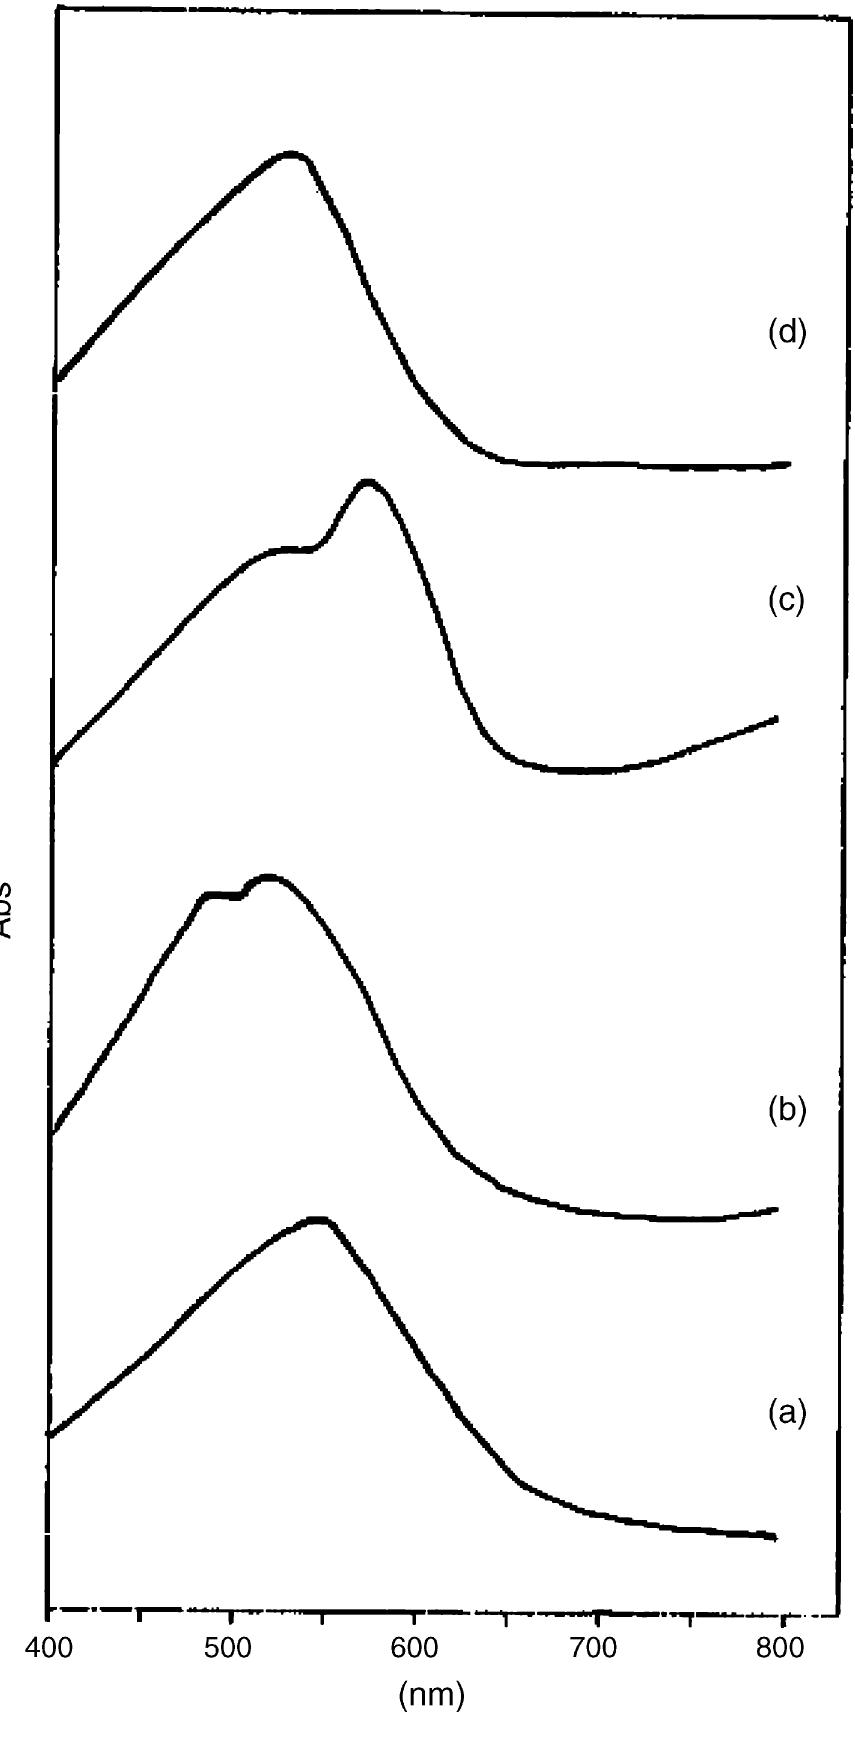
![Fig. 2. Effect of pH on the absorbance of AI-ECR adsorbed on (a) MCM-41, Amax =530nm and (b) MTOAC-Naph, Amax =570 nm; conditions: [Al**]=0.1 pg ml~!, Cucr =1 x 10⁷° M.](https://figures.academia-assets.com/76625230/figure_002.jpg)