580 California St., Suite 400
San Francisco, CA, 94104
This research theme focuses on advancing polarization gating techniques by integrating Mueller matrix (MM) measurements and analysis. The goal is to extract enhanced polarimetric information that yields superior contrast in imaging biological tissues and provides quantitative tissue metrology parameters without requiring multiple experimental configurations. This matters for improving diagnostic imaging sensitivity and enabling real-time, non-contact evaluation of tissue properties in biomedical applications.
Research under this theme investigates the mathematical characterization and physical interpretation of three-dimensional (3D) polarization states beyond traditional two-dimensional (2D) models. The focus is on their constructive decomposition, structural purity, and the relations between polarization components, including the interaction with spatial and longitudinal components of tightly focused beams. This understanding is crucial for designing optical fields with tailored polarization properties for applications such as imaging, manipulation of light-matter interaction, and novel photonics devices.
The underwater environment presents complex scattering and absorption that degrade image quality. Incorporating polarization information in imaging can provide additional contrast and discrimination capabilities beyond intensity imaging. Research in this area develops models for underwater polarized light propagation and imaging formation, enabling the extraction of inherent optical properties of water and submerged targets despite the presence of veiling light and scattering-induced polarization changes. This knowledge is essential for applications including underwater object detection, camouflage studies, and environmental monitoring.
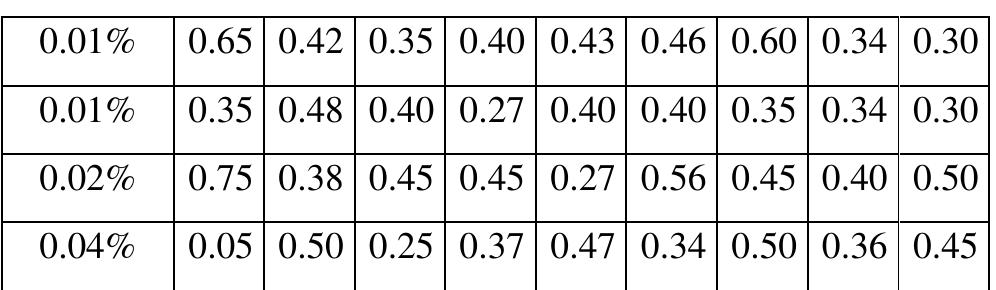
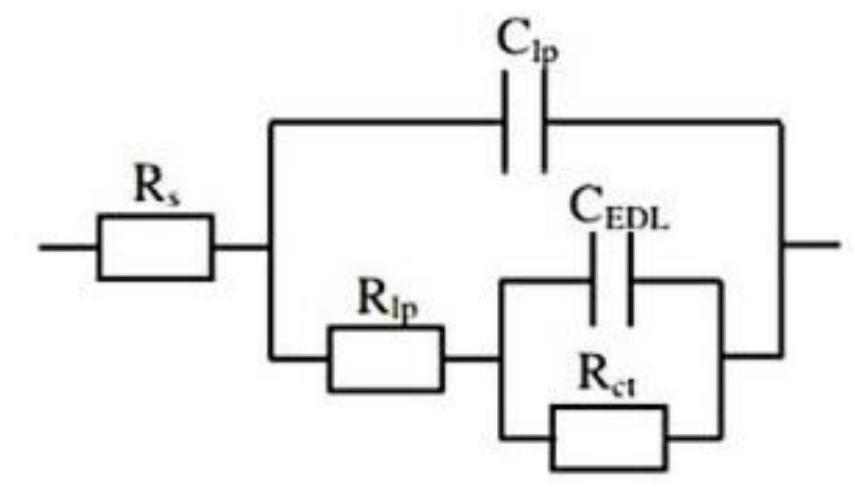
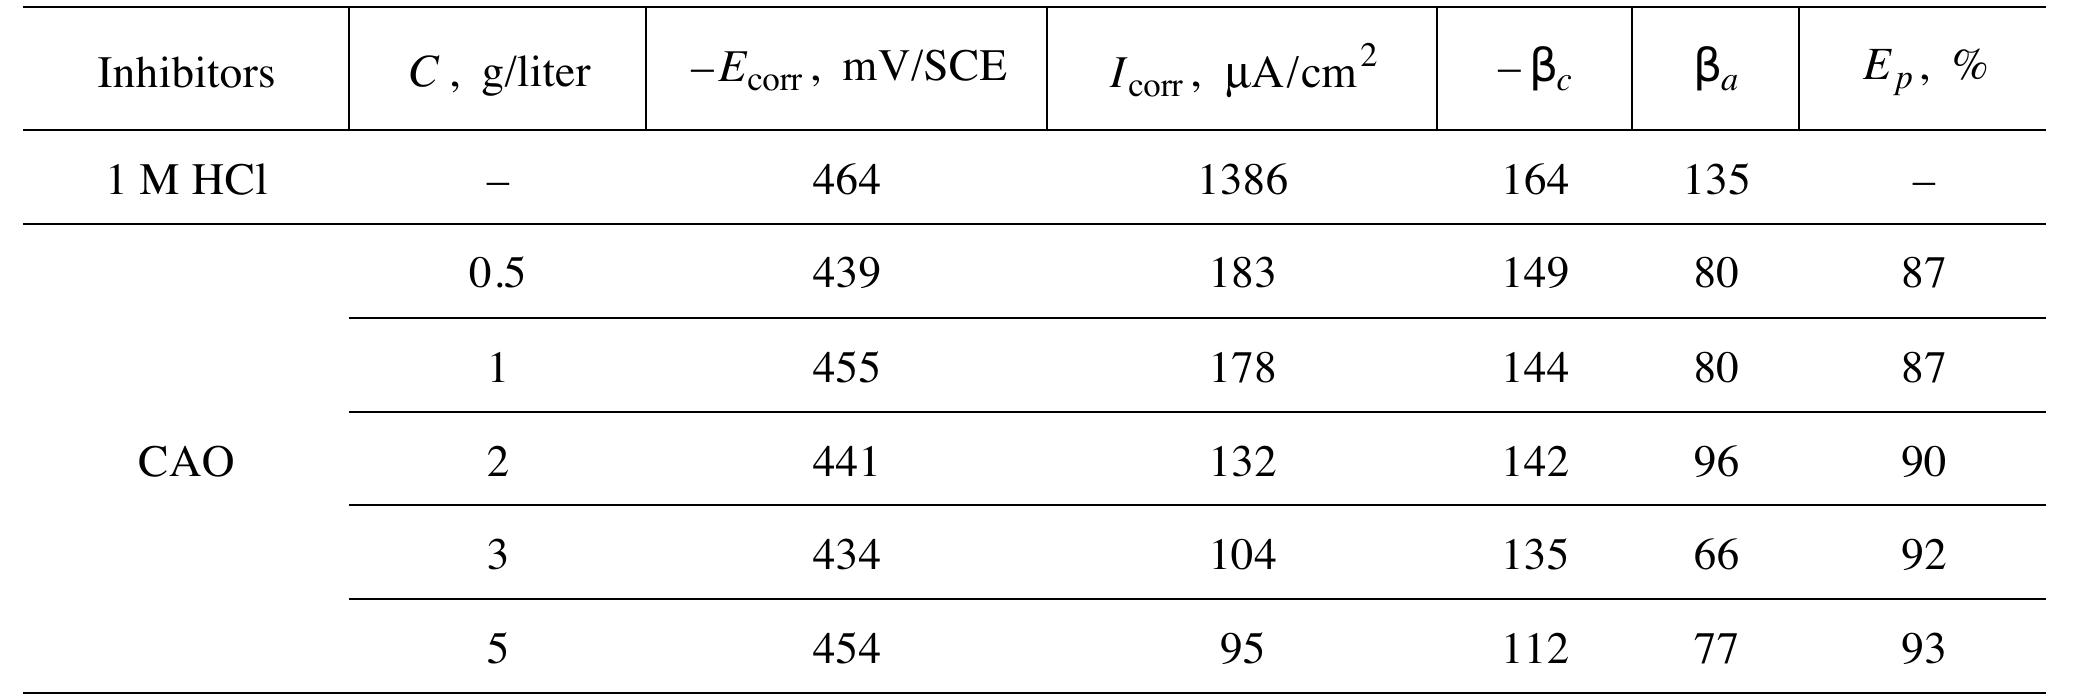
![INVESTIGATION OF THE CORROSION-RESISTANT PROPERTIES OF CITRUS AURANTIUM ESSENTIAL OIL IN 1 M HC! The values of polarization resistance were calculated by subtracting the high frequency intersection from the low frequency intersection [33]. The values of capacitance of the double layer were obtained for the maximum frequency (fmax) at which the imaginary component of the Nyquist plot is maximum and given by the follow- nad aniatinn: ing equation:](https://figures.academia-assets.com/109495217/table_004.jpg)
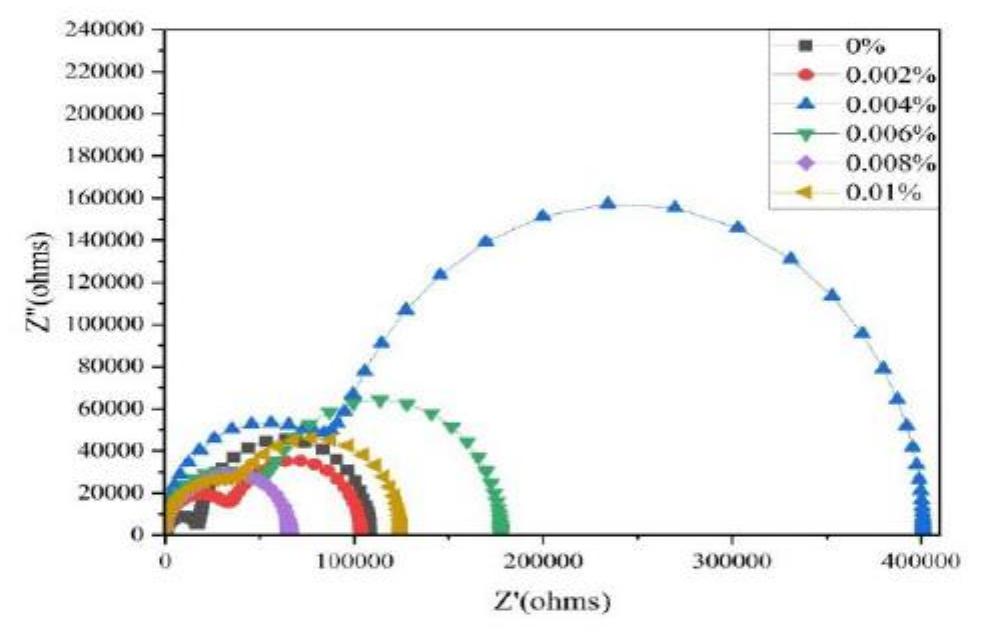
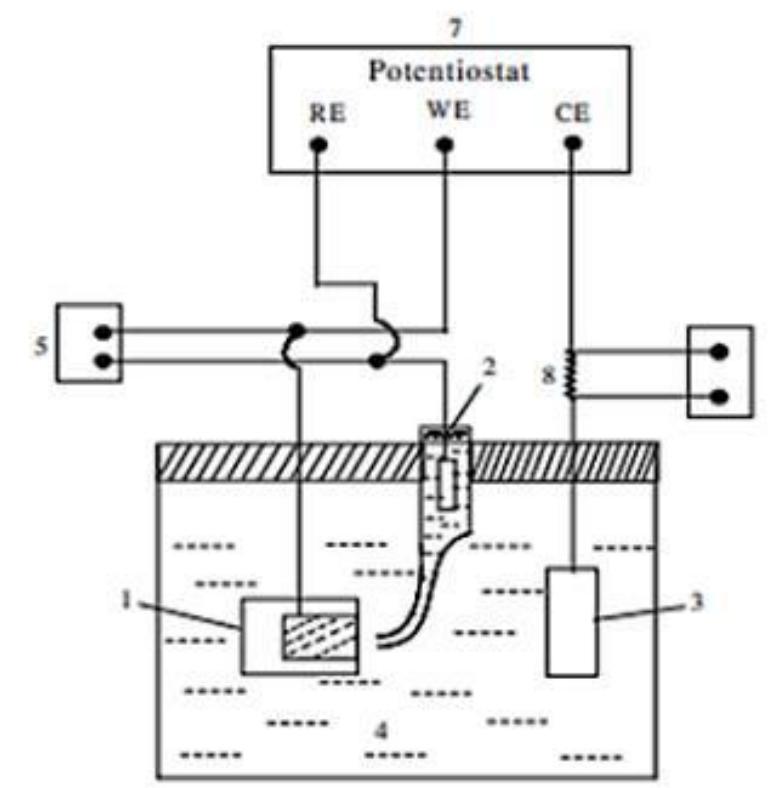
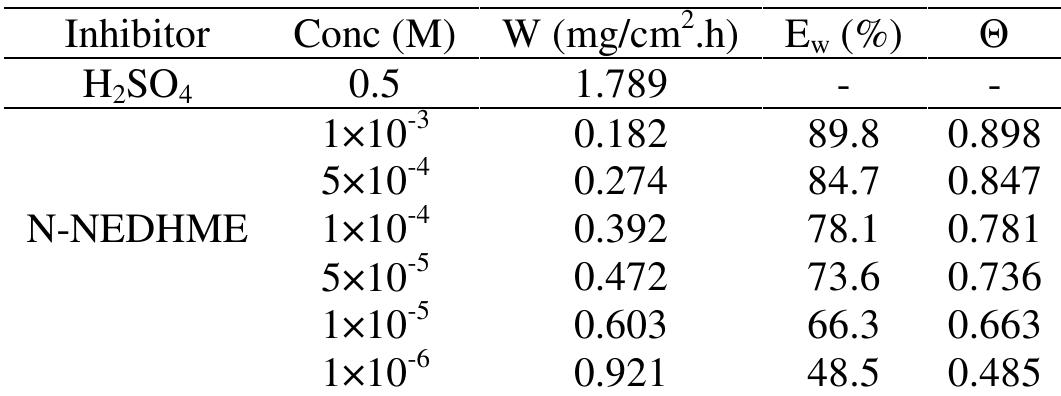
![Fig.3 Nyquist diagrams for C 38 steel in 0.5M H,SO, containing different concentrations of N-NEDHME at 298K. These observations clearly bring out the fact that the corrosion of C38 steel in 0.5M H2SO, is controlled by a charge transfer process. The decrease in Cq is due to the gradual replacement of water molecules by the adsorption of the organic molecules at metal/solution interface, leading to a protective film on the steel surface, then decreasing the extent of dissolution reaction [21]. 3.3. Gravimetric measurements 3.3.1. Effect of concentration Three parallel rectangular C38 steel specimens of were used for the determination of corrosion rate. The coupons, initial weight using an analytic balance was recorded before immersion in 80 ml open beakers containing 50 ml of corrodent (0.5M H2SO,) without and with different concentrations of N-NEDHME. The specimens were taken out, washed, dried, and reweighed accurately. The average weight loss of the three parallel C38 steel specimens could be obtained. The corrosion rates of have be C38 steel en determined for 6h immersion period at 298K from mass loss, using Eq. (17) where Am is the mass loss, S is the area, and t is the immersion period [22]. The percentage protection efficiency Ew (%) was calculated according the relationship Eq. (18) where W and Wiyn are the corrosion rates of steel without and with the inhibitor, respectively [23]:](https://figures.academia-assets.com/108212441/figure_003.jpg)
![attention [1]. Using inhibitors is an important method of protecting materials against deterioration due to corrosion, especially in acidic media [2]. Acid solutions are widely used in industry, some of the important fields of application being acid pickling of iron and steel, chemical cleaning and processing, ore production and oil well acidification. As acidic media, the use of hydrochloric acid in pickling of metals, acidization of oil wells and in cleaning of scales is more economical, efficient and trouble-free, compared to other mineral acids [3]. Because of the general aggression of acid solutions, inhibitors are commonly used to reduce the corrosive attack on metallic materials. The effect of organic nitrogen compounds on the corrosion behaviour of metallic materials in aggressive solutions has been well documented [4-14]. Their choice is based on their stability as corrosion inhibitors for metallic materials in acidic media. Recently, the excellent inhibitory effect obtained by N-1 Naphthylethylenediamine Dihydrochloride Monomethanolate (N-NEDHME) [15] on copper corrosion in nitric acid, This encouraged us to test this compound in inhibtion of corrosion of steel in H2SOy,. In this work, the inhibiting action of N-NEDHME compound (Fig. 1) on the corrosion C38 steel in 0.5M H2SOx solution has been investigated. The gravimetric and electrochemical techniques such as _ potentiodynamic polarization, and impedance measurements were used in this study. MATERIALS AND METHODS](https://figures.academia-assets.com/108212441/figure_001.jpg)
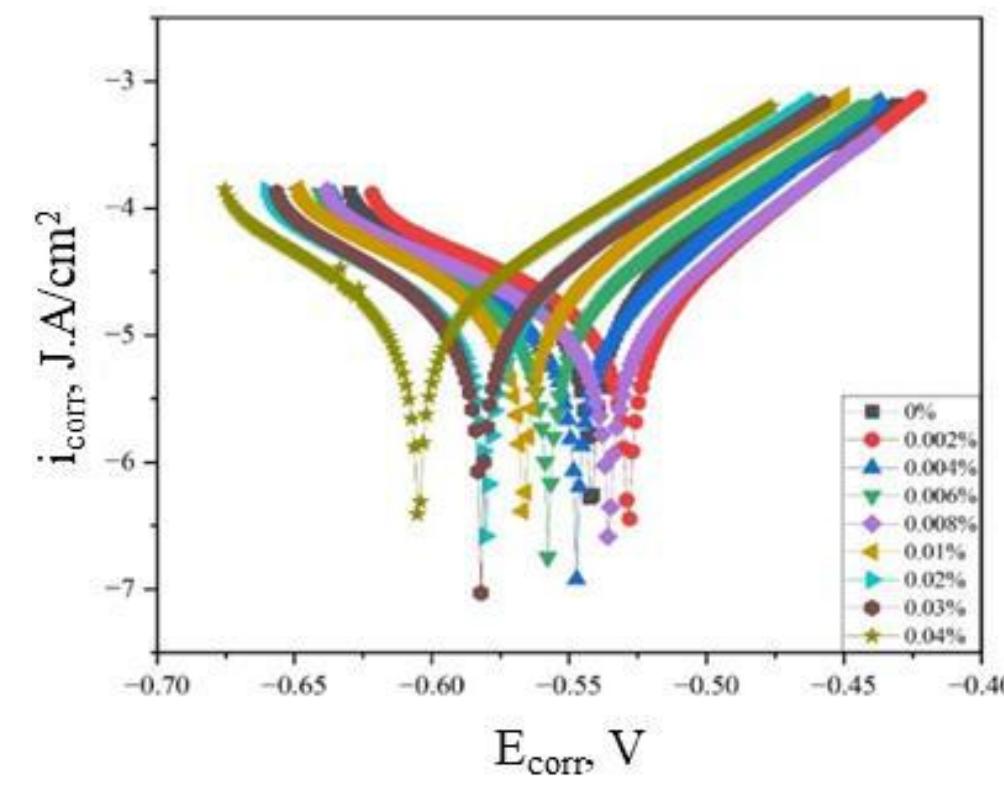
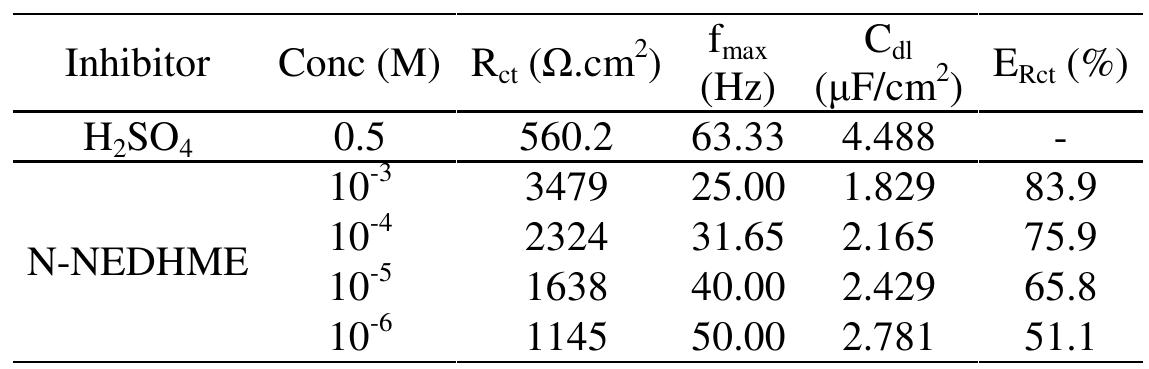
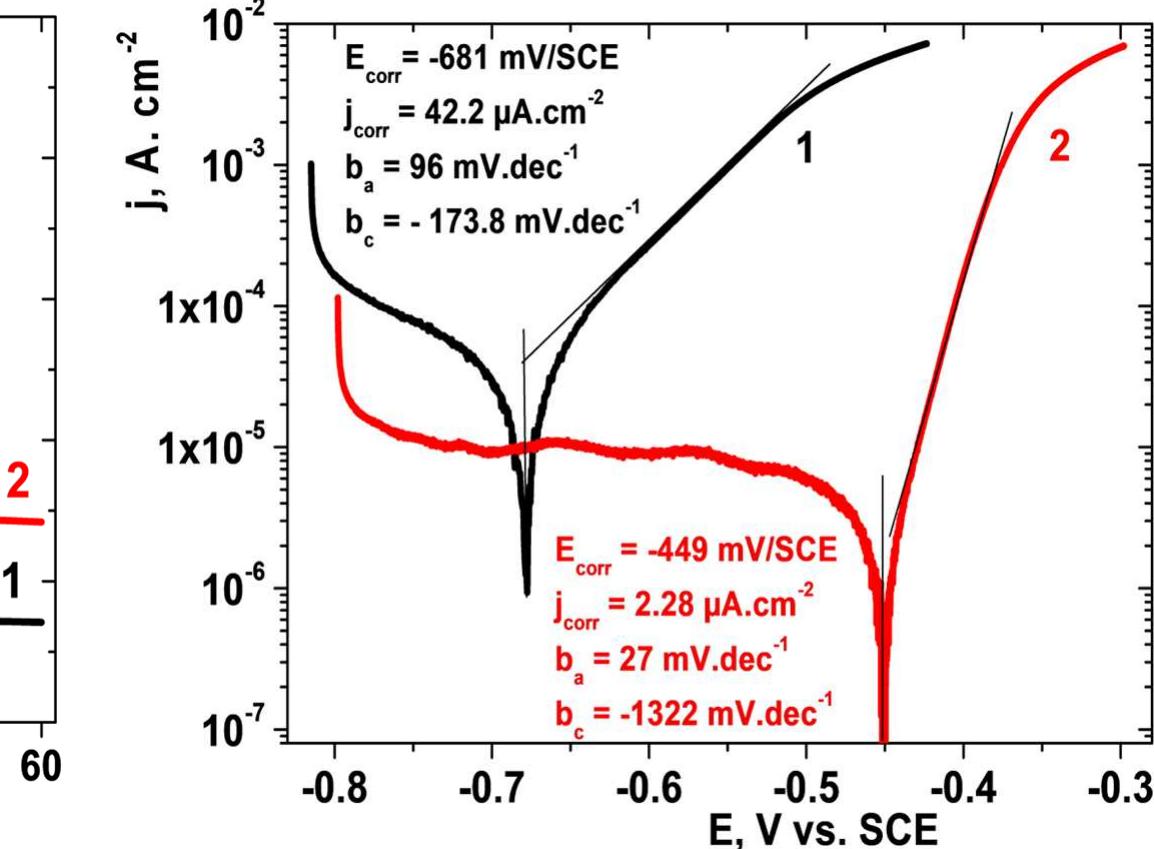
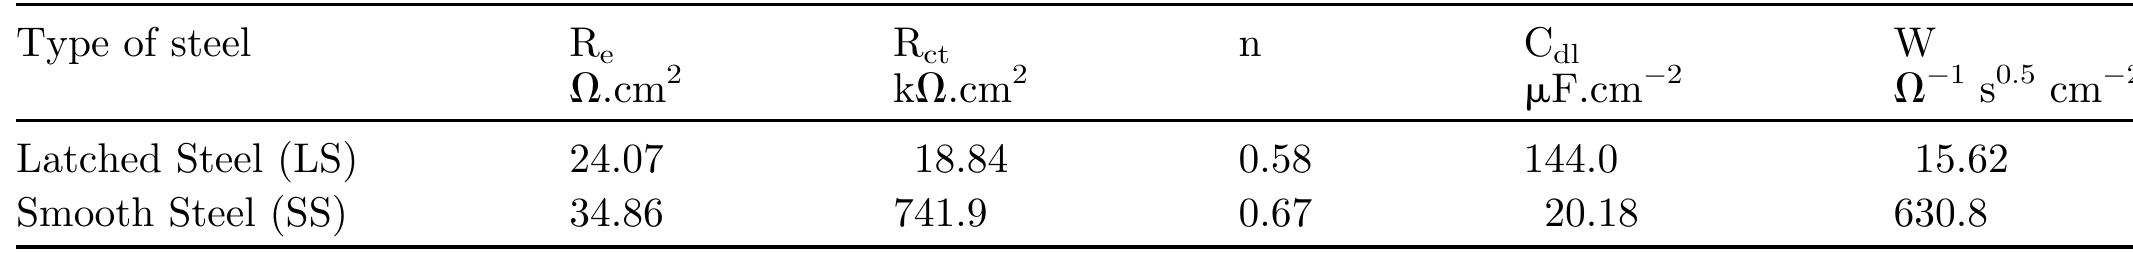
![3.2. Electrochemical impedance spectroscopic studies emo 24 £UU UE VU SEU EEE ee BE a ee ae vepyvvn VI ee VUUULUY Nyquist plots of N-1 Naphthylethylenediamine Dihydrochloride Monomethanolate compound ir 0.5M H2SO,4 solutions in the absence and presence of various concentrations of N-NEDHME. is given in Fig 3. The impedance spectra show that a single semicircle and the diameter of semicircle increases with increasing inhibitor concentration. These diagrams exhibi that the impedance spectra consist of one capacitive loop at high frequency, the high frequency capacitive loop was attributed to charge transfer of the corrosion process [19]. Various parameters such as charge-transfer resistance (Re), double layer capacitance (Ca), fmax anc inhibition efficiency were obtained from impedance measurements and are shown in Table 2. R, values were calculated from the difference in impedance at lower and higher frequencies as suggested by Tsuru et al. [20]. Ca values were calculated from the frequency at which the imaginary component of impedance was maximum (Z;,, max) using the reaction: addition of inhibitor modifies the mechanism of the hydrogen reduction. This result was obtained in the presence of bis-[2-thiophene carboxylate] di-n-butyl tin in sulfuric acid [18]. The addition of N-NEDHME shifted the E.o,, value towards the positive direction. This indicates that the N- NEDHME compound acts predominately as a anodic inhibitor.](https://figures.academia-assets.com/108212441/table_001.jpg)
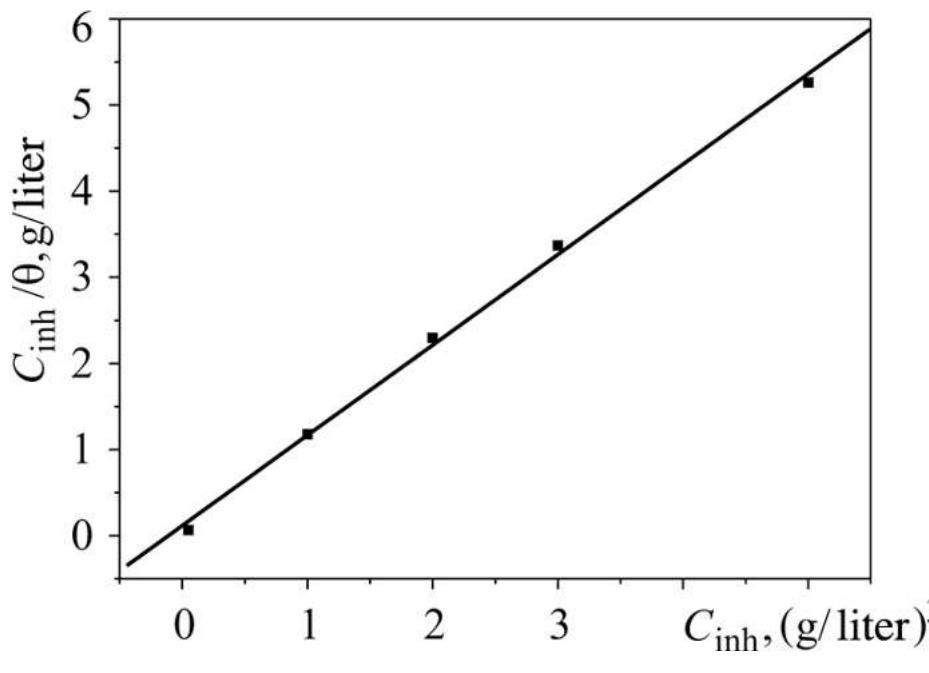
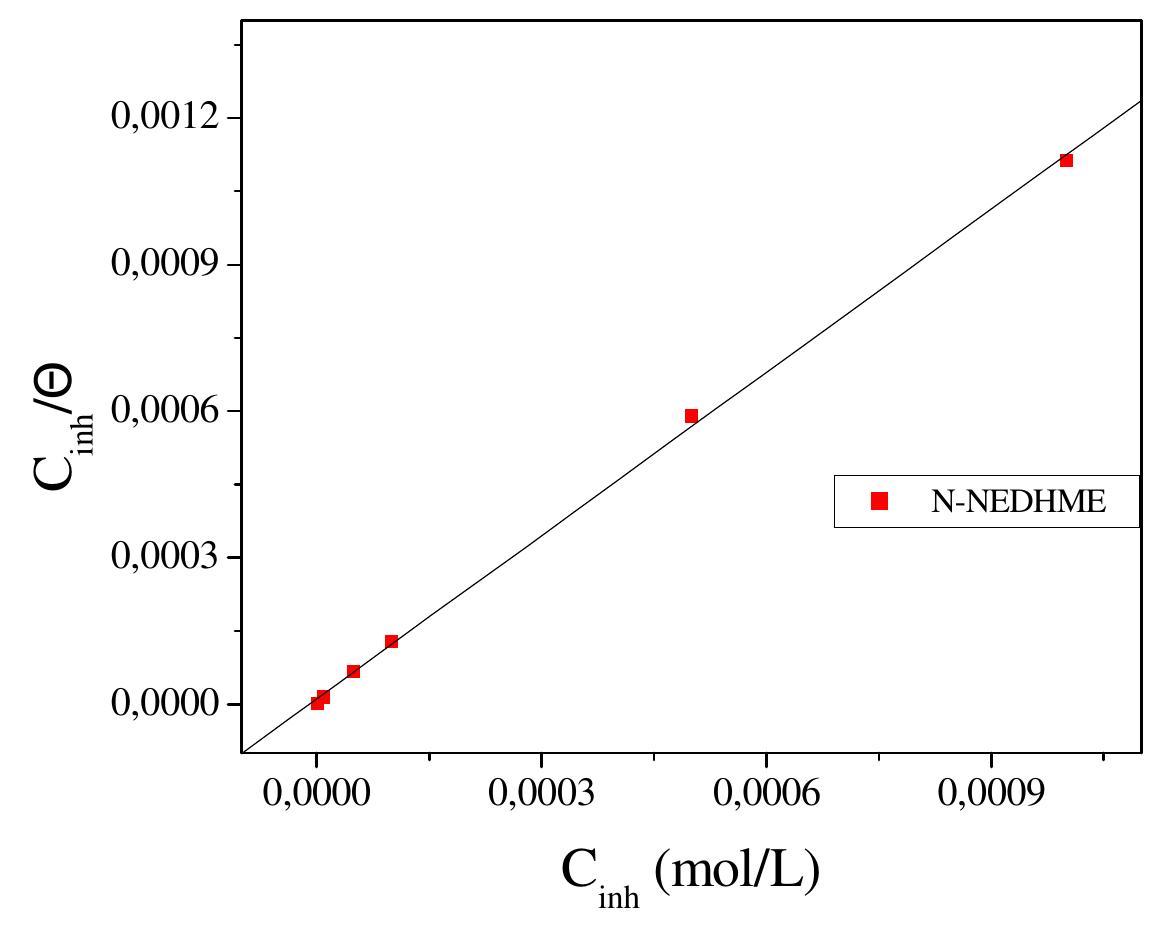
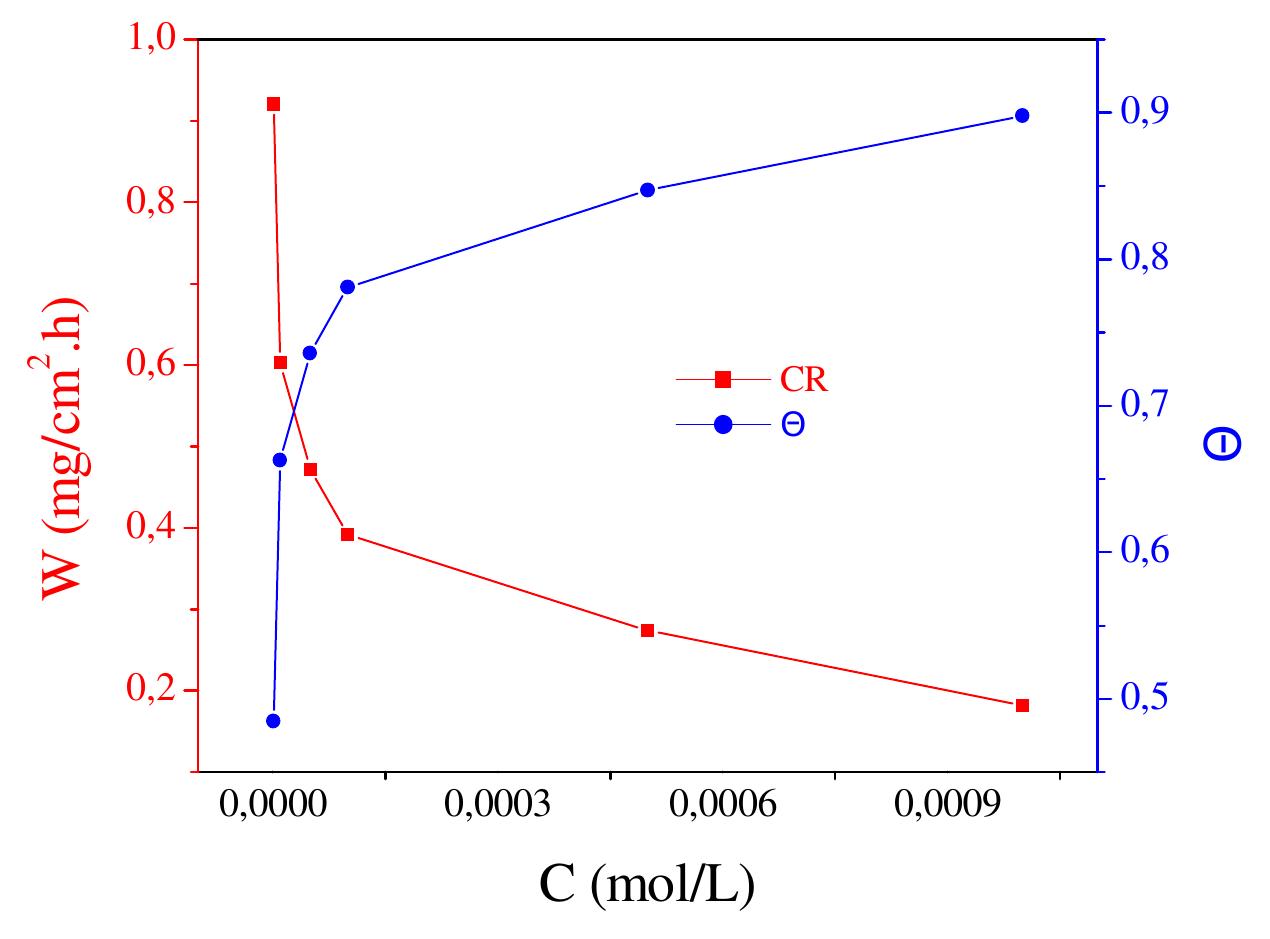
![3.3.2. Adsorption isotherm and thermodynamic parameters The adsorption on the corroding surfaces never reaches the real equilibrium and tends to reach an adsorption steady state. However, when the corrosion rate is sufficiently small, the adsorption steady state has a tendency to become a quasi-equilibrium state. In this case, it is reasonable to consider the quasi-equilibrium adsorption in thermodynamic way using the appropriate equilibrium isotherms [24]. The efficiency of this compound as a successful corrosion inhibitor mainly depends on its adsorption ability on the metal surface. So, it is essential to know the mode of adsorption and the adsorption isotherm that can give valuable information on the interaction of inhibitor and metal surface. The surface coverage values, © (O= IE/100) for different concentrations of N-NEDHME was used to explain the best adsorption isotherm. A plot of C/© versus C (Fig. 6) gives a straight line with an average correlation coefficient of 0.99959 and a slope of nearly unity (1.11) suggests that the adsorption of N-NEDHME molecules obeys Langmuir adsorption isotherm, which can be expressed by the following equation:](https://figures.academia-assets.com/108212441/figure_005.jpg)
![Fig. 11. Plot of potential energy vs. reaction coordinates for a normal process (full lines) and an activationless processes (dotted line). The activationless state is difficult to reach experi- mentally. It needs very high current densities and mea- surement times shorter than transition times. As stated by Bockris and Khan [34], UME must facilitate such observation. Kriksunov and Krishtalik [36] have dis- cussed the opposite process, i.e. the barrierless process for the hydrogen discharge from 6 M HCI solutions on a conventional Hg electrode.](https://figures.academia-assets.com/84484250/figure_011.jpg)
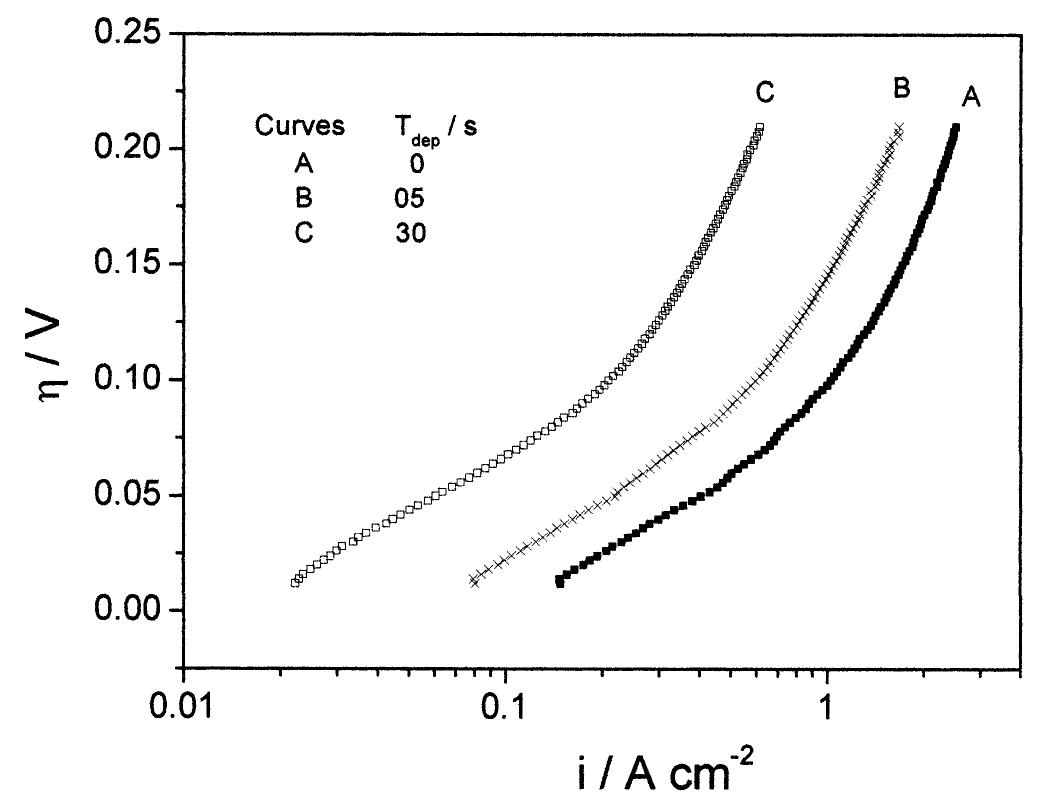
![Fig. 7. Arrhenius plot for the HER on the 25 pm Pt UME in 0.5 M H,SO, solution. The effect of the addition of 5 x 10~> M CuSO, on the Pt UME steady-state voltammogram in 0.5 M H,SO, at 6 V s~' is shown in Fig. 8. The deposition potential was chosen as 0.38 V, a value slightly more positive than the Nernst potential for the Cu/Cu** pair (0.34 V [32]). This is necessary to avoid the formation](https://figures.academia-assets.com/84484250/figure_007.jpg)
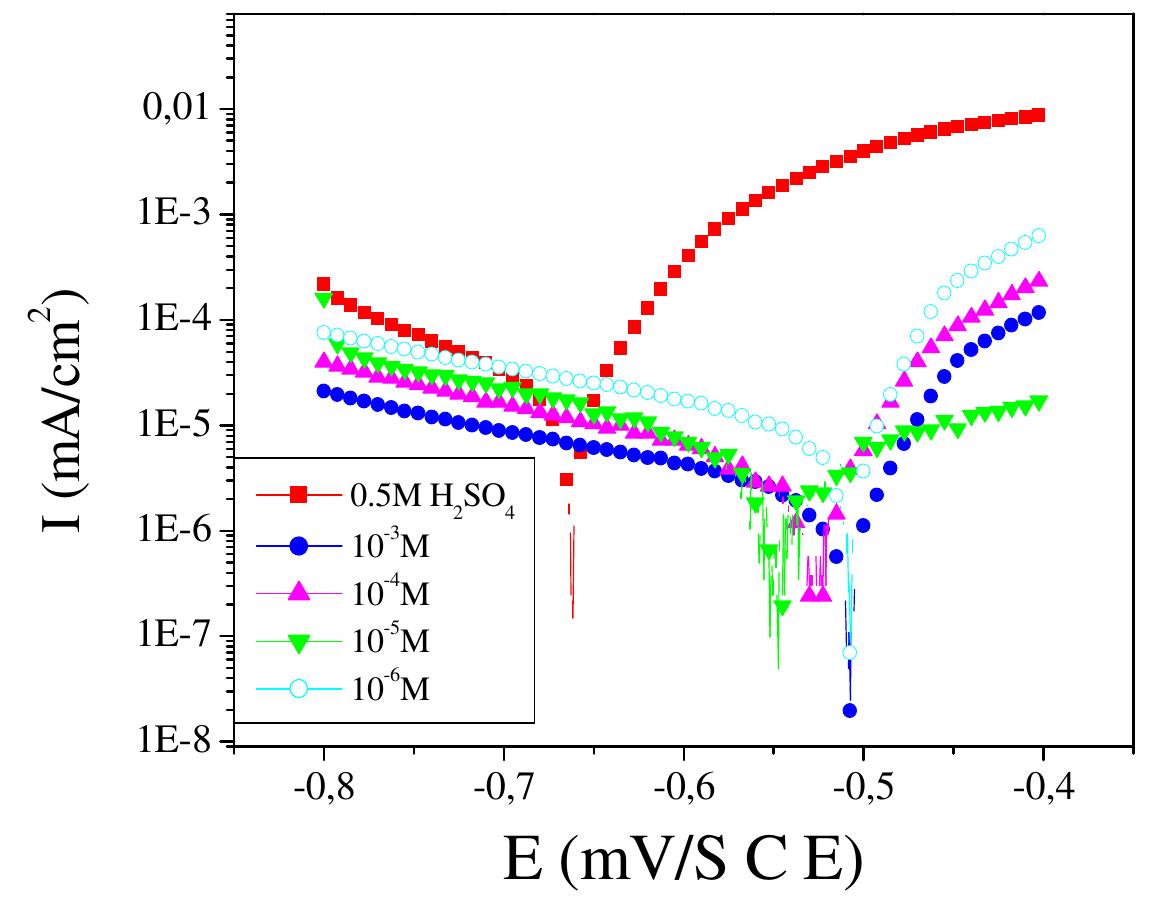
![Fig. 3. Polarization curves for the HER on the 25 pm Pt UME in 0.5 M H,SO, solution at several temperatures: (A) 25, (B) 30, (C) 35, (D) 40, (E) 45, (F) 50, (G) 55, (A) 60, (I) 65, (J) 70 and (K) 75 °C. Details of polarization measurements were discussed in the text. Current densities were corrected by the electrochemical area of the electrode and for the back-reaction contribution. Previous analyses of the HER on Pt in acid media using polarization data similar to those obtained in this work have been performed based on the following mechanism [1]:](https://figures.academia-assets.com/84484250/figure_002.jpg)
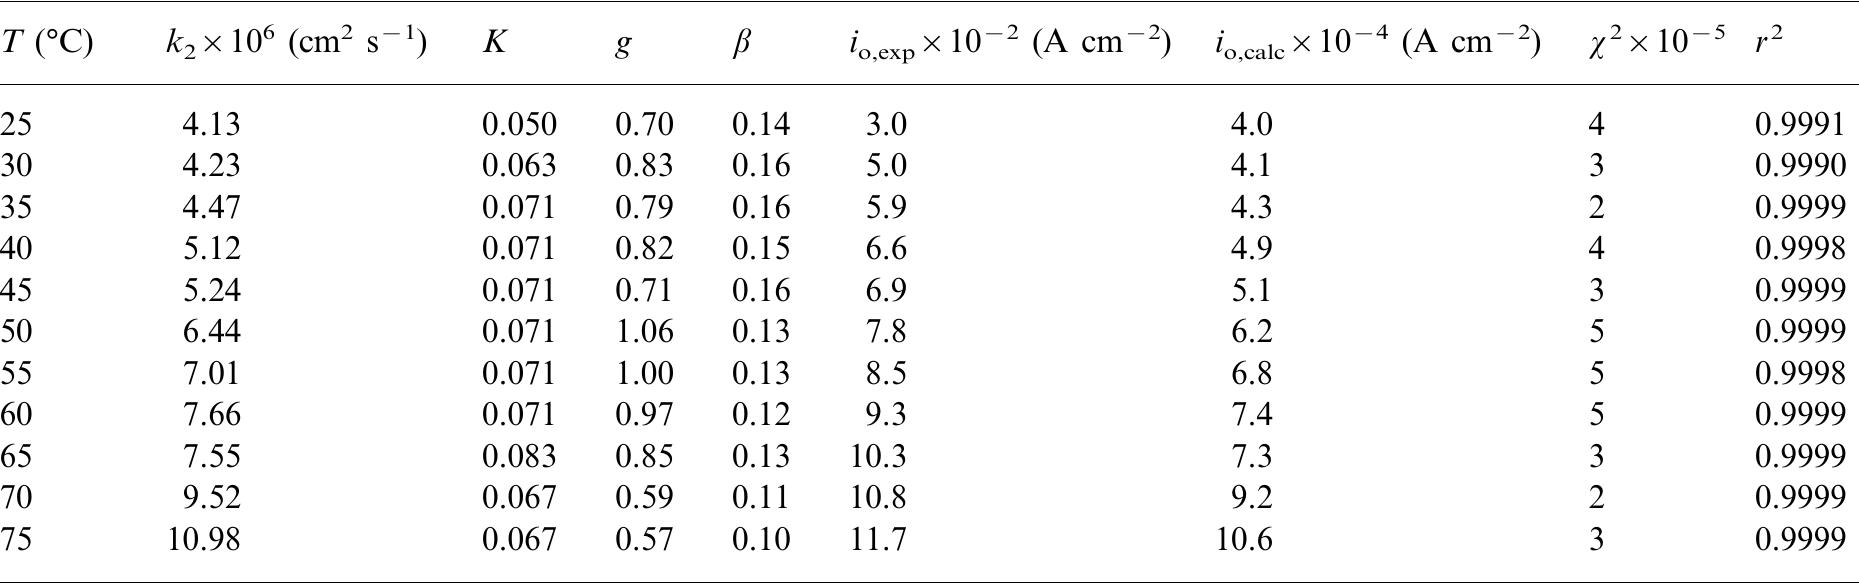
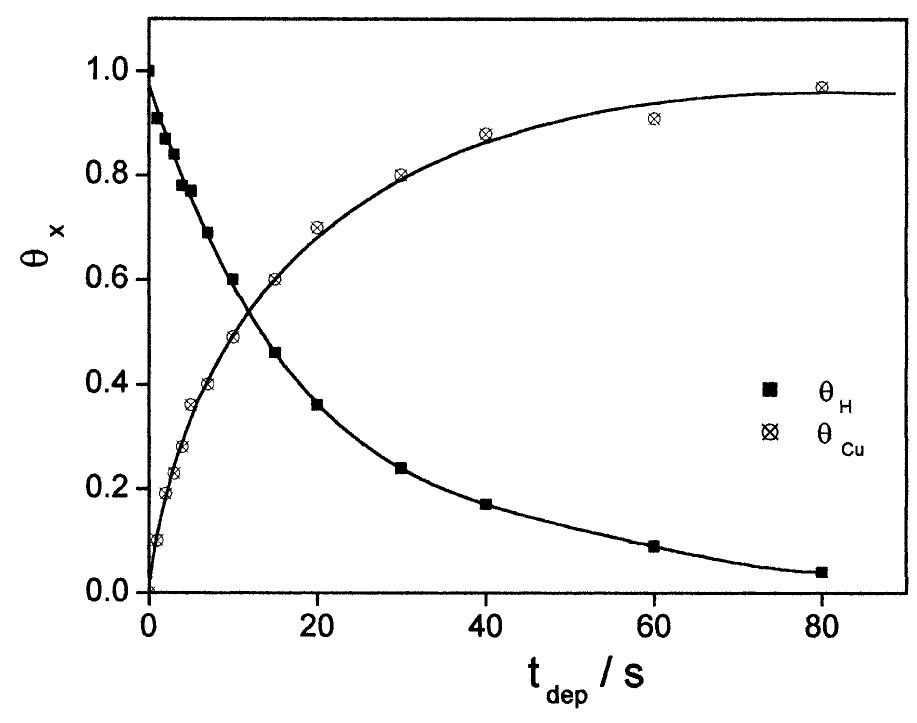
![Fig. 6. Pseudo adsorption isotherm for H on the Pt surface calculated with Eq. (12) by the non-linear fitting procedure. Curves: (A) 30, (B) 50 and (C) 70 °C. energy was calculated as 17.9 kJ mol~!. This value is very close to that obtained by Conway et al. for the HER on Pt in 1 M CF,SO3H, that is 19.7 kJ mol~! [25]. (b) The values of the equilibrium constant K, for the Volmer Reaction, are almost independent of the temperature. This fact suggests that both the forward and the backward reactions have the same dependence on T. The values were close to 0.1 that was used by Conway and Bai to simulate the polarization curves for the Volmer—Heyrovsky—Tafel mechanism [1]. (c) The g values have oscillated a little but are always near to one, pointing to a very weak lateral interaction between adsorbed intermediates. (d) The values found for the symmetry factor, #5, for the Heyrovsky Reaction were very small, when compared with the 0.5 expected. This fact deserves special attention and will be analyzed in Section 3.4. (e) The exchange current values obtained](https://figures.academia-assets.com/84484250/figure_006.jpg)
![Fig. 1. Steady-state cyclic voltammogram for the 25 um Pt UME in 0.5 M H,SO, solution at v = 0.20 V s~!. The shaded area corresponds to the desorption charge of one monolayer of H (2.4 nC) and was used to evaluate the electrochemical area of the electrode (1.1 x 1075 cm~?). The levels of purity of the electrolyte and the clean- ness of the electrode surface were tested by cyclic voltammetry. Presented in Fig. 1 is one typical voltam- mogram of the 25 pm Pt UME in 0.5 M H,SO, solution at room temperature and a scan rate of 0.2 V s—1. The usual shape of this voltammogram, presenting well-defined peaks for hydrogen adsorption—desorption and oxide formation—reduction is evidence of the elec- trolyte purity and the adequate state of the surface. Adsorption of impurities should promote inhibition of those voltammetric peaks [7]. Another problem occur- ring in home-made UME is the infiltration of elec- trolyte between the microwire and the insulating layer, by capillarity, which promotes the inclination of voltammograms around the x-axis, an effect that is absent in Fig. 1.](https://figures.academia-assets.com/84484250/figure_001.jpg)
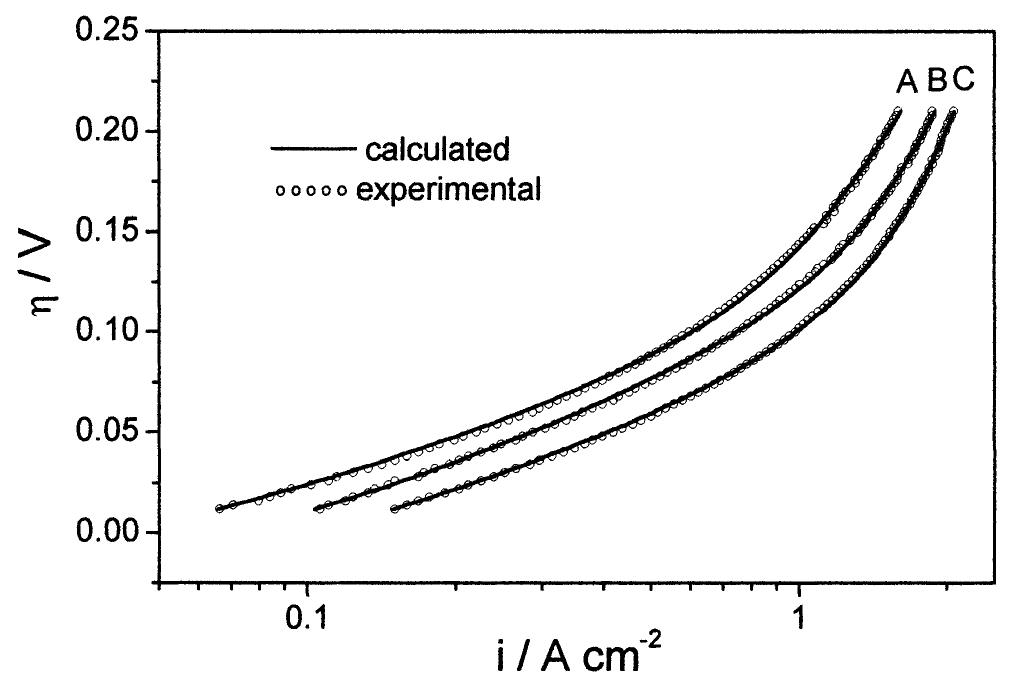
![Fig. 4. Non-linear fitting of the experimental data (Curve (A) in Fig. 3) at 25 °C with the points calculated using Conway’s equatior (Eq. (10) in the text) [1]. A non-linear fitting method [19] was used here to calculate the current densities values with Eq. (10) and to compare with experimental data. The adjustment procedure between calculated and experimental curves allow us to obtain the values for the rate constant of the determining step. However, to assume that the kinetic equation used describes precisely the experi- ment, the calculated current densities values have to agree very well with the data points. The polarization results obtained at 25 °C are shown in Fig. 4. It can be seen that the fitting is very poor, mainly in the shape of the calculated curve. where f= F/RT and C,,, is the concentration of H* ions. In Eqs. (6)—(8) V,. refers to the reaction rates of Egs. (1)—(3), &; to the rate constants for the step noted in the subscript, 7 to overpotentials and /, and f, to the symmetry factors for the forward step of Reactions (1) and (2), respectively. The parameter g in Eqs. (6)—(8) measures, in RT units, the change of free energy](https://figures.academia-assets.com/84484250/figure_004.jpg)